Next Article in Journal
Variance in Woody Debris Components Is Largely Determined by the Belowground Microbial Phylum-Level Composition
Next Article in Special Issue
Effects of Different Forest Gap Ages on Soil Physical Properties and Stoichiometric Characteristics in Cryptomeria japonica plantations (L.f.) D.Don, 1839
Previous Article in Journal
Dynamic Model for Caragana korshinskii Shrub Aboveground Biomass Based on Theoretical and Allometric Growth Equations
Previous Article in Special Issue
Structure Degradation Induced by Wetting and Drying Cycles for the Hilly Granitic Soils in Collapsing Gully Erosion Areas
 
 
Retraction published on 6 December 2023, see Forests 2023, 14(12), 2381.
Article

RETRACTED: Evaluation of Soil Pollution by Potential Toxic Elements in Cultivated Land in the Poyang Lake Region Based on an Improved Matter–Element Extension Model

1
College of Land Resources and Environment, Jiangxi Agricultural University, Nanchang 330045, China
2
Jiangxi Provincial Key Laboratory of Poyang Lake Basin Agricultural Resources and Ecology, Nanchang 330045, China
*
Author to whom correspondence should be addressed.
Forests 2022, 13(9), 1445; https://doi.org/10.3390/f13091445
Submission received: 31 July 2022 / Revised: 31 August 2022 / Accepted: 2 September 2022 / Published: 9 September 2022 / Retracted: 6 December 2023

Abstract

:
This study examined the pollution status of potential toxic elements (PTEs) in cultivated soils throughout the Poyang Lake region, Jiangxi Province, China. A total of 251 topsoil samples were collected from the 0–20 cm depth to determine the concentrations of seven PTEs (Hg, As, Pb, Cd, Cu, Cr, and Zn). Based on the concentrations of PTEs, we constructed an improved matter–element extension model to evaluate the level of soil pollution by PTEs. We also applied Hakanson’s toxic response factor to correct the weights of PTEs determined by a conventional weighting method. The mean concentrations of all seven PTEs in the soil samples exceeded their local background values in Jiangxi Province. The over-standard rates of different PTEs were ranked in the order of Cr > Cu > Cd > Hg > Zn > Pb > As (36.2–87.9%). These potentially harmful pollutants mainly came from the surrounding industrial and agricultural areas, and could enter cultivated soils through different pathways. Samples from Duchang County, Hukou County, and Gongqingcheng City were in a clean state, whereas samples from other areas was in a still clean state or at the warning limit. The evaluation results were consistent with those obtained using several conventional methods. The improved matter–element extension model can therefore be applied for the evaluation of soil pollution by PTEs and yield reliable results in cultivated land.

1. Introduction

Soil environmental quality of cultivated land directly influences the yield of crops and the quality and safety of agricultural products [1,2]. Potential toxic elements (PTEs) resulting from human activities in industrial (e.g., mining and smelting) and agricultural (e.g., fertilizer and pesticide application) production are potentially harmful pollutants commonly found in the soil environment [3,4]. They can enter cultivated soils through irrigation waters, sludges, wastes, chemical fertilizers, pesticides, and atmospheric deposits. Subsequent accumulation and migration of PTEs could affect soil physicochemical properties, reduce soil biological activity, and hinder the growth and development of plants. More importantly, PTEs in soil can threaten human health directly or indirectly through various pathways [5]. In particular, PTEs can persist in the soil for a long time and cause irreversible damage to human health. The potential risk of PTEs in cultivated soils is growing, which has become one of the primary threats to ecological safety of the environment [6,7]. Therefore, evaluating the pollution of cultivated soils by PTEs is crucial for the sustainable management of environmental pollution, risk aversion of crop cultivation, and maintenance of human health [8,9].
Many studies have been conducted to evaluate soil pollution by PTEs using different methods. The commonly used evaluation methods are based on the geoaccumulation index [10,11], the Nemerow index [12], the enrichment index [13], the pollution load index [14], the potential ecological risk index [15,16], and the fuzzy mathematics method [17,18]. These methods have some limitations due to their different focuses. For example, the pollution level of PTEs in soil is a fuzzy concept. By introducing membership degree and factor weight, the fuzzy mathematics method quantifies the fuzziness of pollutants with the membership function, which can effectively solve the uncertainty problem associated with the boundary of PTEs pollution levels; however, the determination of index weight is relatively subjective in this method [18]. The Nemerow index takes into account the mean and maximum concentrations of different pollutants to estimate their relative contribution to the soil environmental quality; this method eliminates the subjectivity, but it emphasizes the influence of major pollutants [19]. Given the uncertainty and fuzziness of soil pollution by PTEs, the evaluation results obtained by the different methods are often inconsistent [20,21].
Matter–element analysis is a method to solve the problem associated with the incompatibility of the evaluation objects [22]. This method can eliminate human intervention, reduce data loss, and objectively reflect the overall situation of the object to be evaluated. It has been widely used in the evaluation of ecological environment security [23,24,25,26], water and air pollution [27,28,29,30], and product quality [19,31]. Previous studies have shown that the matter–element extension model can address the uncertainty and fuzziness problems in the evaluation. Compared with other methods, this model can reveal more differentiated information and improve the objectivity of the evaluation results [32,33]. However, there are still some limitations. For example, when the data of the evaluation index are beyond the scope of the joint domain, the correlation function cannot be computed [19,34]. Therefore, many researchers have improved the matter–element extension model for wider application [32,33,35], yet it has rarely been applied to evaluate soil pollution by PTEs [36].
The study was conducted in the Poyang Lake region, which is an important ecological conservation area in Jiangxi Province, China. Considering the fuzziness and uncertainty of soil pollution by PTEs, we constructed an improved matter–element extension model to evaluate the pollution status of PTEs in cultivated soils throughout the study region. Based on a conventional weighting method, we introduced the toxic response factor to correct the weights of PTEs. The evaluation results based on the improved model were compared with the data obtained using different conventional methods for verification. Our specific objectives were to (1) construct an improved matter–element extension model for evaluating the pollution of cultivated soils by PTEs; and (2) evaluate pollution status of PTEs in cultivated soils throughout the Poyang Lake region.

2. Materials and Methods

2.1. Study Region

Poyang Lake is located south of the middle and lower reaches of the Yangtze River in China. Here, the scope of the Poyang Lake region is defined as 12 counties (cities) closely surrounding Poyang Lake, which are subordinate to three prefecture-level cities (Jiujiang, Nanchang, and Shangrao; 28°16′–29°86′ N, 115°38′–117°10′ E). This region covers a total area of 19,913 km2, accounting for 11.93% of the land area of Jiangxi Province. It experiences a subtropical humid monsoon climate, with sufficient sunshine, abundant rainfall, and fertile land. The Poyang Lake region is the primary grain production base of Jiangxi Province, with 6.32 × 10³ km2 of cultivated land area accounting for 20.44% of the total cultivated land area of the province (Figure 1a). There are many non-ferrous metal industries around the study region (Figure 1b). The PTEs from mining and smelting activities can enter the soil and water through different pathways, resulting in potential harm to the quality of the ecological environment on the regional scale [37]. The stability of the ecological environment in the Poyang Lake region is of strategic significance for the maintenance ecological security in the Yangtze River Basin and even the whole country. Therefore, it is urgent to evaluate the pollution status of PTEs in this region.

2.2. Sample Collection and Analysis

From October to November in 2019 and 2020, we collected topsoil samples (0–20 cm) from cultivated land throughout the study region based on the county-level land use map of Jiangxi Province for 2018 and the soil map of the Second National Soil Survey in China. The sampling procedure was in accordance with the Technical Specifications for Monitoring Soil Environmental Quality of Farmland [38]. In each sampling plot, five random samples (1000 g each) were collected in an S-shaped pattern from valleys and mountainous areas characterized by considerable area variation, large terrain relief, and uneven soil distribution. In addition, samples (1000 g each) were taken in a plum blossom-shaped pattern from plots characterized by small area and flat terrain. After sampling, a hand-held global positioning system was applied to locate the center of the sampling plot. The sampling date, sampling location, sample number, and soil type were recorded, and a total of 251 soil samples were collected (Figure 1c).
The soil samples were air-dried, and plant debris was removed manually in the laboratory. Dry soil samples were ground using wooden tools and a porcelain bowl, and sieved before analysis. According to the U.S. Environmental Protection Agency’s Method 3051A [39] and pre-test, 0.1 g of each soil sample was weighed into a screw-cap polytetrafluoroethylene digestion vessel, and 9 mL of concentrated nitric acid (HNO3) along with 3 mL of hydrochloric acid (HCl) was added. The mixture was shaken and kept at room temperature for 0.5 h. A microwave digestion instrument was used for digestion at 175 °C. All the reagents used were of high-grade purity, and ultra-pure water was used in all experiments.
The concentrations of seven PTEs in soil samples were analyzed following the Technical Specifications for Soil Environmental Monitoring [40]. Specifically, the Hg and As concentrations were analyzed by hydride generation atomic absorption spectrometry. The Cd concentration was analyzed by graphite furnace atomic absorption spectrometry. The Cr and Pb concentrations were analyzed by inductively-coupled plasma atomic emission spectrometry. The Cu and Zn concentrations were analyzed by atomic absorption spectrometry. Three parallel tests were carried out for each batch of samples, and the mean was taken as the final concentration of each PTE in the samples. During the analysis, the national standard reference soil samples of China (GSS-8) were added for quality control, and the recovery rates of different PTEs ranged from 93% to 105%.

2.3. Improved Matter–Element Extension Model

The matter–element extension model is based on the theory of Extenics. First, the matter–element extension is used for qualitative calculation, and the correlation function of extension set theory is used for quantitative calculation. Then, through the establishment of the matter–element model, each evaluation index is transformed into a compatible problem. Finally, the conclusion is obtained, which is consistent with the actual situation [35,36,41]. Given the uncertainty of soil pollution by PTEs, the concentration of a particular PTE in soil is likely to exceed the joint domain. To overcome this limitation, we modified the original matter–element extension model by normalizing the classical domain and the matter–element to be evaluated, and replacing the maximum degree of membership with the degree of closeness. The improved model involves the following four steps [19,21,34,35,36].
(1) Determination of the classical domain, the joint domain, and the matter–element to be evaluated
For soil pollution by PTEs, the matter–element R is composed of the evaluation grade N, the eigenvector c, and the eigenvalue v, denoted as R = (N, c, v). If N has multiple eigenvectors c1, c2, … cn and eigenvalues v1, v2, …, vn, R is expressed as follows:
R = [ N c 1 v 1 c 2 v 2 c n v n ] = [ R 1 R 2 R n ]
R j = ( N j , c i , v nj ) = [ N j c 1 v 1 j c 2 v 2 j c n v n j ] = [ N j c 1 ( a 1 j , b 1 j ) c 2 ( a 2 j , b 2 j ) c n ( a n j , b n j ) ]
where Rj is the classical domain; Nj is the j-th evaluation grade; ci is the i-th evaluation index, namely the concentration of element i; vnj is the measured value of cn corresponding to the evaluation grade j; and (anj, bnj) is the range of vnj.
R p = ( N p , C i , v p i ) = [ N p c 1 v p 1 c 2 v p 2 c n v p n ] = [ N p c 1 ( a p 1 , b p 1 ) c 2 ( a p 2 , b p 2 ) c n ( a p n , b p n ) ]
where Rp is the joint domain; p is the overall evaluation grade; vpn is the measured value of cn corresponding to the overall evaluation grade p; and (apn, bpn) is the range of vpn.
R 0 = [ N 0 c 1 v 1 c 2 v 2 c n v n ]
where R0 is the matter–element to be evaluated; N0 is the evaluation grade of R0; and v1, v2, …, vn are respectively the measured values of c1, c2, …, cn.
(2) Normalization of the classical domain and matter–element to be evaluated
Normalizing the classical domain Rj gives:
R j = ( N j , c i , v i j ) = [ N j c 1 ( a 1 j b p 1 , b 1 j b p 1 ) c 2 ( a 2 j b p 2 , b 2 j b p 2 ) c n ( a n j b p n , b n j b p n ) ]
where Rj is the normalized classical domain and vij is the normalized value of ci.
Normalizing the matter–element to be evaluated R0 gives:
R 0 = [ N 0 c 1 v 1 / b p 1 c 2 v 2 / b p 2 c n v n / b p n ]
where R0 is the normalized matter–element to be evaluated.
(3) Establishment of the closeness function and calculation of the closeness degree
When evaluating an object, it is sometimes difficult to characterize the fuzziness of the object’s boundary following the principle of maximum degree of membership; this may cause information loss, leading to the deviation of the evaluation results [34]. In order to obtain accurate evaluation results, we introduced the asymmetric degree of closeness to replace the maximum degree of membership. The calculation of the asymmetric degree of closeness is as follows [42]:
P = 1 1 n ( n + 1 ) i = 1 n D w i
where P is the degree of closeness; D is the distance between the evaluation object and the classical domain; and wi is the weight of the i-th evaluation index.
Applying Equation (7) to the matter–element extension model gives [42]:
P j ( N 0 ) = 1 1 n ( n + 1 ) i = 1 n D j ( v i ) w i ( x )
where Pj(N0) is the degree of closeness of the matter–element to be evaluated R0 relative to the evaluation grade j; D j ( v i ) = | v i ( a i j + b i j ) 2 | ( b i j a i j ) 2 is the distance between the normalized matter–element R0 and the normalized classical domain vij; wi(x) is the weight of the i-th evaluation index; and n is the number of evaluation indices.
(4) Grade evaluation
Based on Pj(N0) = max{Pj(N0)}, the pollution level of PTEs in soil is determined to be grade j′.

2.4. Weight Determination Methods

(1) Weight calculation
The conventional weighting method based on the over-standard multiples of pollutant concentrations is commonly used in environmental quality evaluation. This method highlights the role of the major pollutants and takes into account the differences in the standard values of various pollutants [20,21,43]. The weights of PTEs are calculated as follows:
W k i = ( X k i / s i ¯ ) / i = 1 n ( X k i / s i ¯ )
where Wki is the weight of element i in sample k; Xki is the measured concentration of element i in sample k; s i ¯ is the arithmetic mean of the standard values for all the evaluation grades of element i; and n is the total number of evaluation indices.
(2) Weight correction
The PTEs in soil could pose different levels of threat to crops and humans. Without considering the toxicity of specific elements, the harm of some PTEs with low concentration and high toxicity may be overlooked. This may lead to an overestimation or underestimation of the pollution level of PTEs. Therefore, we introduced the toxic response factor proposed by Hakanson to correct the weights of PTEs obtained by the conventional weighting method [15]. The corrected weights are obtained as follows [15,16]:
W k i = ( W k i T r i ) / i = 1 n ( W k i T r i )
where Wki is the corrected weight of element i in sample k; Wki is the conventional weight of element i in sample k; and Tri is the toxic response factor of element i.

2.5. Evaluation Standards for Soil Pollution by PTEs

For the evaluation of soil pollution by PTEs, existing studies have commonly used the local background values of soil environment and/or the Grade II criteria of Environmental Quality Standard for Soils in China [44]. However, the national standard was issued in 1995, which cannot meet the current needs of soil environmental protection and quality management. In 2018, the Ministry of Ecology and Environment revised the national standard of 1995 and formulated the Soil Environmental Quality: Risk Control Standard for Soil Contamination of Agricultural Land [45]. Compared with its original version, the revised standard is improved for the determination of pollutant types and standard limits [36]. Here, we established the evaluation standards for the pollution of cultivated soils by PTEs (Table 1) based on previous studies [18,42] combined with the background values in Jiangxi Province [46] and the national standards of 1995 and 2018.

2.6. Conventional Evaluation Methods

To verify the applicability of the improved matter–element extension model, we compared its evaluation results with the data obtained using four conventional methods. The procedures of the conventional methods are as follows: (1) Original matter–element extension model: determine the classical domain, the joint domain, and the matter–element to be evaluated, calculate the comprehensive correlation degree of multiple indices, and evaluate the pollution level of PTEs in soil [21]. (2) Weighted comprehensive index: determine the evaluation standards of different indices, calculate the comprehensive score of pollution degree by weighting, and evaluate the pollution level of PTEs in soil [47]. (3) Fuzzy mathematics: describe the gradual change and fuzziness of soil pollution by PTEs using the membership degree, and evaluate the pollution level of PTEs in soil following the principle of maximum degree of membership [17,18]. (4) Nemerow index: calculate the single factor pollution index, obtain the comprehensive pollution index based on the average and maximum values of the single factor pollution index, and evaluate the pollution level of PTEs in soil [12]. The same evaluation standards and corrected weights of PTEs were used in the comparison of the various methods, except that the national standard values of Grade II were used for the Nemerow index. The number of soil samples with different pollution levels was counted based on each method. In addition, samples producing inconsistent results based on the different methods were selected for re-evaluation using the single factor pollution index [48].

2.7. Data Analysis

Descriptive statistical analysis was performed using SPSS 22.0 (SPSS Inc., Chicago, IL, USA). Data calculation was performed using Excel 2016 (Microsoft Corp., Redmond, WA, USA) and MATLAB 7.0 (MathWorks Inc., Natick, MA, USA). The sample distribution and evaluation results were visualized using ArcGIS 10.2 (ESRI Inc., Redlands, CA, USA).

3. Results

3.1. Concentrations of PTEs in Cultivated Soils

Table 2 summarizes the descriptive statistics of the concentrations of seven different PTEs in the 251 topsoil samples from cultivated land throughout the study region. The concentration ranges of Hg, As, Pb, Cd, Cu, Cr, and Zn were 0.00–0.57, 0.63–72.56, 0.74–116.85, 0.01–0.98, 6.52–421.58, 12.13–239.65, and 0.50–196.32 mg/kg, respectively. The mean concentrations of the seven PTEs were 1.57, 1.08, 1.09, 1.68, 1.66, 1.74, and 1.05 times their respective local background values, indicating different degrees of element accumulation in the soil samples. The over-standard rates of different PTEs were ranked in the order of Cr > Cu > Cd > Hg > Zn > Pb > As (36.2–87.9%). The mean concentrations of the seven PTEs did not exceed the national standard values of Grade II. The coefficients of variation of As, Cu, Hg, and Cd concentrations were higher than 80%, while the coefficients of variation of Pb, Cr, and Zn concentrations were between 40–55%.

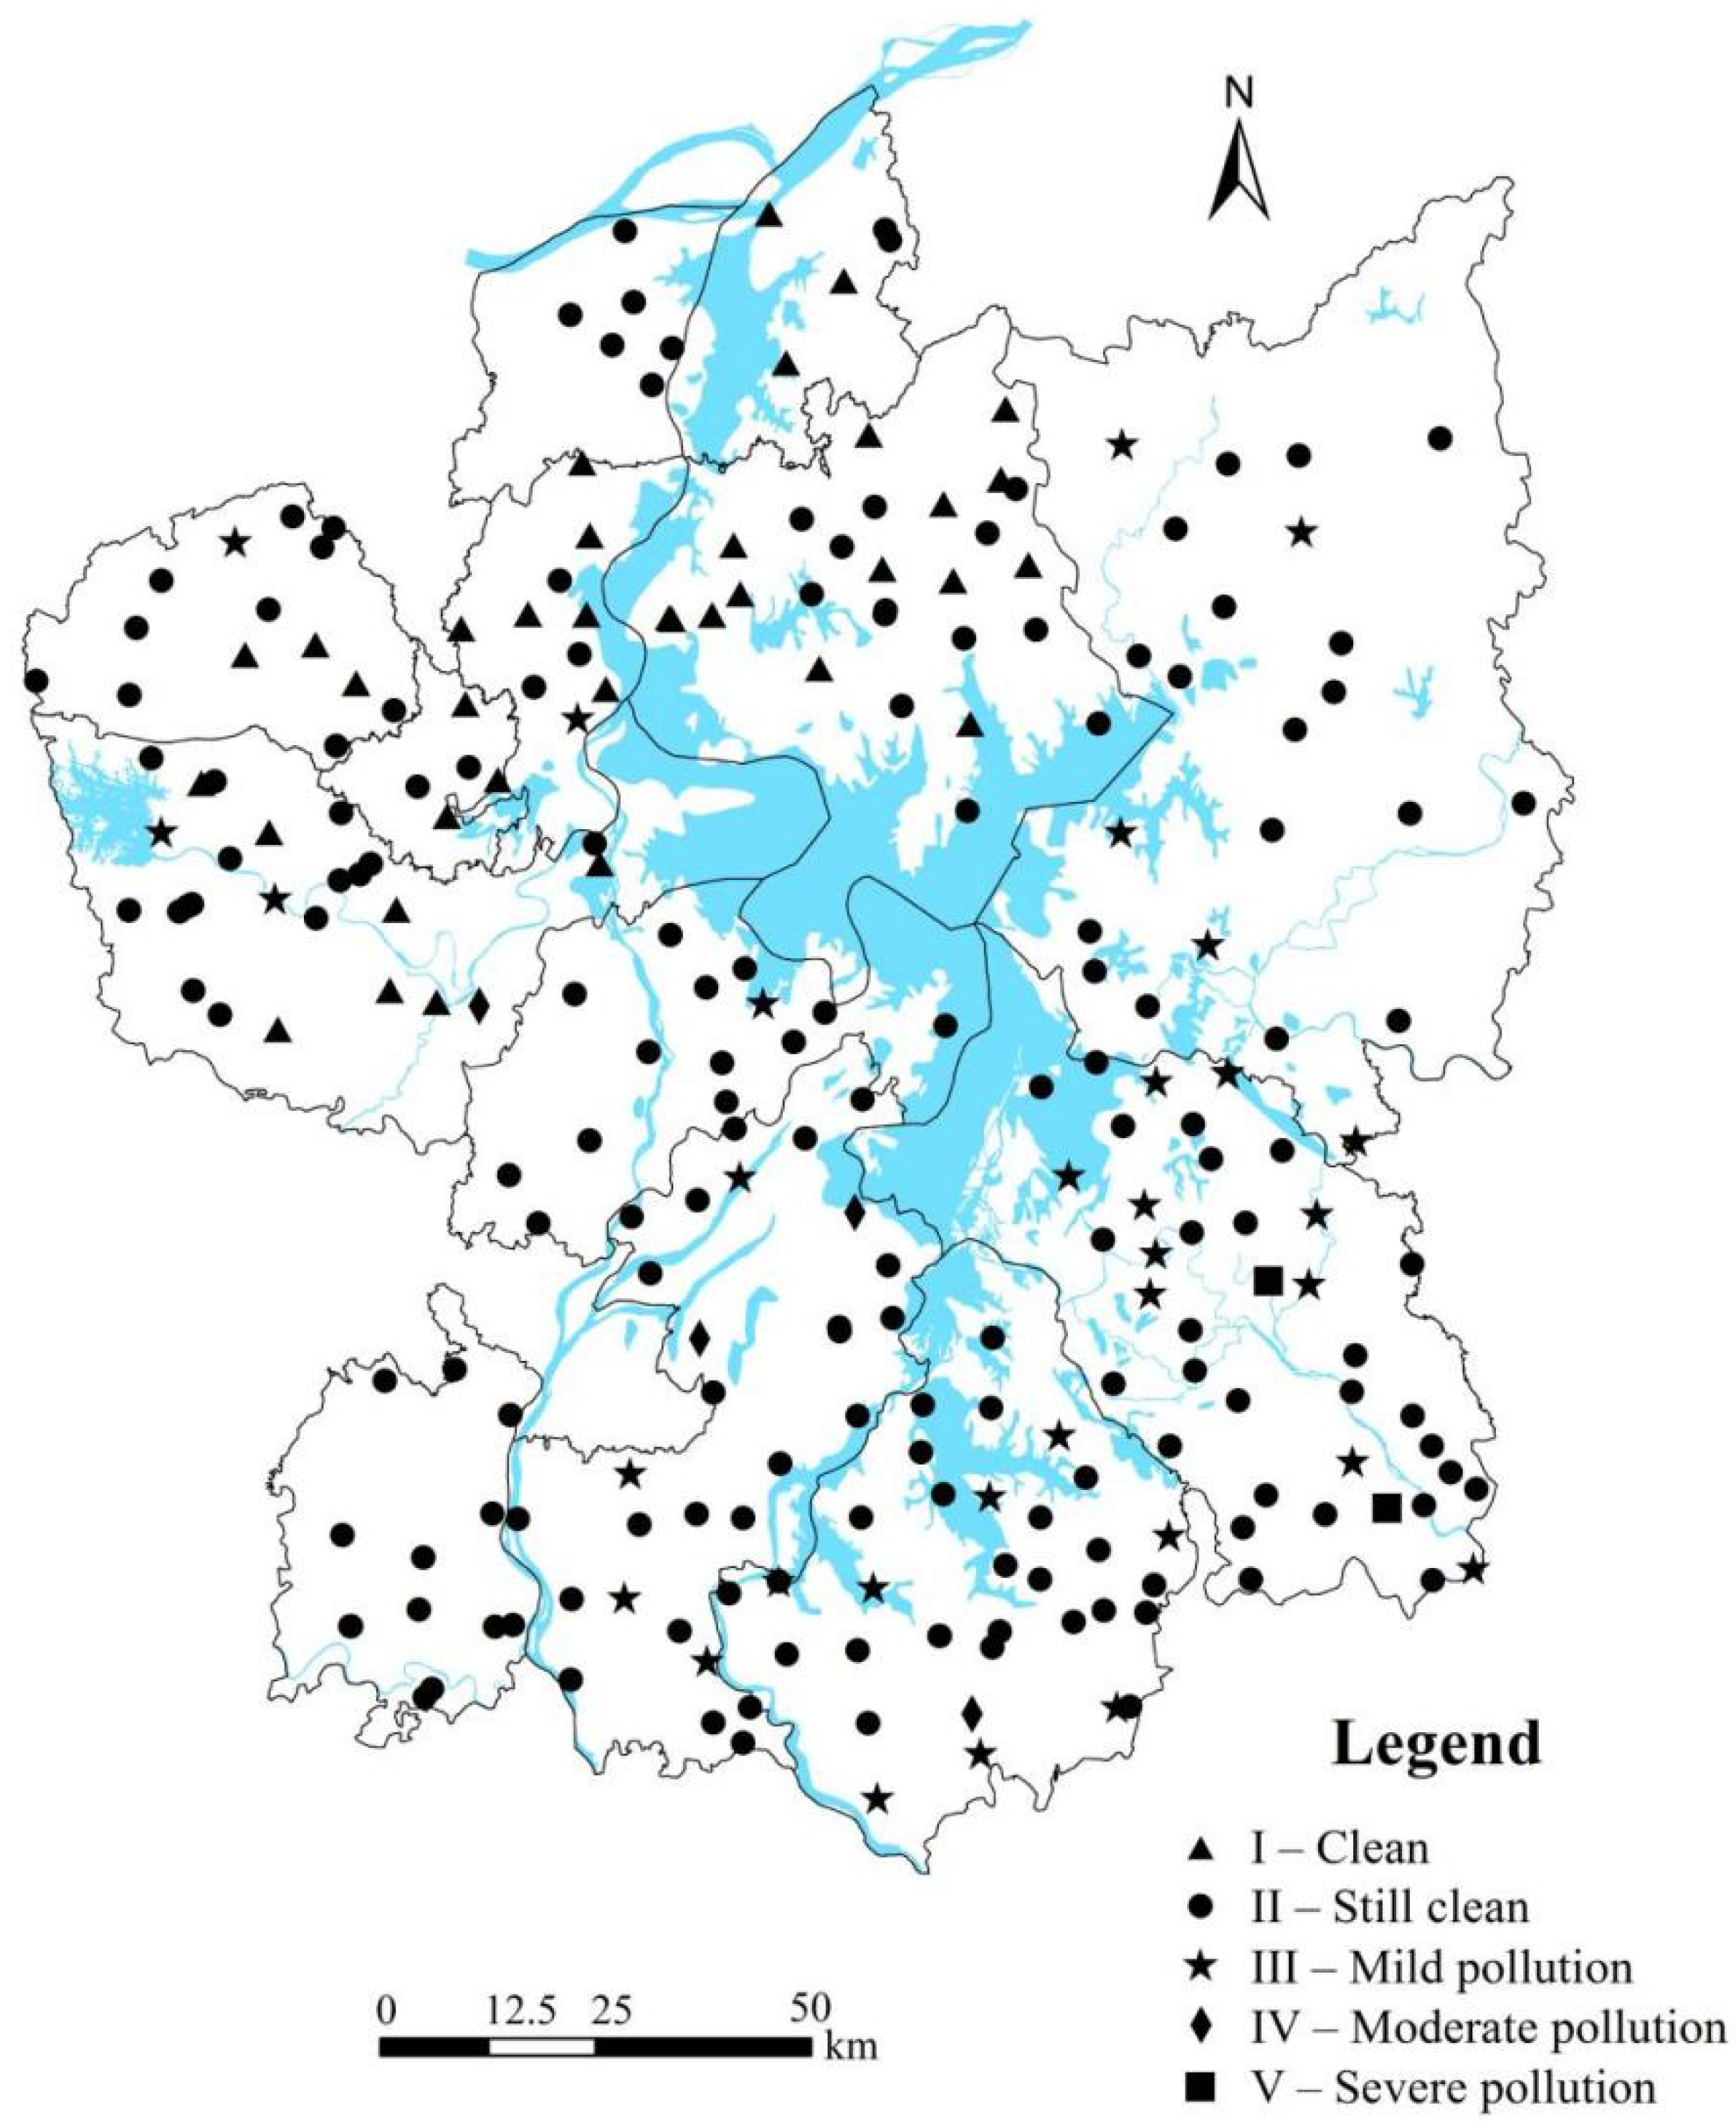
3.2. Pollution Level of PTEs in Cultivated Soils

3.2.1. Establishment of Matter–Element Matrices

According to the extensibility of soil pollution by PTEs and the established evaluation standards (Table 1), we qualitatively categorized the degree of soil pollution by PTEs in the study region into five levels: clean (I), still clean (II), mild pollution (III), moderate pollution (IV), and severe pollution (V). The classical domain matter–element matrices (RN1, RN2, RN3, RN4, and RN5) and the joint domain matter–element matrix (Rp) are as follows [49]:
R N 1 = [ N 1 c Hg ( 0 ,   0.08 ) c As ( 0 ,   10.40 ) c Pb ( 0 ,   32.10 ) c Cd ( 0 ,   0.10 ) c Cu ( 0 ,   20.80 ) c Cr ( 0 ,   48.00 ) c Zn ( 0 ,   69.00 ) ] R N 2 = [ N 2 c Hg ( 0.08 ,   0.50 ) c As ( 10.40 ,   25.00 ) c Pb ( 32.10 ,   100.00 ) c Cd ( 0.10 ,   0.40 ) c Cu ( 20.80 ,   50.00 ) c Cr ( 48.00 ,   150.00 ) c Zn ( 69.00 ,   200.00 ) ] R N 3 = [ N 3 c Hg ( 0.50 , 1.05 ) c As ( 25.0 0 , 28.00 ) c Pb ( 100.00 , 350.00 ) c Cd ( 0.40 , 0.70 ) c Cu ( 50.00 , 280.00 ) c Cr ( 150.00 , 210.00 ) c Zn ( 200.00 , 350.00 ) ] R N 4 = [ N 4 c Hg ( 1.05 ,   1.50 ) c As ( 28.00 ,   40.00 ) c Pb ( 350.00 ,   500.00 ) c Cd ( 0.70 ,   1.00 ) c Cu ( 280.00 ,   400.00 ) c Cr ( 210.00 ,   300.00 ) c Zn ( 350.00 , 500.00 ) ] R N 5 = [ N 5 c Hg ( 1.50 , 1.95 ) c As ( 40.00 , 52.00 ) c Pb ( 500.00 , 650.00 ) c Cd ( 1.00 , 1.30 ) c Cu ( 400.00 , 520.00 ) c Cr ( 300.00 , 390.00 ) c Zn ( 500.00 , 650.00 ) ] R p = [ N p C Hg ( 0 ,   1.95 ) C As ( 0 ,   52.00 ) C Pb ( 0 ,   650.00 ) C Cd ( 0 ,   1.30 ) C Cu ( 0 ,   520.00 ) C Cr ( 0 ,   390.00 ) C Zn ( 0 ,   650.00 ) ]
Based on the concentrations of PTEs measured in the soil samples, the matter–element matrix to be evaluated (R0) is established as follows:
R 0 = [ N 0 c Hg v 1 c As v 2 c Pb v 3 c Cd v 4 c Cu v 5 c Cr v 6 c Zn v 7 ]
The normalization results of the classical domain and the matter–element to be evaluated are as follows:
R 1 = [ N 1 c Hg ( 0 ,   0.041 ) c As ( 0 ,   0.200 ) c Pb ( 0 ,   0.049 ) c Cd ( 0 ,   0.077 ) c Cu ( 0 ,   0.040 ) c Cr ( 0 ,   0.123 ) c Zn ( 0 ,   0.106 ) ] R 2 = [ N 2 c Hg ( 0.041 ,   0.257 ) c As ( 0.200 ,   0.481 ) c Pb ( 0.049 ,   0.154 ) c Cd ( 0.077 ,   0.308 ) c Cu ( 0.040 ,   0.096 ) c Cr ( 0.123 ,   0.385 ) c Zn ( 0.106 ,   0.308 ) ] R 3 = [ N 3 c Hg ( 0.257 ,   0.538 ) c As ( 0.481 ,   0.538 ) c Pb ( 0.154 ,   0.538 ) c Cd ( 0.308 ,   0.538 ) c Cu ( 0.096 ,   0.538 ) c Cr ( 0.385 ,   0.538 ) c Zn ( 0.308 ,   0.538 ) ] R 4 = [ N 4 c Hg ( 0.538 ,   0.769 ) c As ( 0.538 ,   0.769 ) c Pb ( 0.538 ,   0.769 ) c Cd ( 0.538 ,   0.769 ) c Cu ( 0.538 ,   0.769 ) c Cr ( 0.538 ,   0.769 ) c Zn ( 0.538 ,   0.769 ) ] R 5 = [ N 5 c Hg ( 0.769 ,   1.000 ) c As ( 0.769 ,   1.000 ) c Pb ( 0.769 ,   1.000 ) c Cd ( 0.769 ,   1.000 ) c Cu ( 0.769 ,   1.000 ) c Cr ( 0.769 ,   1.000 ) c Zn ( 0.769 ,   1.000 ) ] R 0 = [ N 0 c 1 v 1 / b p 1 c 2 v 2 / b p 2 c n v n / b p n ]

3.2.2. Determination of the Weights of PTEs

Table 3 compares the weights of PTEs determined by the conventional over-stand multiple weighting method, and the corresponding weights corrected by the toxic response factor. The mean weights of PTEs in the study region all changed substantially after correction. The corrected weights of Hg and Cd increased by 216.35% and 151.87%, respectively; however, the corrected weights of As, Pb, Cu, Cr, and Zn decreased by 6.32–89.51% compared with their conventional weights. Figure 2 illustrates of the weights of PTEs at different sampling points before and after correction. The weights of Hg and Cd increased while the weights of the other five PTEs decreased significantly after correction compared with their respective conventional weights.

3.2.3. Calculation of Closeness Degree and Evaluation of Soil Pollution by PTEs

First, we calculated the distance Dj(vi) between the normalized matter–element R0 and the normalized classical domain vij. The results for sampling point S1 in Hukou County are listed in Table 4. Similarly, the distance between each index in the 251 matter–elements and the normalized classical domain vij was obtained. Next, we calculated degree of closeness between each matter–element and the evaluation grade (Table 5). Taking sampling point S1 as an example, the degree of closeness between S1 and different pollution levels (I to V) was 1.00060, 0.99937, 0.99616, 0.99156, and 0.98744, respectively. There is max{Pj(N0)} = 1.00060 = P1(N0), so the pollution level of point S1 was determined to be clean (level I).
In this way, the pollution level of PTEs at the 251 sampling points was evaluated, among which 36 (14.4%) samples were in a clean state, and 176 (70.1%) samples were in a still clean state. In addition, there were 33 (13.1%) samples with mild pollution, 4 (1.6%) samples with moderate pollution, and 2 (0.8%) samples with severe pollution. Overall, the soil samples from the study region were in a still clean state. The spatial distribution of the pollution levels is shown in Figure 3. The samples associated with a pollution level of grade III or higher were mainly from several counties (e.g., Poyang, Jinxian, Yugan, Nanchang) in the southern part of the study region. In contrast, there was less accumulation and milder pollution of PTEs in cultivated soils from the northern part of the study region.
To determine the degree of soil pollution by PTEs in specific areas of the Poyang Lake region, we loaded the measured data of soil samples from each county (or city) into the improved matter–element extension model for calculation. Table 6 lists the percentages of the samples with different pollution levels across different areas of the study region and the overall pollution level of each area. Based on the improved model, the soil samples collected from Duchang County, Hukou County, and Gongqingcheng City were in a clean state, while the soil samples from other areas were in a still clean state or at the warning limit. The study region was generally in a still clean state.

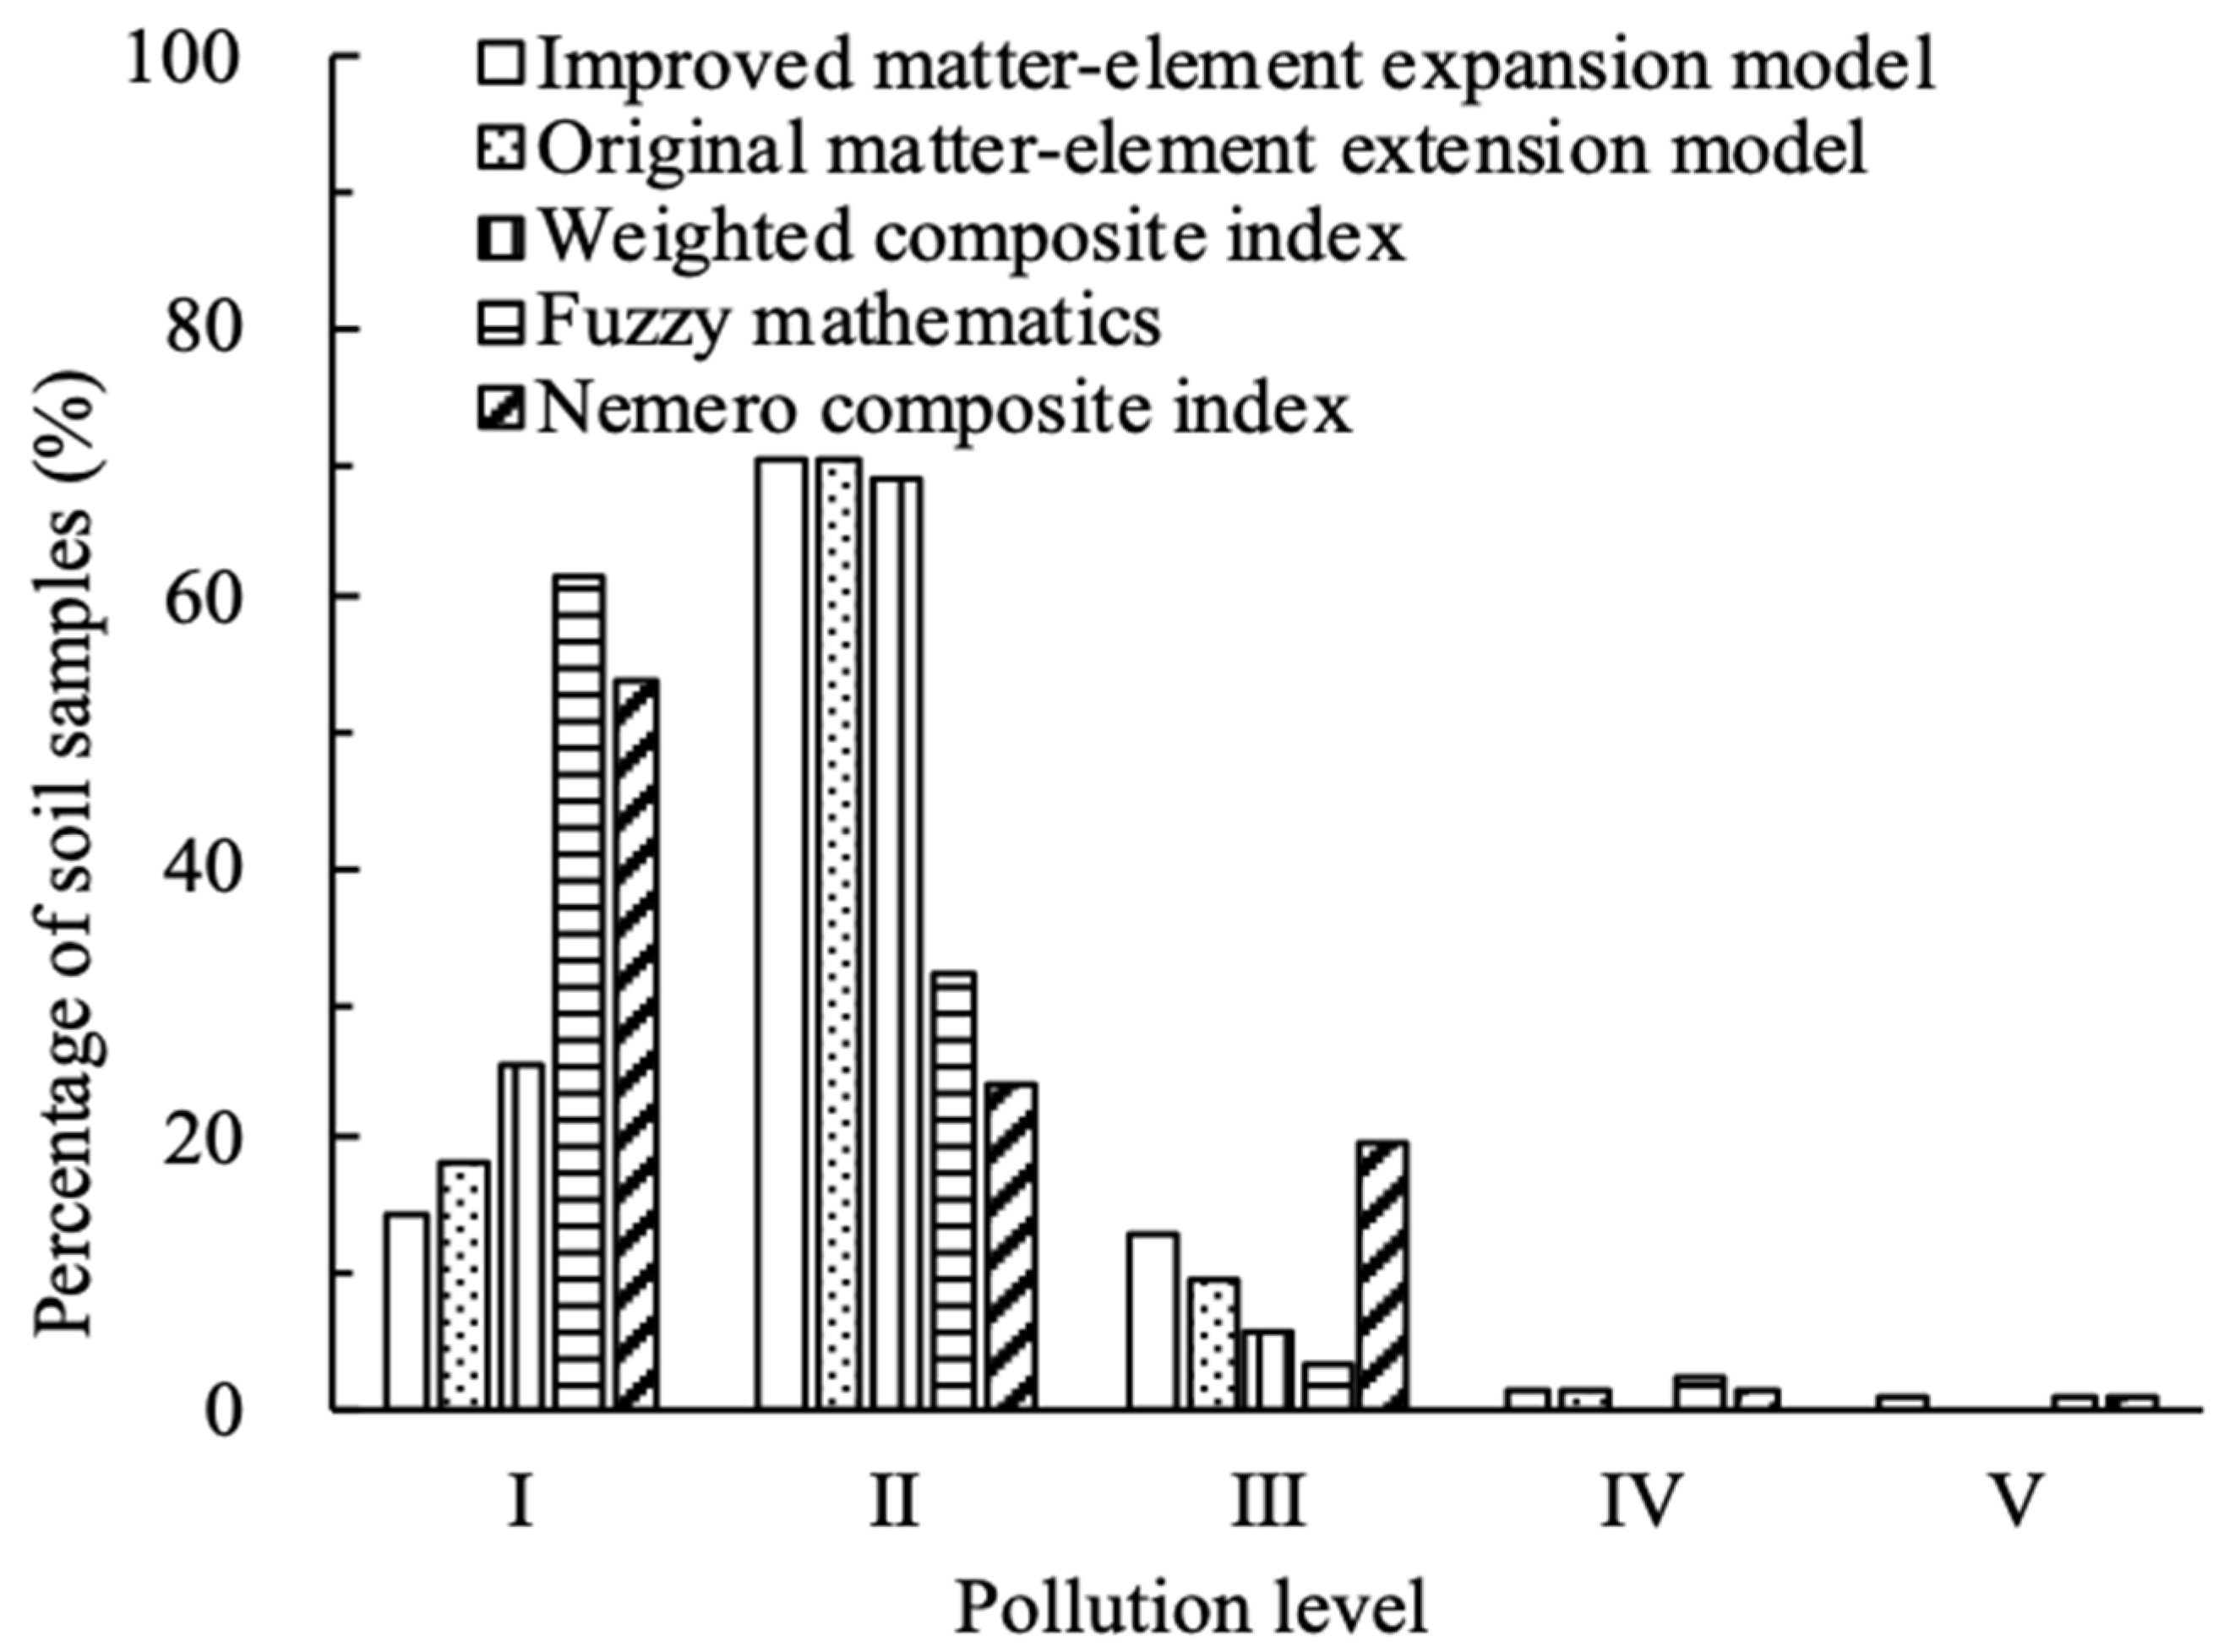
3.3. Method Validation

Table 7 lists the number of soil samples with various pollution levels based on five different methods. Generally, the evaluation results obtained using the improved matter–element extension model, the original matter–element extension model, and the weighted comprehensive index were consistent, with 180 (71.4%) samples producing the same results. However, the results obtained using the fuzzy mathematics method and the Nemerow index were evidently different from those obtained using the other three methods, and the differences were mainly found in the number of samples in a clean or still clean state (levels I and II; Figure 4).
To verify the accuracy of the improved model, we re-evaluated the degree of soil pollution by PTEs in 103 topsoil samples using the single factor pollution index (Table 8), with the local background values of soil environment as the standards. The pollution level of the selected samples was determined to be still clean (level II) based on the improved model, while different results were obtained from fuzzy mathematics and the Nemerow index. The re-evaluation results showed that it was more reasonable to consider the pollution level of the selected samples to be in a still clean state. Thus, the improved matter-element analysis method was more accurate than the fuzzy mathematics and the Nemerow index in the evaluation of soil pollution by PTEs.

4. Discussion

4.1. Pollution Status of PTEs in Cultivated Soils in the Poyang Lake Region

In this study, the concentrations of soil PTEs indicated that seven PTEs were accumulated to different degrees in cultivated land in the Poyang Lake region. The accumulation of Cr, Cu, and Cd was greater than that of Hg, Zn, Pb, and As. According to the coefficient of variation for the concentrations of PTEs, the occurrence of As, Cu, Hg, and Cd in the cultivated soils was mainly affected by local pollution sources, which might be closely related to mining activities in the study region. The occurrence of Pb, Cr, and Zn was mainly affected by a combination of soil structure and human activities. Our results are basically consistent with previous finding of soil pollution by PTEs in industrial and agricultural regions of different provinces in China [49,50,51,52,53,54,55].
To improve the evaluation accuracy, we introduced the toxic response factor to correct the weights of PTEs. The corrected weights indicate not only the differences in element accumulation but also the level of element toxicity. Compared with the conventional weights, the corrected weights are more in line with the actual situation of soil pollution by PTEs. The evaluation results based on the improved matter–element extension model showed that there was more serious pollution of cultivated soils by PTEs in the southeastern part of the study region than the northwestern part. Serious pollution by PTEs may be mainly attributed to sand excavation along the Le’an River and nonferrous metal mining and smelting around the Poyang Lake region.
For sand excavation along the river, the government should implement unified planning, establish a scientific and reasonable sand excavation and management regime, and strictly deal with illegal activities. In addition, it is necessary to strengthen regional soil environmental supervision for nonferrous metal smelting-related enterprises and mineral resource development zones. We should strengthen the protection of unpolluted soil in cultivated land and strictly control it to prevent new pollution incidents. For the polluted soil in cultivated land, we should develop eco-friendly remediation techniques to solve the pollution problem associated with PTEs by considering element types, soil properties, and pollution degree.

4.2. Comparison of the Improved Matter–Element Extension Model with Conventional Methods

Our evaluation results of soil pollution by PTEs based on the improved matter–element extension model were consistent with the data obtained by the original matter–element extension model and weighted comprehensive index. However, the application of fuzzy mathematics and the Nemerow index yielded different results. Because the same standards and corrected weights were used in the evaluation, the differences in the results obtained by the various methods were mainly due to the different focuses of the methods and their limitations in practical application.
In the conventional matter–element extension model, when the data of the evaluation index are beyond the scope of the joint domain, the correlation function cannot be computed, and it is impossible to perform the evaluation. In addition, when evaluating the grade of an object based on the correlation degree, sometimes it is easy to lose information, which may lead to the deviation of the evaluation results. Here, we obtained the evaluation results from 246 soil samples by the original matter–element extension model. Six soil samples could not be evaluated by this model because their As concentrations were beyond the joint domain. This reflects the limitation of the original matter–element extension model.
When using the weighted comprehensive index to evaluate soil pollution by PTEs, the standard value of each pollution level is divided by the national standard value of Grade II, and then multiplied by the corresponding weight of each PTE to obtain the critical value of the evaluation index, which represents the pollution degree. Since this method cannot use the variable weights of PTEs in each sample, it only uses the mean weight of each element for calculation. In addition, this method does not consider the fuzziness of boundary of soil pollution by PTEs, and thus may result in unreasonable evaluation results in some samples.
Although the fuzzy mathematics method fully considers the boundary fuzziness of soil pollution by PTEs, it is inefficient or even invalid for grade evaluation according to the maximum degree of membership principle. Thus, it is necessary to test the validity of the maximum degree of membership principle in the application of fuzzy mathematics [52]. Moreover, according to the membership function of fuzzy mathematics, the membership degree of a certain level also depends on the group distance of that level. Because the background values of the soil environment in Jiangxi Province are much lower than the national standard values of Grade II, the concentrations of PTEs in most cultivated soil samples from the Poyang Lake region were between the local background and national standard values. As a result, most of the sampling points were determined to be in a clean state (level I) based on the fuzzy mathematics method, which might be relatively optimistic compared with the actual situation.
The evaluation results based on the Nemerow index were considerably different from the results based on the improved matter–element extension model. First, the evaluation standards adopted by these two methods are inconsistent. For the improved model, the local background values in Jiangxi Province were taken as the upper limits of pollution level I (clean), and the national standard values of Grade II were used as the upper limits of pollution level II (still clean). In contrast, the national standard values of Grade II were used as the evaluation standard for the Nemerow index, and its evaluation results of pollution levels I and II corresponded to level II based on the improved matter–element extension model. Second, the Nemerow index highlights the role of the major pollutants with high concentrations and lacks ecotoxicological information. It may therefore overestimate or underestimate the soil pollution level and reduce the sensitivity of the evaluation to a certain extent. Despite this, the Nemerow index is one of the most commonly used methods to calculate the comprehensive pollution index of PTEs, and it overcomes the deficiency of the single factor pollution index that cannot reflect the complex pollution situation [12].
The improved matter–element extension model fully considers the uncertainty and fuzziness of soil pollution by PTEs in the evaluation, thereby overcoming the limitation of its original model. It also solves the problem associated with rigid grade evaluation by other methods such as the weighted comprehensive index and the Nemerow index. Moreover, the improved model introduces the closeness function to replace the membership function used in the fuzzy mathematics method. The calculation of the improved model is simple, and the evaluation accuracy has been verified by several different conventional methods. However, similar to other models for the evaluation of soil pollution by PTEs, the improved matter–element extension model proposed in this study still lacks an accuracy verification model. Future studies are required to investigate the concentrations of PTEs in crops and agricultural products from the Poyang Lake region, and explore the mechanisms underpinning the migration of PTEs into the soil–crop system. The ultimate goal is to mutually couple and verify the concentrations of PTEs in cultivated soils, crops, and agricultural products, thereby demonstrating the feasibility of the improved model.

5. Conclusions

(1) This study has constructed an improved matter–element extension model for the evaluation of soil pollution by PTEs in cultivated land. It overcomes the limitation of the original model by normalizing the classical domain and the matter–element to be evaluated, and replacing the principle of maximum degree of membership with the principle of closeness degree. In addition, the toxic response factor is introduced to correct the weights of PTEs determined by the conventional weighting method. The corrected weights indicate not only the concentration but also the toxicity of the PTEs.
(2) The mean concentrations of Hg, As, Pb, Cd, Cu, Cr, and Zn in cultivated soils from the Poyang Lake region were all higher than their local background values in Jiangxi Province, indicating different degrees of element accumulation. The over-standard rates of different PTEs were ranked in the order of Cr > Cu > Cd > Hg > Zn > Pb > As. These potentially harmful pollutants were mainly released from industrial and agricultural activities, and could enter cultivated soils through multiple pathways.
(3) Based on the improved matter–element extension model, the pollution level of cultivated soils in the study region was still clean (level II). The samples from Duchang County, Hukou County, and Gongqingcheng City were in a clean state, and the samples from other areas were in a still clean state or at the warning limit.
(4) The evaluation results based on the improved matter–element extension model were consistent with the data obtained by its original model and the weighted comprehensive index. The accuracy of the improved model was verified by the re-evaluation results based on the single factor pollution index. The improved model therefore can be applied to the evaluation of soil pollution by PTEs in cultivated land. However, currently no unified standard is available for the evaluation of soil pollution by PTEs. How to reasonably determine the evaluation standard and verify the accuracy of the evaluation model merits further investigation.

Author Contributions

Conceptualization, Z.L.; methodology, J.Z.; software, S.Q.; validation, J.Z. and S.Q.; investigation, X.F.; writing—original draft preparation, J.Z.; writing—review and editing, Z.L. and X.F. All authors have read and agreed to the published version of the manuscript.

Funding

This research was funded by the Humanities and Social Sciences Research Planning Foundation of the Ministry of Education of China (No. 19YJAZH061).

Data Availability Statement

Not applicable.

Acknowledgments

We are all very grateful to the anonymous reviewers of this paper for their helpful comments.

Conflicts of Interest

The authors declare no conflict of interest.

References

  1. Shao, D.W.; Zhan, Y.; Zhou, W.J.; Zhu, L.Z. Current status and temporal trend of heavy metals in farmland soil of the Yangtze River Delta Region: Field survey and meta-analysis. Environ. Pollut. 2016, 219, 329–336. [Google Scholar] [CrossRef]
  2. Rahman, M.A.; Rahman, M.M.; Richman, S.M.; Lim, R.P.; Naidu, R. Heavy metals in Australian grown and imported rice and vegetables on sale in Australia: Health hazard. Ecotoxicol. Environ. Saf. 2014, 100, 53–60. [Google Scholar] [CrossRef]
  3. Yang, P.G.; Mao, R.Z.; Shao, H.B.; Gao, Y.F. An investigation on the distribution of eight hazardous heavy metals in the suburban farmland of China. J. Hazard. Mater. 2009, 167, 1246–1251. [Google Scholar] [CrossRef]
  4. Sun, C.; Liu, J.; Wang, Y.; Sun, L.; Yu, H. Multivariate and geostatistical analyses of the spatial distribution and sources of heavy metals in agricultural soil in Dehui, Northeast China. Chemosphere 2013, 92, 517–523. [Google Scholar] [CrossRef]
  5. Tan, M.Z.; Xu, F.M.; Chen, J.; Zhang, X.L.; Cheng, J.Z. Spatial prediction of heavy metal pollution for soils in peri-urban Beijing, China based on fuzzy set theory. Pedosphere 2006, 16, 545–554. [Google Scholar] [CrossRef]
  6. Qu, C.S.; Sun, K.; Wang, S.R.; Huang, L.; Bi, J. Monte Carlo imulation-based health risk assessment of heavy metal soil pollution: A case study in the Qixia mining area, China. Hum. Ecol. Risk. Assess. 2012, 18, 733–750. [Google Scholar] [CrossRef]
  7. Zhang, L.Y.; Guo, S.H.; Wu, B. The source, spatial distribution and risk assessment of heavy metals in soil from the Pearl Kiver Delta based on the national multi-purpose regional geochemical survey. PLoS ONE 2015, 10, 2732–2740. [Google Scholar]
  8. Esmaeili, A.; Moore, F.; Keshavarzi, B.; Jaafarzadeh, N.; Kermani, M. A geochemical survey of heavy metals in agricultural and background soils of the Isfahan industrial zone, Iran. Catena 2014, 121, 88–98. [Google Scholar]
  9. Wang, Y.M.; Ran, W.J.; Wu, L.; Wu, Y.F. Assessment of river water quality based on an improved fuzzy matter-element model. Int. J. Environ. Res. Public Health 2019, 16, 2793. [Google Scholar] [CrossRef]
  10. Muller, G. Index of geoaccumulation in sediments of the Rhine River. Geojournal 1969, 2, 108–118. [Google Scholar]
  11. Wei, Z.Y.; Wang, D.F.; Zhou, H.P.; Qi, Z.P. Assessment of soil heavy metal pollution with principal component analysis and geoaccumulation index. Procedia Environ. Sci. 2011, 10, 1946–1952. [Google Scholar]
  12. Nemerow, N.L. Scientific Stream Pollution Analysis; Scripta Book Co.: Washington, DC, USA, 1974. [Google Scholar]
  13. Buat-Menard, P.; Chesselet, R. Variable influence of the atmospheric flux on the trace metal chemistry of oceanic suspended matter. Earth Planet. Sci. Lett. 1979, 42, 399–411. [Google Scholar] [CrossRef]
  14. Tomlinson, D.L.; Wilson, J.G.; Harris, C.R. Problems in assessment of heavy metals in estuaries and the formation of pollution index. Helgol. Mar. Res. 1980, 33, 566–575. [Google Scholar] [CrossRef]
  15. Hakanson, L. An ecological risk index for aquatic pollution control: A sedimentological approach. Water Res. 1980, 14, 975–1001. [Google Scholar] [CrossRef]
  16. Lam, E.J.; Montofré, I.L.; Álvarez, F.A.; Gaete, N.F.; Poblete, D.A.; Rojas, R.J. Methodology to prioritize chilean tailings selection, according to their potential risks. Int. J. Environ. Res. Public Health 2020, 17, 3948. [Google Scholar] [CrossRef]
  17. Onkal-Engin, G.; Demir, I.; Hiz, H. Assessment of urban air quality in Istanbul using fuzzy synthetic evaluation. Atmos. Environ. 2004, 38, 3809–3815. [Google Scholar] [CrossRef]
  18. Dou, L.; Zhou, Y.Z.; Wang, X.R.; Yang, Z.J.; Peng, X.Z.; Li, X.J. Improvement and application of a fuzzy mathematical model for assessment of heavy meta pollution in soil. J. Chin. J. Soil Sci. 2007, 38, 101–105. (In Chinese) [Google Scholar]
  19. Li, H.Z.; Guo, S.; Tang, H.; Li, C.J. Comprehensive evaluation on power quality based on improved matter-element extension model with variable weight. Power Syst. Technol. 2013, 37, 653–659. (In Chinese) [Google Scholar]
  20. Guo, X.X.; Liu, C.Q.; Zhu, Z.Z.; Wang, Z.L.; Li, J. Evaluation methods for soil heavy metals contamination. Chin. J. Ecol. 2011, 30, 889–896. (In Chinese) [Google Scholar]
  21. Zhang, J.J.; Ma, C.M.; Kuang, H.; Zhou, A.G. Assessment of heavy metals pollution in soil of Qingdao based on matter-element extension model. China Environ. Sci. 2017, 37, 661–668. (In Chinese) [Google Scholar]
  22. Cai, W.; Yang, C.Y.; Lin, W.C. Extension Engineering Methods; Science Press: Beijing, China, 2003. (In Chinese) [Google Scholar]
  23. Jing, J.Q.; Li, L.J.; Lv, G.B. Comprehensive evaluation on environmental pollution by fuzzy matter-element method. J. Southwest Pet. Inst. 2000, 11, 70–73. [Google Scholar]
  24. He, Y.X.; Dai, A.Y.; Zhu, J.; He, H.Y.; Li, F.R. Risk assessment of urban network planning in China based on the matter-element model and extension analysis. Int. J. Electr. Power Energy Syst. 2011, 33, 775–782. [Google Scholar] [CrossRef]
  25. Zhou, X.T.; Zhao, M.X.; Zhou, L.Y.; Yang, G.; Huang, L.Q.; Yan, C.Q.; Huang, Q.S.; Ye, L.; Zhang, X.B.; Guo, L.P.; et al. Regionalization of habitat suitability of Masson’s pine based on geographic information system and fuzzy matter-element model. Sci. Rep. 2016, 6, 312–320. [Google Scholar] [CrossRef] [PubMed]
  26. Xie, X.F.; Pu, L.J. Assessment of urban ecosystem health based on matter element analysis: A case study of 13 cities in Jiangsu province, China. Int. J. Environ. Res. Public Health 2017, 14, 940. [Google Scholar] [CrossRef]
  27. Zhang, J.H.; Yang, Y.H.; Chen, N.X. Application of fuzzy matter-element model to water quality evaluation of reservoir. Water Resour. Power 2011, 29, 17–19. (In Chinese) [Google Scholar]
  28. Li, M.S.; Zhang, J.H.; Liang, N.; Lin, L.Y.; Li, Q.; Wen, X.C. Comparisons of some common methods for water environmental quality assessment. Prog. Geogr. 2012, 31, 617–624. (In Chinese) [Google Scholar]
  29. Jin, J.; Qian, H.; Chen, Y.F.; Xi, W.J. Assessment of groundwater quality based on matter element extension model. J. Chem. 2013, 2013, 715647. [Google Scholar] [CrossRef]
  30. Pan, G.B.; Xu, Y.P.; Yu, Z.H.; Song, S.; Zhang, Y. Analysis of river health variation under the background of urbanization based on entropy weight and matter-element model: A case study in Huzhou City in the Yangtze River Delta, China. Environ. Res. 2015, 139, 31–35. [Google Scholar] [CrossRef]
  31. Ruan, G.F.; Zhang, J.M.; Mu, Y.H.; Zhang, H.; Cai, M.T. Evaluation of the embankment thermal stability over permafrost based on entropy weight and matter element extension model. J. Glaciol. Geocryol. 2014, 36, 123–129. (In Chinese) [Google Scholar]
  32. Wang, Q.; Li, S.Q.; He, G.; Li, R.R.; Wang, X.F. Evaluating sustainability of water-energy-food (WEF) nexus using an improved matter-element extension model: A case study of China. J. Clean. Prod. 2018, 202, 1097–1106. [Google Scholar] [CrossRef]
  33. Liu, S.L.; Li, W.P. Indicators sensitivity analysis for environmental engineering geological patterns caused by underground coal mining with integrating variable weight theory and improved matter-element extension model. Sci. Total Environ. 2019, 686, 606–618. [Google Scholar] [CrossRef]
  34. Wang, H.D.; Cao, Y.H. Evaluation of surrounding rock stability based on improved matter element extension model with variable weight. China Saf. Sci. J. 2013, 23, 23–29. (In Chinese) [Google Scholar]
  35. Wang, Y.T.; Wang, T.T.; Qiu, X.L.; Ma, Z.H.; Zhao, C.P. Research on Improved Strategy of Soil Heavy Metals based on Neural Network Model. Int. J. Intell. Inf. Manag. Sci. 2019, 8, 306–309. [Google Scholar]
  36. Su, H.M.; He, A.X.; Yuan, X.T. Pollution evaluation of soil heavy metal around mining using matter element analysis. Chin. J. Soil Sci. 2016, 47, 173–178. (In Chinese) [Google Scholar]
  37. Jiang, Y.F.; Ye, Y.C.; Guo, X. Spatiotemporal variation of soil heavy metals in farmland influenced by human activities in the Poyang Lake region, China. Catena 2019, 176, 279–288. [Google Scholar] [CrossRef]
  38. Ministry of Agriculture of PRC. Technical Specifications for Monitoring Soil Environmental Quality of Farmland (NY/T395-2012); China Standards Press: Beijing, China, 2012. (In Chinese)
  39. United States Environmental Protection Agency (US EPA). Method 3051A (SW-846): Microwave Assisted Acid Digestion of Sediments, Sludges, Soils, and Oils. Revision 1; US EPA: Washington, DC, USA, 2007.
  40. State Environmental Protection Administration of China. Technical Specifications for Soil Environmental Monitoring (HJ/T166-2004); China Standards Press: Beijing, China, 2004. (In Chinese)
  41. Wang, X.L.; Wang, G.X.; Wu, Y.X.; Xu, Y.; Gao, H. Comprehensive assessment of regional water usage efficiency control based on game theory weight and a matter-element model. Water 2017, 9, 113. [Google Scholar] [CrossRef]
  42. Zhang, X.P. The definition of product about fuzzy comprehensive evaluation methods based on closeness. J. Shandong Univ. 2004, 39, 25–29. (In Chinese) [Google Scholar]
  43. Gao, M.M.; Sun, T.; Zhang, K. Dynamic Fuzzy comprehensive evaluation quality of Jinan city based on the multiple on the atmosphere environmental super-scale weighting method. J. Arid Land Resour. Environ. 2014, 28, 150–154. (In Chinese) [Google Scholar]
  44. State Environmental Protection Administration of China. Environmental Quality Standard for Soils in China (GB 15618-1995); China Standards Press: Beijing, China, 1995. (In Chinese)
  45. Ministry of Ecology and Environment of China. Soil Environmental Quality: Risk Control Standard for Soil Contamination of Agricultural Land (GB 15618-2018); China Standards Press: Beijing, China, 2018. (In Chinese)
  46. He, J.L.; Xu, G.Y. Study on the Background Value of Soil Environment in Jiangxi; China Environmental Science Press: Beijing, China, 2006. (In Chinese) [Google Scholar]
  47. Li, X.M.; Deng, X.W.; Wang, Z.W.; Huang, S.L. Determination of weight of polluted factors and grading standards of comprehensive assessment of regional environmental quality: A case of soil heavy metal pollution. J. Arid Land Resour. Environ. 2010, 24, 97–100. (In Chinese) [Google Scholar]
  48. Qi, Z.; Gao, X.; Qi, Y.; Li, J.L. Spatial distribution of heavy metal contamination in mollisol dairy farm. Environ. Pollut. Part B 2020, 263, 114621. [Google Scholar] [CrossRef]
  49. Zhao, J.; Luo, Z.J.; Zhao, W.W.; Zhao, Y.; Song, J. Assessment of heavy metal pollution in arable soils in the Poyang Lake area based on the improved matter-element extension method. J. Agro-Environ. Sci. 2019, 38, 521–533. (In Chinese) [Google Scholar]
  50. Liu, G.; Wang, J.; Zhang, E.; Hou, J.; Liu, X. Heavy metal speciation and risk assessment in dry land and paddy soils near mining areas at Southern China. Environ. Sci. Pollut. Res. Int. 2016, 23, 8709–8720. [Google Scholar] [CrossRef] [PubMed]
  51. Liu, P.J.; Wu, K.N.; Luo, M.; Li, C.X.; Zhu, P.T.; Zhang, Q.; Xu, W.W. Evaluation of agricultural land soil heavy metal elements exceed standards and safe utilization zones. Trans. Chin. Soc. Agric. Eng. 2016, 32, 254–262. (In Chinese) [Google Scholar]
  52. Yang, J.Y.; Ou, C.; Li, Q.; Zhang, X.; Zhang, C.; Zhu, D.H. Fuzzy synthetic evaluation of soil nutrients in cultivated land based on cloud model. Trans. Chin. Soc. Agric. Mach. 2018, 49, 251–257. (In Chinese) [Google Scholar]
  53. Yang, Q.Q.; Li, Z.Y.; Lu, X.N.; Duan, Q.N.; Huang, L.; Bi, J. A review of soil heavy metal pollution from industrial and agricultural regions in China: Pollution and risk assessment. Sci. Total Environ. 2018, 642, 690–700. [Google Scholar] [CrossRef]
  54. Dai, L.J.; Wang, L.Q.; Li, L.F.; Liang, T.; Zhang, Y.Y.; Ma, C.X.; Xing, B.S. Multivariate geostatistical analysis and source identification of heavy metals in the sediment of Poyang Lake in China. Sci. Total Environ. 2018, 621, 1433–1444. [Google Scholar] [CrossRef]
  55. Wang, H.; Li, W.; Zhu, C.; Tang, X. Analysis of Heavy Metal Pollution in Cultivated Land of Different Quality Grades in Yangtze River Delta of China. Int. J. Environ. Res. Public Health 2021, 18, 9876. [Google Scholar] [CrossRef]
Figure 1. Geographical location of the study region in Jiangxi Province, China. (a) Poyang Lake region; (b) Major industrial and mining areas; and (c) Soil sampling points (n = 251).
Forests 13 01445 g001
Figure 2. Comparison of the weights of potential toxic elements at different sampling points before (W) and after (W′) correction by introducing the toxic response factor.
Forests 13 01445 g002
Figure 3. Spatial distribution of the pollution levels of potential toxic elements in cultivated soils at different sampling points.
Forests 13 01445 g003
Figure 4. Percentage of soil samples with various pollution levels based on five different evaluation methods.
Forests 13 01445 g004
Table 1. Evaluation standards for the pollution of cultivated soils by potential toxic elements in the study region (mg/kg).
ElementPollution Level 1
Clean
(I)
Still Clean
(II)
Mild Pollution
(III)
Moderate Pollution
(IV)
Severe Pollution
(V)
Hg[0, 0.08) 2[0.08, 0.5)[0.5, 1.05)[1.05, 1.50)[1.50, 1.95)
As[0, 10.40)[10.40, 25.00)[25.00, 28.00)[28.00, 40.00)[40.00, 52.00)
Pb[0, 32.10)[32.10, 100.00)[100.00, 350.00)[350.00, 500.00)[500.00, 650.00)
Cd[0, 0.10)[0.10, 0.40)[0.40, 0.70)[0.70, 1.00)[1.00, 1.30)
Cu[0, 20.80)[20.80, 50.00)[50.00, 280.00)[280.00, 400.00)[400.00, 520.00)
Cr[0, 48.00)[48.00, 150.00)[150.00, 210.00)[210.00, 300.00)[300.00, 390.00)
Zn[0, 69.00)[69.00, 200.00)[200.00, 350.00)[350.00, 500.00)[500.00, 650.00)
1 The upper limit of clean level (I) is the background value of the soil environment in Jiangxi province. The upper limit of still clean level (II) is determined by Grade II criteria of the Soil Environmental Quality: Risk Control Standard for Soil Contamination of Agricultural Land [45]. The upper limits of slight to severe pollution levels (III, IV, and V) are 0.7, 1.0, and 1.3 times the Grade III criteria of the Environmental Quality Standard for Soils in China [44], respectively. 2 Brackets indicate inclusive bounds, while parentheses indicate exclusive bounds. For example, the lower limit value of Hg for clean level (I) is greater than or equal to 0 mg/kg, and the upper limit value is lower than 0.08 mg/kg.
Table 2. Descriptive statistics of potential toxic elements concentrations in cultivated soils in the study region (mg/kg).
ElementHgAsPbCdCuCrZn
Minimum0.000.630.740.016.5212.130.50
Maximum0.5772.56116.850.98421.58239.65196.32
Mean0.1311.2834.900.1734.5283.7172.39
Standard deviation0.1113.4218.920.1431.6543.2131.95
Coefficient of variation (%)89.8118.254.183.791.251.343.9
Background value in Jiangxi0.0810.432.10.120.84869
National standard of Grade II0.5301000.450250200
Over-standard rate (%) 150.036.242.962.382.987.946.0
1 The over-standard rate of potential toxic elements is based on the background values of soil environment in Jiangxi Province.
Table 3. Comparison of the mean weights of soil potential toxic elements in the study region before (Wki) and after (Wki) correction by introducing the toxic response factor.
ElementWkiWkiAdjusted Ratio 1
Hg0.08320.2632↑216.35%
As0.21050.1972↓6.32%
Pb0.07120.035↓50.84%
Cd0.14960.3768↑151.87%
Cu0.08670.0402↓53.63%
Cr0.25830.0485↓81.22%
Zn0.12970.0136↓89.51%
1 ↑ represents increase and ↓ represents decrease.
Table 4. Distances [Dj(vi)] between the evaluation indices and the classical domain for sampling point S1.
Index 1Distance Value
D1(vi)D2(vi)D3(vi)D4(vi)D5(vi)
c1−0.015250.025750.138750.522750.75375
c2−0.097060.097060.378060.435060.66606
c3−0.017530.017530.153530.506530.73753
c4−0.025150.025150.179150.486150.71715
c50.00146−0.001460.054540.496540.72754
c60.03609−0.036090.225910.378910.60991
c7−0.010270.010270.212270.442270.67327
1 c1 to c7 represent the concentrations of Hg, As, Pb, Cd, Cu, Cr, and Zn in soil, respectively.
Table 5. Degree of closeness between the matter–elements to be evaluated and the pollution levels of potential toxic elements in soil.
Sampling PointCloseness DegreePollution Level
j = 1j = 2j = 3j = 4j = 5
S11.000600.999370.996160.991560.98744I
S21.000440.999530.996070.991980.98785I
S30.998581.000470.998210.993610.98949II
S40.999851.000150.996900.992370.98824II
S51.000200.999800.996730.991870.98774I
S2470.999801.000050.997340.991770.98764II
S2480.996070.997711.001640.995200.99107III
S2490.989880.992400.996530.998910.99771IV
S2500.997590.999040.999920.993830.98971III
S2510.999021.000340.998460.992470.98834II
Table 6. Evaluation results of potential toxic elements pollution in cultivated soils across the study region.
Area
(County or City)
Percentage of Samples at Each Pollution Level/%Closeness Degree
IIIIIIIVVj = 1j = 2j = 3j = 4j = 5Overall Pollution Level
De’an21.4371.437.140.000.000.998861.001030.997780.993500.98938II
Duchang51.8548.150.000.000.001.000100.999900.996680.992120.98800I
Hukou60.0040.000.000.000.001.000030.999950.996720.992160.98803I
Jiujiang0.00100.000.000.000.000.999991.000000.996780.992230.98811II
Xingzi54.5536.369.090.000.000.999571.000430.997130.992740.98861II
Yongxiu28.0060.008.004.000.000.999641.000360.997130.992590.98847II
Gongqingcheng60.0040.000.000.000.001.000150.999850.996590.992110.98798I
Nanchang0.0080.6512.906.450.000.999111.000850.998130.992670.98854II
Xinjian0.0096.773.230.000.000.999071.000380.998290.992420.98829II
Jinxian0.0073.5323.532.940.000.999121.000560.998240.992560.98843II
Yugan0.0067.5027.500.005.000.997791.000640.998940.994480.99036II
Poyang0.0078.2621.740.000.000.998301.001030.998500.993930.98981II
Poyang Lake region14.2970.2413.101.590.790.999361.000640.997630.992660.98854II
Table 7. Number of soil samples with various pollution levels based on five different evaluation methods.
MethodNumber of Soil Samples
TotalIIIIIIIVV
Improved matter–element extension model251361763342
Original matter–element extension model246451732440
Weighted comprehensive index251641721500
Fuzzy mathematics25115481862
Nemerow index251135605042
Table 8. Re-evaluation results of potential toxic elements pollution in selected soil samples (n = 103) based on the single factor pollution index 1.
Sampling PointSingle Factor Pollution Index Pi
HgAsPbCdCuCrZn
S80.7670.5981.0661.3481.7271.6761.699
S130.7811.2201.3001.2661.5210.5610.738
S151.0530.7820.7921.7841.1241.2090.713
S231.7350.8770.8172.1811.1141.1430.704
S300.5200.6671.3471.8831.1191.0080.669
S1892.8500.3260.5431.3671.2101.3961.523
S1961.9450.2020.9791.5901.9872.5811.422
S2021.8090.2431.6771.8731.7391.3841.314
S2241.5980.2801.2851.1851.5731.5341.623
S2462.4410.3242.7421.3874.9561.4621.480
1 The pollution level of the selected samples was still clean (level II) based on the improved matter–element extension model, while different results were obtained using the fuzzy mathematics method and the Nemerow index.
Publisher’s Note: MDPI stays neutral with regard to jurisdictional claims in published maps and institutional affiliations.

