1. Introduction
From an investor’s perspective, the main purpose of an investment is to increase or at least, preserve the investor’s current level of wealth [
1], but where to invest and how to make a profit from investing in forestry? Given that about 70% of the world’s forests (more than 13 billion forested hectares [
2]), and even up to 80% according to Palo and Lehto [
3], are owned by governments, the possibility of making private investments into marketable forestlands is limited. Governments ordinarily do not sell, or lease forestland and their forestry management companies tend not to be publicly traded. State-owned forest companies, of all kinds, are commonly non-profit-oriented and hold forest capital more for social well-being purposes and as a national strategic resource [
4,
5]. They control the effects of natural hazards like wildfires, floods, typhoons, and insect and disease epidemics while generally following the principles of allowable cut [
2]. Only a small fraction of the world’s forests are privately owned, publicly traded, and managed according to commercial and competitive market principles. Consequently, the proportionate disbalance between the two principles of forestry, social forestry, and sustainable profit-oriented forestry, has influenced the general perception of forestry as a sector that is not economically lucrative and suitable only for conservative (i.e., high risk-averse) investors.
However, a general ownership structure over forests is beginning to see some change. This means that the investment potential of forestry is gaining focus. Privatization processes in countries such as New Zealand, Australia, and South Africa (where governments have sold forestlands [
6]) and the process of forestland restitution in former socialist countries [
7] are contributing to this change. Moreover, the economic importance of forestry is gradually increasing; in recent times the United Nations has launched the Principles for Responsible Banking [
8], which will ensure that banking investments are aligned with the demands of society, sustainable development, and the Paris Climate Agreement [
9]. The Global Ethical Finance Initiative also provides similar goals [
10].
These mentioned processes have meant that investors are increasingly integrating environmental, social, and governance (ESG) principles into their investment portfolios. Furthermore, the global projection of industrial roundwood consumption indicates an increase of 1.1% per annum and will reach 2.9 billion m
3 by 2050 (currently at approx. 2.0 billion m
3) [
11]. The same applies to other forestry-related products. According to Cubbage et al. [
6], the global population will increase and available land will decrease due to climate change, leading to land prices appreciating quicker than inflation. Accordingly, we can expect investments in forestry to increase in the coming decades, in turn requiring a better understanding of capital-market performance in the forestry sector in the future.
Since more pressure is going to be directed toward forests in terms of usage for energy (e.g., firewood from a natural and renewable source) and land-use change (e.g., conversion into agricultural land for food production), there is a possibility that those processes could result in forest destruction and degradation. To prevent this from happening it is of great importance that societal needs (quantity and quality of wood demand in a certain period and the specific region), forestry performances (forest growing and management within their production potential for adequate supply on the market), and wood-processing industry performances (wood utilization at a higher level by using innovative technologies and wood reusing) are balanced [
12,
13,
14]. In other words, the need to better understand how those segments can cooperate more preferably is becoming important due to customers’ requests [
15,
16], the disbalance between supply and demand [
14,
17], and changing conditions in which forests can be grown [
18]. It is crucial that sustainability feedback is passed down back the added-value-chain, from the final-product consumers to the foresters (forest growers), to prevent the loss of natural forest capital and to detect quality and quantity segments that could be improved [
12,
14].
High risk-adjusted returns [
19], low correlation with other financial asset classes [
20], and inflation-hedging abilities [
21] are just some of the investment characteristics that make forestry investments appealing. Investors who seek portfolio diversification benefit from holding onto forest assets [
22,
23,
24]. Those benefits are grounded on the relative illiquidity of forests, resilience to short-term general market movements, and exposure to end-use markets that do not strongly correlate with the economy as a whole [
25,
26]. According to Fu [
27], forest investments offer four diversification approaches: spatial diversification (investing in different countries and/or regions), temporal diversification (investing in different stand age classes), product and market diversification (investing in different tree species apropos wood assortments), and finally investment structure and strategy diversification (fund, co-investment, direct investment, only forestry or its combination with agriculture-agroforestry). In addition, inflation-hedging is another desirable characteristic when possessing a forest asset [
6]. This means that a forest investment offers inflation-hedging against oil price risks [
28].
Investing in forestry can be achieved in two ways. The first way is to purchase and manage a forest. The second approach is to purchase shares of the companies that own or manage forests through a stock exchange [
20]. The second way is more open to the general investor community, which importantly prefers a high level of capital mobility. Investing in capital markets (i.e., stock exchanges) has benefits for both companies and investors. Companies can quickly source a large amount of required capital, while investors benefit from the large investment universe, low transaction costs, and a guaranteed level of capital market transparency and liquidity.
Literature on private capital investing in forestry, solely based on the risk-return principle, is seldom published and identifying true forestry-investment characteristics solely based on such principles is relatively difficult. Cubbage et al. [
6] estimated timber investment returns for 22 countries and 54 species/management regimes for a range of global timber plantation species and countries at the stand level. Similarly, Chudy et al., [
29] investigated the internal rate of returns (IRR) on several global timber plantation investment opportunities (case examples from the US, Brazil, Chile, and Poland). Posavec et al. [
30] evaluated government no-competitive-market forestry in south-east and east Europe, while Beljan et al. [
31] evaluated the investment potential of private forests solely on theoretical grounds at a single country level. Without evaluating the research methodology and commenting on the results of the above-presented studies, we want to point out that all of them present forestry-investment characteristics without incorporating the capital market perspective of these investments.
The focus will be placed on filling this knowledge gap of the capital market dimension of forestry investments, that is, revealing portfolio investor perspectives. Accordingly, our focus is solely on the forest companies listed on stock exchanges. Such stocks are evaluated daily by market actors, instantaneously capturing market sentiment and sector perspectives.
2. Materials and Methods
Our initial data sample combined PWC’s [
32] list of the
Top 100 Global Forest, Paper and Packaging Industry Companies and 128 companies from the Yahoo Finance database [
33] allocated to the sector of
Lumber & Wood Production. The second step involved incorporating only companies that own/lease and manage forestlands, whose shares are regularly publicly traded on stock exchanges.
This required examining each company’s Yahoo Finance profile page and official web page (investor relations section). In addition to data on forest location(s), forest area, company headquarters, and main stock exchange (all used for mapping), the data on the beta coefficient (CAPM model), share prices, and dividend payments were also collected. More precisely, our long-term capital market performance analysis of the forestry sector is derived from the observed 10-year time span of data (2011–2020).
Firstly, we compared investment returns in the forestry sector overall to gold investments [
34], the S&P500 index (U.S. stock market), and U.S. Treasury bonds index [
35]. The comparison was performed in order to get an impression of the current investment position of the forestry sector in relation to the world’s most common capital market benchmarks. Though gold is the oldest investment vehicle, the S&P500 tracks the stock prices of the 500 largest companies in the U.S., while the U.S. Treasury bonds index tracks U.S. government bond yields. Moreover, the U.S. capital market was taken into consideration as it has the longest and most continuous history of stock and bond pricings and represents one of the world’s most developed and efficient capital markets.
All of the observed forestry companies do not deal only with silviculture and forest management but are also involved in additional business activities in expanding the value-added chain in production. Our next step required classifying observed companies into four sub-groups based on the following three specific forest-related business activities for the observed companies: (1) sawmilling, (2) production of final products (e.g., furniture), and (3) paper production (
Table 1).
This paper relies on basic financial measures to evaluate investment characteristics of four sub-groups of forestry companies (i.e., their stocks): security return measures, company return measures, and the beta coefficient. In the observed 10-year time span, we analyzed total investment returns and associated partial returns for stocks, both capital gains and dividend yields. We also used company accounting profitability measures, return on equity (ROE), and the return on assets (ROA), as crucial indicators of our fundamental analysis. These indicators also include the beta coefficient (β), popularized by the capital asset pricing model (the CAPM) [
36], and the single-index market model [
37]. The beta measures the systematic (market) risk of a stock or the movement of given stock in the overall stock market [
38].
3. Results
In total, we filtered and analyzed 48 companies that have forest possession (ownership and/or lease) and publicly trade their stocks (
Table 2). Forest areas are summarized as general locations by country (
Figure 1). The world map (
Figure 1) shows the spatial distribution of company headquarters and stock exchanges where these companies are listed. The respective investment locations are concentrated in the Americas, South Africa, north and east Asia, and Australia and Oceania. Interestingly, many companies own and manage forestlands outside their domicile country and some companies list their shares internationally on major world stock exchanges. This shows that large forestry-based companies attract the attention of individual and institutional investors, and such companies follow global capital market development trends.
Table 2 shows positive five-year beta coefficients (β), ranging from 0.21 to 3.46 and equivalent to 1.15 on average. Importantly, the overall sample contains three companies with negative beta values, providing a forestry average of 1.06. This indicates that investors view the overall forestry sector as somewhat more volatile (risky) than the capital (stock) markets.
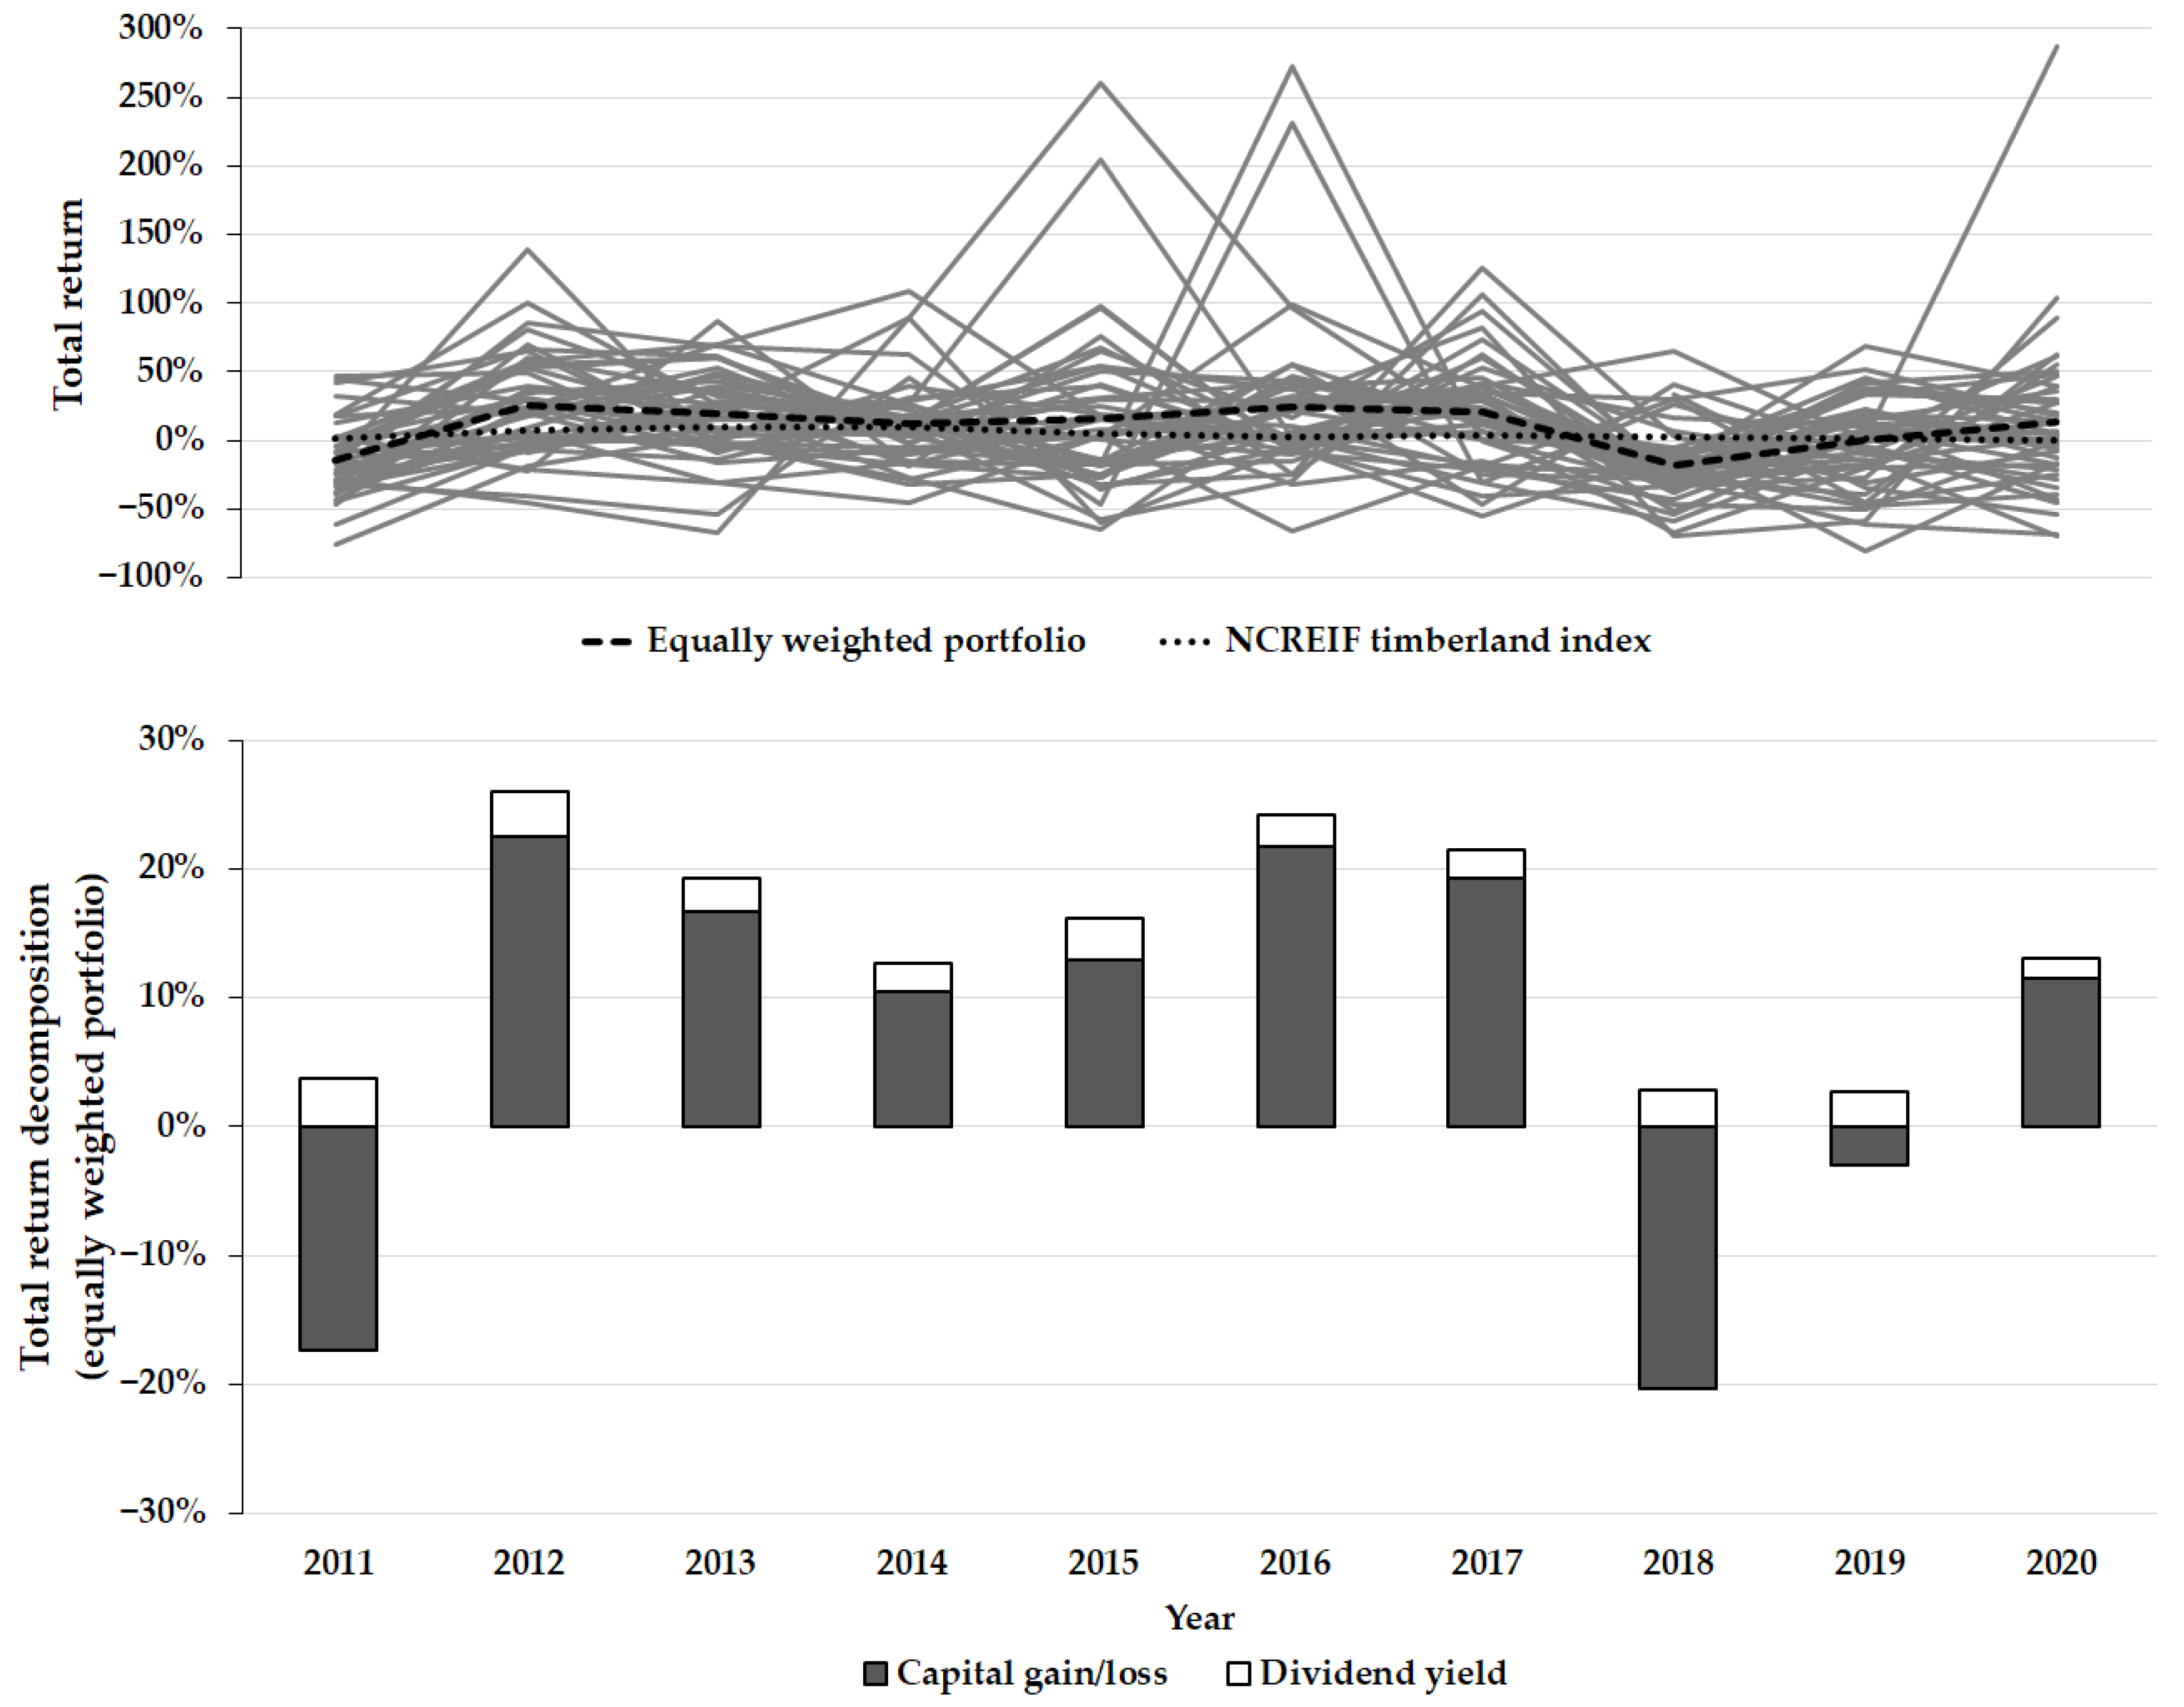
Total investment (stock) return is the sum of capital gains and the dividend yield. It represents an investor’s (stockholder) wealth increase and is expressed mathematically as a compound interest rate. In the sample (upper graph in
Figure 2), total returns range from −42.4 to 30.8% annually over the last observed 5-year period and from −28.2 to 34.3% annually in the last 10 observed years. Results are indicating that investors can make significant losses or gains in invested capital if they decide to hold a single asset or an undiversified (concentrated) investment portfolio. However, total returns average 7.0% annually for the most recently observed 5-year period, and 9.1% annually for the last observed 10-year period in terms of equally weighted portfolios of observed stocks (annual rebalancing assumed). This indicates that investors with portfolios consisting solely of shares from all of the observed forestry companies can easily achieve investment profits over longer terms.
Also, in
Figure 2, we add the returns of the NCREIF Timberland Index, which tracks the performance of the timberland asset class in a private equity context for the US. In general, compared to the observed equally weighted index, the NCREIF Timberland Index shows a lower level of realized returns, accompanied by a lower level of volatility. One should have in mind that the NCREIF Timberland Index as such is not a derived marketable asset. Thus, its performance is indicative and should be taken with caution ([
39,
40,
41] highlight some of its limitations).
Dividend payments (which are not mandatory and reflect a company’s dividend policy) of the observed companies are common. Approximately 69% of companies made at least one dividend payment in the last 5-year period, and approximately 71% in the last 10-year period. The average annual dividend yield was 3.3% in the last 5-year period (max 9.2%), and 3.9% in the last 10-year period (max 19.0%) (lower graph in
Figure 2).
Consequently, on average, the annual capital gain in the last 5-year period amounts to 4.6% and 6.3% in the last 10-year period. During the observed periods, there were also several companies with extremely high capital gains and capital losses, for example, in the last 5-year period up to 27.3% annually in the case of Duratex and down to −42.4% annually in the case of China Bozza. However, on average, positive capital gains were achieved in the forestry sector as a whole.
Figure 3 compares the total returns of the observed forestry sector against returns of investments in gold, the S&P500 index, and U.S. Treasury bonds index. The periods in which forestry-related investments exhibited better performance can be easily seen. The highest 10-year return was achieved by the S&P500 (13.8% on average) followed by forestry companies (9.1%), U.S. Treasury bonds (4.4%), and gold (3.0%).
When it comes to individual investment risks, U.S. Treasury bonds during the observed period preserved attributes of a low volatility asset class (standard deviation of 7.3%), making them most preferable in terms of risk. The S&P500 takes second place (StDev 12.2%), followed by volatility of gold returns (StDev 15.1%) and total returns of forestry companies (StDev 15.5%).
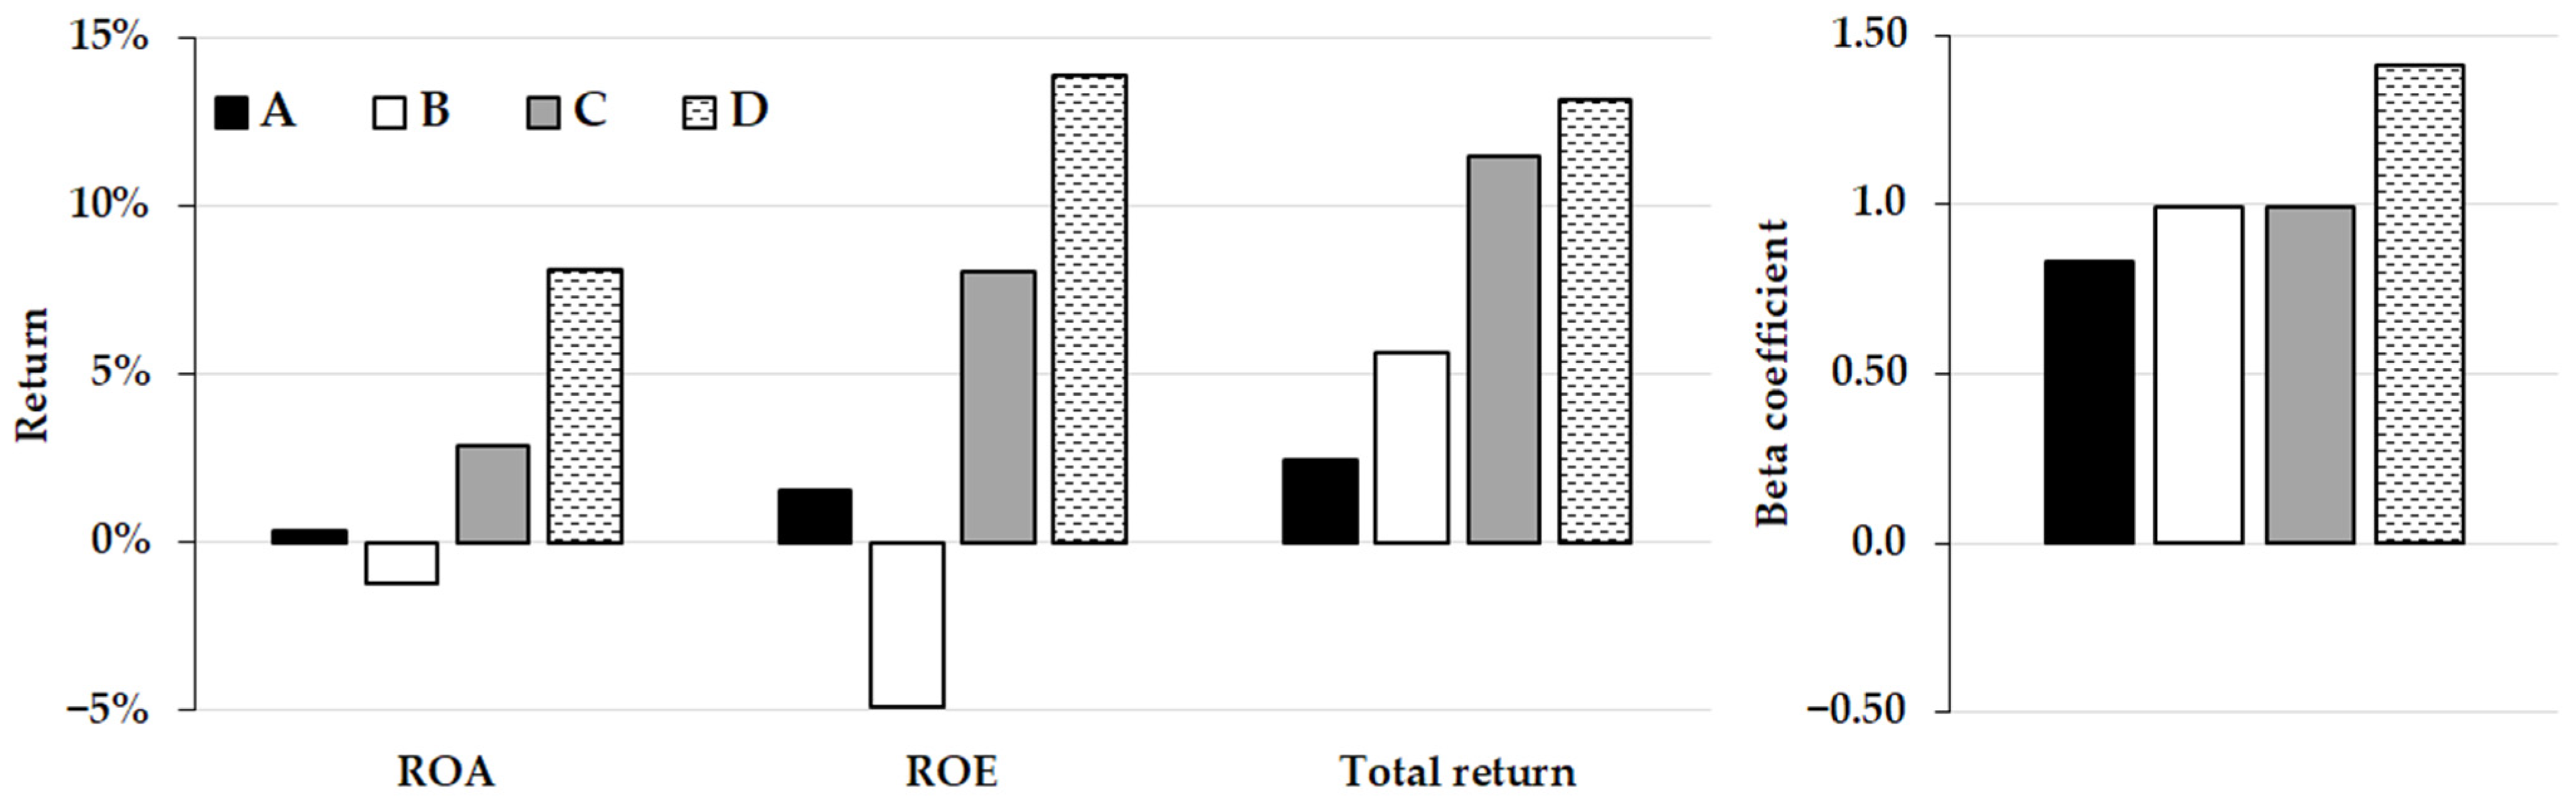
To gain better insight, the observed forest companies are classified into four sub-groups (
Table 2, column Type) based on their business activities (
Table 1). Given that we were unable to place six of the companies into the predefined sub-groups, the total sample size decreased to 42 companies. In other words, the combination of business activities of those six companies does not correspond to any combination defined by
Table 1.
Globally,
Table 3 shows that companies, in addition to forest management, also involved in sawmilling and production of final products (sub-group B) cover the biggest area of forests (about 15 mil ha). Based on this criterion, sub-group D (sawmilling, furniture, paper production) ranks second (about 11 mil ha), sub-group C (sawmilling and paper production) ranks third (about 4 mil ha), and sub-group A (only sawmilling) ranks fourth (about 1 mil ha). The average forest area per company in each specific sub-group is as follows: (A) 0.16 mil ha, (B) 1.15 mil ha, (C) 0.57 mil ha, and (D) 1.11 mil ha (
Table 2).
From an investors’ standpoint, all four sub-groups had a positive investment outcome in the observed period. However, as is seen in
Figure 4, a longer production chain (as we move from sub-group A to D) generally means greater business profitability (measured by ROA and ROE), greater systematic risk for a company (measured by the beta coefficient), and greater total return when investing in companies shares. This observation conforms with the common investment principle in the finance sector—positive risk-return relation.
4. Discussion
Back in the 1980s, when the forestry industry publicly traded shares started to develop more rapidly, soon reaching maturity, competition for assets increased while returns declined [
5]. Initially, about 91% of all investments took place in the U.S., 2% in South America, 5% in Australia and New Zealand, and 2% in other areas [
42]. Recent statistics suggest changes in these trends and are now: 66% in the U.S., 19% in Australia and New Zealand, 9% in Latin America, 3% in Canada, followed by 1% for Asia, Africa and Europe [
43]. According to our findings (
Figure 1), current data indicate 52% for the U.S., 23% for Europe (including Russia), 11% for South America, 9% for Asia, 3% for Africa, followed by 1% for Australia with New Zealand. Importantly, general trends for investments in the U.S. are becoming relatively low while increasing in other parts of the world. This indicates that the forestry market is becoming more extensive and diversifying, including better diversification of risk and possibly attracting more investors to this sector.
We have consciously left state-owned forests out of this paper and focused solely on publicly traded companies, enabling us to cover the forestry market and its performance over the last 10-year period on global capital markets. The motivation behind evaluating forestry in this manner was to investigate forestry as a sustainable and profit-oriented business. Considering that the majority of world forests are owned by states and managed for general interest, that is, not solely for profit [
4,
5], our intention was to present a different view on forestry. Based on the results (
Table 3,
Figure 2,
Figure 3 and
Figure 4), it is evident that forestry, especially those sub-groups with longer value-added-chain (sawmilling, furniture, paper production), can be a very lucrative business and attract investors based on the potential to make investment profits. However, findings like those of Hyde [
2] make this approach questionable in some ways, as it means making more profit from natural renewable resources. According to Hyde [
2], there are four standard justifications for public intervention in a market economy: efficiency, stabilization, distribution, and R&D. It is clear that governments should prescribe forest management principles based on fulfilling conditions incorporated in the UN’s Principles for Responsible Banking [
8], Global Ethical Finance Initiative [
10] and the Paris Climate Agreement [
9]. The results of this research show that market-oriented and profitable forestry is possible but should always be in line with the pillars of sustainable development.
The socio-economic implications related to return on assets in forest investments can be two-sided. They depend on a country’s legislative/political concept [
3] and forest management potential [
5,
6,
29,
44]. Forest’s ability to grow and generate additional value, and to realize sufficient IRR for the investors is “given by the nature”, and can be improved by artificial interventions on just a minor, regional scale (it is possible to enlarge forest cover, affect increment, and affect quality/quantity of cut [
14]). For the socio-economic impact, more important are the legislative and political concepts under which those forests are utilized. Forest legislature defines how to manage forest resources on a lower level (e.g., thinning, rotation periods, maximal clear-cut area, etc.) while the political concept defines the timber market efficiency and its laws of operating on a higher level (timber products market can be free or controlled [
3]). By looking at
Figure 1, it is possible to see the spatial distribution of analyzed forests and gain additional insight into forest production potential and the legislative/political concept of a certain country (data source: FAO [
45] and UN [
46]). All of this brings us to the socio-economic implications, of which the scale of impact is determined by a country’s development level. In short, it is to be expected that the impact on society’s well-being is more significant in countries with developing and transition economies. To support this hypothesis it needs to be apostrophized that the management and investment potential of forests represent just a perspective and the policy tools are more important [
3].
The results indicate a relatively large variability of the beta coefficients, capital gains, dividend yields, and total returns. The assumption is that these variations are influenced by different market conditions, different forest(s) characteristics (e.g., climate zones, natural hazard risks, incremental potential, monetary value differences of tree species) and, most importantly, a company’s vertically-integrated business activities (silviculture and forest management, sawmilling, producing final products, paper production, or some other combination of these activities). Based on the data sample (48 companies in total), it must be stressed that only those companies listed on major stock exchanges in the spring of 2021 were taken into account. It may be that some companies went into bankruptcy after the observed period, which may have had some effect on our conclusions concerning the general capital-market performance of forestry.
Moreover, some variations in the observed indicators are attributed to various levels of realized inflation in the countries, foreign exchange rate changes over time, and the fact that some companies list their shares on multiple stock exchanges. The rates of return in
Table 3 are presented in nominal terms, whereas their real terms require reducing for the inflation rate (on average 2.16% annually for the U.S. over the observed period [
47]). Given that at times the domestic currency of investors does not correspond to the currency in which stock prices are listed on the stock exchange, some fluctuations in foreign exchange rates (risks) are possible. Also, there are rare cases in which shares in forestry companies are traded on more than one stock exchange. In those cases, we obtained the data just from one stock exchange with a larger trade turnover.
According to Hyde [
2], negative (CAPM) beta coefficients for forestry companies are preferable to neutral ones that have near-zero beta coefficients. However, observed negative beta coefficients are very rare in practice and are an interesting phenomenon. In this research, only three companies had a negative beta coefficient (
Table 2). This indicates that those forestry companies are inversely correlated with the overall stock market. This makes them ideal candidates for hedging purposes in times when markets decline. In other words, when stock markets decline, investors can secure wealth by investing in stocks with a negative beta. Here we see that some forestry companies can be perceived as a favorable investment opportunity in times of declining stock markets.
A comparison of total return to other asset classes for forestry companies provides greater insight into risk-return characteristics of indirectly holding a forest asset within an investment portfolio. According to Lutz [
26], timber investments compare relatively well with other assets but do have lower rates of return than U.S. stock markets. Though Lutz [
26] compared only average investment returns, Damodaran [
48] took into account the risk (i.e., return volatility) and found that returns from forest assets are as volatile as those from T-bills and bonds (the volatility is almost two times greater than the average return). This is also similar to comparisons conducted in this study (
Figure 3). In the observed period, the risk-return ratio for the observed forest companies is nearly identical to U.S. Treasury bonds (approx. 1.7 times greater than the average return), worse than for the S&P 500 index (0.9 time), but significantly better than for gold (5 times). When it comes to return volatility between forest company subgroups (
Table 3), the returns range from 11 times greater than the average (subgroup A) to 1.4 times greater than the average (subgroup C).
Holding a forest asset in an investment portfolio offers many advantages [
22,
23,
24]. The most important are risk diversification [
25,
26,
27] and inflation hedging [
6,
28]. However, every portfolio is different, which means that adding a forest asset will not have the same effect on improving the risk-return ratio of a portfolio [
49]. The Modern Portfolio Theory [
50] and current investment practice place great emphasis on minimizing the motioned risk-return ratio, that is, maximizing the portfolio risk-adjusted return. Accordingly, Busby et al. [
25] collected data on returns of forestry investments around the globe and constructed the optimal portfolio consisting only of forest assets. Under the assumption that examples involving investors holding portfolios based solely on forest assets are exceptionally rare, and that this approach cannot fulfill the important (maximum) risk diversification postulate [
27], we offer an approach relevant to a majority of investors in securities. The findings of this study are suitable for all investors who are considering buying shares in forestry companies in order to meet and implement the sustainable investing concept. However, each portfolio manager should adhere to Modern Portfolio Theory principles when evaluating the risk and return of adding forestry investment into existing investment portfolios [
49].
5. Conclusions
The analysis shows that investing in publicly traded forestry companies across the globe does show a certain economic justification. The return-based comparison shows that investing in forestry made it possible to achieve double returns than investing in U.S. Treasury bonds, respectively three times higher returns than investing in gold. The more important conclusion is that the long-term capital-market performance of forestry companies on average is positive and likely to be positive in the future. Thus, the recommendation is that a prudent portfolio manager should consider investing in the forestry sector given that the risk-return contribution of these stocks may be beneficial for a specific investment portfolio.
Forestry companies that are involved in additional business activities, besides silviculture and forest management, showed significantly better business results. Moreover, companies involved in sawmilling and the production of final products (e.g., furniture) had better investment returns than those involved only in sawmilling. The highest returns are evident in cases where companies are involved in paper production. More precisely, companies with the mentioned additional business activities (sawmilling, final products production, and paper production) had the best historical performance from an investors’ standpoint. This leads us to an indicative conclusion that forest ownership, together with the length of a value-added chain, is a crucial characteristic when considering buying shares in forestry companies. Furthermore, this analysis shows that the common assumption of positive risk-return relation is also true for forestry companies. Namely, forestry company sub-groups with different lengths of the value-added chain on average differ in total returns and beta coefficients. Thus, investing in companies with shorter value-added chains (sub-group A, B, and C) will result in less volatile and lower returns than investing in those with longest value-added chains, and vice versa. The presence of three companies with negative beta coefficient values (one in sub-group A and two in sub-group B) reveals the potential investment benefits of these stocks in times when the overall capital market goes down.


