Article

The Synergy of Patterns vs. Processes at Community Level: A Key Linkage for Subtropical Native Forests along the Urban Riparian Zone

1
College of Horticulture and Landscape, Southwest University, Chongqing 400716, China
2
Chongqing DONEHOME Landscape Architecture Planning Design Co., Ltd., Chongqing 401120, China
3
Chongqing Natural History Museum, Chongqing 400711, China
*
Author to whom correspondence should be addressed.
Forests 2022, 13(7), 1041; https://doi.org/10.3390/f13071041
Submission received: 17 March 2022 / Revised: 28 June 2022 / Accepted: 29 June 2022 / Published: 1 July 2022

Abstract

:
Riparian zones possesses unique ecological position with biota differing from aquatic body and terrestrial lands, and plant–animal coevolution through a propagule-dispersal process may be the main factor for the framework of riparian vegetation was proposed. In the current study, the riparian forests and avifauna along with three subtropical mountainous riparian belts of Chongqing, China, were investigated, and multivariate analysis technique was adopted to examine the associations among the plants’ and birds’ species. The results show that: (1) the forest species’ composition and vertical layers are dominated by native catkins of Moraceae species, which have the reproductive traits with small and numerous propagules facilitating by frugivorous bird species, revealing an evolutionary trend different from the one in the terrestrial plant climax communities in the subtropical evergreen broad-leaved forests. The traits may provide a biological base for the plant–bird coevolution; (2) there are significant associations of plant–bird species clusters, i.e., four plant–bird coevolution groups (PBs) were divided out according to the plant species’ dominance and growth form relating to the fruit-dispersing birds’ abundance; (3) the correlation intensity within a PB ranks as PB I > II > IV > III, indicating the PB I is the leading type of coevolution mainly shaped by the dominant plant species of Moraceae; (4) the PB correlation may be a key node between patterns vs. process of a riparian ecosystem responsible for the riparian native vegetation, or even the ecosystem health. Our results contribute understanding the plant–animal coevolution interpreting the forests’ structures in riparian environments. The results may also be used by urban planner and managers to simulate the patterns for restoring a more stable riparian biota, a better functioning ecosystem in subtropical zone.

1. Introduction

Riparian zones are narrow, open ecosystems [1] in which biota exhibit distinct water-land edge effects. Riparian forests in the ecosystem greatly contribute to riparian environments, biodiversity, and ecosystem services. It is now generally accepted that riparian forest vegetation structure [2], species composition [3] (p. 80), community aggregation and interspecific interactions [4], and biodiversity are constrained by a variety of biotic–abiotic environments and ecological processes [5,6] (p. 308).
The theories of riparian zone vegetation pattern formation in ecology to date can be broadly divided into two categories. One kind of view, represented by the Catford and Jansson (2014) [7] review, focuses on abiotic factors that stress plants of hydrology and topography, which are considered to be the most important factors affecting vegetation [8,9,10,11], such as soil conditions, flooding, disturbances [12], and land use types [13] (p. 143). The above works successfully explained the distribution patterns of riparian plant communities based on hydrology and topography, e.g., the grass-shrubs-woods series from low to high water level ashore. However, the theories are difficult to elucidate the species composition of forests and their aggregation processes (e.g., [14]).
Another view is that ecological processes of interactions among species [15], such as coevolving mutualisms of plant–animal species [16], determine forest community structure, dynamics, and, even, ecosystem function. For example, Rogers (2021) [16] recently noted that seed dispersers have cascading effects on plant communities and ecosystems as well, which dynamics are governed by core ecological processes (e.g., process-based meta-community, see [17]). This view can be backdated to the early 1980s when Herrera and Jordano (1981) [18] found significant differences in symbiotic relationships between plant juvenile colonization and habitat preferences of riparian birds. It suggests that reciprocal associations between plant fruits and seed-dispersing animals build a kind of plant–animal coevolution.
However, the current stage of river restoration theory is more prone to abiotic determinism [11]; and people’s interpretations for species’ distribution and abundance also often ignore ecological processes [19]. For example, in response to environmental stresses, riparian plants often adopt four life-history strategies: invasion, tolerance, restoration, or avoidance, as reviewed in [12]. Moreover, this view is generally accepted by Catford and Jansson (2014) [7], which systematically summarized the specializations of the functional trait in a total of 35 items, involving physiological, morphological, anatomical, biochemical, phenological, seed dispersal, and settlement adaptations of riparian plants. However, the traits listed in their article almost exclude plant–animal coevolution. We think that the above strategies and their adapting characteristics have an escape tendency in general, i.e., plants can only passively adapt to the undesirable abiotic riparian environments. However, if plant–animal coevolution does exist, it can be assumed that riparian plants should exhibit active adapting traits that match the ecological processes of the animal community i.e., trait matching [16,20]. Recently, studies have suggested that coevolution may be a major process shaping species traits [5], as reflected in changes in seed size [21] and in dispersal syndrome [22], and in the highly interwoven ecological networks of the interactions between plants and animals [16].
However, the plant–bird coevolution has been disputed from the beginning [18] and has so far been ignored by ecologists, as recently Dobson et al. (2020) [3] pointed out. For riparian vegetation, despite early predictions, animals can also greatly broaden forest success pathways through foraging behavior (e.g., [23]), although there is a negative report in Japan made by Sakio (2020) [24] (p. 222), who noted after three decades of long-term observations deer gnawing plant leaves leading riparian vegetation decline. What is more, riparian vegetation serves a variety of bird species by providing nutrition, shelter, nesting sites, migration corridors, and roosting, providing the material basis for a mutually beneficial symbiosis that accelerates bird diversity [9]. This mutual association provides evolutionary directional selection pressure for frugivorous birds [25], changes bird community structure [26], and enhances their stability [27]; and it is further confounded by the high heterogeneity in riparian plant–animal synergy and the different configurations of plant–animal types of action [28]. However, there is a lack of in-depth evidence for the coevolutionary hypothesis, especially for plant–animal associations in riparian zones [20,25].
Many of the world’s largest cities are located along riverbanks. Riparian zones serve as corridors of urban landscape ecological patterns and are associated with the ecological processes of animal access to the matrix along the corridor [29] (p. 436). Urban forests along the riparian corridor have an important role in riparian forest plant settlement, structure formation, and urban planning [30]. Murgui and Hedblom (2017) [13] (pp. 137, 154) state that riparian habitats should be studied more intensively because riparian corridors support higher diversity.
In this study, the riparian zones of three typical rivers in Chongqing, China, were selected as study area. Where, the biota of plant species and the frugivorous bird species’ parameters was investigated, including species composition and plant layer structure of the riparian forests, and the riparian belts’ environmental characteristics were recorded as well. On this basis, correlation analyses were conducted among plant species importance values and vertical structure parameters of riparian forests, and the population size of frugivorous bird species. The objectives were: (1) to test the hypothesis of plant–bird coevolution in riparian belts at the community level; (2) providing evidence for the hypothesis of coupling patterns and processes; and (3) to identify the mechanisms underlying plant–bird coevolution of matching traits of plant adapting to birds by analyzing the trait characteristics of dominant species in the riparian forests.

2. Materials and Methods
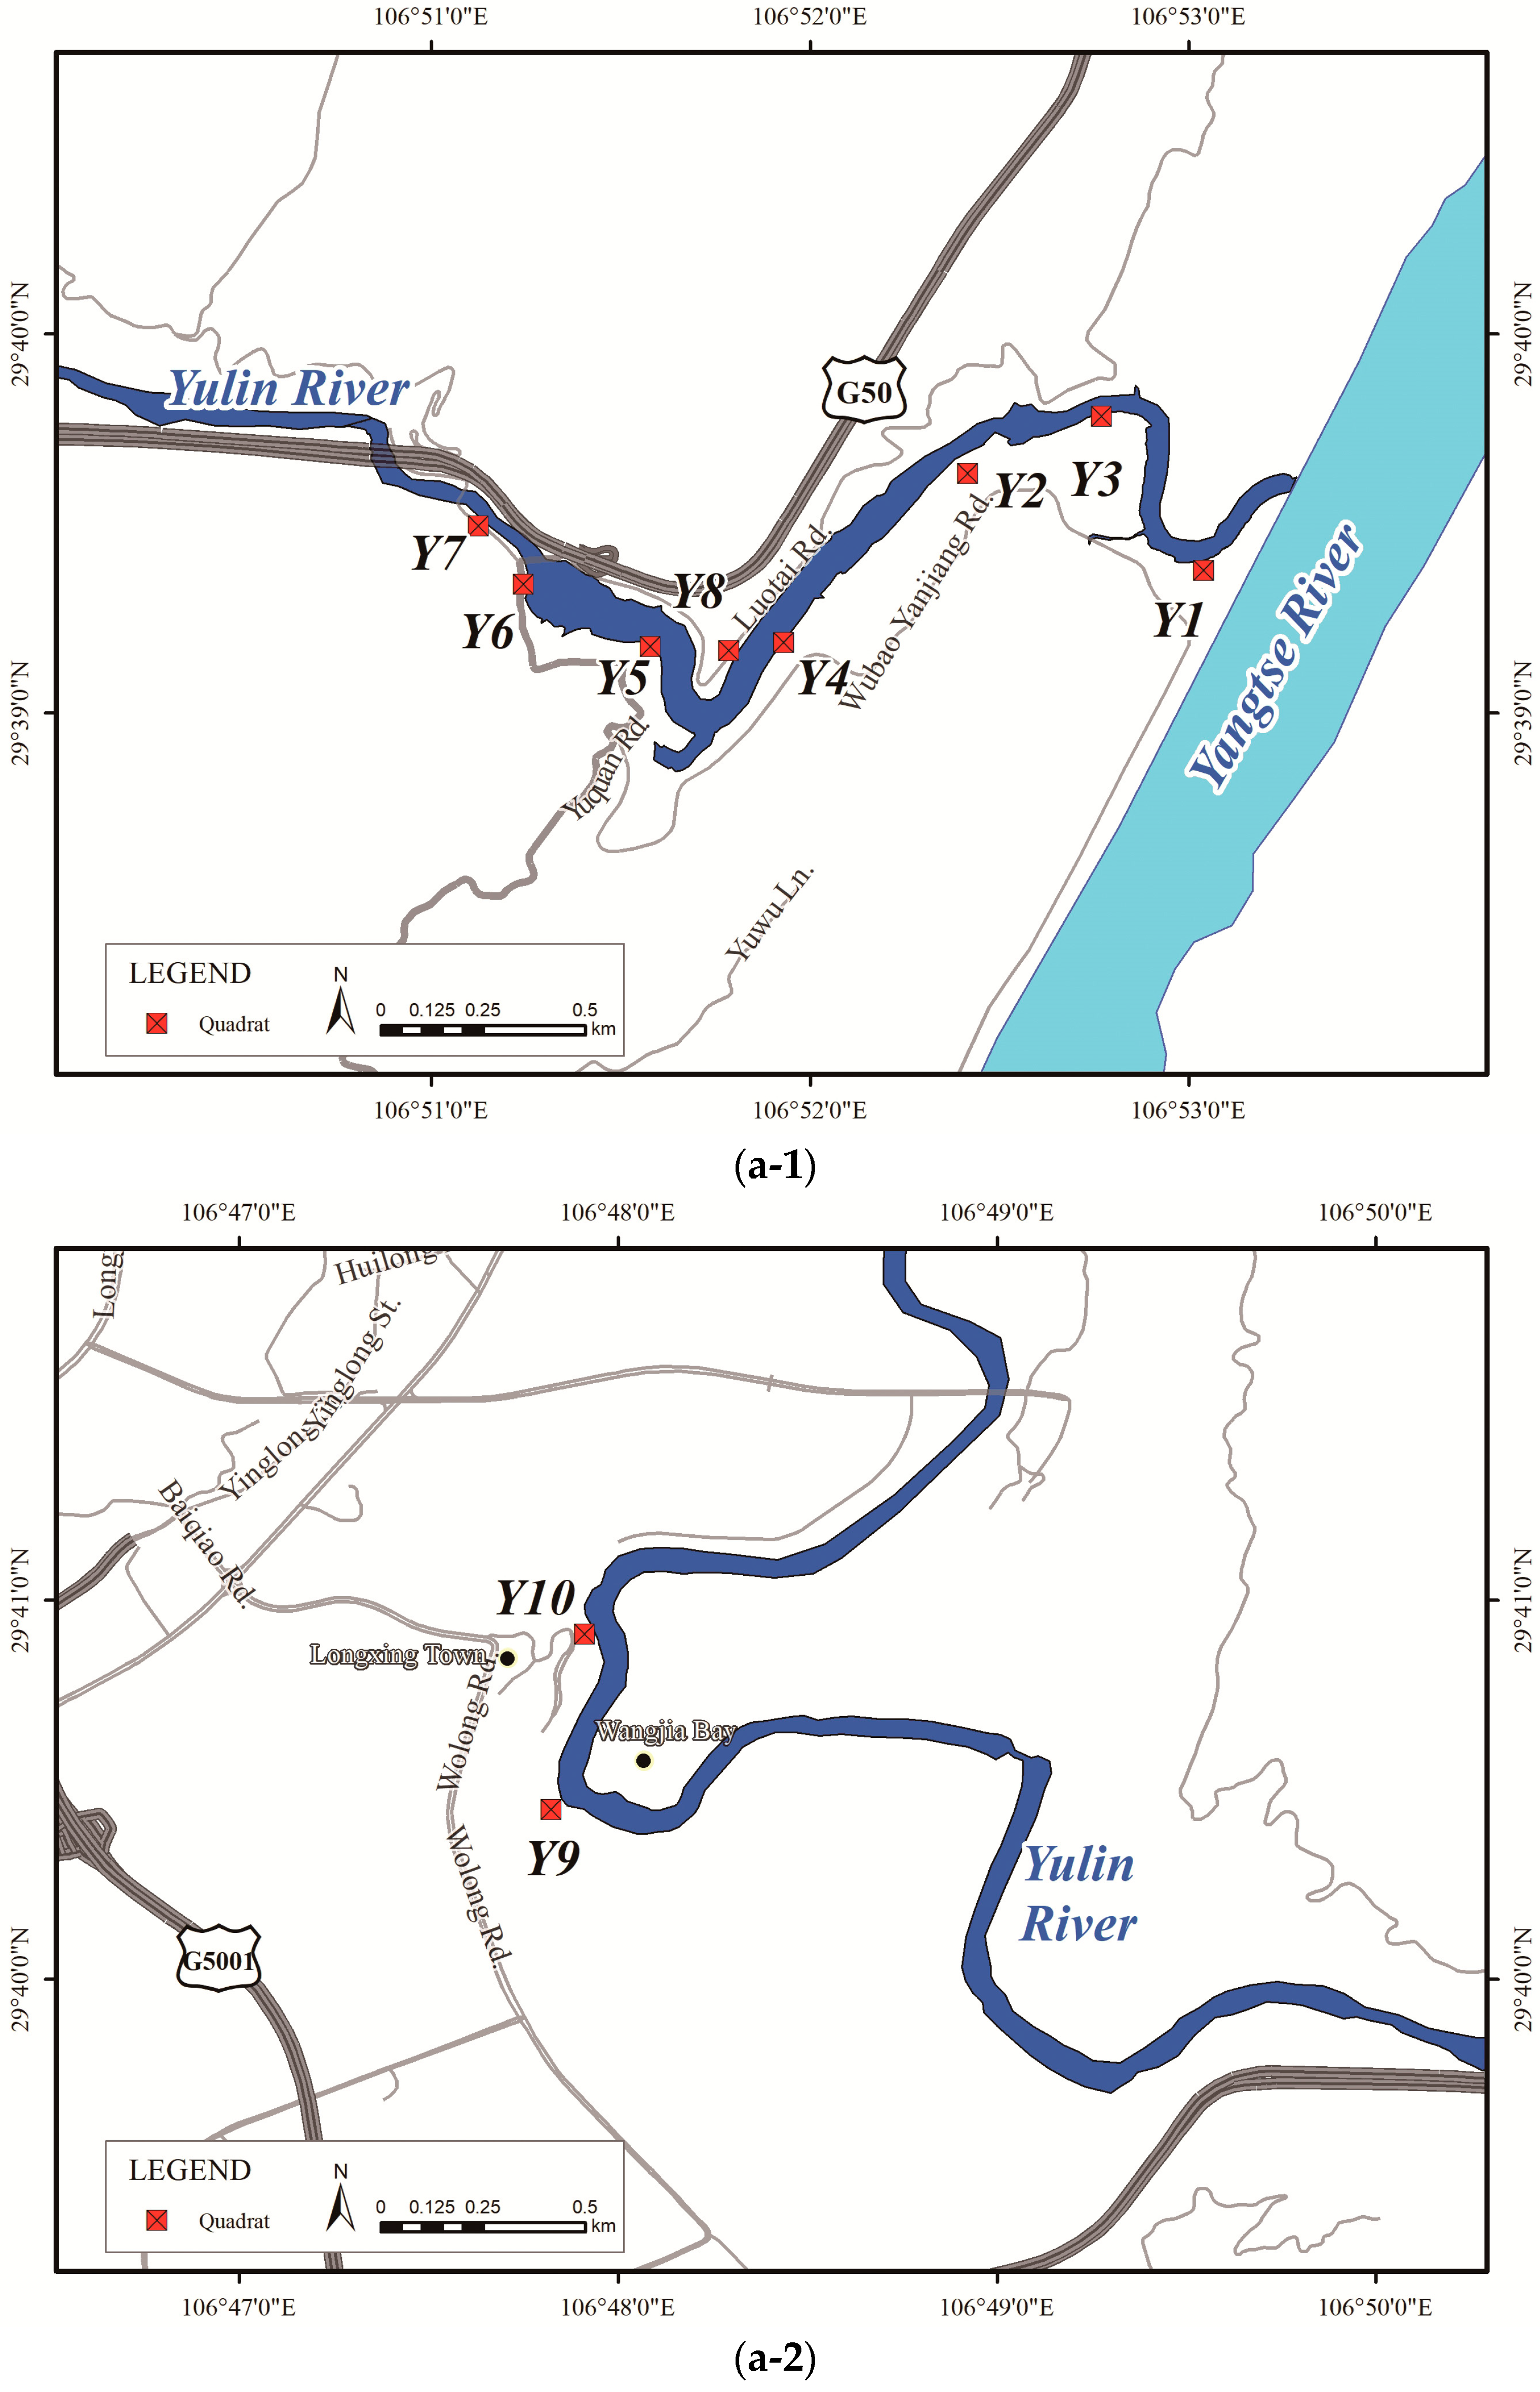
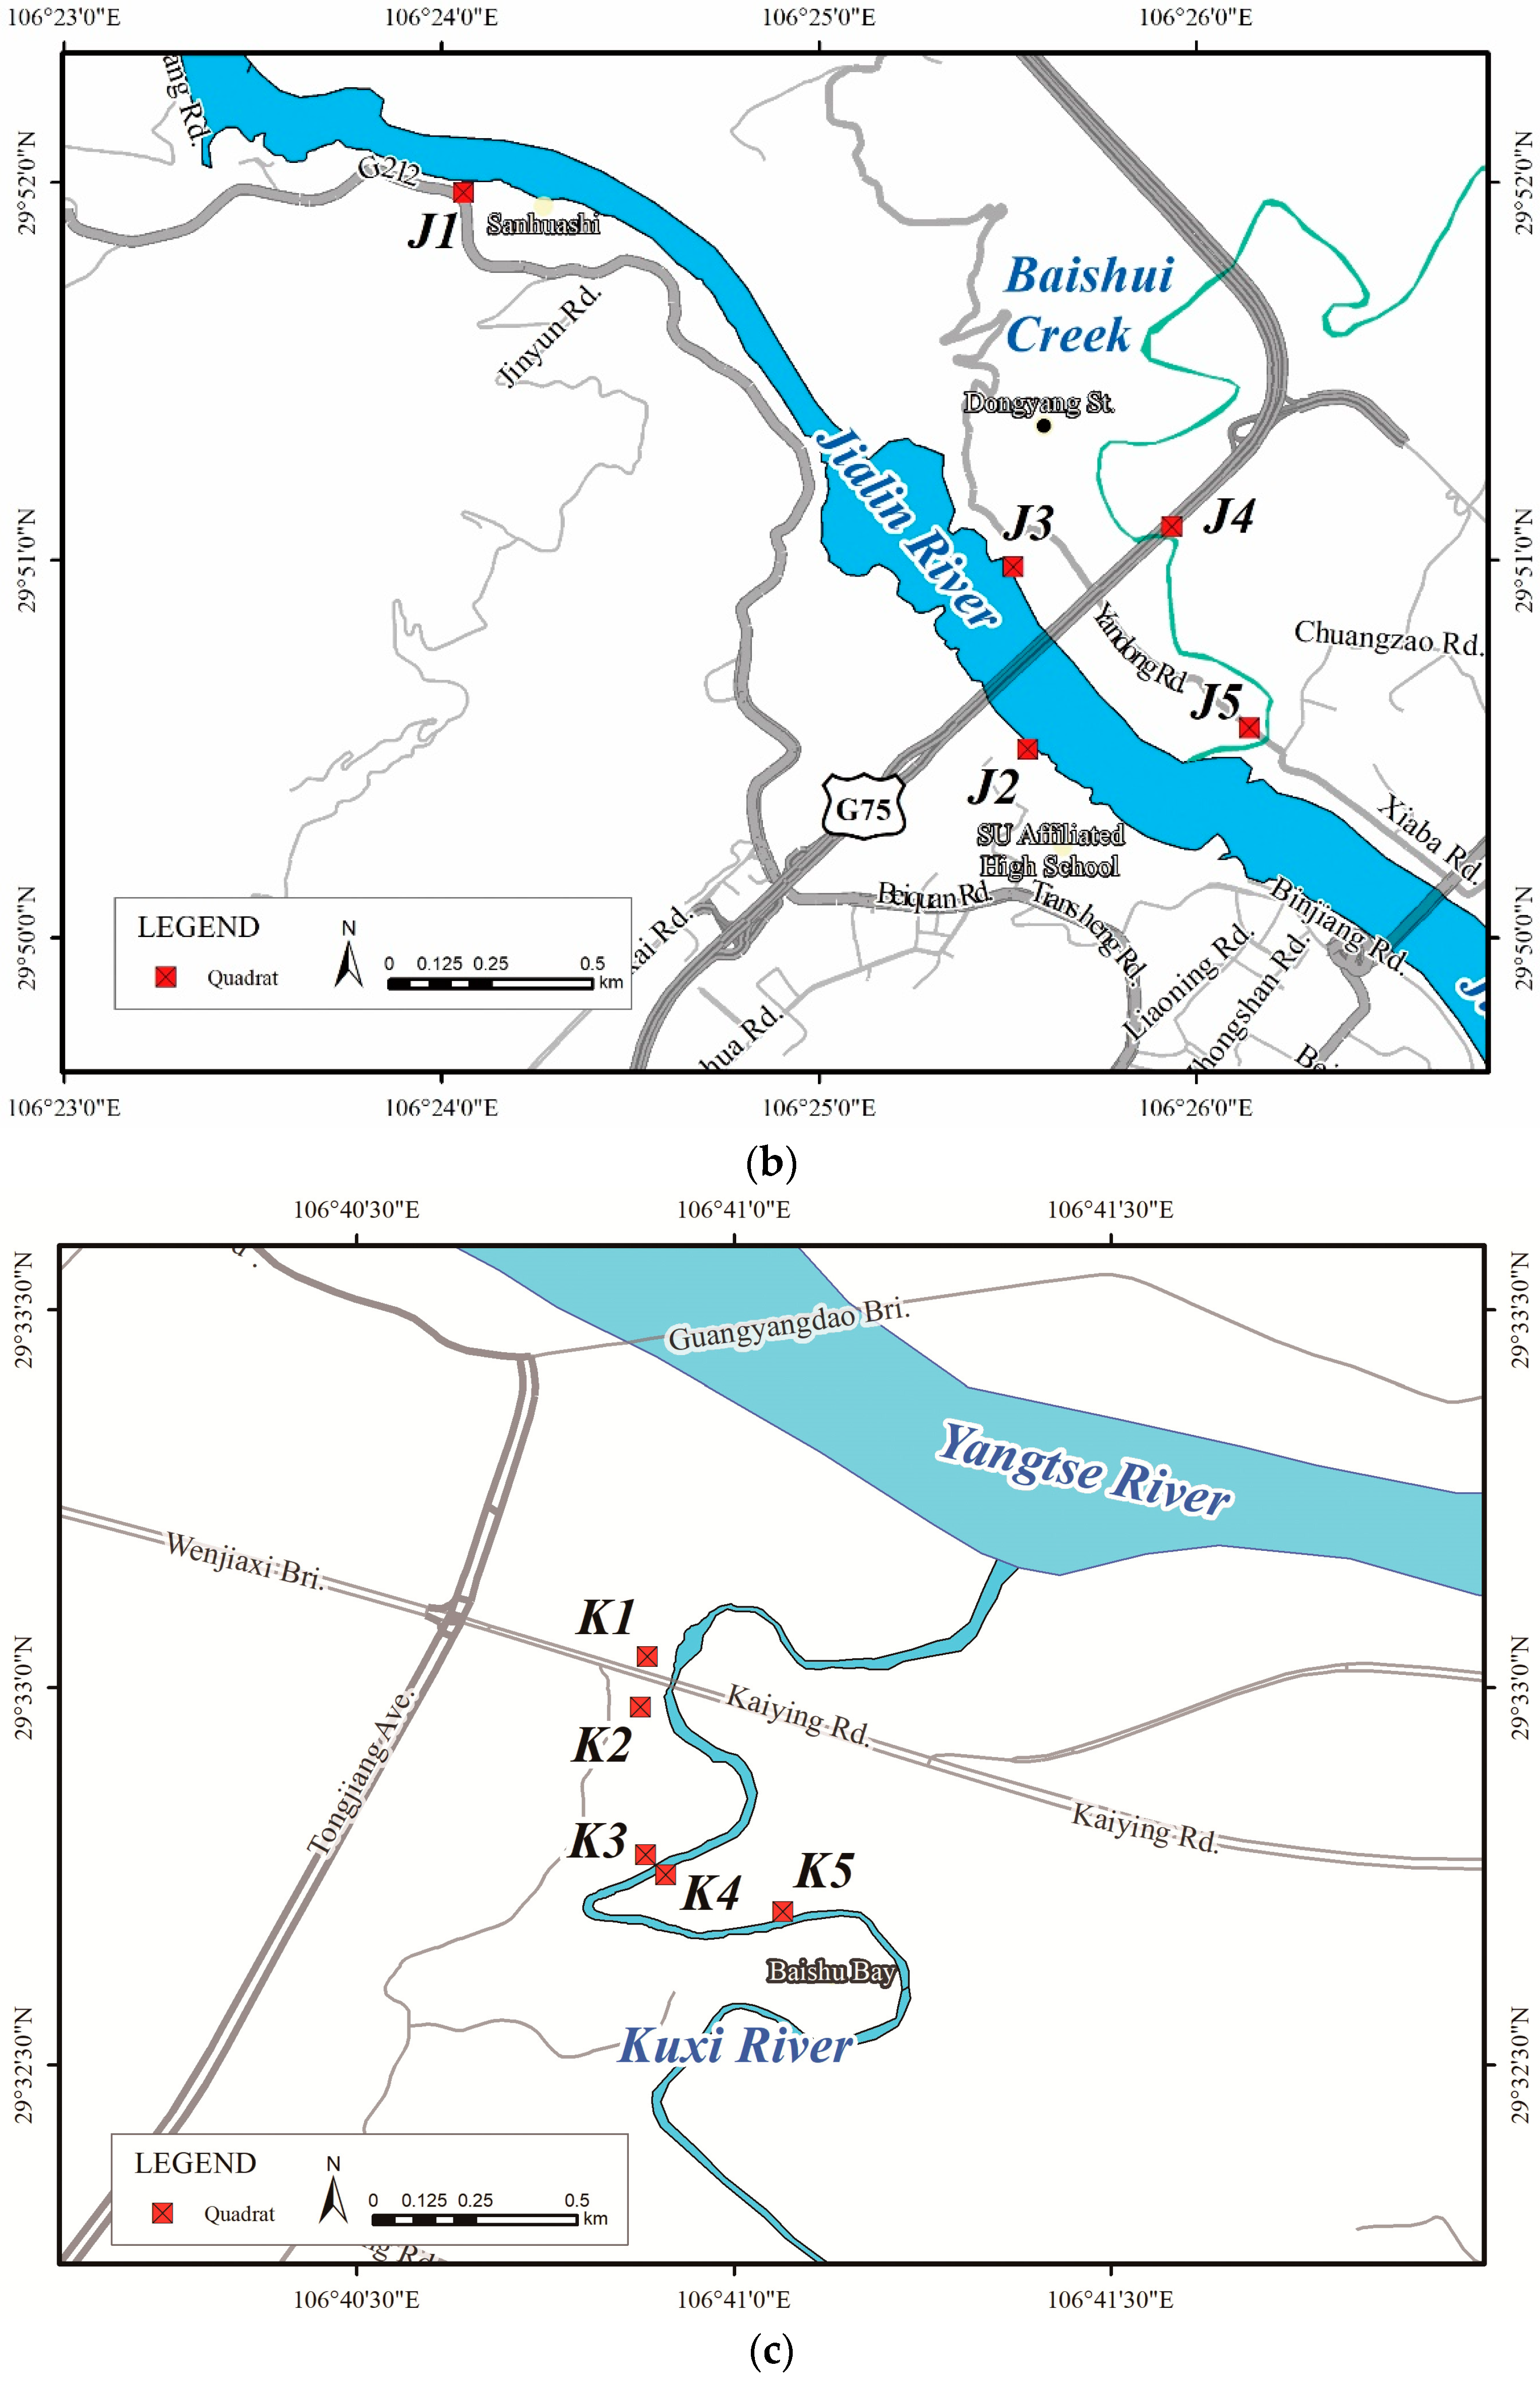
2.1. Study Area

The study sites are located in Chongqing, the central city of the upper reaches of the Yangtze River in western China; its intense built-up area is concentrated at the confluence of the Yangtze River and Jialing River, where there is a large riparian area. The local mean annual temperature is 16–18 °C, and the annual precipitation is 1000–1400 mm with the highest runoff occurring in July and August. The sampling sites of plant communities are located on the riparian zones of the Jialing River, Yulin River, and Kuxi River, which are the typical riparian spaces of the Yangtze River in the city. Plus, the birds’ surveys were executed along the Yulin River and Yuxi River (a branch of the Yangtze River near the city center) in 2019. Among the sampling sites, the sampling transect along the Jialing River’s banks was 45.1 km long, and the water level there fluctuates from 176.6 m to 214.0 m; and due to the wide river width of the Jialing River, the riparian zones is relatively large, where the riparian vegetation is flooded more extensively. The Yulin River covers an area of 52.97 hm2 in Chongqing. The Kuxi River is 25.2 km long and is a typical mountain river with its curved course. Compared to the Jialing River, the river surface of the Yulin River and the Kuxi River are narrower, and the water levels are changeless, so the riparian forests there suffer less inundation.
To investigate the species and distribution attributes of the vegetation in the riparian forest, riparian sections with typical zonal forests from the middle and lower reaches of the three rivers were selected as the sampling sites with a total number of 20 sites in 2018–2020, taking count of the Jialing River and its tributary Baishui Creek. Their locations and brief conditions were shown in Figure 1a-1,a-2,b,c and Table 1. The natural and semi-natural woody plant communities from the banks to the riverfront were investigated, excluding bamboo species and urban artificially cultivated ornamental vegetation.

2.2. Sample Investigation of Forest Communities

The vegetation survey steps are as follows: (1) To set elevation belts: given the fact that the riparian community types vary to the different elevations from the riverfronts, the elevation belts were divided according to the elevation and topography of the sampling sites. The water level in dry seasons was used as the benchmarks and the elevation interval was set as 5 m, taking into account that the elevation difference in the Jialing River’s banks is 30 m, and those of the Yulin River and Kuxi River are 20 m and 10 m, respectively, resulting 2–6 belts assigned for each river; (2) forest community woody plant sampling: vegetation sample plots were in the size of 10 m × 10 m or 20 m × 5 m, with 213 plots in total distributing in each elevation belts. The woody plant species parameters such as coverage, height, diameter at breast height (DBH), crown range, and phenological period were recorded, as well as the environmental condition at the plots, such as river name, river width, latitude and longitude, elevation, slope, slope direction, and relative elevation from the waterfront.

2.3. Parameter Calculations

2.3.1. Calculation of Importance Value

The number (i.e., abundance), frequency (i.e., evenness), and relative importance value (RIV) of trees and shrubs inside the riparian zones were calculated per plot. RIV of tree layer was calculated by dividing the sum of relative abundance, relative significance, and relative frequency by 300 (to obtain a percentage; similarly hereafter); RIV of shrub layer equaled to the sum of relative abundance, relative coverage, and the relative frequency that divided by 300; relative abundance was obtained by dividing the abundance of a species by the sum of the abundance of all species that multiplied by 100; relative significance was gained by dividing the cross-sectional area at breast height (CSA bh) of a species by the total CSA bh of all species, and multiplying by 100; relative frequency was the ratio of the frequency of a species by the total frequency of all species that multiplied by 100 [31].

2.3.2. Identification of Dominant Species

The mean importance values (MIV) of a plant species in the same layer were first respectively calculated of each river; the average MIV of all the riparian woody species were then obtained by adding up the MIV of the same species in the same layer beside the three rivers and dividing the sum by 3 (following to [31]; see Supplementary Material Table S1 and Figures S1 and S2 for details); the top five plant species in the tree and shrub layer were hereby identified as dominant plants based on MIV. In addition, the identity of native or exotic species was determined by referring to the work of Yang et al. (2009) [32].

2.3.3. Animal Community Parameters

We conducted 3 years of observations on birds in the riparian zone of the urban waterfront from 2019 to 2021, in April–June and September–October each year; especially more observations were made during May 2020 after the epidemic was decontrolled. The sampling sites were located in three rivers, namely Longfeng Creek, the Kuxi River, and the Yuxi River, as marked in red on the map (see the Supplementary Material Figures S1 and S2). Among them, Longfeng Creek is a tributary of the Jialing River, and the survey sample line was about 14.6 km long. The the Kuxi River survey was from the mouth of the Yangtze River in Guangyang Island to Changshengqiao Town, with a length of 13.2 km; the Yuxi River is a tributary of the Yangtze River, from the mouth of the Yangtze River in Guangyang Island to the front of Yinglong Lake National Wetland Park, with a survey sample line of about 9.5 km (following to [33]).
The investigations on bird species were conducted on clear days, arriving at one end of the target river section before 8:00 a.m. The observer, dressed in a full set of camouflage clothing, walks along one bank or along the opposite bank of the river, walking from the beginning to the end without interruption, observing with the naked eye and binoculars on bird species in the forest (including grassland and agricultural land) along the riverbank, and recording the birds’ foraging behavior; the observation lasts until after 5:00 p.m. Each river was surveyed for about 6–7 days per year to obtain the species and number of birds feeding on plants in that section of the river, combining with the literature review [34].
On the birds’ population size, if the most visible population of the focused species was up to tens of birds, their number was set to level 3 (see Supplementary Material Table S1, below); if the bird species were generally visible in flocks of 5–8 birds, occasionally up to 10 or more, their number was set to level 2; if the species were 1–2 birds in most cases, their number was set to level 1.

2.4. Data Analysis

To examine the correlation between the structures of forests communities and the variation of bird communities, we applied the analysis in CANOCO software, version 5.1 [35]. As for functional traits of plants, considering that various methods were used to calculate MIV in a different layer (i.e., tree–shrub–ground layer), the growth form (GF) was added as a species variable, with the plant’ increasing height assigned values of 3, 2, and 1 for trees, shrubs, and grasses, respectively. The feeding habits of birds on riparian plants were primarily determined according to [36], and the population sizes and feeding habits of birds were classified at three levels, with 3 for dominant species, 2 for common species, and 1 for rare species, as shown in Supplementary Material Table S1 and Figures S1 and S2.
Before performing direct multivariate technology of redundancy analysis (RDA), detrended correspondence analysis (DCA) was conducted to decide whether unimodal or linear technology should be applied [37] (p. 183). The result showed that all the lengths of the gradient were smaller than 3 after DCA, so a linear approach should be adopted to analyze the plant–animal correlation. Using bird abundance data as environmental variables, we tested the effects of bird abundance upon the structure of plant communities by following the methodology of Carlson et al. (2010) [37,38] (p. 168) and [39].
All data were pre-transformed according to their characters to improve the normality for RDA: bird abundance and GF were square-root-transformed; MIV was log-transformed with log (100×x + 1). During the processes of analysis, the bird species abundance was selected as the explanatory variables, and MIV and GF were the responsible variables which were then centered and standardized by error variance [35] (p. 21). A permutation test was performed on the first constrain axis [35] (p. 393), and Monte Carlo permutations was selected unrestrictedly and set seeds as 945 and 23,239 under a full model in permutations = 499. An additional RDA was conducted to test the correlation between bird abundance and MIV, adopting the same procedure as the former one, but MIV was the only responsible variable here.
Because biotic interactions influence species assemblages [40], symbiosis is a state of survival optimization based on community clustering. Due to the study area is located in an urban zone and human disturbance is inevitable, we not only examined the ordinal continuity among species but also grouped and clustered the riparian plants to find vegetation discreteness or assemblage. The plant species were divided by the results of RDA for the case scores (CaseE) which were the linear combinations of environmental variables on the first and the second axis of the RDA biplot, and by the position where the plants and birds in the quadrant of RDA biplot.
To examine the effects of multiple factors including river widths, bank types, slope gradients, slope orientations, and layer on the MIV of dominant species, we adopted a generalized linear model (GLM). STATISTICA software version 6.0 was used for the ANOVA, and post hoc Fisher LSD tests were used for the variance comparisons between two groups.
To test the co-aggregation of plant–bird, we built the correlation matrix between bird abundance and plant traits (MIV and GF). The result correlation matrix was used for the cluster analysis of PB, with distance measure selected as Manhattan distance, and hierarchical clustering method as a complete linkage method. Combining the clustering results and the RDA biplot quadrants, plant–bird groups were divided, and the coefficient was averaged for each group as the correlation closeness of plant and bird within a PB. The correlation matrix was computed using the ggcorrplot package (version 0.1.3 [41]) in R, and the cluster analysis was realized by the dist and hclust functions in R’s stats package [42].

3. Results

3.1. The Species Composition of Forests and Their Dominant Species in Each Vertical Layer

There were 53 species from 45 genera in 28 families in the riparian forests by the three rivers, among which 13 species were evergreen plants and 40 were deciduous. Moreover, 37 species of plants were trees and 36 were shrubs; 83% of the species were native and 13% were exotic plants.
The top five dominant species in the tree layer, which MIV ranking as Broussonetia papyrifera (=0.158, Moraceae; for the thriftiness’ sake, the species’ authority of a Latin binomial names is omitted in the main text, the relative details are in the Supplementary Materials Table S1), similarly hereinafter), Erythrina variegata (=0.155, this species was omitted due to it is an exotic plant spread by humans which is studied in another article), Pterocarya stenoptera (=0.123), Ficus virens (=0.104, Moraceae), Morus alba (=0.080, Moraceae), and Cornus quinquenervis (=0.043); the top five dominant species in the shrub layer ranking as Morus alba (=0.215, Moraceae), Broussonetia papyrifera (=0.145, Moraceae), Salix variegata (=0.084), Cornus quinquenervis (=0.063), and Debregeasia longifolia (=0.0539); and those in the ground layer as Ficus tikoua (=0.199, Moraceae), Broussonetia papyrifera (=0.182), Morus alba (=0.166), Cornus quinquenervis (=0.027), and Salix variegata (=0.020).
The MIVs of Moraceae plants in the three rivers (means = 0.127) was significantly higher than that of the other 27 families (means = 0.0195; t-test, p < 0.001); its mean value was 6.5 times than the rest. Among the dominant species above, Broussonetia papyrifera, Ficus virens, and Morus alba cover all the three rivers, while Pterocarya stenoptera and Debregeasia longifolia are distributed along the Jialing and Yulin Rivers, and Salix variegata and Cornus quinquenervis were found only by the Jialing River.
In addition, a GLM test of MIV of these dominant species with river widths, bank types, slope orientations, and layer reveals that MIV is not related to these factors (r2 = 0.477, p = 0.065), indicating that the effect of abiotic factors of the three rivers on MIV was not significant.

3.2. The Interspecies Associations of Plant Communities

The ordination biplot of RDA multivariate analysis was shown in Figure 2. The cumulative percentage variance of plant-species correlations were 20.2% on Axis 1 and 3.4% on Axis 2. In the diagram, the MIV and GF arrows diverged from each other. The first axis was mainly dominated by the MIV of plant species variable, and the second axis is mainly dominated by GF. The test of significance of the first canonical axis showed that pseudo-F = 15.97, p = 0.048 (<0.05). The model’s r2, i.e., the additional RDA test of the bird–MIV relationship presented the adjusted explained variation as 20.1% (identical to the 20.2% on Axis 1), and the permutation test on Axis 1 showed that pseudo-F = 33.4, p = 0.012.

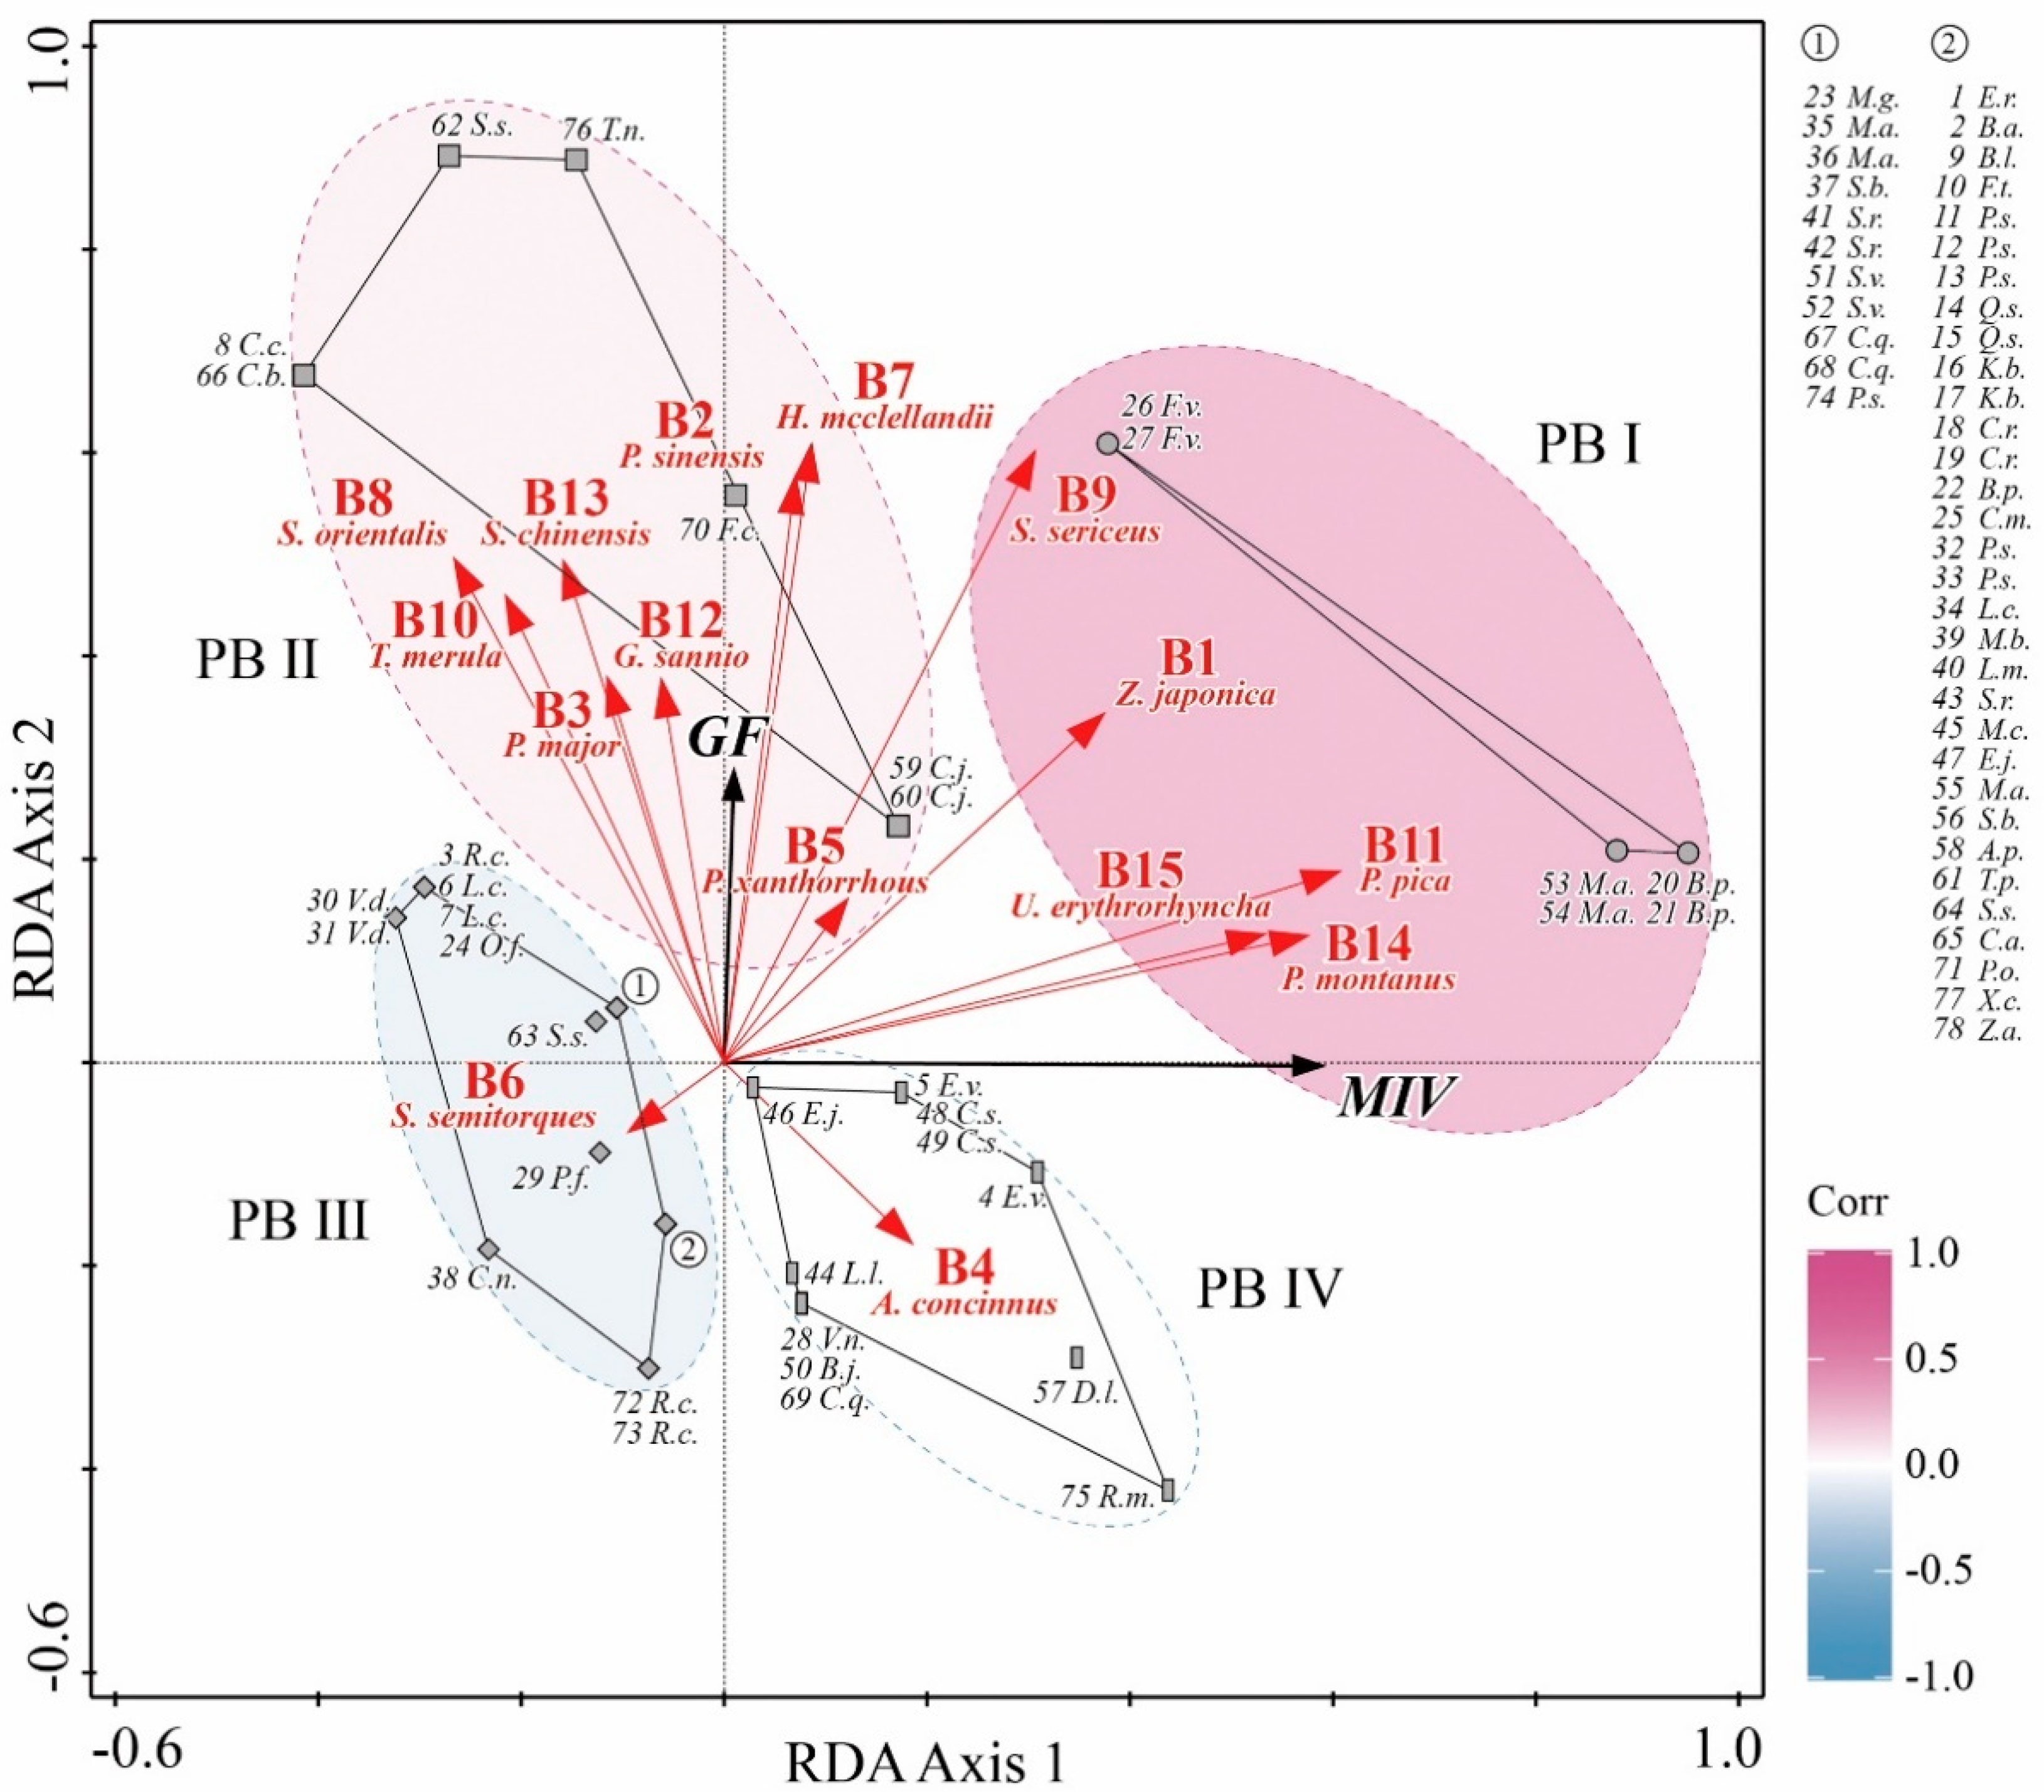
3.3. The Associations and the Closeness between Plants and Birds

The plant and bird species assemblages were distinct amongst four PBs across the four quadrants in the biplot as shown in Figure 2. PB I contained six species, including the dominant species at the tree and shrub layer in the plant communities (Broussonetia papyrifera, Ficus virens, and Morus alba). These trees and shrubs were dominant in the first quadrant, which plants produce reddish fruits, either with a considerably long projection on the axis 1 (including trees and shrubs of Broussonetia papyrifera and Morus alba; see Figure 2) or with both a certain projection length on the axis 1 and a longer projection on the axis 2 (like trees and shrubs of Ficus virens; see Figure 2). The birds coupling with the plants in PB I were the Zosterops japonica (b1), Sturnus sericeus (b9), Pica pica (b11), Passer montanus (b14), and Urocissa erythrorhyncha (b15).
The birds in PB II has seven species distributed on both the first and the second quadrant of the biplot, projecting long length on the vertical axis. This group mainly consisted of the plants in the family of Lauraceae, which are tall, relatively few, and able to produce bird-favored fruits for the eight frugivorous species (Figure 2), and these plants included Cinnamomum camphora, Cinnamomum japonicum, Cinnamomum bodinieri, Sapium sebiferum, Ficus concinna, and Trema nitida. Their fruit color is predominantly purple-black (>87%). There were eight arrows of bird variables have small angles to the GF variable (Figure 2), including Pycnonotus sinensis (b2), Parus major (b3), Pycnonotus xanthorrhous (b5), Hypsipetes mcclellandii (b7), and Streptopelia orientalis (b8), Turdus merula (b10), Garrulax sannio (b12), and Streptopelia chinensis (b13).
PB III consisted of a large number of plant species, basically gathered in the third quadrant, with a total number of 54 plants that were mainly those with high abundance and short height. The plants in this group are either short or of low MIV, providing food and habitats for only one bird species Spizixos semitorques (b6). The bird species’ inhabit on sparse grassy slopes, and are fed on seedlings of some trees and shrubs. PB III also contained a few special cases: Cornus quinquenervis and Salix variegata are the dominant species in one river zone rather than in the three rivers; Pterocarya stenoptera is the dominant species and its seedlings have a high importance value (162 plants in total, MIV > 0.123 in the tree layer). Melia azedarach is tall and its fruit flesh is also eaten by birds, but its abundance and MIV are not significant (40 trees in the three rivers, MIV of trees and shrubs = 0.033).
There is a total of 11 species of plants in PB IV distributed in quadrant 4. Some species (e.g., no. 57, 75) in this group exhibited certain dominance of MIV. Among them, some plants such as Erythrina variegata, Eriobotrya japonica, and Vitex negundo depend mainly on birds to suck nectars and eat fruit pulps but their seeds are not bird-sown; some shrubs are bird-dispersed such as Debregeasia longifolia, Celtis sinensis, and Rosa multiflora; there are also bird-dispersed trees such as Ligustrum lucidum and Bischofia javanica.
There were obvious differences in the correlation closeness within a PB among the four PBs (one-way ANOVA, F = 4.561, p = 0.011). The mean value of PB I was significantly different than the three others (post hoc test, p < 0.05), and there is no obvious difference among the left ones (post hoc test, p > 0.05; see the color shades shown in Figure 2). The result showed that the correlation strength within a PB is different from one another, and the PB I represented the main type in the plant–bird coevolution.

4. Discussion

In this study, we analyzed the correlations among the species composition, vertical structures, MIVs of riparian forest communities in a subtropical mountainous megacity, the feeding habits of riparian bird species, and their assembling between plants and birds according to their coevolution. The coupling associations are consistent with our hypothesis. Our results are consistent with theory that plant community structure patterns are shaped by the ecological processes of seed-dispersal with animals. The synergistic interactions between plant–animal communities not only mutually benefit the plants and animals themselves but also enhance the functions of the riparian ecosystem.

4.1. Characteristics of the Structural Pattern of Forests and Its Significances

Among the top five dominant plant species in the three layers of the riparian forests, there are two to three species belonging to the Moraceae species. This significantly higher dominance of the Moraceae plants in the riparian zone than the other 28 families left along the main rivers in the subtropical district, such as Chongqing, hints that first, the Moraceae plants are the leading species in the structure composition pattern of plant species. Furthermore, the Moraceae plants’ MIV are also higher across all the tree–shrub–ground layers than the other vertical ones in the forests, showing that besides species composition pattern, the vertical structure of the plant community is also governed by the Moraceae plants along the river banks; still, except for the constructive species in tree layer, their populations and saplings and seedlings grow well, hinting that their progeny settles down and the forests renew well (e.g., [43,44]) in the riparian zone.
The dominance of the tree layer indicates that the Moraceae species are decisive and dominant in the riparian forest community, implying they play a decisive role in the structure which is maintained primarily by a small number of dominant species in the tree layer [45]; large trees determine riparian zone productivity, habitat diversity, and interspecific relationships [2] (p. 144). Why have Moraceae plants become dominant in the riparian zone? That is the reciprocal selection on specific traits, and, eventually, the formation of coevolving taxa (e.g., [46]), because species morphological traits eliminate interspecific competition and promote diversity and mutualism, determining mutualistic networks [47], controlling ecosystem processes [48]. Specifically, the reproductive traits of the Moraceae species may be responsible for that due to the traits closely related to species’ settlements and reproduction under the various stressed riparian environments. The Moraceae family belongs to the catkins, which vegetative organs, roots, and stems have well-developed phloem fibers that resist water flushing; while both male and female reproductive organs are numerous and small enabling their pollens and seed spread over greater distances due to the tradeoffs between seed size and dispersal syndrome [21]. On the other hand, the small and numerous traits are different from the terrestrial climax forest species of K-strategists, which life history evolutionary trend is toward the one with large flowers and seeds, and small number presumably because the dense forests favor the evolution of large seeds there [49]. Perhaps, this issue may be worth further study.
Moreover, the success of Moraceae plants in the riparian zone means that the smaller propagules are selected by the riparian environments. First, the rich water in the riparian zone provides sufficient material for them to produce a large number of flowers, fruits and seeds. Second, unlike the stable habitats in terrestrial climax communities, abiotic factors of riparian space are highly variable which requires that the renewal niche of riparian offspring is wide enough to win. The smaller seeds just satisfy this need due to the fact that they are born to endow more variations in chromosomes per plant than fewer seeds. There are no identical sperms or ova in the world due to the crossing of homologous chromosomes during the meiotic pachytene stage, and their recombination results in a huge heritable variation among the numerous seeds. Third, both these pollen and seeds can be spread by wind and birds (according to our observations, photos), for the fruits are red-purple-black, sweet and palatable, the reproductive organs male and female inflorescences have small seeds of the three species (0.254–2.373 mg/seed) in large amounts with externally covered with mucus and indigestible hard seed-coat. As a result, the adaptable seeds carried by flying birds avoid flooding, and birds’ clustering behavior makes the large-scale and efficient spread of plant propagules into the riparian corridors, facilitating them to find suitable in the heterogeneous habitats and settle successfully.
Except for the Moraceae, we can also find the trace of dominant trees of catkin along riparian zone; in this study, there are also higher MIV species in the layers such as Pterocarya stenoptera (Carotaceae) and Salix variegata (Salicaceae), which belong to catkin plants. Compared to the subtropical native dominant riparian tree Alnus spp. (Betulaceae), worldwide such as Canadian poplars cottonwood [50], Populus alba [51], Salix boothii, and S. geyeriana [52]. These reports verify from a side that such a suite of co-adapted traits of dominants does enhance reproductive success.

4.2. The Aggregation of Plant-Bird into Taxa

In Figure 2, dominant plant species such as Ficus virens, Morus alba and Broussonetia papyrifera are aggregated into four groups. The reason for this may be related to the dispersal limits the species assemblages into phylogenetic units [53]. So, besides the many propagules plants still have further evolved “edible” propagules, including males and females, to adapt to the disturbed riparian habitat. For example, the male inflorescences of Broussonetia papyrifera can spread pollen for bird feeding, while its fruits and seeds are equally palatable; the same is true for Morus alba and Ficus virens. These functional traits together with their asynchronous fruiting phenology result in them as keystone species [54] in the riparian ecosystem.
In the present study, a similar taxa assemblage was observed for frugivorous birds. Thirteen of the fifteen bird species, except for the Streptopelia orientalis (b8) and Streptopelia chinensis (b13), belong to Passeriformes, which is consistent with the report that passerines (Passeriformes) is a dominant frugivore group worldwide [25]. Furthermore, the matching of flora–fauna forms a symbiosis combination as shown in four quadrants of Figure 2. The reciprocal food networks reflect the symbiotic associations towards an aggregating nature, and thus bird communities may be one of the most important drivers for the establishment and maintenance of riparian forest structure in this study, as stated that mutually beneficial networks enhance biodiversity by minimizing interspecific competition [55].
The distribution of PB II plants in the biplot was consistent with the GF variables and y-axis pointing. They were tall but not dominant in the community, mainly Lauraceae species, non-catkins, producing several times larger but less numerous seeds than the PB I of Moraceae plants (data from [56]), with purple-black fruits preferred by the bird species b2, 3, 5, 7, 8, 10, 12, and 13 as shown in Figure 2. The divergence of fruit color is different from PB I consistent with the hypothesis of fruit color as a disperser syndrome [57], explaining the aggregation of birds in the PB II in Figure 2.

4.3. The Advantages of the PB Coevolution and the Significance for Riparian Ecosystem

The benefits of the plant–animal mutualism is that the vertical structure of the riparian forest community is dominated by native Moraceae species that participate and dominate in the tree–shrub–ground layer and are evenly distributed. Because they are all native plants which accounted for the majority of species in the community (>87%) and alien species only accounted for 13%, indicating that the species composition of the forest is mostly natives with no dominance of exotics (except the exotic one Erythrina variegate). These native plants-dominated forests in riparian ecosystems differ from some reports stating that the proportion of alien plants is usually higher to 24%, 30%, or 46% [12] due to riparian corridors are susceptible to invasion by exotics.
A native vegetation benefit for the restoration of a riparian ecosystem, as the corridor, must have the natural matrix and features of the original landscape [58], and native tree species are also the core element when assessing a riparian habitat [59], or, diagnosing the ecological health of streams and rivers [60,61], and being changing ecosystem processes, functions, and services [62]. Moreover, avifauna habitability is an indicator of wetland health [63]. We can believe that the riparian ecosystem at these study sites is healthy, at least so far.
This native plant-dominated structure is most likely due to plant vs. frugivorous bird fauna cooperation according to our results of the coevolution of the plant–bird clusters mentioned above, as shown by the closeness within a PB group (Figure 2). First, among the 15 focused frugivorous birds, there are 6 bird community dominant species, 6 common species, and 3 rare species; almost all of the dominant and common birds feed on the fruits of Moraceae plants, especially to Ficus (see Supplementary Material Table S1). Birds dislike other vertebrates such as grass carp (Ctenopharyngodon idellus), which is also Ficus-fruit-loving, common in local rivers, can only discharge seeds in the water, causing difficulties for seeds settling down and colonizing. In addition, birds fly farther compared to other vertebrates such as the mammals facilitating seed dispersal over longer distances. The dominant plants of the tree and shrub layer, Broussonetia papyrifera, Ficus virens, and Morus alba, are evenly distributed in the three rivers and largely unaffected by abiotic factors in the rivers, also proving the note of bird-dispersal advantage, while fish and mammals were not.
There are a few special cases in both PB III and PB IV. Pterocarya stenoptera of PB III (codes 12 and 13 in Figure 2) is a dominant species and its seedlings have a high MIV (162 plants in total, MIV > 0.123 in the tree layer), but there is no evidence on the bird-dispersal of its fruits so its mode of dispersal is presumed to be hydrochory, and thus it is not favored by the ecological process of bird-dispersal and failed to show a notable status on the first biplot axis. The distribution of Pterocarya stenoptera and Debregeasia longifolia, is limited to one or two riparian zones, also indicating a disadvantage for non-bird seeded plants. Although there are different views on this, such as [64], who observed that the tree diversity is unrelated to bird species. Bird Aegithalos concinnus (b4) of group 4 that mainly inhabits in shrubs associated with the dominant species Debregeasia longifolia and Rosa multiflora in PB IV (codes 57 and 75 in Supplementary Material Table S1 and in Figure 2, respectively).
On the other hand, Moraceae plants produce such a large amount of nutrient-carbohydrate-rich fruits and seeds, which undoubtedly consume a lot of energy of the plants. This cost may be considered as a negative feedback mechanism to balance the symbiotic effects of the plants and birds which is similar to a kind of positive feedback. Of course, this hypothesis needs to be further tested.

5. Summary

The results theoretically explain the natural phenomena of forest species composition and distribution and their layer structure in the riparian zone. The note provides new evidence for proving the relationship between patterns and processes in riparian ecosystem, shedding a light on the community structure, and urban food webs [28,65] and ecosystem structural stability [5,66,67]. In practice, the results are interesting for urban planning and construction [9,68] such as subtropical riparian forest species configuration, structure construction, urban riparian forest restoration, and bird community restoration in edge effect zones along the riparian corridor [69]. In addition, the adaptive features of dominant plants in riparian zones that rely on numbers to win are different from terrestrial climax dominant species, which may be a topic for further attention.

6. Conclusions

The species composition and structural patterns of plant and bird communities and their dominance are closely related to the ecological processes between plants and dispersal by frugivorous birds. Coevolution of plants and animals may be a more critical link to the structure and health of the riparian ecosystem than the abiotic factors such as topography, geography, and hydrology. The underlying mechanism for the coevolution is riparian zone plant species have evolved positive and bird-available functional traits to adapt to riparian habitats which path to success does not lay in the size of species’ propagules but in the amounts.

Supplementary Materials

The following supporting information can be downloaded at: https://www.mdpi.com/article/10.3390/f13071041/s1, Table S1: The summary table of the basic information on the plant and birds species in the riparian rivers in Chongqing, China; Figure S1: Bird sampling line in Kuxi and Yuxi Rivers; Figure S2: Bird sampling line in Longfeng Creek.

Author Contributions

Conceptualization, H.W., D.W. and H.C.; methodology, H.W., Y.S., D.W., Z.X. and H.C.; formal analysis, D.W. and H.C.; investigation, H.W., Y.S. and Z.X.; data curation, D.W.; writing—original draft preparation, D.W. and H.C.; writing—review and editing, H.C.; supervision, H.W. and H.C.; project administration, H.W. and H.C.; funding acquisition, H.W. and H.C. All authors have read and agreed to the published version of the manuscript.

Funding

This study is supported by the Technology innovation and application demonstration special project no. cstc2018jscx-m szdX0069 of Chongqing Science and Technology Commission to H.C., and by the Technology innovation and application development special project no. cstc2019jscx-gksbX0127 of Chongqing Science and Technology Commission to H.W.

Institutional Review Board Statement

This study did not require ethical approval, the focused birds were only observed far from a distance in the fields; and the focused plant species were only recorded data in the sampling plots in the fields. All the animal and plant species did not contain rare ones.

Informed Consent Statement

Not applicable.

Data Availability Statement

The data supporting reported results can be found from Supplementary Materials.

Acknowledgments

The research was supported by Chongqing Science and Technology Commission.

Conflicts of Interest

The authors declare no conflict of interest.

References

  1. Gregory, S.V.; Swanson, F.J.; McKee, W.A.; Cummins, K.W. An ecosystem perspective of riparian zones: Focus on links between land and water. BioScience 2010, 41, 540–551. [Google Scholar] [CrossRef]
  2. Allan, J.D.; Castillo, M.M. Stream Ecology: Structure and Function of Running Waters; Springer Science & Business Media: Berlin/Heidelberg, Germany, 2007. [Google Scholar]
  3. Dobson, A.; Tilman, D.; Holt, R.D. Unsolved Problems in Ecology; Princeton University Press: Princeton, NJ, USA, 2020. [Google Scholar]
  4. Götzenberger, L.; de Bello, F.; Bråthen, K.A.; Davison, J.; Dubuis, A.; Guisan, A.; Lepš, J.; Lindborg, R.; Moora, M.; Pärtel, M. Ecological assembly rules in plant communities—Approaches, patterns and prospects. Biol. Rev. 2012, 87, 111–127. [Google Scholar] [CrossRef] [PubMed]
  5. Guimarães Jr, P.R.; Pires, M.M.; Jordano, P.; Bascompte, J.; Thompson, J.N. Indirect effects drive coevolution in mutualistic networks. Nature 2017, 550, 511–514. [Google Scholar] [CrossRef] [PubMed]
  6. Van der Maarel, E.; Franklin, J. Vegetation Ecology, 2nd ed.; John Wiley & Sons: Hoboken, NJ, USA, 2012. [Google Scholar]
  7. Catford, J.A.; Jansson, R. Drowned, buried and carried away: Effects of plant traits on the distribution of native and alien species in riparian ecosystems. New Phytol. 2014, 204, 19–36. [Google Scholar] [CrossRef] [PubMed]
  8. Stella, J.C.; Rodríguez-González, P.M.; Dufour, S.; Bendix, J. Riparian vegetation research in Mediterranean-climate regions: Common patterns, ecological processes, and considerations for management. Hydrobiologia 2013, 719, 291–315. [Google Scholar] [CrossRef]
  9. Bennett, A.F.; Nimmo, D.G.; Radford, J.Q. Riparian vegetation has disproportionate benefits for landscape - Scale conservation of woodland birds in highly modified environments. Jour. App. Ecol. 2014, 51, 514–523. [Google Scholar] [CrossRef]
  10. Forman, R. Land Mosaics: The ecology of landscapes and regions (1995). In The Ecological Design and Planning Reader; Island Press: Washington, DC, USA, 2014; pp. 217–234. [Google Scholar]
  11. Palmer, M.A.; Hondula, K.L.; Koch, B.J. Ecological restoration of streams and rivers: Shifting strategies and shifting goals. Annu. Rev. Ecol. Evol. Syst. 2014, 45, 247–269. [Google Scholar] [CrossRef] [Green Version]
  12. Naiman, R.J.; Décamps, H. The ecology of interfaces: Riparian zones. Annu. Rev. Ecol. Evol. Syst. 1997, 28, 621–658. [Google Scholar] [CrossRef] [Green Version]
  13. Murgui, E.; Hedblom, M. Ecology and Conservation of Birds in Urban environments; Springer: Berlin/Heidelberg, Germany, 2017. [Google Scholar]
  14. Lai, H.R.; Craven, D.; Hall, J.S.; Hui, F.K.C.; van Breugel, M. Successional syndromes of saplings in tropical secondary forests emerge from environment-dependent trait–demography relationships. Ecol. Lett. 2021, 24, 1776–1787. [Google Scholar] [CrossRef]
  15. De Bello, F.; Lavorel, S.; Díaz, S.; Harrington, R.; Cornelissen, J.H.; Bardgett, R.D.; Berg, M.P.; Cipriotti, P.; Feld, C.K.; Hering, D. Towards an assessment of multiple ecosystem processes and services via functional traits. Biodivers. Conserv. 2010, 19, 2873–2893. [Google Scholar] [CrossRef]
  16. Assis, A.P.; Thompson, J.N.; Santana, P.C.; Jordano, P.; Bascompte, J.; Guimaraes, P., Jr. Genetic correlations and ecological networks shape coevolving mutualisms. Ecol. Lett. 2020, 23, 1789–1799. [Google Scholar] [CrossRef] [PubMed]
  17. Thompson, P.L.; Guzman, L.M.; Meester, D. A process-based metacommunity framework linking local and regional scale community ecology. Ecol. Lett. 2020, 23, 1314–1329. [Google Scholar] [CrossRef] [PubMed]
  18. Herrera, C.M.; Jordano, P. Prunus mahaleb and Birds: The High-Efficiency Seed Dispersal System of a Temperate Fruiting Tree. Ecol. Monogr. 1981, 51, 203–218. [Google Scholar] [CrossRef]
  19. Warren, D.L.; Cardillo, M.; Rosauer, D.F.; Bolnick, D.I. Mistaking geography for biology: Inferring processes from species distributions. Trends Ecol. Evol. 2014, 29, 572–580. [Google Scholar] [CrossRef]
  20. Moor, H.; Rydin, H.; Hylander, K.; Nilsson, M.B.; Lindborg, R.; Norberg, J. Towards a trait-based ecology of wetland vegetation. J. Ecol. 2017, 105, 1623–1635. [Google Scholar] [CrossRef] [Green Version]
  21. Leslie, A.B.; Beaulieu, J.M.; Mathews, S. Variation in seed size is structured by dispersal syndrome and cone morphology in conifers and other nonflowering seed plants. New Phytol. 2017, 216, 429–437. [Google Scholar] [CrossRef] [Green Version]
  22. Escobar, D.F.; Silveira, F.A.; Morellato, L.P.C. Timing of seed dispersal and seed dormancy in Brazilian savanna: Two solutions to face seasonality. Ann. Bot. 2018, 121, 1197–1209. [Google Scholar] [CrossRef]
  23. Naiman, R.J.; Johnston, C.A.; Kelley, J.C. Alteration of North American streams by beaver. BioSeience 1988, 38, 753–762. [Google Scholar] [CrossRef]
  24. Sakio, H. Long-Term Ecosystem Changes in Riparian Forests; Springer Nature Singapore Pte Ltd.: Singapore, 2020. [Google Scholar]
  25. Eriksson, O. Evolution of angiosperm seed disperser mutualisms: The timing of origins and their consequences for coevolutionary interactions between angiosperms and frugivores. Biol. Rev. 2016, 91, 168–186. [Google Scholar] [CrossRef]
  26. McClure, C.J.; Korte, A.C.; Heath, J.A.; Barber, J.R. Pavement and riparian forest shape the bird community along an urban river corridor. Glob. Ecol. Conserv. 2015, 4, 291–310. [Google Scholar] [CrossRef] [Green Version]
  27. Nimmo, D.G.; Haslem, A.; Radford, J.Q.; Hall, M.; Bennett, A.F. Riparian tree cover enhances the resistance and stability of woodland bird communities during an extreme climatic event. J. Appl. Ecol. 2016, 53, 449–458. [Google Scholar] [CrossRef]
  28. Thébault, E.; Fontaine, C. Stability of ecological communities and the architecture of mutualistic and trophic networks. Science 2010, 329, 853–856. [Google Scholar] [CrossRef] [PubMed]
  29. Shen, Q.J. Urban Ecological Environments: Principles, Approaches and Optimization; China Architecture Publishing & Media Co., Ltd: Beijing, China, 2011. [Google Scholar]
  30. Pennington, D.N.; Blair, R.B. Habitat selection of breeding riparian birds in an urban environment: Untangling the relative importance of biophysical elements and spatial scale. Divers. Distrib. 2011, 17, 506–518. [Google Scholar] [CrossRef]
  31. Zhang, J.T. Numerical Ecology, 3rd ed.; Science Press: Beijing, China, 2018. [Google Scholar]
  32. Yang, C.; Xiong, J.; Zhong, S.; Wang, H.; Li, X. The Classification Table of Vascular Plants in Chongqing; Sichuan Science and Tecknology Press: Chengdu, China, 2009. [Google Scholar]
  33. Ma, J.H.; Liu, Y.; Lei, J.Y. Methods for Bird Surveys—A Practical Handbook; Hong Kong Bird Watching Society Limited & General: Hong Kong, China, 2006. [Google Scholar]
  34. Su, H.L.; Xiao, W.F. Status of wintering birdsalong the changjiang river of the Three Gorges. Chin. J. Zool. 2017, 52, 911–936. [Google Scholar]
  35. Šmilauer, P.; Lepš, J. Multivariate Analysis of Ecological Data Using CANOCO 5; Cambridge University press: Cambridge, UK, 2014. [Google Scholar]
  36. Zhao, Z.J. A Handbook of the Birds of China; Jilin Science & Technology Press: Changchun, China, 2001. (In Chinese) [Google Scholar]
  37. Lepš, J.; Šmilauer, P. Multivariate Analysis of Ecological Data Using CANOCO; Cambridge University Press: Cambridge, UK, 2003. [Google Scholar]
  38. Carlson, M.L.; Flagstad, L.A.; Gillet, F.; Mitchell, E.A. Community development along a proglacial chronosequence: Are above-ground and below-ground community structure controlled more by biotic than abiotic factors? J. Ecol. 2010, 98, 1084–1095. [Google Scholar] [CrossRef] [Green Version]
  39. Ter, B.; Cajo, J.; Šmilauer, P.; Dray, S. Algorithms and biplots for double constrained correspondence analysis. Environ. Ecol. Stat. 2018, 25, 171–197. [Google Scholar]
  40. Turner, M.G. Landscape ecology: What is the state of the science? Annu. Rev. Ecol. Evol. Syst. 2005, 36, 319–344. [Google Scholar] [CrossRef]
  41. Kassambara, A. ggcorrplot: Visualization of a Correlation Matrix Using ’ggplot2’. R Package Version 0.1.3. 2019. Available online: https://CRAN.R-project.org/package=ggcorrplot (accessed on 15 June 2022).
  42. R Core Team. R: A Language and Environment for Statistical Computing; R Foundation for Statistical Computing: Vienna, Austria, 2021. [Google Scholar]
  43. Clark, J.S.; Lewis, M.; McLachlan, J.S.; HilleRisLambers, J. Estimating population spread: What can we forecast and how well? Ecology 2003, 84, 1979–1988. [Google Scholar] [CrossRef]
  44. Hendriks, A.J.; Mulder, C. Scaling of offspring number and mass to plant and animal size: Model and meta-analysis. Oecologia 2008, 155, 705–716. [Google Scholar] [CrossRef] [Green Version]
  45. Begon, M.; Townsend, C.R.; Harper, J.L. Ecology: From Individuals to Ecosystems; John Wiley & Sons: New York, NY, USA, 2006. [Google Scholar]
  46. Althoff, D.M.; Segraves, K.A.; Johnson, M.T. Testing for coevolutionary diversification: Linking pattern with process. Trends Ecol. Evol. 2014, 29, 82–89. [Google Scholar] [CrossRef]
  47. Duchenne, F.; Fontaine, C.; Teulière, E.; Thébault, E. Phenological traits foster persistence of mutualistic networks by promoting facilitation. Ecol. Lett. 2021, 24, 2088–2099. [Google Scholar] [CrossRef]
  48. Westoby, M.; Wright, I.J. Land-plant ecology on the basis of functional traits. Trends Ecol. Evol. 2006, 21, 261–268. [Google Scholar] [CrossRef]
  49. Pugnaire, F.; Valladares, F. Functional Plant Ecology; CRC Press: Boca Raton, FL, USA, 2007. [Google Scholar]
  50. Rood, S.B.; Kaluthota, S.; Gill, K.M.; Hillman, E.J.; Woodman, S.G.; Pearce, D.W.; Mahoney, J.M. A twofold strategy for riparian restoration: Combining a functional flow regime and direct seeding to re-establish cottonwoods. River Res. Appl. 2016, 32, 836–844. [Google Scholar] [CrossRef]
  51. Madejon, P.; Ciadamidaro, L.; Maranon, T.; Murillo, J.M. Long-term biomonitoring of soil contamination using poplar trees: Accumulation of trace elements in leaves and fruits. Int. J. Phytoremediat. 2013, 15, 602–614. [Google Scholar] [CrossRef] [PubMed] [Green Version]
  52. Brookshire, E.N.J.; Kauffman, J.B.; Lytjen, D.; Otting, N. Cumulative effects of wild ungulate and livestock herbivory on riparian willows. Oecologia 2002, 132, 559–566. [Google Scholar] [CrossRef] [PubMed]
  53. Daru, B.H.; Elliott, T.L.; Park, D.S.; Davies, T.J. Understanding the processes underpinning patterns of phylogenetic regionalization. Trends Ecol. Evol. 2017, 32, 845–860. [Google Scholar] [CrossRef] [PubMed]
  54. Lambert, F.R.; Marshall, A.G. Keystone characteristics of bird-dispersed Ficus in a Malaysian lowland rain forest. J. Ecol. 1991, 79, 793–809. [Google Scholar] [CrossRef] [Green Version]
  55. Bastolla, U.; Fortuna, M.A.; Pascual-García, A.; Ferrera, A.; Luque, B.; Bascompte, J. The architecture of mutualistic networks minimizes competition and increases biodiversity. Nature 2009, 458, 1018–1020. [Google Scholar] [CrossRef]
  56. Chen, H.; Niklas, K.J.; Yang, D.; Sun, S. The effect of twig architecture and seed number on seed size variation in subtropical woody species. New Phytol. 2009, 183, 1212–1221. [Google Scholar] [CrossRef]
  57. Sinnott-Armstrong, M.A.; Donoghue, M.J.; Jetz, W.J. Dispersers and environment drive global variation in fruit colour syndromes. Ecol. Lett. 2021, 24, 1387–1399. [Google Scholar] [CrossRef]
  58. Yu, K.J.; Li, D.H.; Duan, T.W. Landscape approaches in biodiversity conservation. Chin. Biodivers. 1998, 6, 205–212. [Google Scholar]
  59. Munné, A.; Prat, N.; Solà, C.; Bonada, N.; Rieradevall, M. A simple field method for assessing the ecological quality of riparian habitat in rivers and streams: QBR index. Aquat. Conserv. Mar. Freshw. Ecosyst. 2003, 13, 147–163. [Google Scholar] [CrossRef]
  60. Welsh, H.H.; Hodgson, G.R.; Karraker, N.E. Influences of the vegetation mosaic on riparian and stream environments in a mixed forest-grassland landscape in "Mediterranean" northwestern California. Ecography 2005, 28, 537–551. [Google Scholar] [CrossRef]
  61. Mamun, M.; An, K.G. Ecological health assessments of 72 streams and rivers in relation to water chemistry and land-use patterns in South Korea. Turk. J. Fish Aquat. Sci. 2018, 18, 871–880. [Google Scholar] [CrossRef]
  62. Yu, X.; Yang, J.; Liu, L.; Tian, Y.; Yu, Z. Effects of Spartina alterniflora invasion on biogenic elements in a subtropical coastal mangrove wetland. Environ. Sci. Pollut. R. 2015, 22, 3107–3115. [Google Scholar] [CrossRef]
  63. Gayen, J.; Ghosh, P.K.; Datta, D. Avifauna habitability of wetlands in an intensive cultural landscape: Insights from the Ichhamati floodplains, India. Environ. Monit. Assess. 2020, 192, 1–16. [Google Scholar] [CrossRef]
  64. Izzati, U.; Hasibuan, H.S. Riparian tree and bird diversity in Cisadane River, South Tangerang City, Indonesia. Biodivers. J. Biol. Divers. 2019, 20, 595–603. [Google Scholar] [CrossRef] [Green Version]
  65. Shochat, E.; Warren, P.S.; Faeth, S.H.; McIntyre, N.E.; Hope, D. From patterns to emerging processes in mechanistic urban ecology. Trends Ecol. Evol. 2006, 21, 186–191. [Google Scholar] [CrossRef]
  66. Allesina, S.; Tang, S. Stability criteria for complex ecosystems. Nature 2012, 483, 205–208. [Google Scholar] [CrossRef] [Green Version]
  67. Rohr, R.P.; Saavedra, S.; Bascompte, J. On the structural stability of mutualistic systems. Science 2014, 1253497. [Google Scholar] [CrossRef] [Green Version]
  68. Howe, H.F. Making dispersal syndromes and networks useful in tropical conservation and restoration. Glob. Ecol. Conserv. 2016, 6, 152–178. [Google Scholar] [CrossRef] [Green Version]
  69. Stouffer, P.C.; Jirinec, V.; Rutt, C.L.; Bierregaard, R.O., Jr.; Hernández-Palma, A.; Johnson, E.I.; Midway, S.R.; Powell, L.L.; Wolfe, J.D.; Lovejoy, T.E. Long-term change in the avifauna of undisturbed Amazonian rainforest: Ground-foraging birds disappear and the baseline shifts. Ecol. Lett. 2021, 24, 186–195. [Google Scholar] [CrossRef] [PubMed]
Figure 1. (a-1,a-2,b,c) The locations of the sampling sites along: (a) the Jialing River, (b) the Yulin River and (c) the Kuxi River in Chongqing, China. The map was drawn by Danrong Wan.
Forests 13 01041 g001aForests 13 01041 g001b
Figure 2. The ordination biplot of RDA of riparian forest plant species and frugivore bird communities along the riparian belt of the Jialing, Yulin and Kuxi Rivers in Chongqing, China. Black arrows are plant variables (response variable), in which MIV is mean relative importance value of plant species in same layers; and GF is plant growth form with the higher the value, the taller the plant. Number 1–78 are the vegetation species identifiers as elaborated in Supplementary Material Table S1, and indicated in the figure with species’ name of the genus plus the species initials; in addition, the dense coordinate points in the figure are marked as ① and ②, and the plant list is listed on the right. Four ellipses circle the different PBs: PB I (plant species symbol is circle), PB II (square), PB III (diamond), and PB IV (long rectangular). Legend corr means coefficient, and the ellipses’ color shades is proportional to the coefficient value, with red representing positive correlation and blue the opposite. The red arrows denote the frugivore birds, and the arrow lengths imply the dominant values of different species. Labels b1-b15 are Zosterops japonica (b1), Pycnonotus sinensis (b2), Parus major (b3), Aegithalos concinnus (b4), Pycnonotus xanthorrhous (b5), Spizixos semitorques (b6), Hypsipetes mcclellandii (b7), Streptopelia orientalis (b8), Sturnus sericeus (b9), Turdus merula (b10), Pica pica (b11), Garrulax sannio (b12), Streptopelia chinensis (b13) Passer montanus (b14), and Urocissa erythrorhyncha (b15), which are indicated as species’ genus abbreviation plus name adjective. The solid line envelopes and the ellipses represent the vegetation species clusters and the plant–bird assemblages, respectively.
Forests 13 01041 g002
Table 1. The locations’ information of the riparian sample sites of the study area, Chongqing, China.
River NameSite No.Site LocationDry Water Level (m)Elevation Range (m)Horizontal Distance (m)Longitude and LatitudeSlope DirectionVegetation Coverage (%)Surrounding EnvironmentArea TypeDescription
Jialing RiverJ1Near Sanhuashi, Beibei District1863090 106°24′18″ N,
29°51′49″ E
26° NE60FarmlandSuburbanThe soil layer near the riverbanks is thin and dominated by stones, while the soil layer from a higher place is thick; woody plants are natural and concentrated; the upper ground is mainly farmland.
J2Near Southwest University Affiliated High School, Beibei District1813090–155106°25′48″ N,
29°50′21″ E
55° NE63Residential areaEdge of built-up areaThe soils are thick on highland, with sand and gravel dominating near the shores; the site is natural, with high herbaceous plant cover and robust woody plant growth.
J3Near Dongyang Street, Beibei District18120190106°25′45″ N,
29°50′49″ E
185° S22Mulberry groveSuburbanThe sand and gravels are widely distributed, and the soil is poor; the natural vegetation is scattered along the gentle slopes; the higher areas are regularly concentrated and accompanied by farmland.
J4Near Baishui Creek (a tributary of Jialing River), Beibei District191630–50106°25′45″ N,
29°50′49″ E
192° S80WoodlandSuburbanThe river is shallow and narrow; the subsidence area is gently sloping and silty near the waterfront; the bamboo cover is high; the woody plants are distributed in the high area above the steep slope.
J5Near the inlet of Baishui Creek, Beibei District186767106°26′23″ N,
29°50′24″ E
164° S75WoodlandSuburbanThe soil layer of the bank is thick; the slope of the riverbank is high; the woody vegetation is patchy and robust.
Yulin RiverY1Near the inlet, Jiangbei District1751031106°53′16″ N,
29°39′12″ E
339° NE90HighwaySuburbanA concave shore area with a gentle slope near the banks, and most cultivated.
Y2Near Wubao Yanjiang Rd., Jiangbei District1732050106°52′40″ N,
29°39′27″ E
314° NW50HighwaySuburbanThe site is under reconstruction, with steeper slopes near the water shore, relatively high hardened surface ratio, and thicker soil layers; the woody plants are natural and distributed in a patchy pattern.
Y3Near Wubao Yanjiang Rd., Jiangbei District1671888106°53′0″ N,
29°39′35″ E
25° N75WoodlandSuburbanThe banks are convex and curved, with farmland on the banks; woody plants are intensive; fruit trees such as citrus and loquats are planted as well.
Y4Under viaduct of Wubao Yanjiang Rd., Jiangbei District1762057106°52′9″ N,
29°39′1″ E
292° W65HighwaySuburbanThe slope is steep, and the vegetation is patchy; fruit trees such as peach, plum, and citrus are planted on the banks.
Y5Under viaduct of Yuquan Rd., Jiangbei District1682095106°51′49″ N,
29°38′59″ E
42° NE65HighwaySuburbanSmall patches of farmland area on the banks, and the slope of the higher place is steep; woody plants are natural and distributed in patches, with a large herbaceous cover.
Y6Near Yuquan Rd., Jiangbei District1722050106°51′29″ N,
29°39′10″ E
89° E70HighwaySuburbanThe banks are steep and natural, with a high tall grass cover; woody plants (mostly maple poplar) are planted artificially near the waterfront.
Y7Near Wujian Rd., Jiangbei District1822036106°51′22″ N,
29°39′19″ E
48° NE45HighwaySuburbanThe banks are cliff-like and steep, with poor soil and scattered woody plants.
Y8Near Luotai Rd., Yubei District1761024106°52′2″ N,
29°38′59″ E
110° E80HighwaySuburbanThe soil layer is thick and fertile, while the slope is high; the banks are covered by both cultivated and natural woody plants with a high herbaceous cover under the forest.
Y9Near Wangjia Bay, Jiangbei District17710123106°48′5″ N,
29°40′17″ E
69° E35HighwaySuburbanThe shore is concave and will be under construction soon; woody plants are robust and concentrated along the river; higher bare land is covered by herbage.
Y10Near Longxing Town, Yubei District172590106°48′9″ N,
29°40′45″ E
75° E85ParksSuburbanPatches of woody plants are concentrated along the gentle slope near the banks; the higher ground is a park under planning with artificial vegetation coverage.
Kuxi RiverK1Under bridge of Kaiying Rd., Nanan District1761051106°41′8″ N,
29°32′52″ E
127° SE85WoodlandSuburbanThe land is steep and intact near the shores; the soil layer is thick on the gentle highland, covered by dense woody plants patches.
K2Under bridge of Kaiying Rd., Nanan District1761069106°41′7″ N,
29°32′48″ E
86° E80HighwaySuburbanSoil is fertile along the gentle riverbanks, and the area is largely used for agriculture; the vegetation cover from higher ground is natural and dense.
K3Nanan District175864106°41′7″ N,
29°32′36″ E
145° SE80Residential areasSuburbanWoody plants patches are dense and distributed on the gentle and fertile banks.
K4Nanan District175831106°41′9″ N,
29°32′35″ E
326° NW85WoodlandSuburbanThe banks are steep; woody plants are intact and patchy.
K5Across Baishu Bay, Nanan District177826106°41′18″ N,
29°32′32″ E
190° S70Residential area/woodlandSuburbanThe banks are gentle and fertile; dense woody plants are distributed in patches, with a high herbage coverage under the forest.
Publisher’s Note: MDPI stays neutral with regard to jurisdictional claims in published maps and institutional affiliations.

