Article

Responses of Nutrient Resorption to Human Disturbances in Phoebe bournei Forests

1
Department of Environmental Ecology, College of Ecology and Resources Engineering, Wuyi University, Nanping 354300, China
2
Key Laboratory of Fujian Universities for Ecology and Resource Statistics, Fuzhou 350002, China
3
Department of Chemistry, College of Chemistry and Bioengineering, Yichun University, Yichun 336000, China
4
Department of Biological Sciences, Tennessee State University, Nashville, TN 37209, USA
*
Authors to whom correspondence should be addressed.
Forests 2022, 13(6), 905; https://doi.org/10.3390/f13060905
Submission received: 24 April 2022 / Revised: 4 June 2022 / Accepted: 7 June 2022 / Published: 10 June 2022

Abstract

:
Nutrient resorption plays an important role in the nutrient conservation of plants and ecosystem nutrient cycling. Although community succession and nutrient addition could regulate plant nutrient resorption, how resorptions of foliar nutrients vary with human disturbances remains unclear. With the economic development, Phoebe bournei forests (PF) have suffered varying degrees of human disturbances in China. In this study, the leaf nutrient resorption efficiency (RE) of the PF under two disturbances (i.e., severe and mild disturbances) were investigated. Results showed that the phosphorus (P) contents of green leaf, senesced leaf, and soil were low under both disturbances, reflecting that the PF had a potential P limitation. Phosphorus and potassium (K) REs were higher under the severe disturbance than those under the mild disturbance. The potassium resorption efficiency was the highest among the three REs under both disturbances. In addition, nutrient resorption efficiencies increased with green leaf nutrient contents under both disturbances. However, there were negative significant relationships of specific leaf area and leaf dry matter content with nutrient resorption under both disturbances. These findings provide a new perspective of nutrient resorption and revealed the potential impact of human disturbances on the nutrient cycle in forest ecosystems.

1. Introduction

Nutrient resorption is an important ecological process in which plants recover nutrients from senesced leaves and transfer them to other living tissues [1,2,3]. This process provides an important internal nutrient source for plant growth and nutrient cycling in forest ecosystems [4,5]. Plant nutrient resorption is assessed by nutrient resorption efficiency (RE), which is quantified as the percentage of a nutrient withdrawn from the senesced leaves compared to the green leaves [6,7]. This ecological process improves the ability of plants to obtain nutrients and reduces their dependence on soil nutrient supply, especially in nutrient-limited soil [4,8]. Plant nutrient resorption is affected by many factors including external conditions (e.g., human activities), the leaf chemical composition (e.g., enzymes, protein, carbon (C), nitrogen (N), phosphorus (P), and potassium (K)), and an array of the structural and recalcitrant compounds of leaves [9,10,11,12]. Leaf nutrient resorption directly affects forest ecosystem processes such as litter decomposition and community structure and composition [5,13]. Therefore, an understanding of forest nutrient resorption efficiency could contribute to a better quantification of nutrient cycling and forest productivity [14].
Nutrient resorption has been widely studied, with regard to N, P, and metal elements (e.g., K, calcium, copper, zinc, aluminum, and iron) [3,15]. Nitrogen, P, and K are three major nutrients often limiting plant growth [16,17]. Leaf traits such as leaf thickness and leaf dry matter content (LDMC) could influence plant resource acquisition and conservation strategies in response to the changing environments [17]. These leaf traits are often correlated with each other; for example, thicker leaf is mostly associated with low specific leaf area (SLA) [18]. Previous studies have reported that N and P resorption efficiencies (NRE and PRE) decline with thicker leaves due to a greater allocation of the nutrients to structural compounds [19]. Species with slow growth rates, low SLA, and high LDMC often have lower nutrient resorption than those fast-growing species, indicating that plants with the conservative growth strategy reduce their capabilities to reabsorb nutrients [8]. Since N and P are directly involved in leaf photosynthesis in forest ecosystems, NRE and PRE have been widely reported [5,20]. However, K resorption efficiency (KRE) in forest ecosystems is still poorly understood [8,12], even though K plays an important role in the enzyme activity and protein dynamics of plant growth. In forest ecosystems, the forest type, succession stage, and nutrient inputs also significantly influence nutrient resorption [12]. Previous studies have found that NRE and PRE decrease with tropical forest succession [21]. In a 4-year field experiment, N addition significantly affected NRE, PRE, and other REs in different stand ages of poplar plantations in the eastern China [22]. In nutrient-poor soil of a tropical forest, PRE and KRE are higher than NRE, and NPR and PRE have positive relationships with green leaf N and P, respectively, but KRE is not correlated with green leaf K [8]. In another study with 19 Chinese fir plantations, Tong et al. (2021) found that PRE is higher than NRE, and leaf nutrient resorption is affected by the climate factor and soil variables [15].
Phoebe bournei, commonly called nanmu in Chinese, is an evergreen tree species and a rare and endangered species [23,24]. Phoebe bournei is widely planted and used, especially in the construction of urban gardens, and has important economic and research values [23]. In recent years, with the economic development, natural forests such as P. bournei forests (PF) in south China have been suffering from human disturbances that directly impact the stability of forest ecosystem functions [25,26,27]. Small and medium diameter classes of the PF are often found under the mild and moderate disturbances. The diversity index of the PF is reduced with the increase of disturbance intensity [28]. Although previous work has demonstrated that disturbances could significantly change the diversity of the PF, no studies have been conducted to investigate the impact of human disturbances on the nutrient resorption of the PF. Furthermore, the mechanism of nutrient resorption of the PF response to human disturbances remain unclear.
In this study, leaf REs under two human disturbances (i.e., mild and severe) in the PF were investigated and the relationships between soil nutrients and leaf traits were developed. The objects of this study were to test the following three hypotheses: (1) KRE would be significantly higher than NRE and PRE under both disturbances due to higher K contents in plant issues; (2) green leaf nutrients would have positive relationships with REs under both disturbances, since more nutrients could be reabsorbed with higher green leaf nutrient contents; (3) soil variables and leaf traits could be used to predict REs under both disturbances due to significant correlations among them.

2. Materials and Methods

2.1. Site Description

The study site was located in a P. bournei forest scenic spot of a National Key Ecological Forest Reserve in Nanping, Fujian Province, southeastern China. The area is characterized by a typical subtropical monsoon climate. The mean annual temperature is 18.1 °C, mean annual precipitation is 1500–1700 mm, and the frost-free period is 282 days [29]. The average altitude is 190.5 m. The largest trees have trunk diameters of 3 m, heights of 30 m, and ages of 800 years [29]. The PFs are perennial and evergreen with wide-spreading branches and luxuriant foliage. The scenic spot in the Reserve has a unique “thousands of trees” in the PF of Fujian province in China.

2.2. Experimental Design

Due to the development of tourism, the PFs have suffered from different degrees of human disturbances. To detect the impacts of different disturbances, we selected forests with severe and mild disturbances. The severe disturbances had proximity to residential areas and areas that are more seriously affected by human activities. The mild disturbances were far away from residential areas. A complete randomized experimental design with eight replications for each disturbance was used. Eight 10 m × 10 m plots were set in each of the two disturbance areas randomly, with a total of sixteen sample plots and a total area of 1600 m2 (Figure S1). The species composition, DBH (dimeter at breast height), and H (height) of tree and shrub layers, as well as other information regarding the sample plots are described in Table S1.

2.3. Field Sample Collection and Laboratory Analysis

To determine nutrient resorption, green and senesced leaves from the severe and mild disturbance areas in the PF were collected in the plots with similar elevation (189.5–191.56 m), slope (1–2.5 °C), and soil type (yellow soil). Five dominant trees of P. bournei were randomly selected with a similar diameter class under each disturbance and the plot border area was avoided. The mature green leaves were collected from the first leaves expanded in spring and from the upper crown in each tree. We set a senesced leaf collector in the center of each plot for collecting senesced leaves and the senesced leaf was identified by a yellow-brown color but that had not been decomposed. Soil samples were taken at the two depths (0–20 cm and 20–40 cm) with a soil auger. Three soil cores were taken from each plot for a total of 96 soil samples. The soil samples were sieved through a 2 mm sieve after being naturally air-dried and were sealed in polythene bags for chemical analysis. The leaves and litter were oven-dried at 80 °C for 48 h to a constant weight and then sieved through the 2 mm sieve for element analysis.
Leaf traits were measured, including leaf thickness (LT), SLA, and LDMC. Leaf SLA and LDMC were measured using five leaves from each of the five individual plants in each plot. Leaf SLA was determined as the ratio of leaf area to leaf dry biomass [18]. Leaf area was measured using a scanner (EPSONV600, Seiko Epson Corporation, Suwa City, Japan). Leaf dry biomass was determined by drying leaves to a constant weight at 80 °C for 48 h in an oven. Leaf LDMC was calculated as the ratio of oven-dried leaf biomass and the water-saturated fresh leaf biomass [18]. Leaf thickness was measured at the widest point of the main vein of each leaf using a micrometer, avoiding important secondary veins [18]. The organic C of the component in green leaf, senesced leaf, and soil were measured using the potassium dichromate KCr2O7 method [30]. The total N of the green leaves, senesced leaves, and soil was determined by the Kjeldahl method [30]. The total P content was analyzed by lame photometry [30]. The P content was determined by H2SO4–H2O2 digestion [30].

2.4. Statistical Analysis

The nutrient resorption efficiency of N (NRE), P (PRE), and K (KRE) was calculated using the following equation:
NuRE = ( 1 Nu senesced Nu green × MLCF ) × 100 %
where Nu senesced and Nu green represent the nutrient contents in the senesced and green leaves of P. bournei, respectively. MLCF is the correction factor for mass loss (MLCF = dry biomass of senesced leaves/dry biomass of green leaves) [31]. The MLCF is 0.780 for evergreen samples [1].
To evaluate the difference of green leaf C, N, P, and K contents, senesced leaf C, N, P, and K contents, and soil C, N, P, and K contents among different disturbances, an analysis of variance (ANOVA) and the least significant difference (LSD) method were used. All variables were log- or Box-Cox transformed to meet the normality requirement. Five trees were chosen in each plot and 40 replications of green leaf and senesced leaf under each disturbance were used. At the same soil depth, 24 samples were collected. To further determine the relationships between green leaf nutrients and REs, the standardized major axis (SMA) regression analysis was used in this study [32]. The SMA is used for fitting bivariate regression models to data with variability in both x and y, and minimizes the sums of squares of the perpendicular distance between each point and regression line rather than the sum of the squared deviation about the predicted values as in OLS regression [32].
The linear regression models were used for evaluating the green leaf nutrients effects on nutrient resorption efficiencies, with NRE, PRE, and KRE being response variables in the model. The ANOVA was also used to compare the difference of the RE or green leaf N:P under different disturbances and the three REs under each disturbance, respectively. A principal component analysis (PCA) with standardized variables was applied to visualize the relationships between NRE, PRE, and KRE, leaf traits (SLA, LT, LDMC, leaf N, leaf P, and leaf K), and soil chemical compositions (C, N, P, and K). The first and second axis of PCA were selected as they represented close to 50% total variability under different disturbances. The correlation analysis between REs and leaf traits (SLA, LT, LDMC, leaf N, leaf P, and leaf K) and soil nutrients (organic matter, N, P, and K) under different disturbances were conducted using Pearson correlation coefficient.
All analyses were performed in R 4.0.5 software platform (R Development Core team 2020; R Foundation for Statistical Computing, Vienna, Austria), using the “nlme” package for linear mixed model and “smart” package for SMA analysis.

3. Results

3.1. Green Leaf, Senesced Leaf, and Soil Total Nutrient Contents of Phoebe Bournei Forest

Green leaf, senesced leaf, and soil in different depths showed different nutrient contents under different disturbances in the PF (Table 1). The P content of green leaf under the mild disturbance was significantly lower than that under the severe disturbance, but there were no significant differences in the C, N, and K contents of green leaves between the two disturbances. The nitrogen (15.73 ± 0.26 mg/g) and P (0.88 ± 0.02 mg/g) contents of senesced leaf under the severe disturbance were significantly higher than those under the mild disturbance, however, the C and K contents of senesced leaf did not vary between the two disturbances. Under the severe disturbance, soil P and K contents were significantly higher than under the mild disturbance in both depths. In the same soil depth, N, P, and K contents under the severe disturbance were significantly higher than under the mild disturbance of the PF.

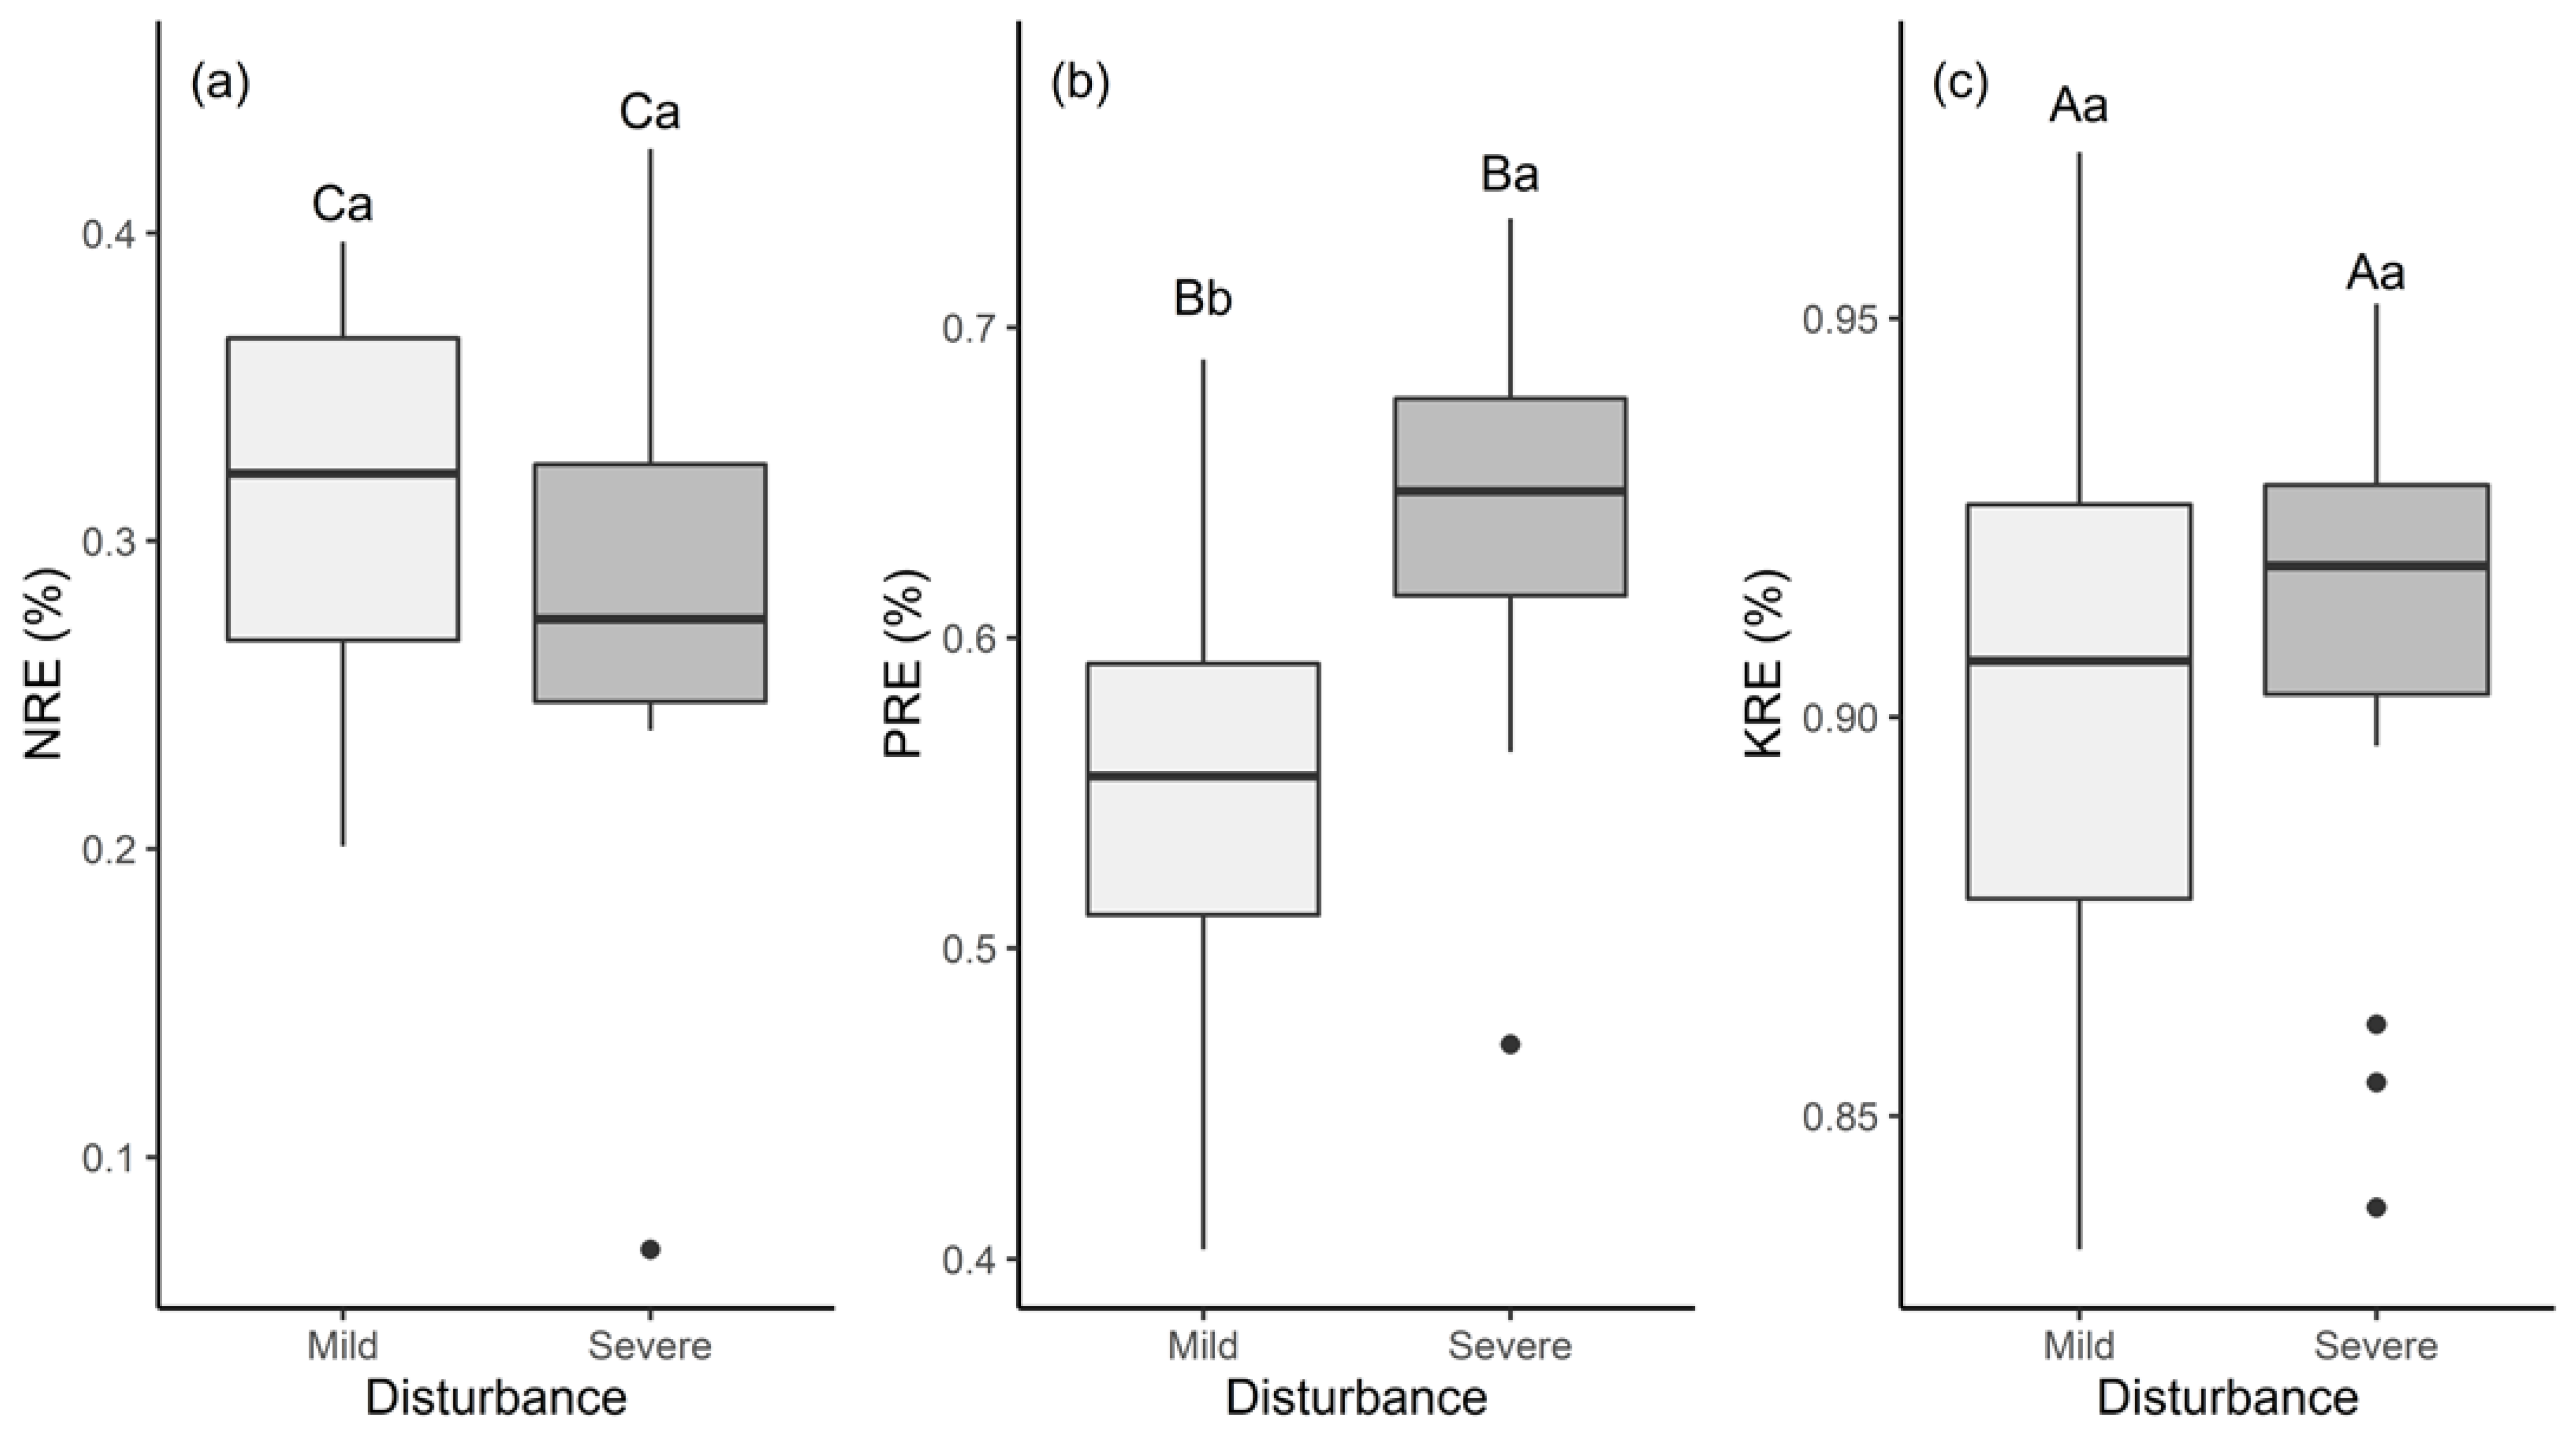
3.2. Leaf N, P, and K Resorption Efficiencies under Different Disturbances in the Phoebe Bournei Forest

Leaf NRE and PRE were lower than KRE under both disturbances, and KRE was higher than 0.8 (Figure 1). Interestingly, leaf PRE under the severe disturbance was significantly higher than that under the mild disturbance, but no differences in NRE and KRE were found between the two disturbances. Leaf NRE was the lowest (<0.5) among all three REs. All three REs increased with green leaf content, and NRE, PRE, and KRE were significantly correlated with green leaf N, P, and K contents under both the disturbances, respectively (Figure 2, Table 2). In addition, the coefficient of variation of PRE and KRE under the severe disturbance were higher than these under the mild disturbance. Nevertheless, when compared to the severe disturbance, NRE had a higher coefficient of variation under the mild disturbance (Table S2).

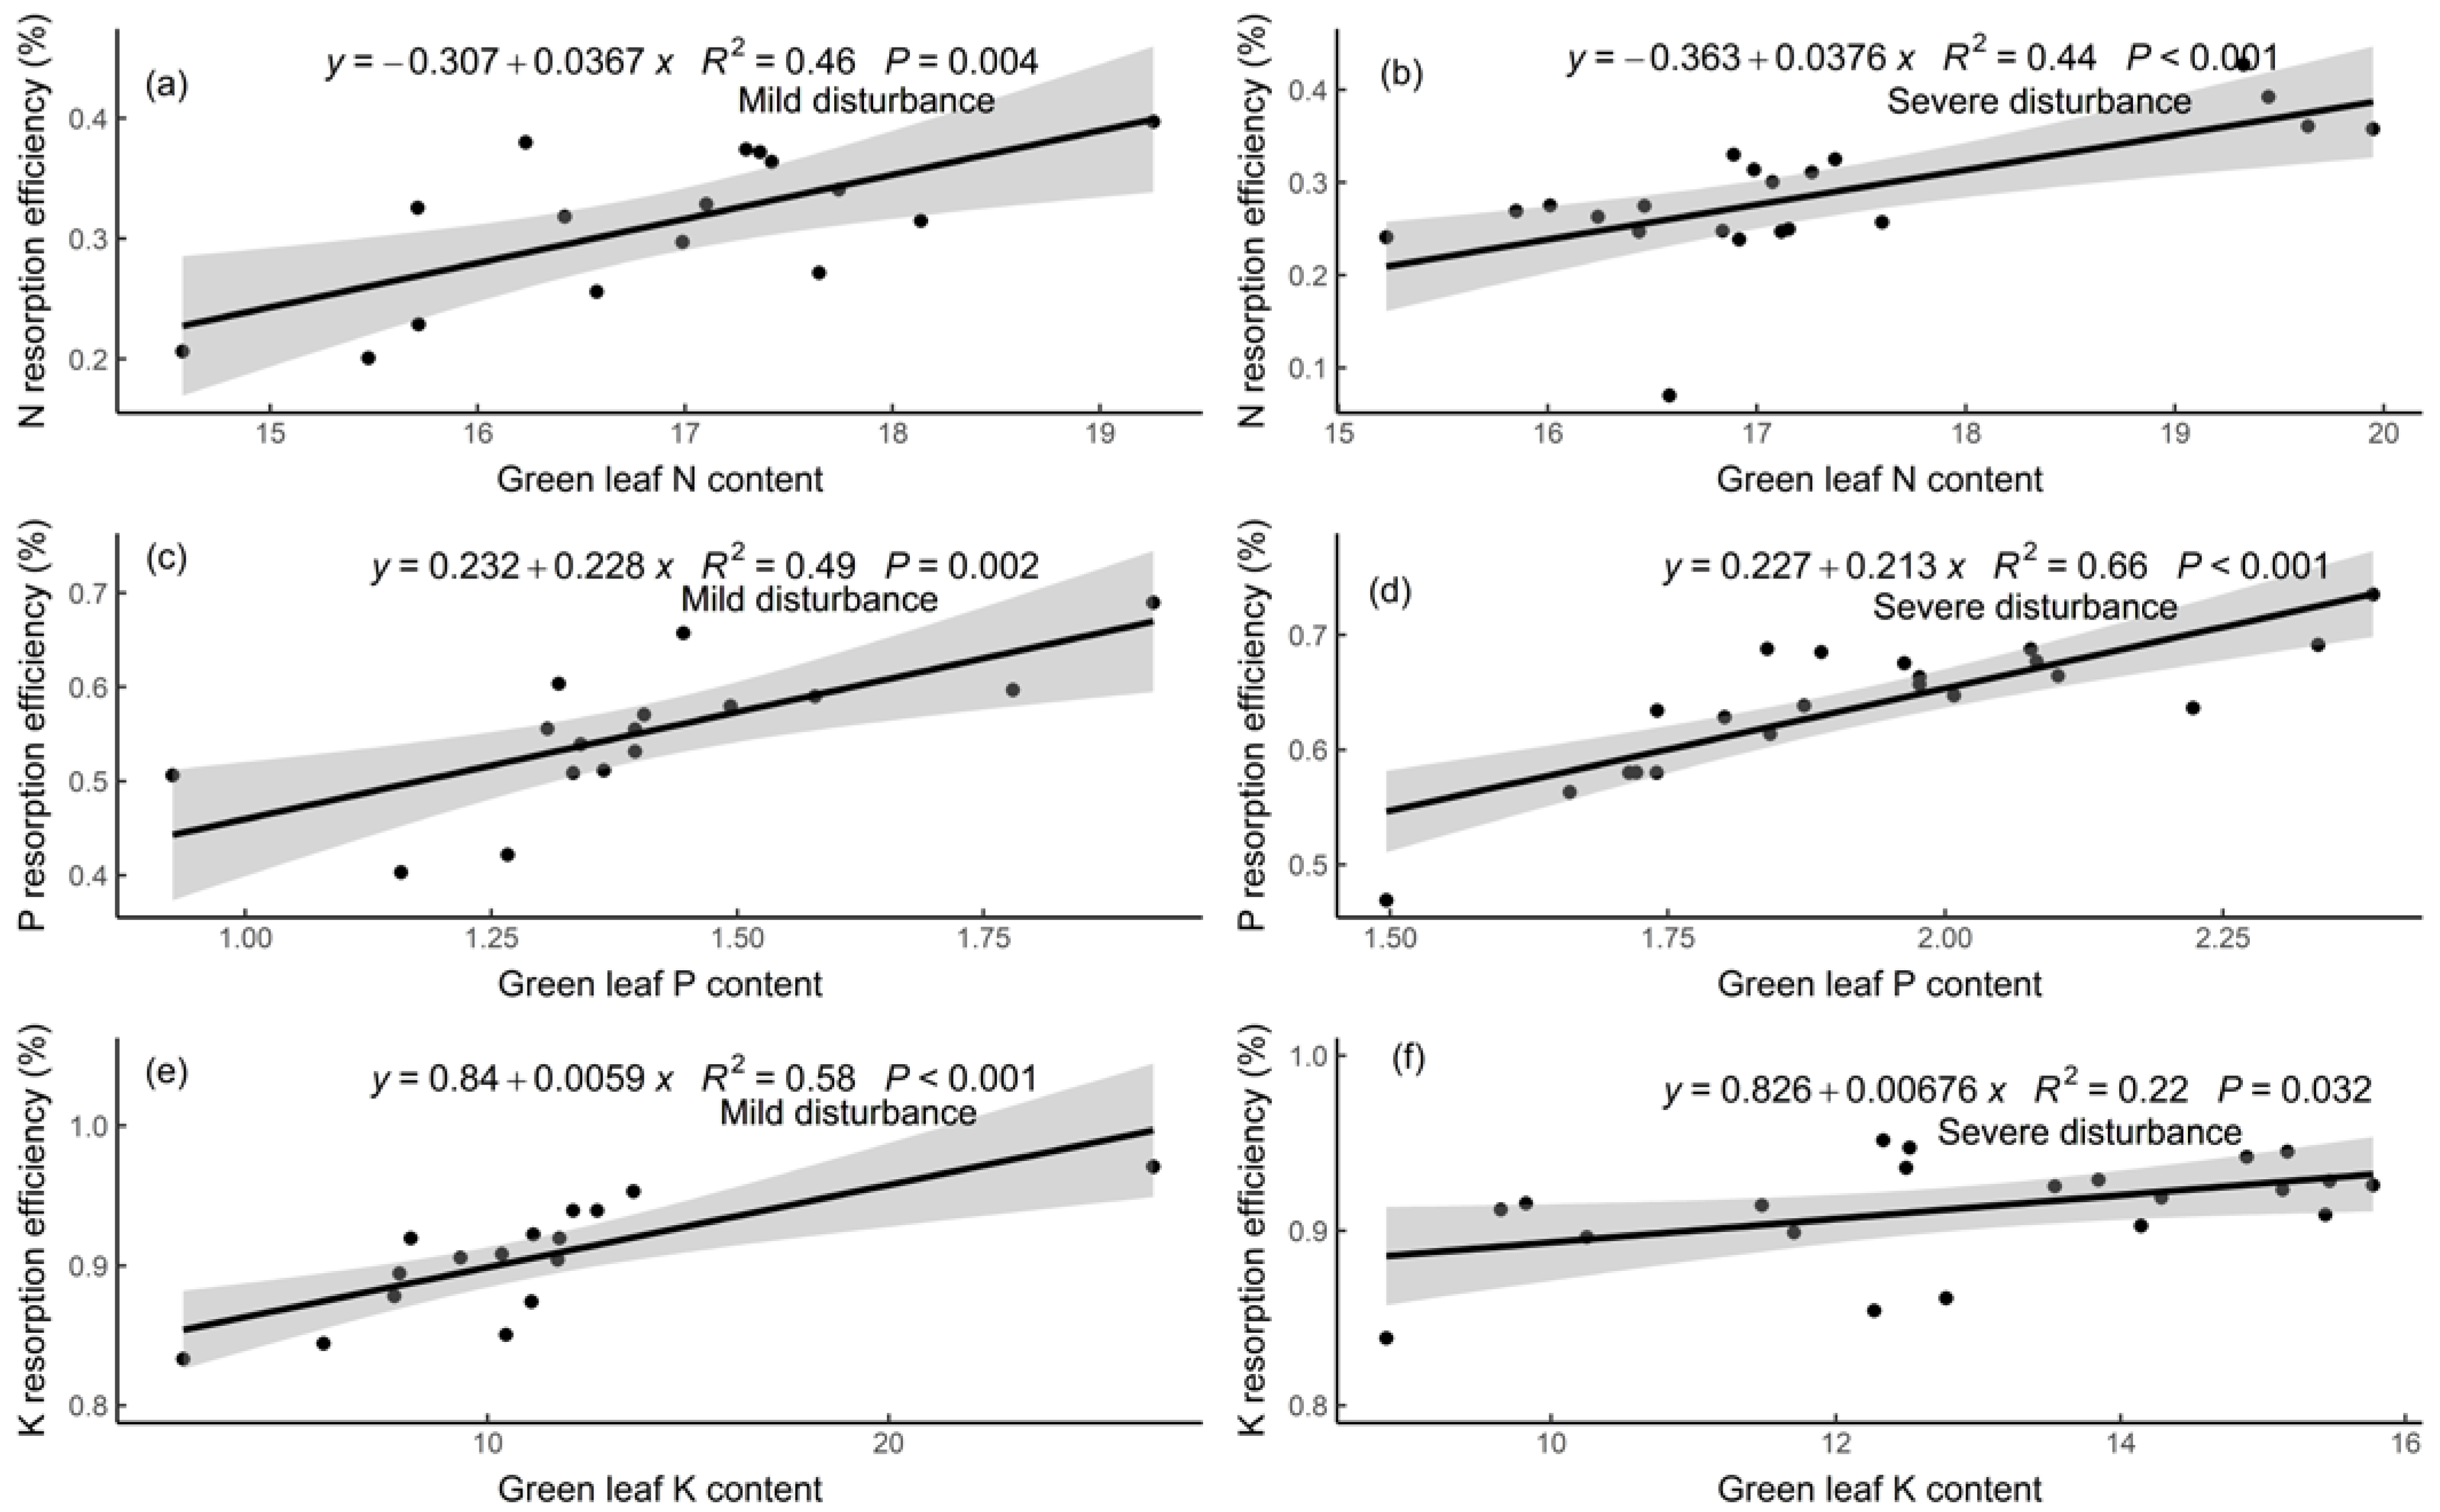
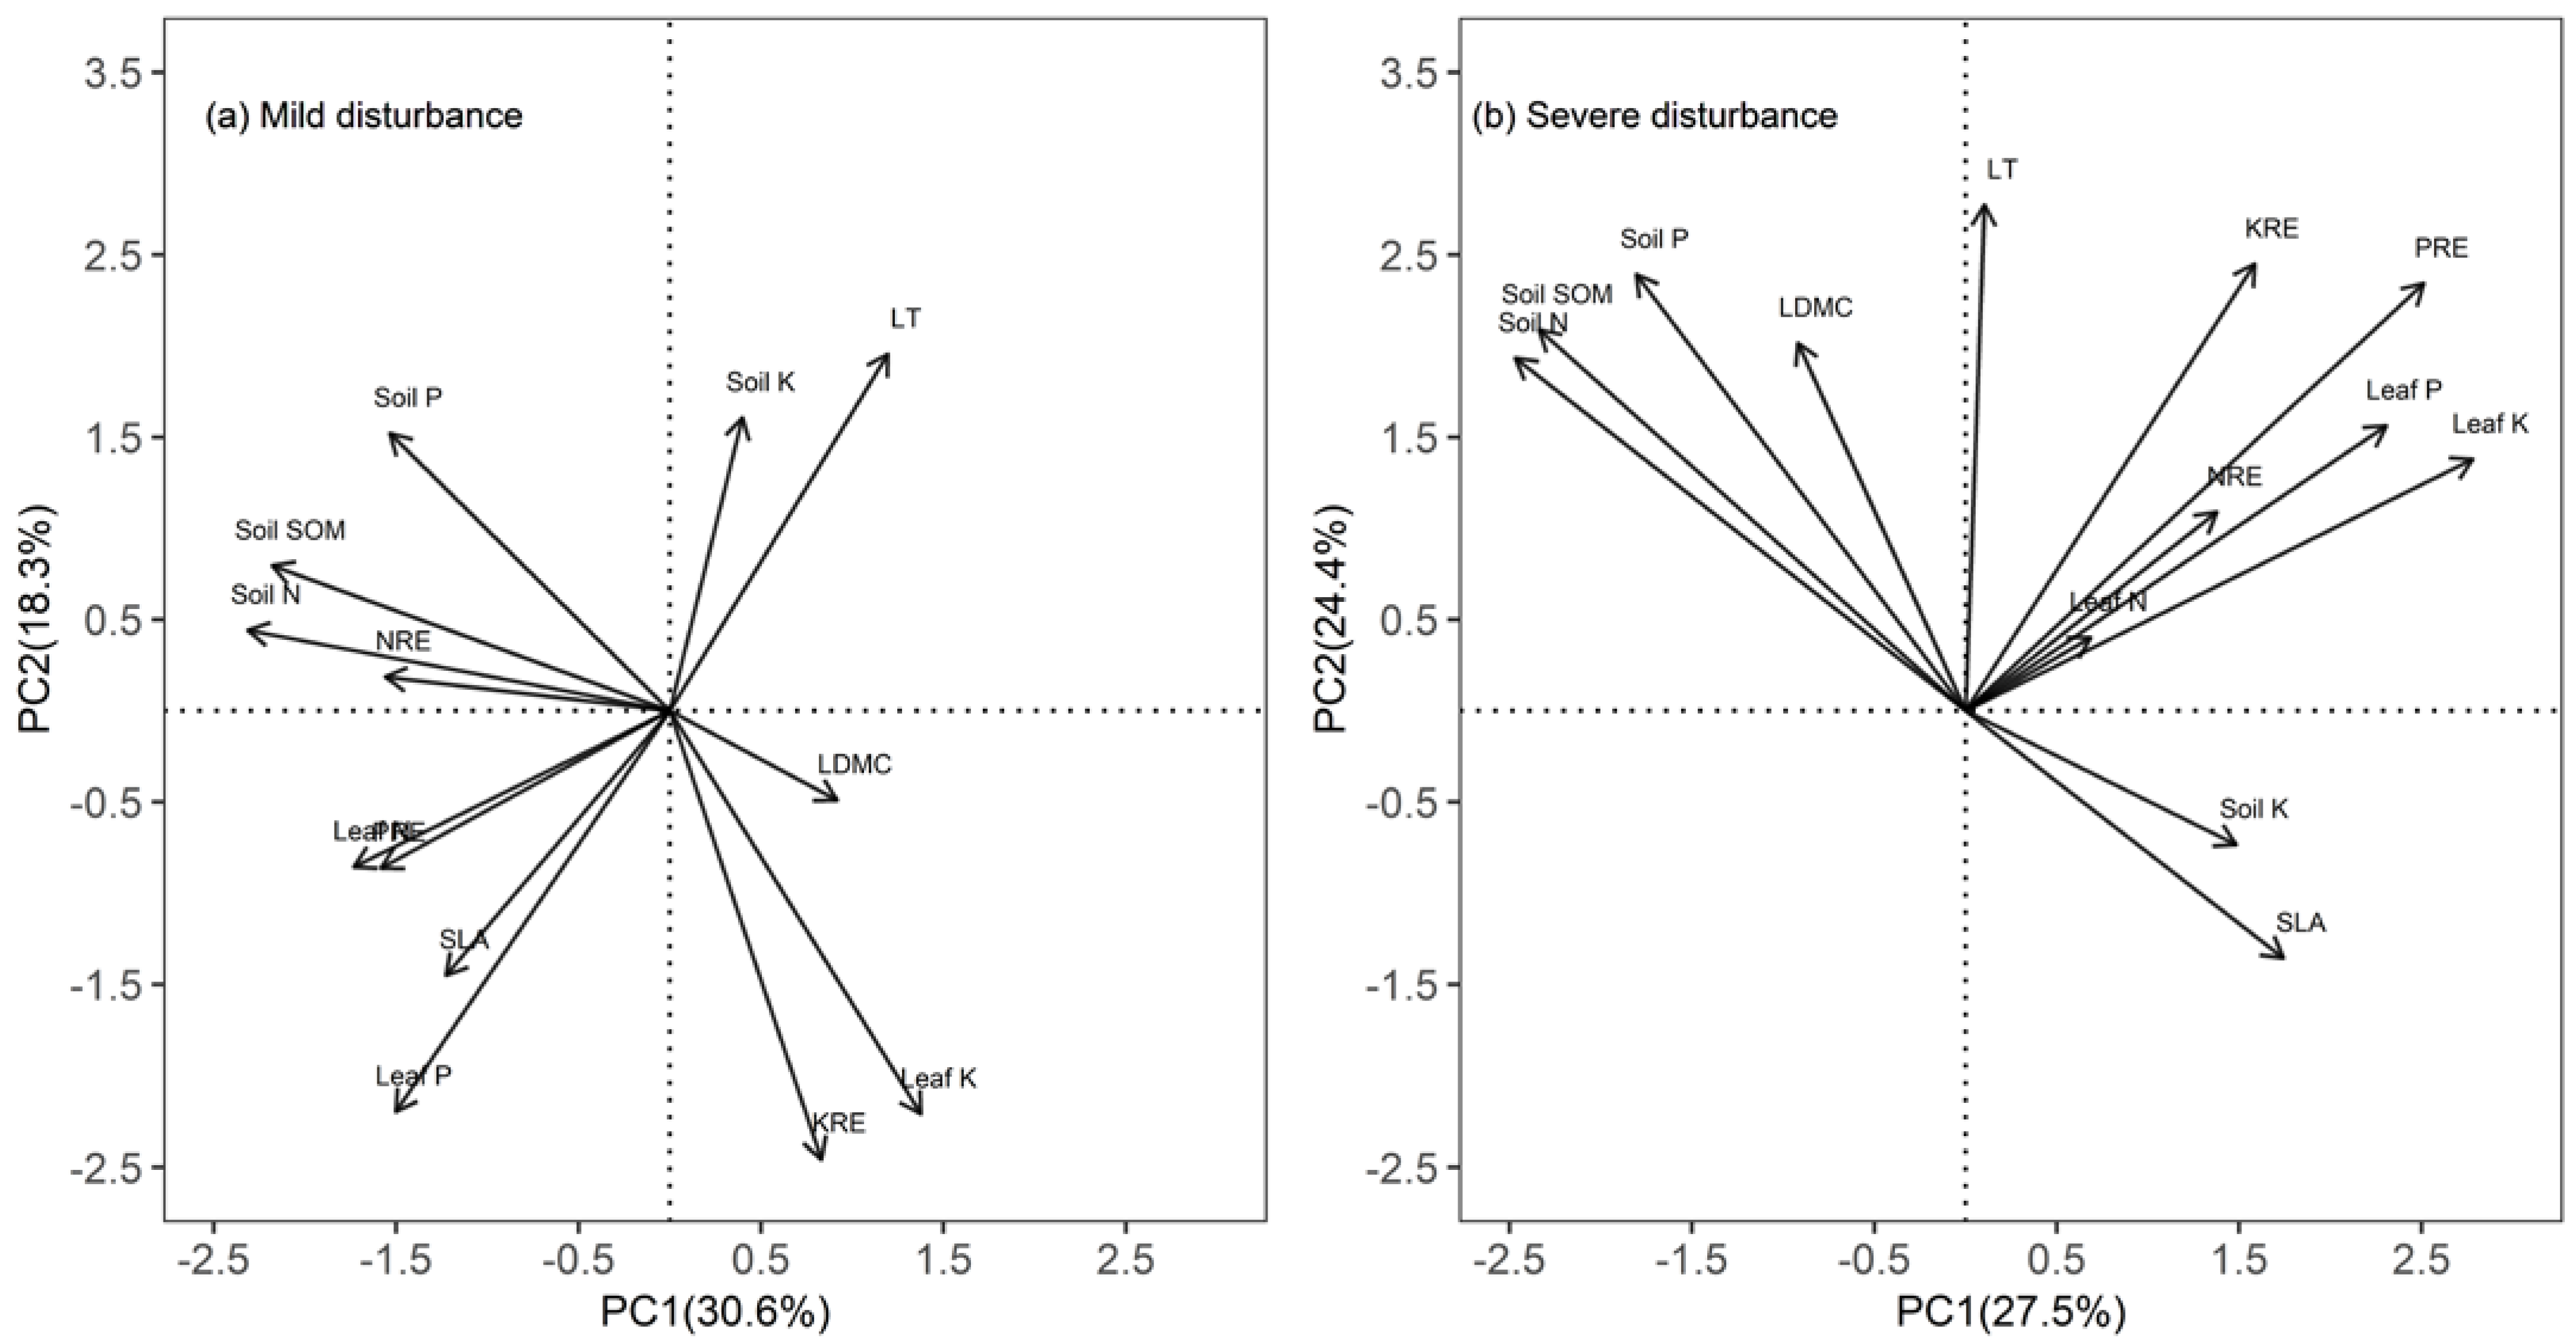
3.3. Relationships of Nutrient Resorption Efficiencies with Leaf Traits and Soil Nutrients

The results of PCA showed that REs were significantly correlated with soil nutrients and leaf traits. The first and second axis of PCA explained 48.9% and 51.9% of total variation under the mild and severe disturbances, respectively (Figure 3, Table 3). Under the mild disturbance, soil nutrients aligned with the first axis but leaf traits aligned with the second axis, showing that nutrient resorption efficiencies were mainly related to soil nutrients. Nevertheless, under the severe disturbance, leaf traits aligned with the first axis, but soil nutrients aligned with the second axis, further showing that nutrient resorption efficiencies were correlated with green leaf nutrients. Under both disturbances, soil N and soil SOM had higher absolute weights, and more than 0.30 in the Principal Component 1 (PC1), showing that these variables could be used to predict nutrient resorption (Table 3).
Under both disturbances, there were significant positive relationships between green leaf N and NRE, soil N and soil P, soil N and soil SOM, and soil P and soil SOM (Table 4). There was a stronger negative relationship between SLA and LDMC under the severe disturbance. Under the mild disturbance, leaf PRE had positive correlations with soil N and soil SOM (r = 0.66 and 0.57, respectively). Under the severe disturbance, PRE was positively correlated with KRE and LT (r = 0.72 and r = 0.45, respectively) (Table 4).

4. Discussion

4.1. Effects of Green Leaf Content on Soil Nutrients

Soil is considered P-deficient when the total P content is below 5 mg/g, based on the results of the second soil census in China [33]. In the PF, soil P content was less than 1.5 mg/g and lower than that in the green leaf (<2 mg/g), indicating that the PF was experiencing potential P-limitation. This result was similar to previous studies in the tropical region [34,35,36]. The ratio of green leaf N:P tended to be lower under the severe disturbance (9.07 ± 0.27) than under the mild disturbance (12.28 ± 0.49). The ratios of leaf N:P were lower than 14, a threshold value for N limitation, indicating that the PF might be more N-limited [37]. According to resource optimization theory, plants limited by a single resource could alter their physiological functions, and allocate more energy to obtain more resources; ultimately, the plant growth would be restricted by multiple resource co-limitation [37]. In this study, soil was P-deficient under both disturbances, further confirming that human disturbances might aggravate nutrient restrictions and eventually transform to multiple resource co-limitation in the PF.
Soil stores the largest P contents in the terrestrial ecosystem [38]. The P contents of soil under both disturbances were higher than that of a global scale (0.57 mg/g) [39]. In this study, the P content of green leaf, senesced leaf, and soil under the severe disturbance was higher than under the mild disturbance, suggesting that the disturbances temporarily postponed the P cycle in the PF due to the soil microbial activity and nutrient flow being disrupted by the disturbances.
The nutrient allocations (C, N, P, and K) in the PF were similar to other tropical forests, with high C and K and low P [8,36]. In this study, the N content in soil was lower than in the green and senesced leaves of P. bournei under both disturbances. This result was consistent with the previous studies [40], but was different from Zhao et al. (2019) [41]. The reason was that leaves that had returned to soil during the senescence process lost more nutrients, as RE was regulated by climatic factors and our study site had abundant precipitation with a high humidity and temperature.

4.2. Nutrient Resorption and Stoichiometric Characteristics under Different Disturbances

The mean values of PRE and KRE under the severe disturbance were higher than under the mild disturbance. Particularly, PRE was significantly higher under the severe disturbance due to a higher senesced leaf P content. Leaf P was obtained from the soil, and soil P content was higher under the severe disturbance than under the mild disturbance. Leaf KRE was the highest among the three REs in the PF and it was higher than in the tropical forests [3,22], due to an extremely high level of the soil K. In this study, P levels were not enough to support the growth of P. bournei, leading to a higher KRE to make up for N and P deficiencies with increasing disturbances. Leaf K could be more easily reabsorbed than N and P in the PF. In the process of metabolism of the foliar senescence, enzymatic activities need more nutrients (i.e., N, P, and K) and energy input from the green leaves [42]. Our results also confirmed that plant nutrient resorption was affected by environmental factors [2]. These results supported our first hypothesis.
In this study, REs increased with green leaf nutrient contents, which was consistent with Kobe et al. (2005) but contradictory to Tong et al. (2021) due to different study scale and environmental conditions [15,43]. When compared to KRE, NRE and PRE had greater variability and were more important for forest nutrient conservation due to the stronger N and P storage capacity for P. bournei growth in both disturbances (Table S2), which is consistent with a previous report [44,45]. The higher REs in the PF were conducive to obtaining nutrients by the plants to avoid the nutrient losses and high variability of green leaf nutrients under different disturbances. These findings supported our second hypothesis.

4.3. Relationships among Nutrient Resorption, Leaf Traits, and Soil Nutrients

Under different disturbances, leaf nutrients (N, P, K) had no significant correlations with soil nutrients. This result was not consistent with the previous studies [46]. Resource utilization strategies varied with the magnitude of disturbance. Under the mild disturbance, plants had high SLA and high P, but low K [16,47]. In contrast, plants had low P and high PRE under the severe disturbance. In addition, this study found that PRE was higher under the mild disturbance than that under the severe disturbance. Plants showed the conservative strategy to reduce the reabsorption of P nutrient under the mild disturbance, and nutrient resorption efficiency declined with a thicker leaf, confirming that the plants allocated more nutrients that are not easily remobilized, as well as structural compounds, under the severe disturbance than that the mild disturbance [8,19]. It was conceivable that the disturbances of the PF increased nutrient resources and enhanced REs.
Overall, with exception of leaf nutrients, our study found that strong significant relationships between REs and leaf functional traits and soil variables exist under different disturbances. The underlying mechanism might be that the disturbances suppressed soil nutrient release and increased the destruction of leaf physical and chemical properties. Thus, the high REs in the PF were a nutrition acquisition strategy for metabolic activity and growth, in order to reduce dependence on the soil nutrient supply [3,48]. The disturbances regulated the relationships of nutrient resorption with functional traits and soil variables, as a disturbance directly affected the plant’s functional traits and soil nutrient conditions. These results partially support our third hypothesis.
In this study, disturbances directly improved the nutrient resorption and changed forest nutrient cycling, and there was a reducing tendency for P-limitation. The disturbances could impact the forest structure and stability by changing REs in the natural forests [49]. In the future, the forest managers need to consider the effect of the disturbances on the nutrient utilization and tourism resources for protection of natural forests.

5. Conclusions

This study analyzed the P. bournei forest nutrient resorption efficiencies under different human disturbances. These results showed that nutrient resorption was an important plant nutrient strategy in response to different human disturbances. Under the severe disturbance, the PF reabsorbed more P and K nutrients when compared to the mild disturbance. Nutrient resorption efficiencies increased with increases of green leaf nutrient contents under both disturbances, and there was a strong reabsorbing ability for more nutrients in the foliar senescence process. Furthermore, the disturbances changed the relationships between plant functional traits and nutrient resorption efficiencies, and the disturbances delayed element flow and cycles. This study provided direct evidence of the impacts of disturbances on natural forest nutrients and nutrient resorptions, and generated a scientific basis for protection of the PF. In practice, moderate disturbances are helpful to promote element flow in forest ecosystems, while excessive disturbances are detrimental to plant nutrient conservation and biodiversity maintenance. Future research needs to focus on the roles of plant interactions and soil microbial activity on nutrient resorption in the context of the human disturbances in subtropical forests.

Supplementary Materials

The following supporting information can be downloaded at: https://www.mdpi.com/article/10.3390/f13060905/s1, Figure S1: Schematic diagram of sampling sites under different disturbances in the Phoebe bournei forest; Table S1: The basic information of species under different disturbances types of the Phoebe bournei forest; Table S2: Coefficient of variation of nutrient resorption efficiencies under different disturbances.

Author Contributions

Conceptualization, D.Z., S.P. and D.H.; Funding acquisition, D.Z. and S.P. Writing—reviewing & editing, D.Z., S.P. and D.H.; Field investigation, Experimental and data analysis, D.Z. and J.W. All authors have read and agreed to the published version of the manuscript.

Funding

D.Z. was supported by the Natural Science Foundation of Fujian Province, China (Grant number 2021J05248), Natural Science Foundation of Nanping City, China (Grant number N2021J006), Science Foundation Project for Talented New Faculty at Wuyi University (Grant number YJ202103), and Opening Foundation of Key Laboratory of Fujian Universities for Ecology and Resource Statistics (Grant number PTJH17011-5). S.P. was supported by the 2018 Local Development Research Center Project of Yichun University (Grant number DF2018021). DH was supported by the US NSF and USDA projects.

Data Availability Statement

Not applicable.

Acknowledgments

We thank Huiting Huang, Hailong Jiang, Yuxi Xie, and other people for their assistance in the field and laboratory.

Conflicts of Interest

The authors declare no conflict of interest.

References

  1. Vergutz, L.; Manzoni, S.; Porporato, A.; Novais, R.F.; Jackson, R.B. Global resorption efficiencies and concentrations of carbon and nutrients in leaves of terrestrial plants. Ecol. Monogr. 2012, 82, 205–220. [Google Scholar] [CrossRef] [Green Version]
  2. Drenovsky, R.E.; Pietrasiak, N.; Short, T.H.; Silva, T. Global temporal patterns in plant nutrient resorption plasticity. Glob. Ecol. Biogeogr. 2019, 28, 728–743. [Google Scholar] [CrossRef] [Green Version]
  3. Chen, H.; Reed, S.C.; Lü, X.; Xiao, K.; Wang, K.; Li, D. Global resorption efficiencies of trace elements in leaves of terrestrial plants. Funct. Ecol. 2021, 3, 1596–1602. [Google Scholar] [CrossRef]
  4. Zhang, T.; Li, F.Y.; Shi, C.; Li, Y.; Tang, S.; Baoyin, T. Enhancement of nutrient resorption efficiency increases plant production and helps maintain soil nutrients under summer grazing in a semi-arid steppe. Agric. Ecosys. Environ. 2020, 292, 106840. [Google Scholar] [CrossRef]
  5. Chen, H.; Reed, S.C.; Lu, X.; Xiao, K.; Wang, K.; Li, D. Coexistence of multiple leaf nutrient resorption strategies in a single ecosystem. Sci. Total Environ. 2021, 772, 144951. [Google Scholar] [CrossRef]
  6. Aerts, R. Nutrient resorption from senescing leaves of perennials: Are there general patterns? J. Ecol. 1996, 84, 597–608. [Google Scholar] [CrossRef]
  7. Killingbeck, K.T. Nutrients in senesced leaves: Keys to the search for potential resorption and resorption proficiency. Ecology 1996, 77, 1716–1727. [Google Scholar] [CrossRef]
  8. Urbina, I.; Grau, O.; Sardans, J.; Margalef, O.; Peguero, G.; Asensio, D.; LLusià, J.; Ogaya, R.; Gargallo-Garriga, A.; Van Langenhove, L.; et al. High foliar K and P resorption efficiencies in old-growth tropical forests growing on nutrient-poor soils. Ecol. Evol. 2021, 11, 8969–8982. [Google Scholar] [CrossRef]
  9. Brant, A.N.; Chen, H.Y.H. Patterns and mechanisms of nutrient resorption in plants. Crit. Rev. Plant Sci. 2015, 34, 471–486. [Google Scholar] [CrossRef]
  10. Huang, G.; Su, Y.; Mu, X.; Li, Y. Foliar nutrient resorption responses of three life-form plants to water and nitrogen additions in a temperate desert. Plant Soil 2018, 424, 479–489. [Google Scholar] [CrossRef]
  11. Zhang, H.; Wang, J.; Wang, J.; Guo, Z.; Wang, G.G.; Zeng, D.; Wu, T. Tree stoichiometry and nutrient resorption along a chronosequence of Metasequoia glyptostroboides forests in coastal China. For. Ecol. Manag. 2018, 430, 445–450. [Google Scholar] [CrossRef]
  12. Chen, X.; Chen, H.Y.H. Foliar nutrient resorption dynamics of trembling aspen and white birch during secondary succession in the boreal forest of central Canada. For. Ecol. Manag. 2021, 505, 119876. [Google Scholar] [CrossRef]
  13. Ochieng, C.A.; Erftemeijer, P.L. Phenology, litterfall and nutrient resorption in Avicennia marina (Forssk.) Vierh in Gazi Bay, Kenya. Trees 2001, 16, 167–171. [Google Scholar] [CrossRef]
  14. Lü, X.T.; Hu, Y.Y.; Wolf, A.A.; Han, X.G. Species richness mediates within-species nutrient resorption: Implications for the biodiversity-productivity relationship. J. Ecol. 2019, 107, 2346–2352. [Google Scholar] [CrossRef]
  15. Tong, R.; Zhou, B.; Jiang, L.; Ge, X.; Cao, Y. Spatial patterns of leaf carbon, nitrogen, and phosphorus stoichiometry and nutrient resorption in Chinese fir across subtropical China. Catena 2021, 201, 105221–105229. [Google Scholar] [CrossRef]
  16. Akram, M.A.; Wang, X.; Hu, W.; Xiong, J.; Zhang, Y.; Deng, Y.; Ran, J.; Deng, J. Convergent variations in the leaf traits of desert plants. Plants 2020, 9, 990. [Google Scholar] [CrossRef]
  17. Wright, I.J.; Reich, P.B.; Westoby, M.; Ackerly, D.D.; Baruch, Z.; Bongers, F.; Cavender-Bares, J.; Chapin, T.; Cornelissen, J.H.; Diemer, M. The worldwide leaf economics spectrum. Nature 2004, 428, 821–827. [Google Scholar] [CrossRef]
  18. Pérez-Harguindeguy, N.; Díaz, S.; Garnier, E.; Lavorel, S.; Poorter, H.; Jaureguiberry, P.; Bret-Harte, M.S.; Cornwell, W.K.; Craine, J.M.; Gurvich, D.E.; et al. New handbook for standardised measurement of plant functional traits worldwide. Aust. J. Bot. 2013, 61, 167–234. [Google Scholar] [CrossRef]
  19. Wood, T.E.; Lawrence, D.; Wells, J.A. Inter-specific variation in foliar nutrients and resorption of nine canopy-tree species in a secondary neotropical rain forest. Biotropica 2011, 43, 544–551. [Google Scholar] [CrossRef]
  20. He, M.; Yan, Z.; Cui, X.; Gong, Y.; Li, K.; Han, W. Scaling the leaf nutrient resorption efficiency: Nitrogen vs phosphorus in global plants. Sci. Total Environ. 2020, 729, 138920. [Google Scholar] [CrossRef]
  21. Yan, T.; Zhu, J.; Yang, K. Leaf nitrogen and phosphorus resorption of woody species in response to climatic conditions and soil nutrients: A meta-analysis. J. For. Res. 2017, 29, 905–913. [Google Scholar] [CrossRef]
  22. Jiang, D.; Li, Q.; Geng, Q.; Zhang, M.; Xu, C.; Hu, G.; Shen, C.; Ruan, H.; Xu, X.; Ye, Q. Nutrient resorption and stoichiometric responses of poplar (Populus deltoids) plantations to N addition in a coastal region of eastern China. J. Plant Ecol. 2021, 14, 591–604. [Google Scholar] [CrossRef]
  23. Wu, Z.; Raven, P.H.; Hong, D. Flora of China; Sciencen Press: Beijing, China, 2008. [Google Scholar]
  24. Xiao, J.H.; Ding, X.; Li, L.; Ma, H.; Ci, X.Q.; Merwe, M.; Conran, J.G.; Li, J. Miocene diversification of a golden-thread nanmu tree species (Phoebe zhennan, Lauraceae) around the Sichuan Basin shaped by the East Asian monsoon. Ecol. Evol. 2020, 10, 10543–10557. [Google Scholar] [CrossRef] [PubMed]
  25. Davis, K.F.; Koo, H.I.; Dell’Angelo, J.; D’Odorico, P.; Estes, L.; Kehoe, L.J.; Kharratzadeh, M.; Kuemmerle, T.; Machava, D.; Pais, A.d.J.R.; et al. Tropical forest loss enhanced by large-scale land acquisitions. Nat. Geosci. 2020, 13, 482–488. [Google Scholar] [CrossRef]
  26. Hasan, M.E.; Zhang, L.; Dewan, A.; Guo, H.; Mahmood, R. Spatiotemporal pattern of forest degradation and loss of ecosystem function associated with Rohingya influx: A geospatial approach. Land Degrad. Dev. 2020, 32, 3666–3683. [Google Scholar] [CrossRef]
  27. Qin, Y.; Xiao, X.; Wigneron, J.P.; Ciais, P.; Brandt, M.; Fan, L.; Li, X.; Crowell, S.; Wu, X.; Doughty, R.; et al. Carbon loss from forest degradation exceeds that from deforestation in the Brazilian Amazon. Nat. Clim. Chang. 2021, 11, 442–448. [Google Scholar] [CrossRef]
  28. Hao, J.; Wang, D.; Li, Y.; Yao, X.; Zhang, Y.; Zhan, M.; Qi, J. Effects of human disturbance on species diversity of Phoebe zhennan communitis in Jinfengshan Moutain in western Sichuan. Acta Ecol. Sini. 2014, 34, 6930–6942. [Google Scholar] [CrossRef]
  29. Zheng, J.; Liu, X.; Gao, R.; Yang, Z.; Yang, Y. Carbon storage and allocation in the Phoebe bournei plantations in Nanping, Fujian Province. J. Sub. Resour. Environ. 2009, 4, 59–65. [Google Scholar] [CrossRef]
  30. Parkinson, J.A.; Allen, S.E. A wet oxidation procedure suitable for the determination of nitrogen and mineral nutrients in biological material. Commun. Soil Sci. Plant Anal. 1975, 6, 1–11. [Google Scholar] [CrossRef]
  31. Van Heerwaarden, L.M.; Toet, S.; Aerts, R. Current measures of nutrient resorption efficiency lead to a substantial underestimation of real resorption efficiency: Facts and solutions. Oikos 2003, 101, 664–669. [Google Scholar] [CrossRef]
  32. Warton, D.I.; Duursma, R.A.; Falster, D.S.; Taskinen, S. Smatr 3-an R package for estimation and inference about allometric lines. Methods Ecol. Evol. 2012, 3, 257–259. [Google Scholar] [CrossRef]
  33. National Soil Census Office. Soil and Flora of China (Volumes 1 to 6); China Agricultural Press: Beijing, China, 1996.
  34. Sayer, E.J.; Banin, L.F. Tree nutrient status and nutrient cycling in tropical forest—Lessons from fertilization experiments. In Tropical Tree Physiology; Goldstein, G., Santiag, L., Eds.; Springer: Cham, Switzerland, 2016; Volume 6, pp. 275–297. [Google Scholar] [CrossRef]
  35. Mo, Q.; Li, Z.; Sayer, E.J.; Lambers, H.; Li, Y.; Zou, B.I.; Tang, J.; Heskel, M.; Ding, Y.; Wang, F. Foliar phosphorus fractions reveal how tropical plants maintain photosynthetic rates despite low soil phosphorus availability. Funct. Ecol. 2019, 33, 503–513. [Google Scholar] [CrossRef] [Green Version]
  36. van Breugel, M.; Craven, D.; Lai, H.R.; Baillon, M.; Turner, B.L.; Hall, J.S. Soil nutrients and dispersal limitation shape compositional variation in secondary tropical forests across multiple scales. J. Ecol. 2019, 107, 566–581. [Google Scholar] [CrossRef]
  37. Koerselman, W.; Meuleman, A.F. The vegetation N: P ratio: A new tool to detect the nature of nutrient limitation. J. Appl. Ecol. 1996, 33, 1441–1450. [Google Scholar] [CrossRef]
  38. Chapin, F.S.I.; Matson, P.A.; Mooney, H.A. Principles of Terrestrial Ecosystem Ecology; Springer: New York, NY, USA, 2002. [Google Scholar]
  39. He, X.; Augusto, L.; Goll, D.S.; Ringeval, B.; Wang, Y.; Helfenstein, J.; Huang, Y.; Yu, K.; Wang, Z.; Yang, Y.; et al. Global patterns and drivers of soil total phosphorus concentration. Earth Syst. Sci. Data 2021, 13, 5831–5846. [Google Scholar] [CrossRef]
  40. Sun, J.; Gao, P.; Li, C.; Wang, R.; Niu, X.; Wang, B. Ecological stoichiometry characteristics of the leaf–litter–soil continuum of Quercus acutissima Carr. and Pinus densiflora Sieb. in Northern China. Environ. Earth Sci. 2019, 78, 20. [Google Scholar] [CrossRef]
  41. Zhao, Y.; Liang, C.; Shao, S.; Chen, J.; Qin, H.; Xu, Q. Linkages of litter and soil C:N:P stoichiometry with soil microbial resource limitation and community structure in a subtropical broadleaf forest invaded by Moso bamboo. Plant Soil 2021, 465, 473–490. [Google Scholar] [CrossRef]
  42. Killingbeck, K.T. Nutrient Resorption. In Plant Cell Death Processes; Academic Press: Cambridge, MA, USA, 2004. [Google Scholar] [CrossRef]
  43. Kobe, R.K.; Lepczyk, C.A.; Iyer, M. Resorption efficiency decreases with increasing green leaf nutrients in a global data set. Ecology 2005, 86, 2780–2792. [Google Scholar] [CrossRef]
  44. Han, W.; Tang, L.; Chen, Y.; Fang, J. Relationship between the relative limitation and resorption efficiency of nitrogen vs phosphorus in woody plants. PLoS ONE 2013, 8, e83366. [Google Scholar] [CrossRef]
  45. Lü, X.T.; Reed, S.C.; Yu, Q.; Han, X.G. Nutrient resorption helps drive intra-specific coupling of foliar nitrogen and phosphorus under nutrient-enriched conditions. Plant Soil 2015, 398, 111–120. [Google Scholar] [CrossRef]
  46. Gerdol, R.; Iacumin, P.; Brancaleoni, L.; Wang, F. Differential effects of soil chemistry on the foliar resorption of nitrogen and phosphorus across altitudinal gradients. Funct. Ecol. 2019, 33, 1351–1361. [Google Scholar] [CrossRef]
  47. Akram, M.A.; Zhang, Y.; Wang, X.; Shrestha, N.; Malik, K.; Khan, I.; Ma, W.; Sun, Y.; Li, F.; Ran, J.; et al. Phylogenetic independence in the variations in leaf functional traits among different plant life forms in an arid environment. J. Plant Physiol. 2022, 272, 153671. [Google Scholar] [CrossRef] [PubMed]
  48. Zhang, M.; Luo, Y.; Yan, Z.; Chen, J.; Eziz, A.; Li, K.; Han, W. Resorptions of 10 mineral elements in leaves of desert shrubs and their contrasting responses to aridity. J. Plant Ecol. 2019, 12, 358–366. [Google Scholar] [CrossRef]
  49. Rodrigo, R.; Pettit, J.L.; Matula, R.; Kozák, D.; Bače, R.; Pavlin, J.; Janda, P.; Mikoláš, M.; Nagel, T.A.; Schurman, J.; et al. Historical mixed-severity disturbances shape current diameter distributions of primary temperate Norway spruce mountain forests in Europe. For. Ecol. Manag. 2022, 503, 119772. [Google Scholar] [CrossRef]
Figure 1. The nitrogen resorption efficiencies (NRE), phosphorus resorption efficiencies (PRE), and potassium resorption efficiencies (KRE) under the mild and severe disturbances (ac) in the Phoebe bournei forest. The boxes represent the middle 50% of the data. The median line in the boxplot represents the median. Dots represent outliers. Different capital letters represent different nutrient resorption efficiencies under each disturbance. Different small letters represent significant nutrient resorption efficiencies under different disturbances.
Forests 13 00905 g001
Figure 2. Relationships between nutrient resorption efficiencies and green leaf nutrient contents under mild (a,c,e) and severe (b,d,f) disturbances in the Phoebe bournei forest. N: nitrogen, P: phosphorus, K: potassium. The shaded area represents the 95% confidence interval of the regression line.
Forests 13 00905 g002
Figure 3. Principal component analysis (PCA) of nutrient resorption efficiencies, green leaf nutrient contents, soil nutrients, and leaf traits under the mild (a) and severe (b) disturbances in the Phoebe bournei forest. Leaf N: green leaf nitrogen content. Leaf P: green leaf phosphorus content. Leaf K: green leaf potassium content. SLA: specific leaf area. LT: leaf thickness. LDMC: leaf dry matter content. NRE: nitrogen resorption efficiencies. PRE: phosphorus resorption efficiencies. KRE: potassium resorption efficiencies. Soil N: soil total nitrogen content. Soil P: soil total phosphorus content. Soil K: soil total potassium content. Soil SOM: soil organic matter.
Forests 13 00905 g003
Table 1. The contents (mean ± standard error (SE)) of the organic carbon (C), total nitrogen (N), total phosphorus (P), and total potassium (K) in green leaf, senesced leaf, and soil at 0–20 cm and 20–40 cm depths in the Phoebe bournei forest.
CompartmentDisturbance
Type
C (mg/g)N (mg/g)P (mg/g)K (mg/g)
Green leafMild541.60 ± 4.25 a16.85 ± 0.29 a1.40 ± 0.06 b10.81 ± 1.27 a
Severe549.17 ± 4.31 a17.26 ± 0.28 a1.93 ± 0.05 a12.94 ± 0.46 a
Senesced leafMild501.71 ± 7.01 a14.83 ± 0.24 b0.79 ± 0.02 b1.19 ± 0.08 a
Severe494.57 ± 7.53 a15.73 ± 0.26 a0.88 ± 0.02 a1.40 ± 0.09 a
Soil (0–20 cm)Mild23.73 ± 1.43 a1.45 ± 0.11 b0.89 ± 0.04 b28.35 ± 1.05 b
Severe24.55 ± 1.21 a1.78 ± 0.11 a1.06 ± 0.05 a42.08 ± 1.44 a
Soil (20–40 cm)Mild16.51 ± 1.06 a0.92 ± 0.08 b0.86 ± 0.04 b29.49 ± 1.11 b
Severe17.88 ± 1.28 a1.35 ± 0.11 a1.00 ± 0.05 a44.60 ± 1.80 a
Note: Different letters represent the significant differences of the same nutrient index under different disturbances.
Table 2. Linear regression models between green leaf N and NRE, P and PRE, and K and KRE in the Phoebe bournei forest. Results are the estimated regression parameters, standard errors, and t and p for the linear regression models.
EstimateStandard Errordftp
Intercept0.930.11358.63<0.001
Green leaf N content−0.040.0135−5.88<0.001
Intercept0.950.11358.48<0.001
Green leaf P content−0.420.1135−3.79<0.001
Intercept0.980.033528.52<0.001
Green leaf K content−0.060.0235−2.620.01
Table 3. Principal component analysis (PCA) analysis of green leaf nutrients, nutrient resorption efficiencies, and soil nutrients in the Phoebe bournei forest under different disturbances.
PropertyMild DisturbanceSevere Disturbance
Principal ComponentsPrincipal Components
1212
Green leaf N−0.32−0.160.100.06
Green leaf P−0.28−0.410.340.23
Green leaf K0.26−0.410.410.21
NRE−0.290.030.210.16
PRE−0.29−0.160.370.35
KRE0.15−0.460.240.36
LDMC0.17−0.09−0.140.30
SLA−0.23−0.270.26−0.20
LT0.220.360.020.41
Soil N−0.430.08−0.370.29
Soil P−0.280.28−0.270.36
Soil SOM−0.400.15−0.350.31
Soil K0.070.300.22−0.11
Percent %30.618.327.524.4
Cumulative percent %30.648.927.551.9
Note: NRE: nitrogen resorption efficiencies. PRE: phosphorus resorption efficiencies. KRE: potassium resorption efficiencies. SLA: specific leaf area. LT: leaf thickness. LDMC: leaf dry matter content. Soil N: soil total nitrogen content. Soil P: soil total phosphorus content. Soil SOM: soil organic matter. Soil K: soil total potassium content.
Table 4. The correlation analysis between nutrient resorption efficiencies, leaf traits, and soil nutrients under both disturbances in the Phoebe bournei forest.
Leaf NLeaf PLeaf KNREPREKRELDMCSLALTSoil NSoil PSoil SOMSoil K
Leaf N −0.040.160.67 **0.020.05−0.070.33−0.060.020.220.100.27
Leaf P0.38 0.51 *0.150.81 **0.58 **0.040.190.12−0.14−0.13−0.090.20
Leaf K−0.23 0.14 0.44 *0.74 **0.47 *−0.140.350.38−0.30−0.07−0.270.27
NRE0.68 ** 0.25 −0.42 0.340.12−0.030.170.17−0.140.10−0.03−0.06
PRE0.14 0.70 ** 0.04 0.32 0.72 **0.080.080.45 *−0.18−0.02−0.110.06
KRE0.060.27 0.68 ** −0.26 −0.03 0.31−0.030.34−0.030.110.04−0.02
LDMC−0.31 0.16 0.42 −0.06 0.40 0.10 −0.69 **0.44 *0.250.200.21−0.05
SLA0.48 0.40 −0.13 −0.01 −0.14 0.06 −0.63 ** −0.42−0.25−0.19−0.230.23
LT−0.47 −0.31 −0.02 −0.29 −0.15 −0.14 0.40 −0.58 * 0.240.390.17−0.06
Soil N0.29 0.44 −0.34 0.33 0.66 ** −0.29 −0.19 0.19 −0.16 0.77 **0.91 **−0.25
Soil P0.09 0.21 −0.46 −0.01 0.27 −0.31−0.21 0.17 0.16 0.60 * 0.80 **−0.21
Soil SOM0.38 0.25 −0.34 0.32 0.57 * −0.28−0.17 0.11 −0.19 0.87 *** 0.58 * −0.41
Soil K0.13 −0.37 0.02 0.14 −0.26 0.02 −0.13 −0.34 0.31 −0.14 0.11 0.09
Note: Normal font represents the mild disturbance. Bold font represents the severe disturbance. *, **, *** represent significant difference at α = 0.05, 0.01 and 0.0001 levels, respectively. Leaf N: green leaf nitrogen content. Leaf P: green leaf phosphorus content. Leaf K: green leaf potassium. SLA: specific leaf area. LT: leaf thickness. LDMC: leaf dry matter content. NRE: nitrogen resorption efficiencies. PRE: phosphorus resorption efficiencies. KRE: potassium resorption efficiencies. Soil N: soil total nitrogen content. Soil P: soil total phosphorus content. Soil K: soil total potassium content. Soil SOM: soil organic matter.
Publisher’s Note: MDPI stays neutral with regard to jurisdictional claims in published maps and institutional affiliations.

