
A Hybrid Landslide Warning Model Coupling Susceptibility Zoning and Precipitation


Abstract
:1. Introduction
2. Materials and Methods
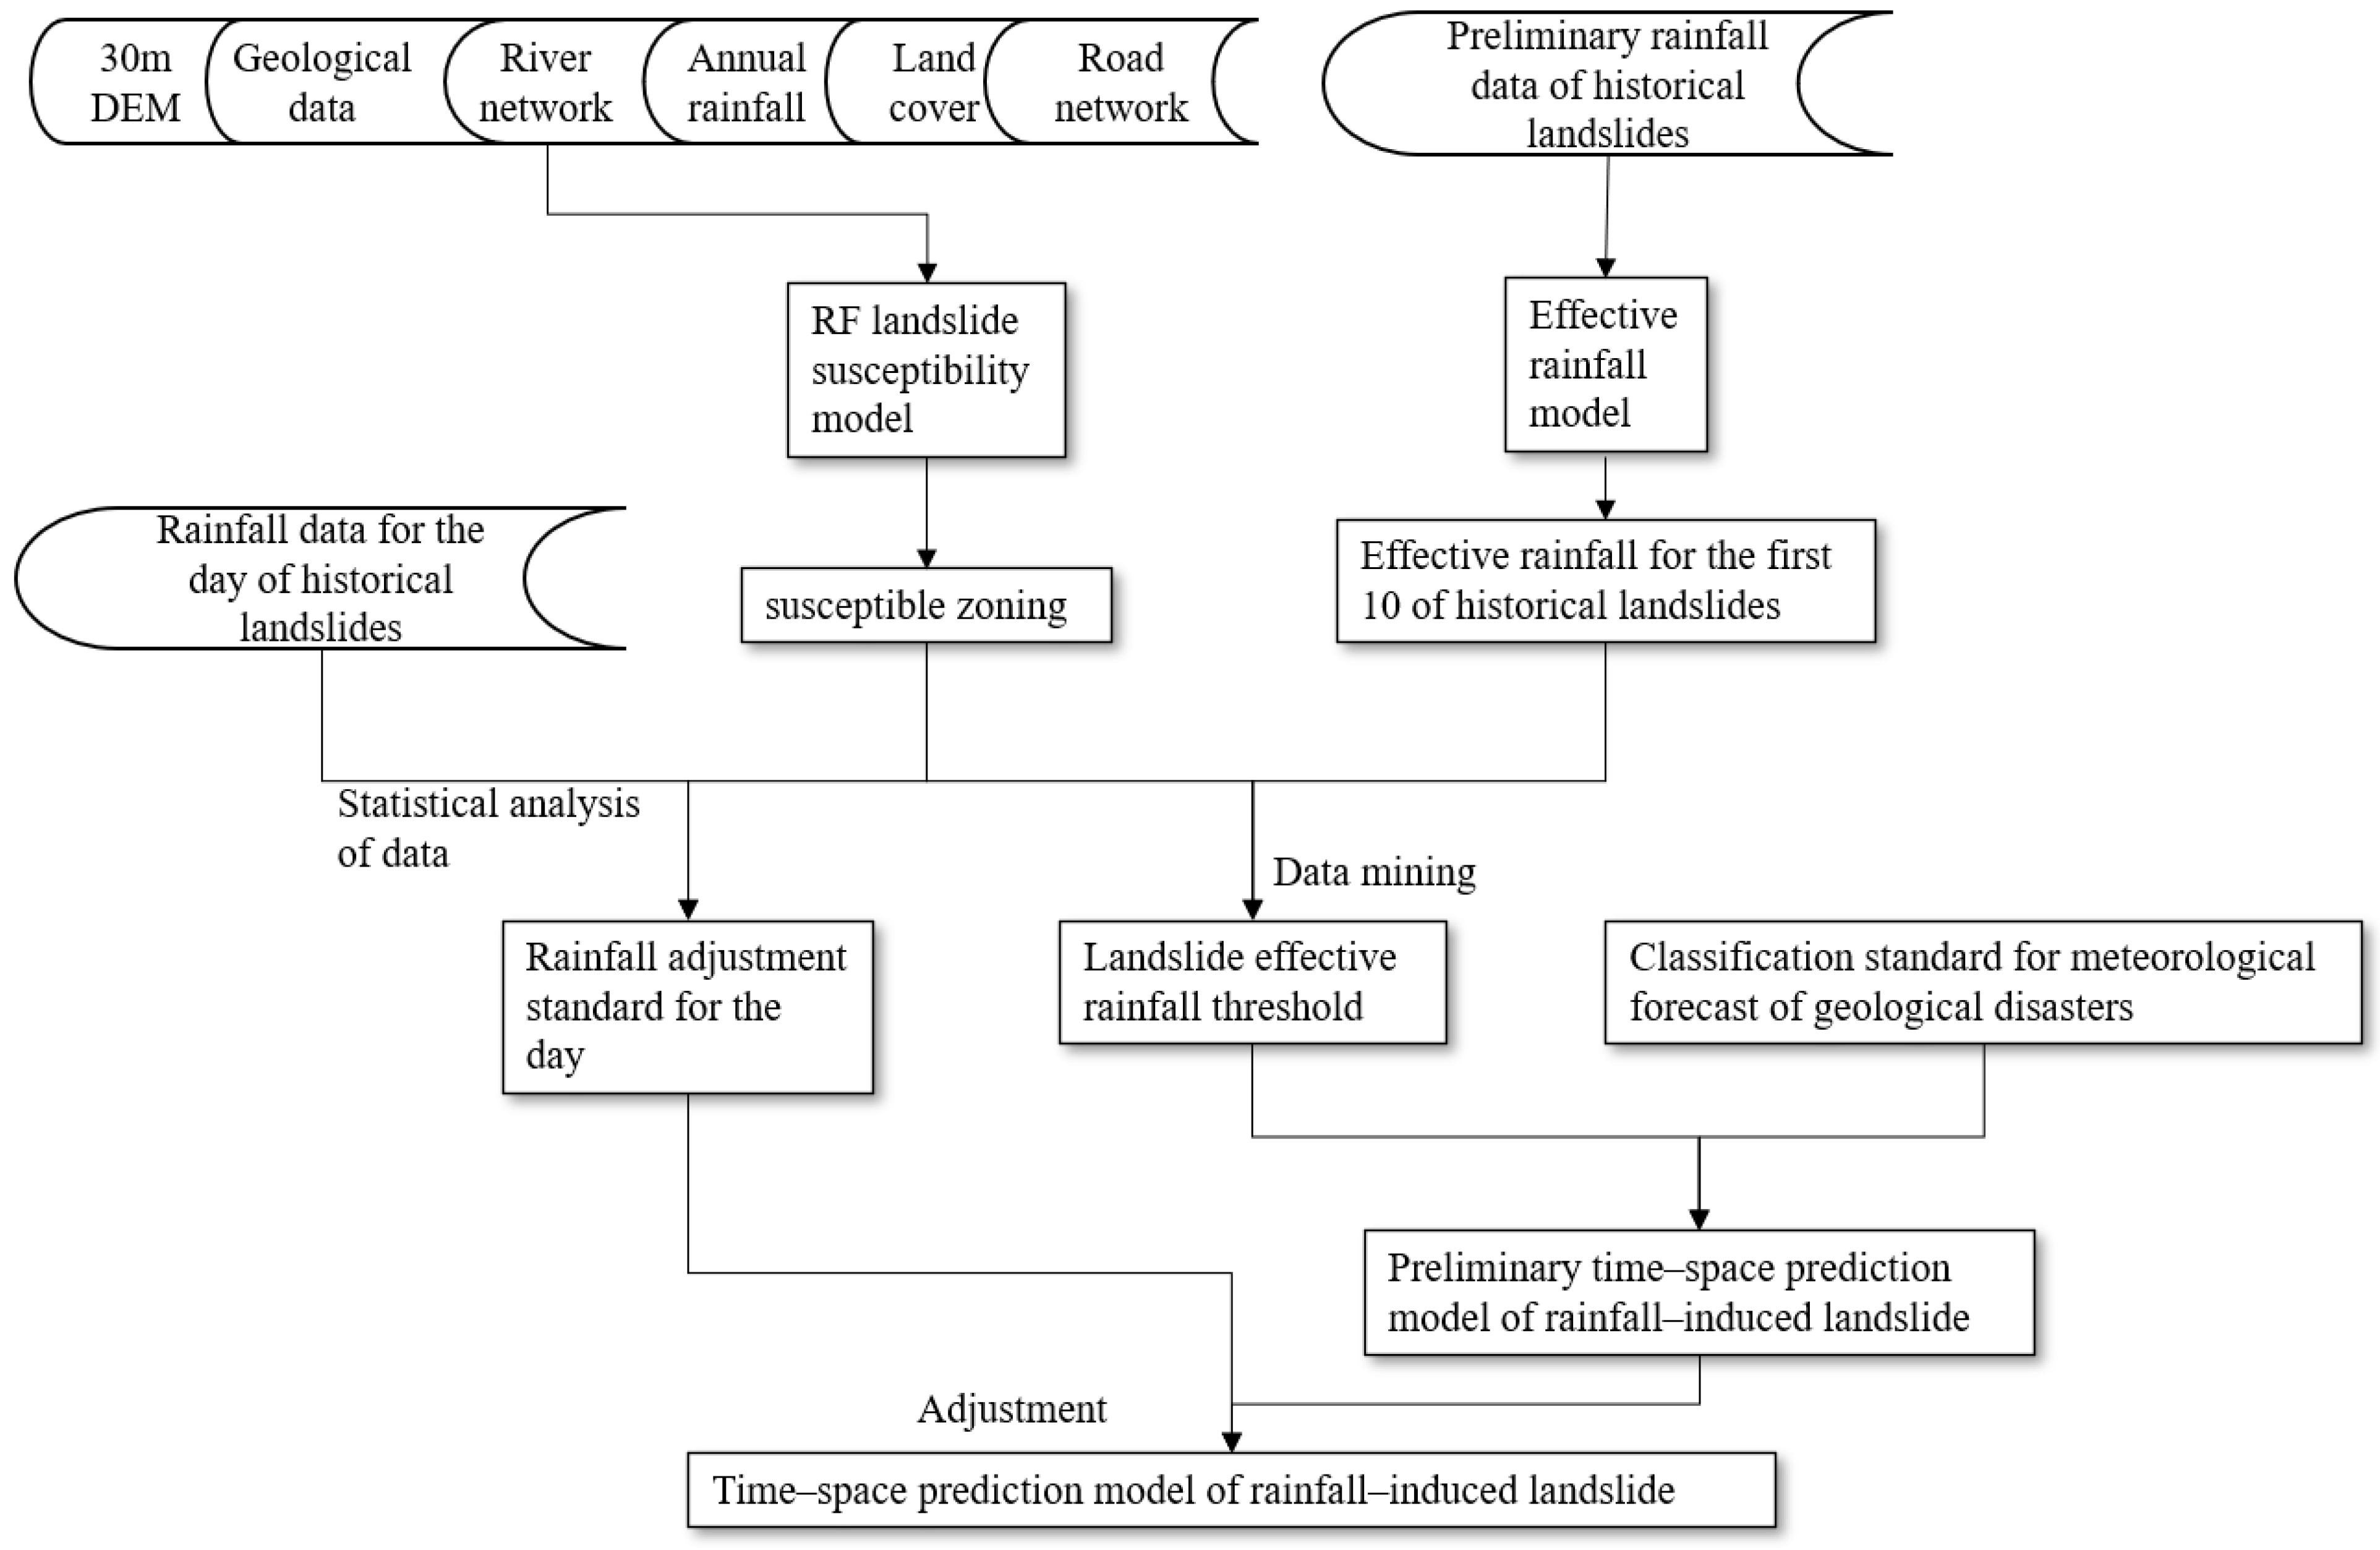
2.1. Methodology
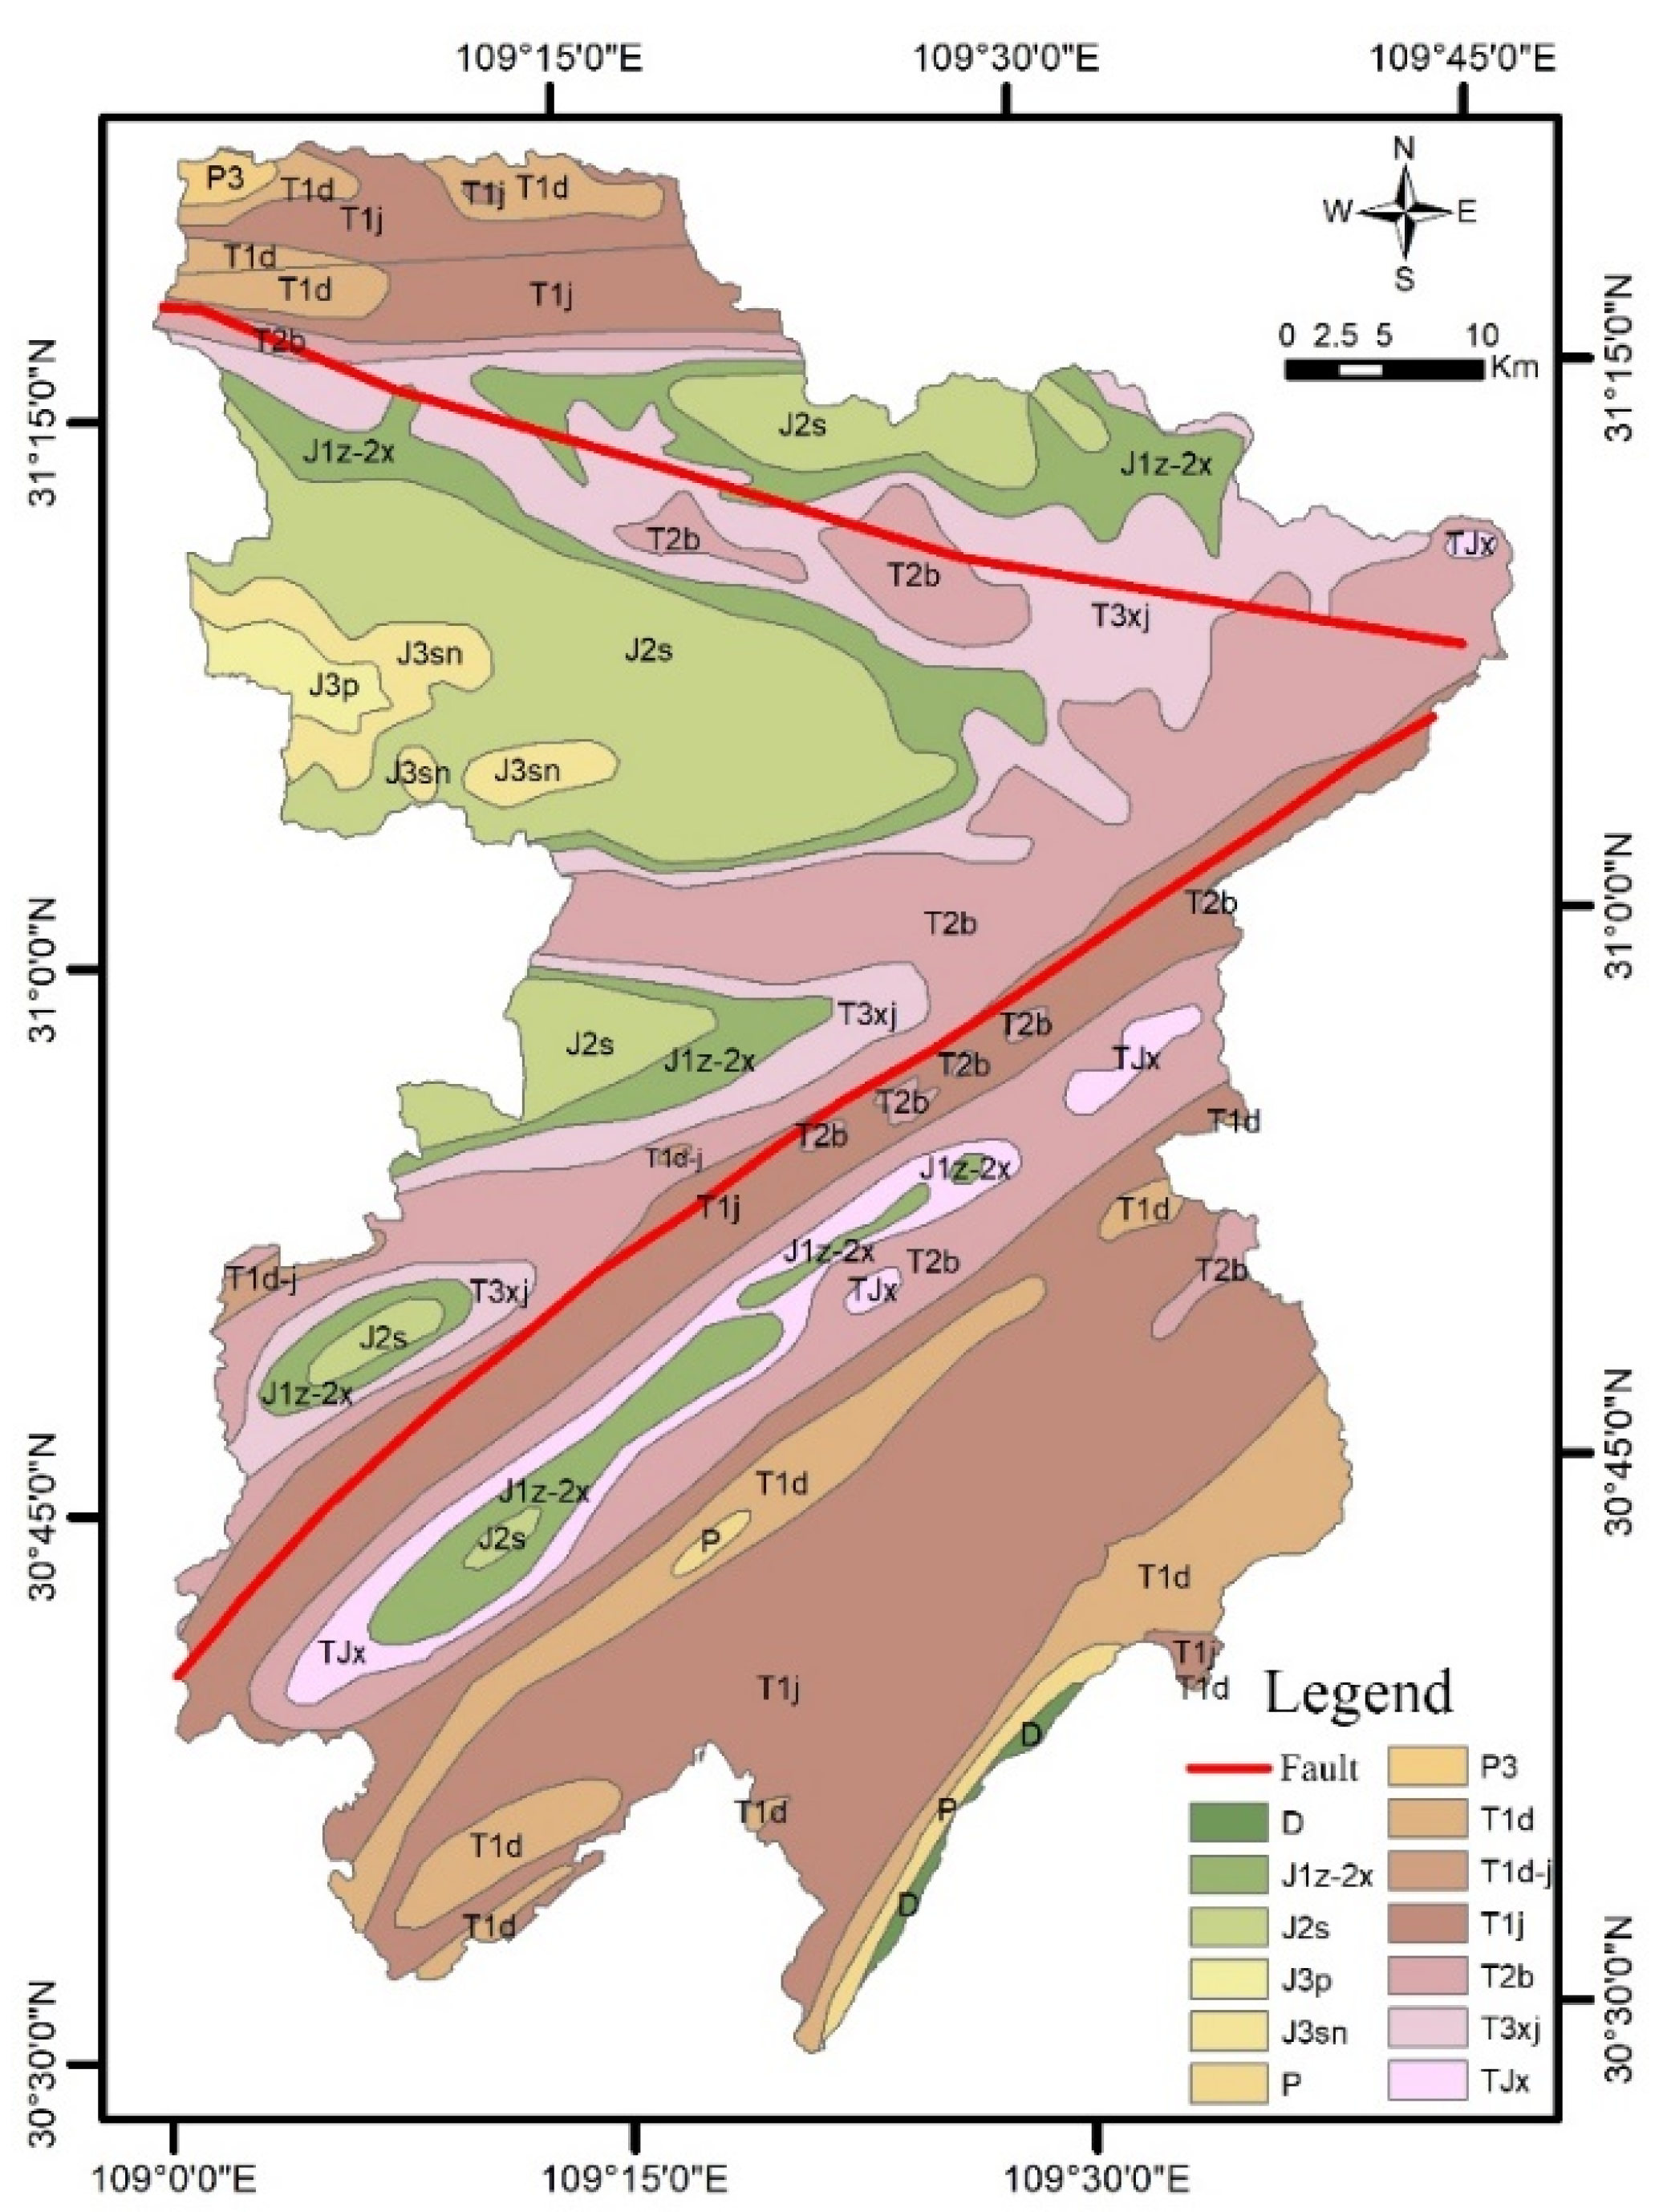
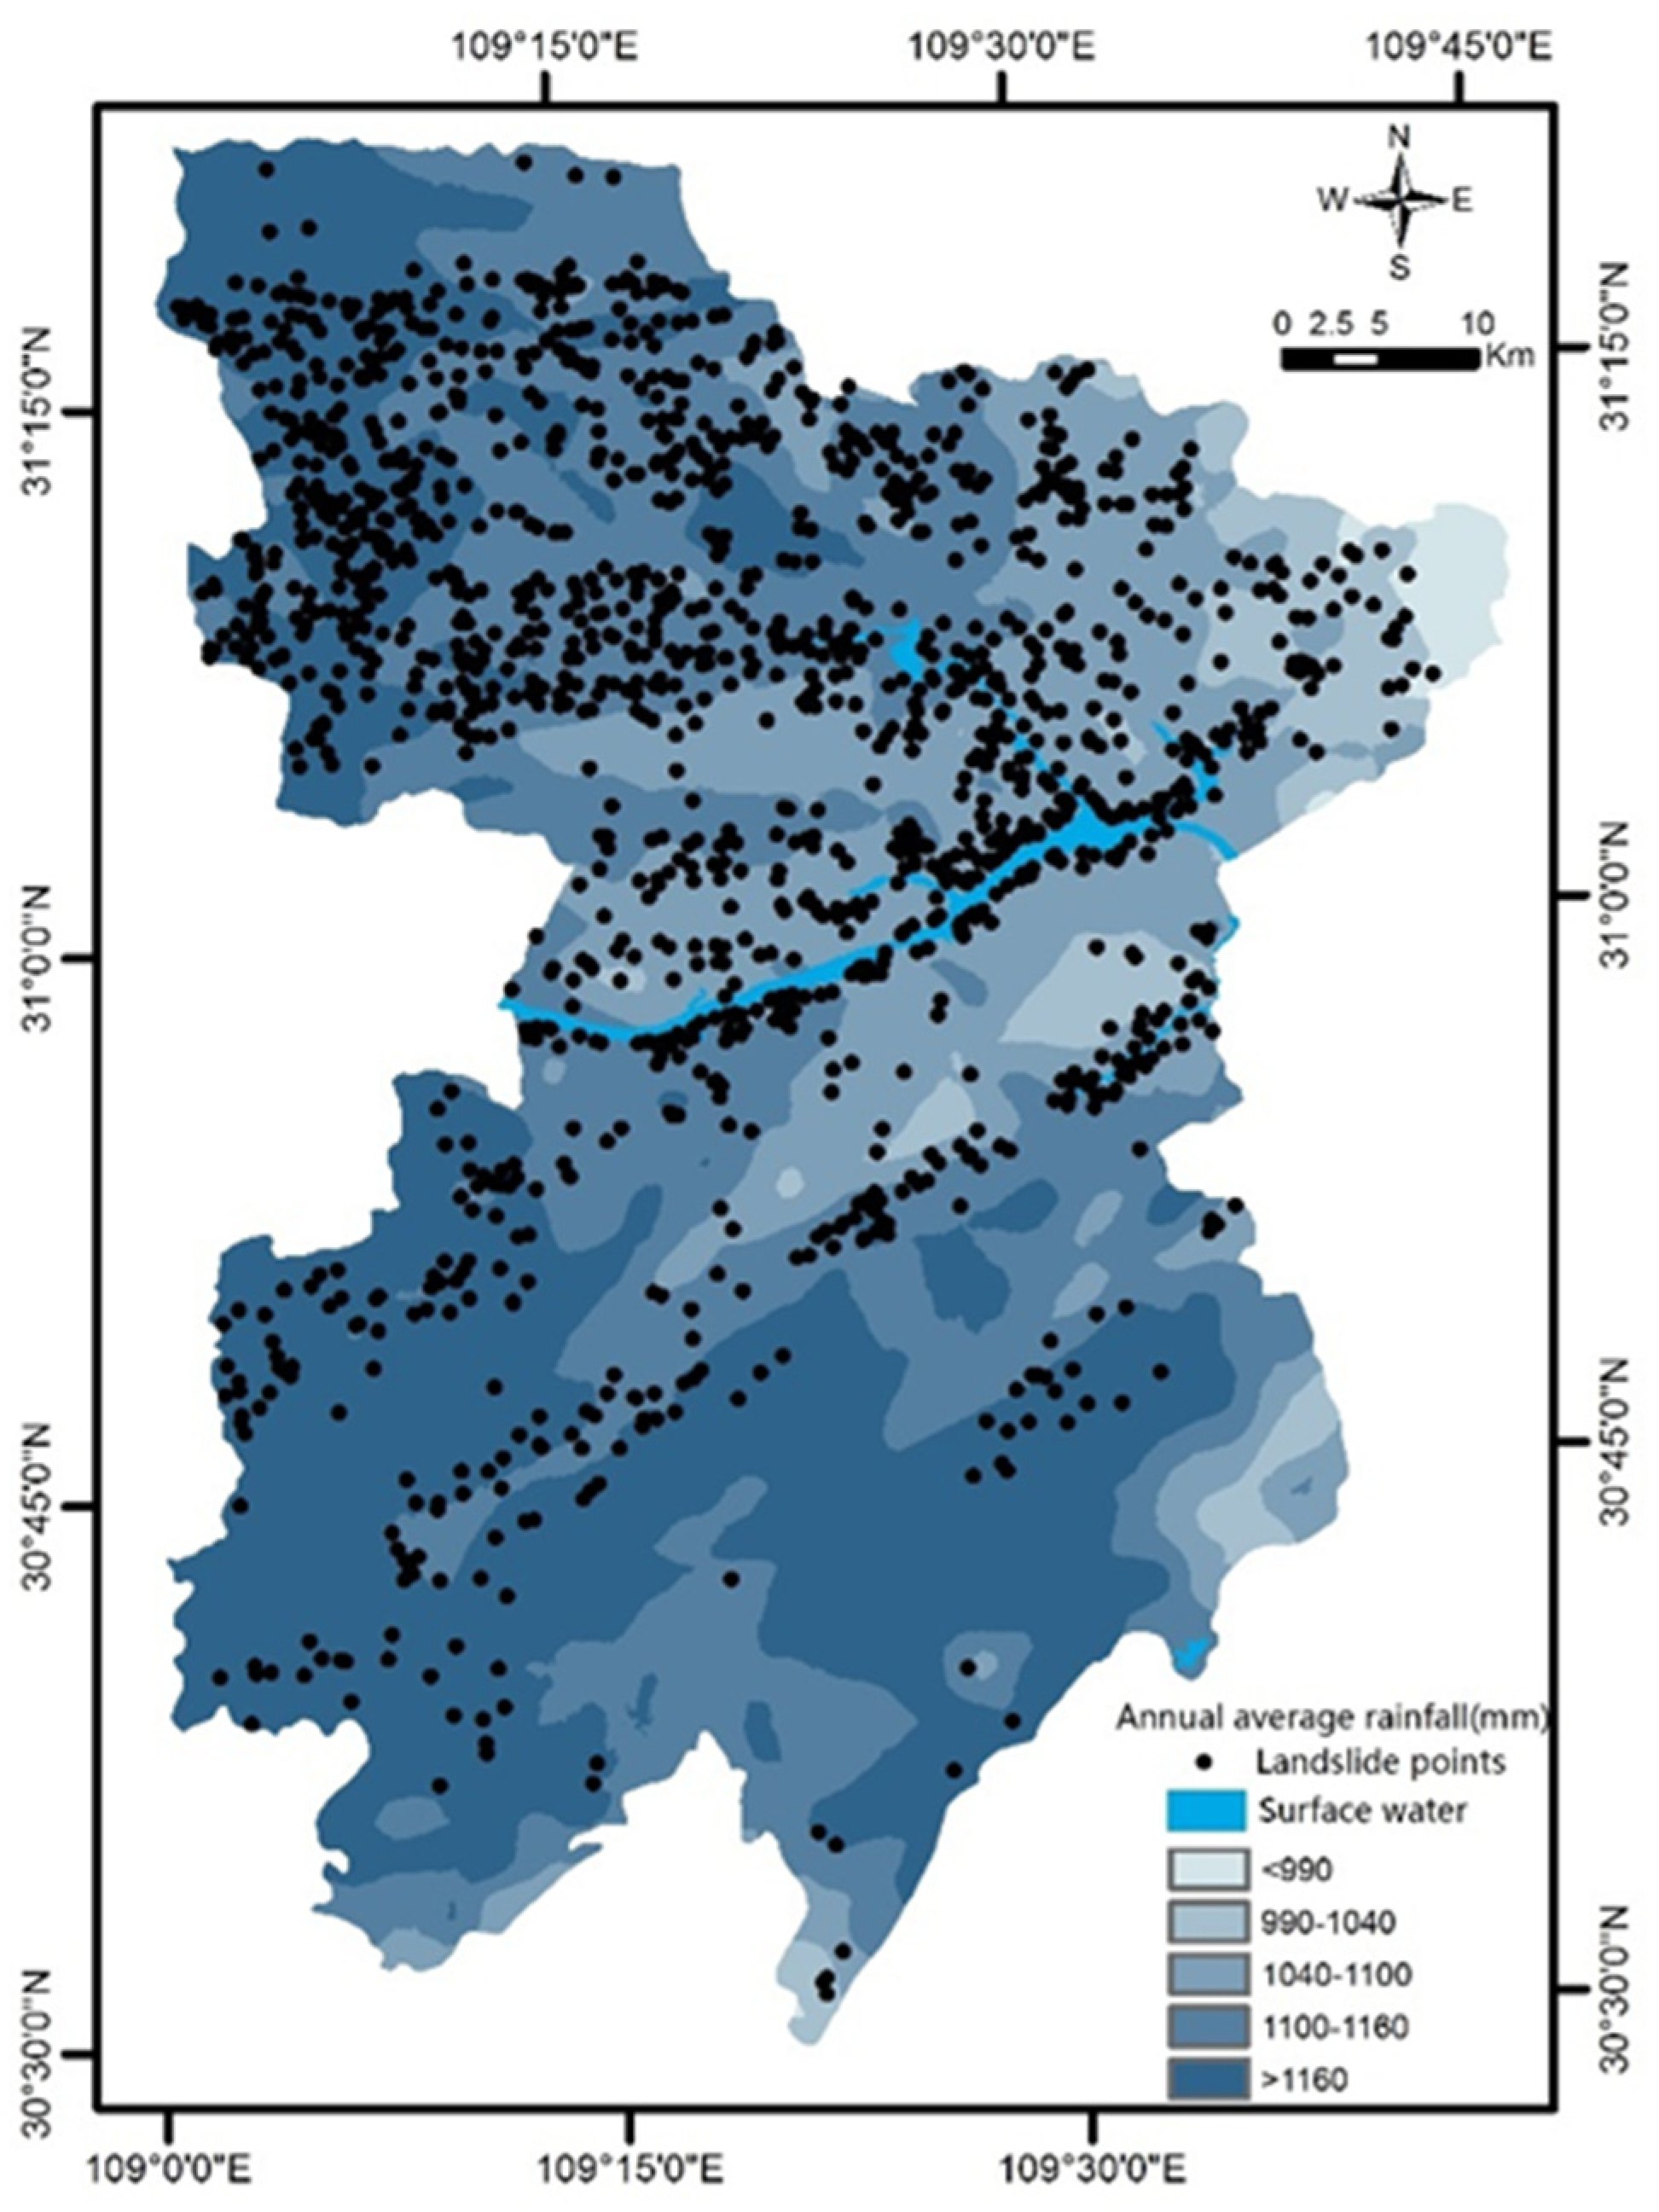
2.2. Study Area
2.3. Susceptibility Zoning
2.3.1. Selection of Influencing Factors
2.3.2. Treatment of Influencing Factors
2.3.3. Random Forest
2.3.4. Accuracy Verification
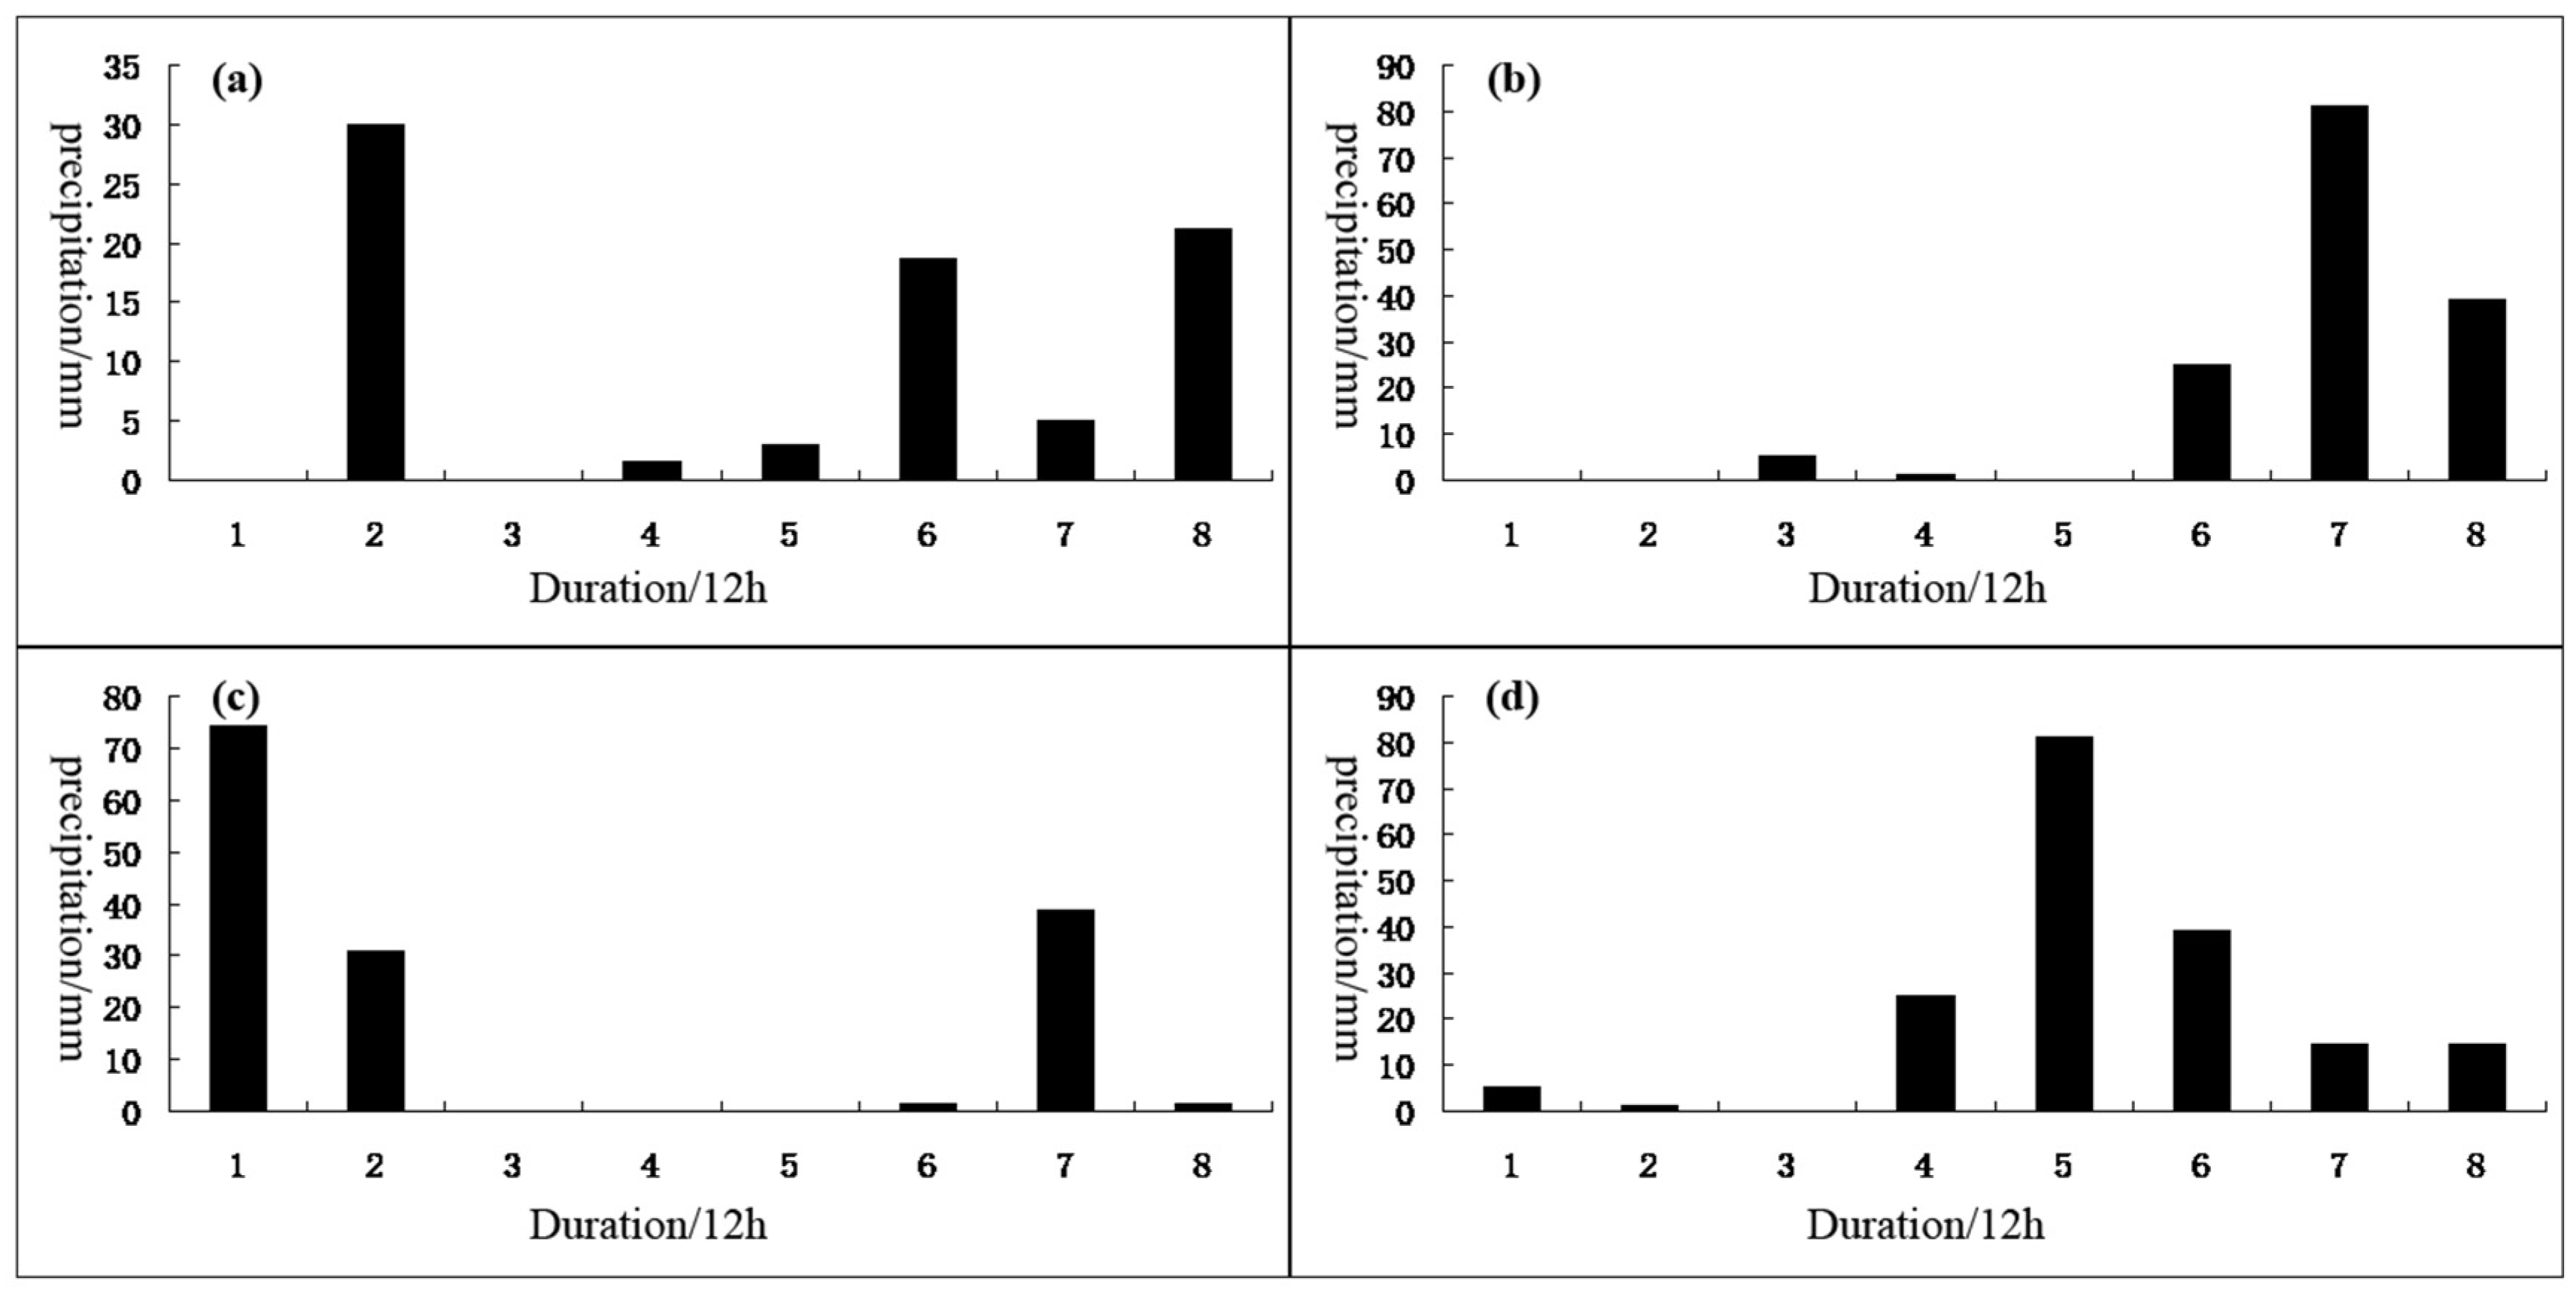
2.4. Fractal Model of Antecedent Effective Precipitation
2.5. Hybrid Model of the Antecedent Effective Precipitation and the Daily Precipitation under the Susceptibility Zoning
2.5.1. Threshold Model Based on Susceptibility Zoning and Antecedent Effective Precipitation
2.5.2. Analysis of Early Warning and Forecast of Landslide Coupled with Daily Precipitation
3. Result
3.1. Random Forest Susceptibility Evaluation
3.2. Antecedent Effective Precipitation Model
3.3. Calculation and Adjustment of Antecedent Effective Precipitation Threshold Based on Susceptibility Zoning
3.3.1. Threshold Model Based on Susceptibility Zoning and Antecedent Effective Precipitation
3.3.2. Warning Model Coupled with Daily Precipitation
3.4. Instance Verification
3.4.1. Regional Verification Analysis
3.4.2. Monomer Verification Analysis
4. Discussion
4.1. The Importance and Influence of Factors
4.2. Effectiveness of Antecedent Rainfall
4.3. Practical Application of Coupling Model of Susceptibility Zoning and Precipitation
5. Conclusions
- (1)
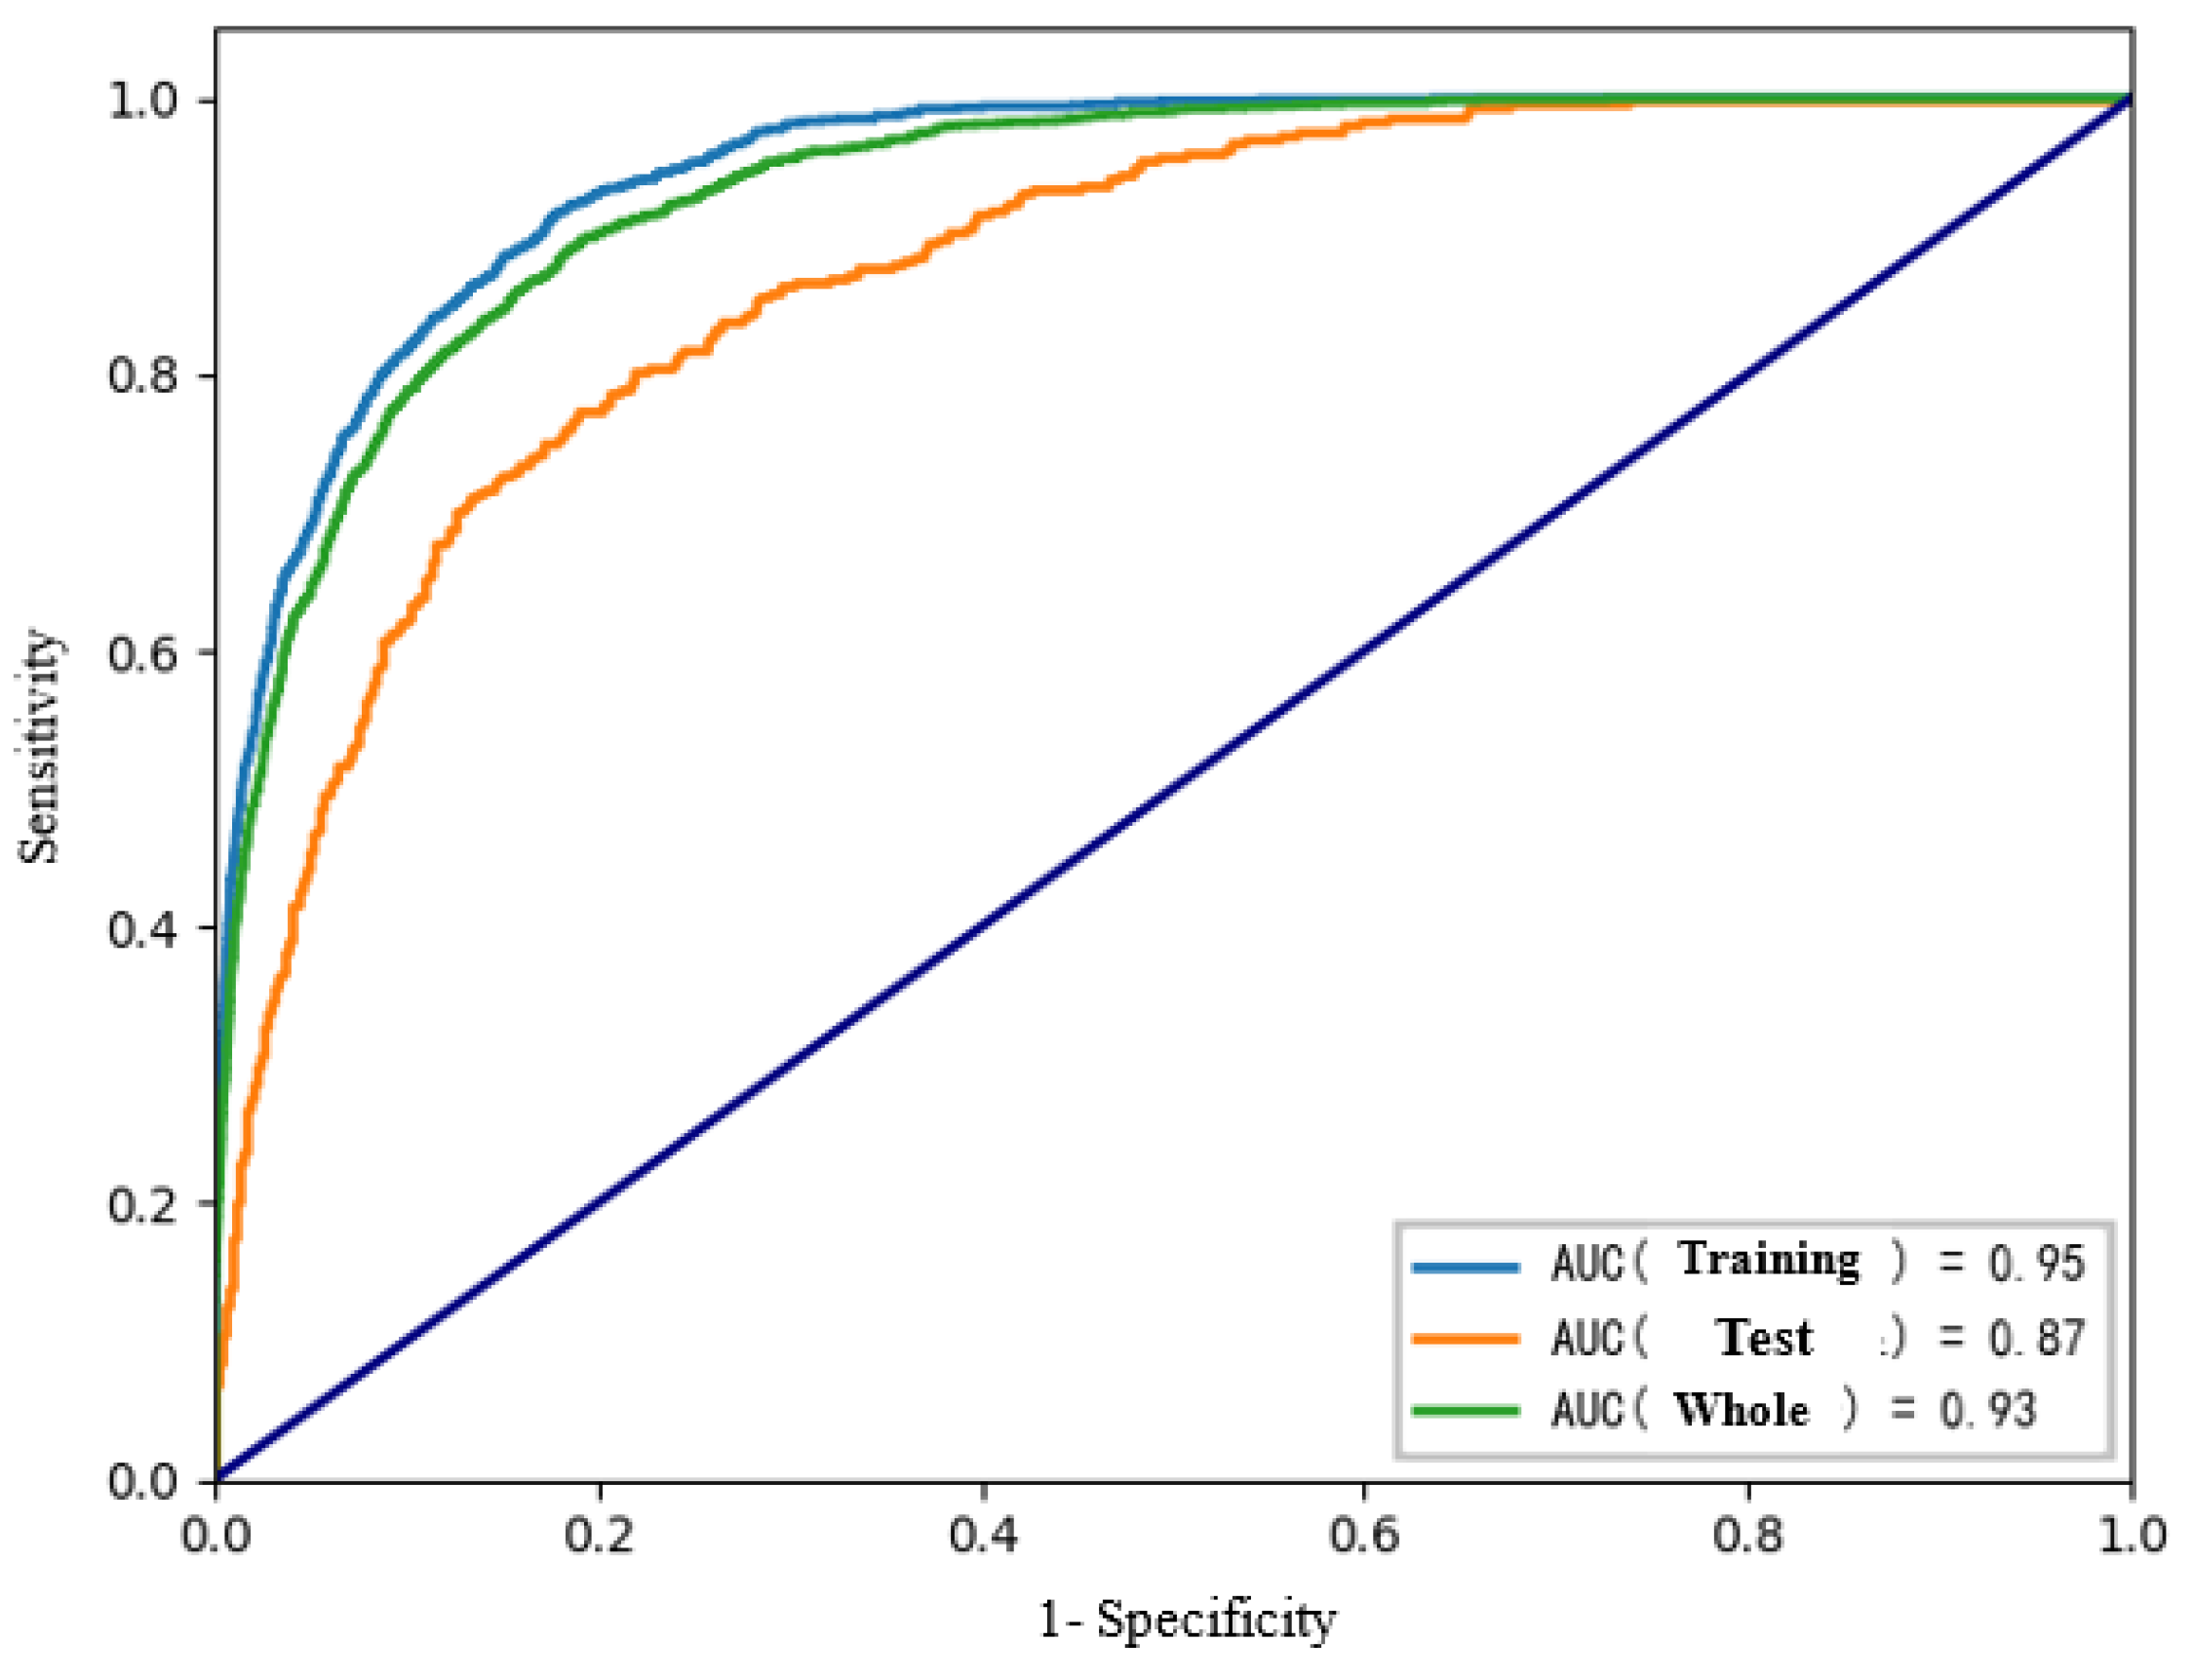
- The evaluation results of the landslide susceptibility model in Fengjie County based on RF are accurate and reasonable. The AUC value of the test set is 0.87, and the annual average rainfall and elevation are the factors that contribute the most to the model.
- (2)
- The early warning model of landslide susceptibility, the antecedent effective precipitation, and the daily precipitation coupling has higher accuracy than the model of landslide susceptibility and the antecedent effective precipitation coupling, and it can better characterize the mechanism of rainfall-induced landslides.
- (3)
- The landslide warning model based on random forest coupling of rainfall-inducing factors in landslide susceptibility zoning has high warning accuracy, which can provide a reference for areas with the same geological conditions and climatic conditions.
Author Contributions
Funding
Conflicts of Interest
References
- Huang, F.; Yin, K.; Huang, J.; Gui, L.; Wang, P. Landslide susceptibility mapping based on self-organizing-map network and extreme learning machine. Eng. Geol. 2017, 223, 11–22. [Google Scholar] [CrossRef]
- Chen, L.; Mei, L.; Zeng, B.; Yin, K.; Shrestha, D.P.; Du, J. Failure probability assessment of landslides triggered by earthquakes and rainfall: A case study in Yadong County, Tibet, China. Sci. Rep. 2020, 10, 16531. [Google Scholar] [CrossRef] [PubMed]
- Corominas, J.; van Westen, C.; Frattini, P.; Cascini, L.; Malet, J.P.; Fotopoulou, S.; Catani, F.; Van Den Eeckhaut, M.; Mavrouli, O.; Agliardi, F.; et al. Recommendations for the quantitative analysis of landslide risk. Bull. Eng. Geol. Environ. 2013, 73, 209–263. [Google Scholar] [CrossRef]
- Carrara, A.; Merenda, L. Landslide inventory in northern Calabria, southern Italy. Geol. Soc. Am. Bull. 1976, 87, 1153–1162. [Google Scholar] [CrossRef]
- Fausto, G.; Alberto, C.; Mauro, C.; Reichenbach, P. Landslide hazard evaluation: A review of current techniques and their application in a multi-scale study, Central Italy. Geomorphology 1999, 31, 181–216. [Google Scholar]
- Robert, S.; Westen, C.J.V. Slope instability Recognition, analysis and zonation. Landslides Investig. Mitig. 1996, 247, 129–177. [Google Scholar]
- Di Napoli, M.; Carotenuto, F.; Cevasco, A.; Confuorto, P.; Di Martire, D.; Firpo, M.; Pepe, G.; Raso, E.; Calcaterra, D. Machine learning ensemble modelling as a tool to improve landslide susceptibility mapping reliability. Landslides 2020, 17, 1897–1914. [Google Scholar] [CrossRef]
- Lombardo, L.; Opitz, T.; Ardizzone, F.; Guzzetti, F.; Huser, R. Space-time landslide predictive modelling. Earth-Sci. Rev. 2020, 209, 103318. [Google Scholar] [CrossRef]
- Komori, D.; Rangsiwanichpong, P.; Inoue, N.; Ono, K.; Watanabe, S.; Kazama, S. Distributed probability of slope failure in Thailand under climate change. Clim. Risk Manag. 2018, 20, 126–137. [Google Scholar] [CrossRef]
- Chen, W.; Peng, J.; Hong, H.; Shahabi, H.; Pradhan, B.; Liu, J.; Zhu, A.X.; Pei, X.; Duan, Z. Landslide susceptibility modelling using GIS-based machine learning techniques for Chongren County, Jiangxi Province, China. Sci. Total Environ. 2018, 626, 1121–1135. [Google Scholar] [CrossRef]
- Dou, J.; Yunus, A.P.; Tien Bui, D.; Merghadi, A.; Sahana, M.; Zhu, Z.; Chen, C.W.; Khosravi, K.; Yang, Y.; Pham, B.T. Assessment of advanced random forest and decision tree algorithms for modeling rainfall-induced landslide susceptibility in the Izu-Oshima Volcanic Island, Japan. Sci. Total Environ. 2019, 662, 332–346. [Google Scholar] [CrossRef] [PubMed]
- Kuradusenge, M.; Kumaran, S.; Zennaro, M. Rainfall-Induced Landslide Prediction Using Machine Learning Models: The Case of Ngororero District, Rwanda. Int. J. Environ. Res. Public. Health 2020, 17, 4147. [Google Scholar] [CrossRef] [PubMed]
- Lai, J.S.; Tsai, F. Improving GIS-based Landslide Susceptibility Assessments with Multi-temporal Remote Sensing and Machine Learning. Sensors 2019, 19, 3717. [Google Scholar] [CrossRef] [Green Version]
- Tien Bui, D.; Tuan, T.A.; Klempe, H.; Pradhan, B.; Revhaug, I. Spatial prediction models for shallow landslide hazards: A comparative assessment of the efficacy of support vector machines, artificial neural networks, kernel logistic regression, and logistic model tree. Landslides 2016, 13, 361–378. [Google Scholar] [CrossRef]
- Sun, D.; Xu, J.; Wen, H.; Wang, Y. An Optimized Random Forest Model and Its Generalization Ability in Landslide Susceptibility Mapping: Application in Two Areas of Three Gorges Reservoir, China. J. Earth Sci. 2020, 31, 1068–1086. [Google Scholar] [CrossRef]
- Moayedi, H.; Mehrabi, M.; Mosallanezhad, M.; Rashid, A.S.A.; Pradhan, B. Modification of landslide susceptibility mapping using optimized PSO-ANN technique. Eng. Comput-Ger. 2019, 35, 967–984. [Google Scholar] [CrossRef]
- Pourghasemi, H.R.; Rahmati, O. Prediction of the landslide susceptibility: Which algorithm, which precision? Catena 2018, 162, 177–192. [Google Scholar] [CrossRef]
- Zhou, X.; Wen, H.; Li, Z.; Zhang, H.; Zhang, W. An interpretable model for the susceptibility of rainfall-induced shallow landslides based on SHAP and XGBoost. Geocarto Int. TGEI 2022, 1–27. [Google Scholar] [CrossRef]
- Chen, W.; Xie, X.; Wang, J.; Pradhan, B.; Hong, H.; Bui, D.T.; Duan, Z.; Ma, J. A comparative study of logistic model tree, random forest, and classification and regression tree models for spatial prediction of landslide susceptibility. Catena 2017, 151, 147–160. [Google Scholar] [CrossRef] [Green Version]
- Sun, D.; Xu, J.; Wen, H.; Wang, D. Assessment of landslide susceptibility mapping based on Bayesian hyperparameter optimization: A comparison between logistic regression and random forest. Eng. Geol. 2021, 281, 105972. [Google Scholar] [CrossRef]
- Trigila, A.; Iadanza, C.; Esposito, C.; Scarascia-Mugnozza, G. Comparison of Logistic Regression and Random Forests techniques for shallow landslide susceptibility assessment in Giampilieri (NE Sicily, Italy). Geomorphology 2015, 249, 119–136. [Google Scholar] [CrossRef]
- Tsangaratos, P.; Ilia, I.; Hong, H.; Chen, W.; Xu, C. Applying Information Theory and GIS-based quantitative methods to produce landslide susceptibility maps in Nancheng County, China. Landslides 2016, 14, 1091–1111. [Google Scholar] [CrossRef]
- Alvioli, M.; Melillo, M.; Guzzetti, F.; Rossi, M.; Palazzi, E.; von Hardenberg, J.; Brunetti, M.T.; Peruccacci, S. Implications of climate change on landslide hazard in Central Italy. Sci. Total Environ. 2018, 630, 1528–1543. [Google Scholar] [CrossRef] [PubMed]
- Chang, K.-T.; Chiang, S.-H. An integrated model for predicting rainfall-induced landslides. Geomorphology 2009, 105, 366–373. [Google Scholar] [CrossRef]
- Guo, X.; Cui, P.; Li, Y.; Ma, L.; Ge, Y.; Mahoney, W.B. Intensity–duration threshold of rainfall-triggered debris flows in the Wenchuan Earthquake affected area, China. Geomorphology 2016, 253, 208–216. [Google Scholar] [CrossRef]
- Chien-Yuan, C.; Tien-Chien, C.; Fan-Chieh, Y.; Wen-Hui, Y.; Chun-Chieh, T. Rainfall duration and debris-flow initiated studies for real-time monitoring. Environ. Geol. 2005, 47, 715–724. [Google Scholar] [CrossRef]
- Guzzetti, F.; Peruccacci, S.; Rossi, M.; Stark, C.P. Rainfall thresholds for the initiation of landslides in central and southern Europe. Meteorol. Atmos. Phys. 2007, 98, 239–267. [Google Scholar] [CrossRef]
- Vessia, G.; Parise, M.; Brunetti, M.T.; Peruccacci, S.; Rossi, M.; Vennari, C.; Guzzetti, F. Automated reconstruction of rainfall events responsible for shallow landslides. Nat. Hazards Earth Syst. Sci. 2014, 14, 2399–2408. [Google Scholar] [CrossRef] [Green Version]
- Glade, T.; Crozier, M.; Smith, P. Applying Probability Determination to Refine Landslide-triggering Rainfall Thresholds Using an Empirical “Antecedent Daily Rainfall Model”. Pure Appl. Geophys. 2020, 157, 1059–1079. [Google Scholar] [CrossRef]
- Mathew, J.; Babu, D.G.; Kundu, S.; Kumar, K.V.; Pant, C.C. Integrating intensity–duration-based rainfall threshold and antecedent rainfall-based probability estimate towards generating early warning for rainfall-induced landslides in parts of the Garhwal Himalaya, India. Landslides 2013, 11, 575–588. [Google Scholar] [CrossRef]
- Sengupta, A.; Gupta, S.; Anbarasu, K. Rainfall thresholds for the initiation of landslide at Lanta Khola in north Sikkim, India. Nat. Hazards 2010, 52, 31–42. [Google Scholar] [CrossRef]
- Jemec, M.; Komac, M. Rainfall patterns for shallow landsliding in perialpine Slovenia. Nat. Hazards 2011, 67, 1011–1023. [Google Scholar] [CrossRef]
- Milne, F.D.; Brown, M.J.; Knappett, J.A.; Davies, M.C.R. Centrifuge modelling of hillslope debris flow initiation. Catena 2012, 92, 162–171. [Google Scholar] [CrossRef]
- Amiri, M.A.; Conoscenti, C. Landslide susceptibility mapping using precipitation data, Mazandaran Province, north of Iran. Nat. Hazards 2017, 89, 255–273. [Google Scholar] [CrossRef]
- Khan, S.; Kirschbaum, D.B.; Stanley, T. Investigating the potential of a global precipitation forecast to inform landslide prediction. Weather Clim. Extreme 2021, 33, 100364. [Google Scholar] [CrossRef]
- Beck, H.E.; Zimmermann, N.E.; McVicar, T.R.; Vergopolan, N.; Berg, A.; Wood, E.F. Present and future Koppen-Geiger climate classification maps at 1-km resolution. Sci. Data 2018, 5, 180214. [Google Scholar] [CrossRef] [Green Version]
- Iadanza, C.; Trigila, A.; Napolitano, F. Identification and characterization of rainfall events responsible for triggering of debris flows and shallow landslides. J. Hydrol. 2016, 541, 230–245. [Google Scholar] [CrossRef]
- Sun, D.; Wen, H.; Wang, D.; Xu, J. A random forest model of landslide susceptibility mapping based on hyperparameter optimization using Bayes algorithm. Geomorphology 2020, 362, 107201. [Google Scholar] [CrossRef]
- Wang, Y.; Sun, D.; Wen, H.; Zhang, H.; Zhang, F. Comparison of Random Forest Model and Frequency Ratio Model for Landslide Susceptibility Mapping (LSM) in Yunyang County (Chongqing, China). Int. J. Environ. Res. Public. Health 2020, 17, 4206. [Google Scholar] [CrossRef]
- Li, C.; Ma, T.; Li, W.; Zheng, A.; Zhu, X. Fractal relation of landslide frequency and rainfall. Chin. J. Geol. Hazard Control 2010, 21, 87–93. [Google Scholar]
- Li, C.; Ma, T.; Sun, L.; Zhu, X. A New Approach to Calibrate Antecedent Precipitation for Rainfall-triggering Landslide Forecast. Mt. Res. Dev. 2011, 29, 81–86. [Google Scholar]
- Liu, C.; Wen, M.; Tang, C. Meteorological early warning of geo-hazards in China based on raining forecast. Reg. Geol. China 2004, 23, 303–309. [Google Scholar]


| Influencing Factor | Meaning |
|---|---|
| Elevation | The distance from a point along the vertical line to the base surface |
| Slope | The degree of steepness of the surface unit |
| Aspect | The direction of the projection of the slope normal on the horizontal plane |
| Slope position | The landform part of the slope |
| Landforms | Relatively small-scale landforms, such as hills, valleys, terraces, etc. |
| Profile curvature | The rate of change of the surface slope at any point on the ground |
| TWI | The influence of regional topography on runoff flow direction and accumulation |
| Lithology | Some attributes that reflect the characteristics of the rock |
| Distance from faults | The distance to the nearest fault |
| CRDS | The relationship between rock inclination and slope aspect |
| NDVI | Percentage of vegetation area to the total statistical area |
| Distance from rivers | Distance to the nearest river |
| Land cover | Ways the land is used |
| Distance from roads | Distance to the nearest road |
| Distance from buildings | Distance to the nearest house |
| Annual average rainfall | Average annual rainfall over multiple years |
| Influencing Factor | Grade | Classification Standard |
|---|---|---|
| Elevation/(m) | 7 | 1. <340; 2. 340~595; 3. 595~850; 4. 850~1105; 5. 1105~1360; 6. 1360~1615; 7. >1615 |
| Slope/(°) | 6 | 1. <10°; 2. 10~20°; 3. 20~30°; 4. 30~40°; 5. 40~50°; 6. >50° |
| Aspect/(°) | 9 | 1. Flat; 2. North; 3. Northeast; 4. East; 5. Southeast; 6. South; 7. Southwest; 8. West; 9. Northwest |
| Slope position | 6 | 1. Valleys; 2. Lower slope; 3. Flat slope; 4. Middle slope; 5. Upper slope; 6. Ridge |
| Landforms | 10 | 1. Canyons, Deeply incised streams; 2. Mid-slope drainages, shallow valleys; 3. Upland drainages, headwaters; 4. U-shape valleys; 5. Plains; 6. Open slopes; 7. Upper slopes, mesas; 8. Local ridges, hills in valleys; 9. Mid-slope ridges, small hills in plains; 10. Mountain tops, high narrow ridges |
| Profile curvature | 7 | 1. −1.0; 2. −1~0.5; 3. −0.5~0; 4. 0~0.5; 5. 0.5~1.0; 6. 1.0~1.5; 7. >1.5 |
| TWI | 7 | 1. <10; 2. 10~12; 3. 12~14; 4. 14~16; 5. 16~18; 6. 18~20; 7. >20 |
| Lithology | 7 | 1. TJx; 2. T1j; 3. D; 4. T1d-j; 5. J2s, J1z-2x, J3sn, J3p; 6. T1d, T3xj, T2b; 7. P, P3 |
| Distance from faults/(m): | 11 | 1. <100; 2. 100~200; 3. 200~300; 4. 300~400; 5. 400~500; 6. 500~600; 7. 600~700; 8. 700~800; 9. 800~900; 10. 900~1000; 11. >1000 |
| CRDS | 6 | 1. Bedding slope; 2. Skewed slope; 3. Inclined slope; 4. Horizontal; 5. Reverse slope; 6. Flat |
| NDVI | 7 | 1. <0.10; 2. 0.10~0.20; 3. 0.20~0.30; 4. 0.30~0.40; 5. 0.40~0.50; 6. 0.50~0.60; 7. >0.60 |
| Distance from rivers/(m) | 7 | 1. <100; 2. 100~200; 3. 200~300; 4. 300~400; 5. 400~500; 6. 500~600; 7. >600 |
| Land cover | 6 | 1. Cultivated land; 2. Woodland; 3. Meadow; 4. Land used for building; 5. Water area; 6. Unused land |
| Distance from roads/(m) | 7 | 1. <100; 2. 100~200; 3. 200~300; 4. 300~400; 5. 400~500; 6. 500~600; 7. >600 |
| Distance from buildings/(m) | 7 | 1. <100; 2. 100~200; 3. 200~300; 4. 300~400; 5. 400~500; 6. 500~600; 7. >600 |
| Annual average rainfall/(mm) | 5 | 1. <990; 2. 990~1040; 3. 1040~1100; 4. 1100~1160; 5. >1160 |
| Precipitation/mm | The Landslide Day | From the Day of the Landslide to 3 Days before | From the Day of the Landslide to 5 Days before | From the Day of the Landslide to 10 Days before | |
|---|---|---|---|---|---|
| Cumulative Frequency of Landslides/% | |||||
| 75 | 69.9 | 146.4 | 252.9 | 273.4 | |
| 90 | 92.7 | 233.2 | 330.7 | 372.3 | |
| Difference | 22.8 | 86.8 | 77.8 | 98.9 | |
| 1 Day before | 2 Days before | 3 Days before | 4 Days before | 5 Days before | 6 Days before | 7 Days before | 8 Days before | 9 Days before | 10 Days before | |
|---|---|---|---|---|---|---|---|---|---|---|
| 90% | 0.344 | 0.219 | 0.161 | 0.127 | 0.105 | 0.090 | 0.078 | 0.069 | 0.062 | 0.056 |
| Susceptibility Zoning | Frequency of Landslides | Effective Precipitation in the First 10 Days (mm) | Warning Level |
|---|---|---|---|
| Very low | 25% | 96 | Yellow |
| 40% | 129 | Orange | |
| 55% | 137 | Red | |
| Low | 25% | 58 | Yellow |
| 40% | 87 | Orange | |
| 55% | 114 | Red | |
| Moderate | 25% | 51 | Yellow |
| 40% | 87 | Orange | |
| 55% | 109 | Red | |
| High | 25% | 49 | Yellow |
| 40% | 87 | Orange | |
| 55% | 109 | Red | |
| Very high | 25% | 6 | Yellow |
| 40% | 58 | Orange | |
| 55% | 109 | Red |
| Warning Level | Very Low Areas (mm) | Low Areas (mm) | Moderate Areas (mm) | High Areas (mm) | Very High Areas (mm) |
|---|---|---|---|---|---|
| Yellow | 90 | 71 | 52 | 33 | 14 |
| Orange | 118 | 104 | 89 | 75 | 61 |
| Red | 128 | 122 | 116 | 109 | 103 |
| Original Warning Level | Very Low Areas | Low Areas | Moderate Areas | High Areas | Very High Areas |
|---|---|---|---|---|---|
| Blue | Blue | Blue | Blue | Yellow (Light rain) | Orange (Light rain) |
| Yellow | Yellow | Yellow | Yellow | Orange (Heavy rain) | Orange (Light rain) |
| Orange | Red (rainstorm) | Red (Heavy rain) | Red (Heavy rain) | Red (Heavy rain) | Red (Heavy rain) |
| Red | Red | Red | Red | Red | Red |
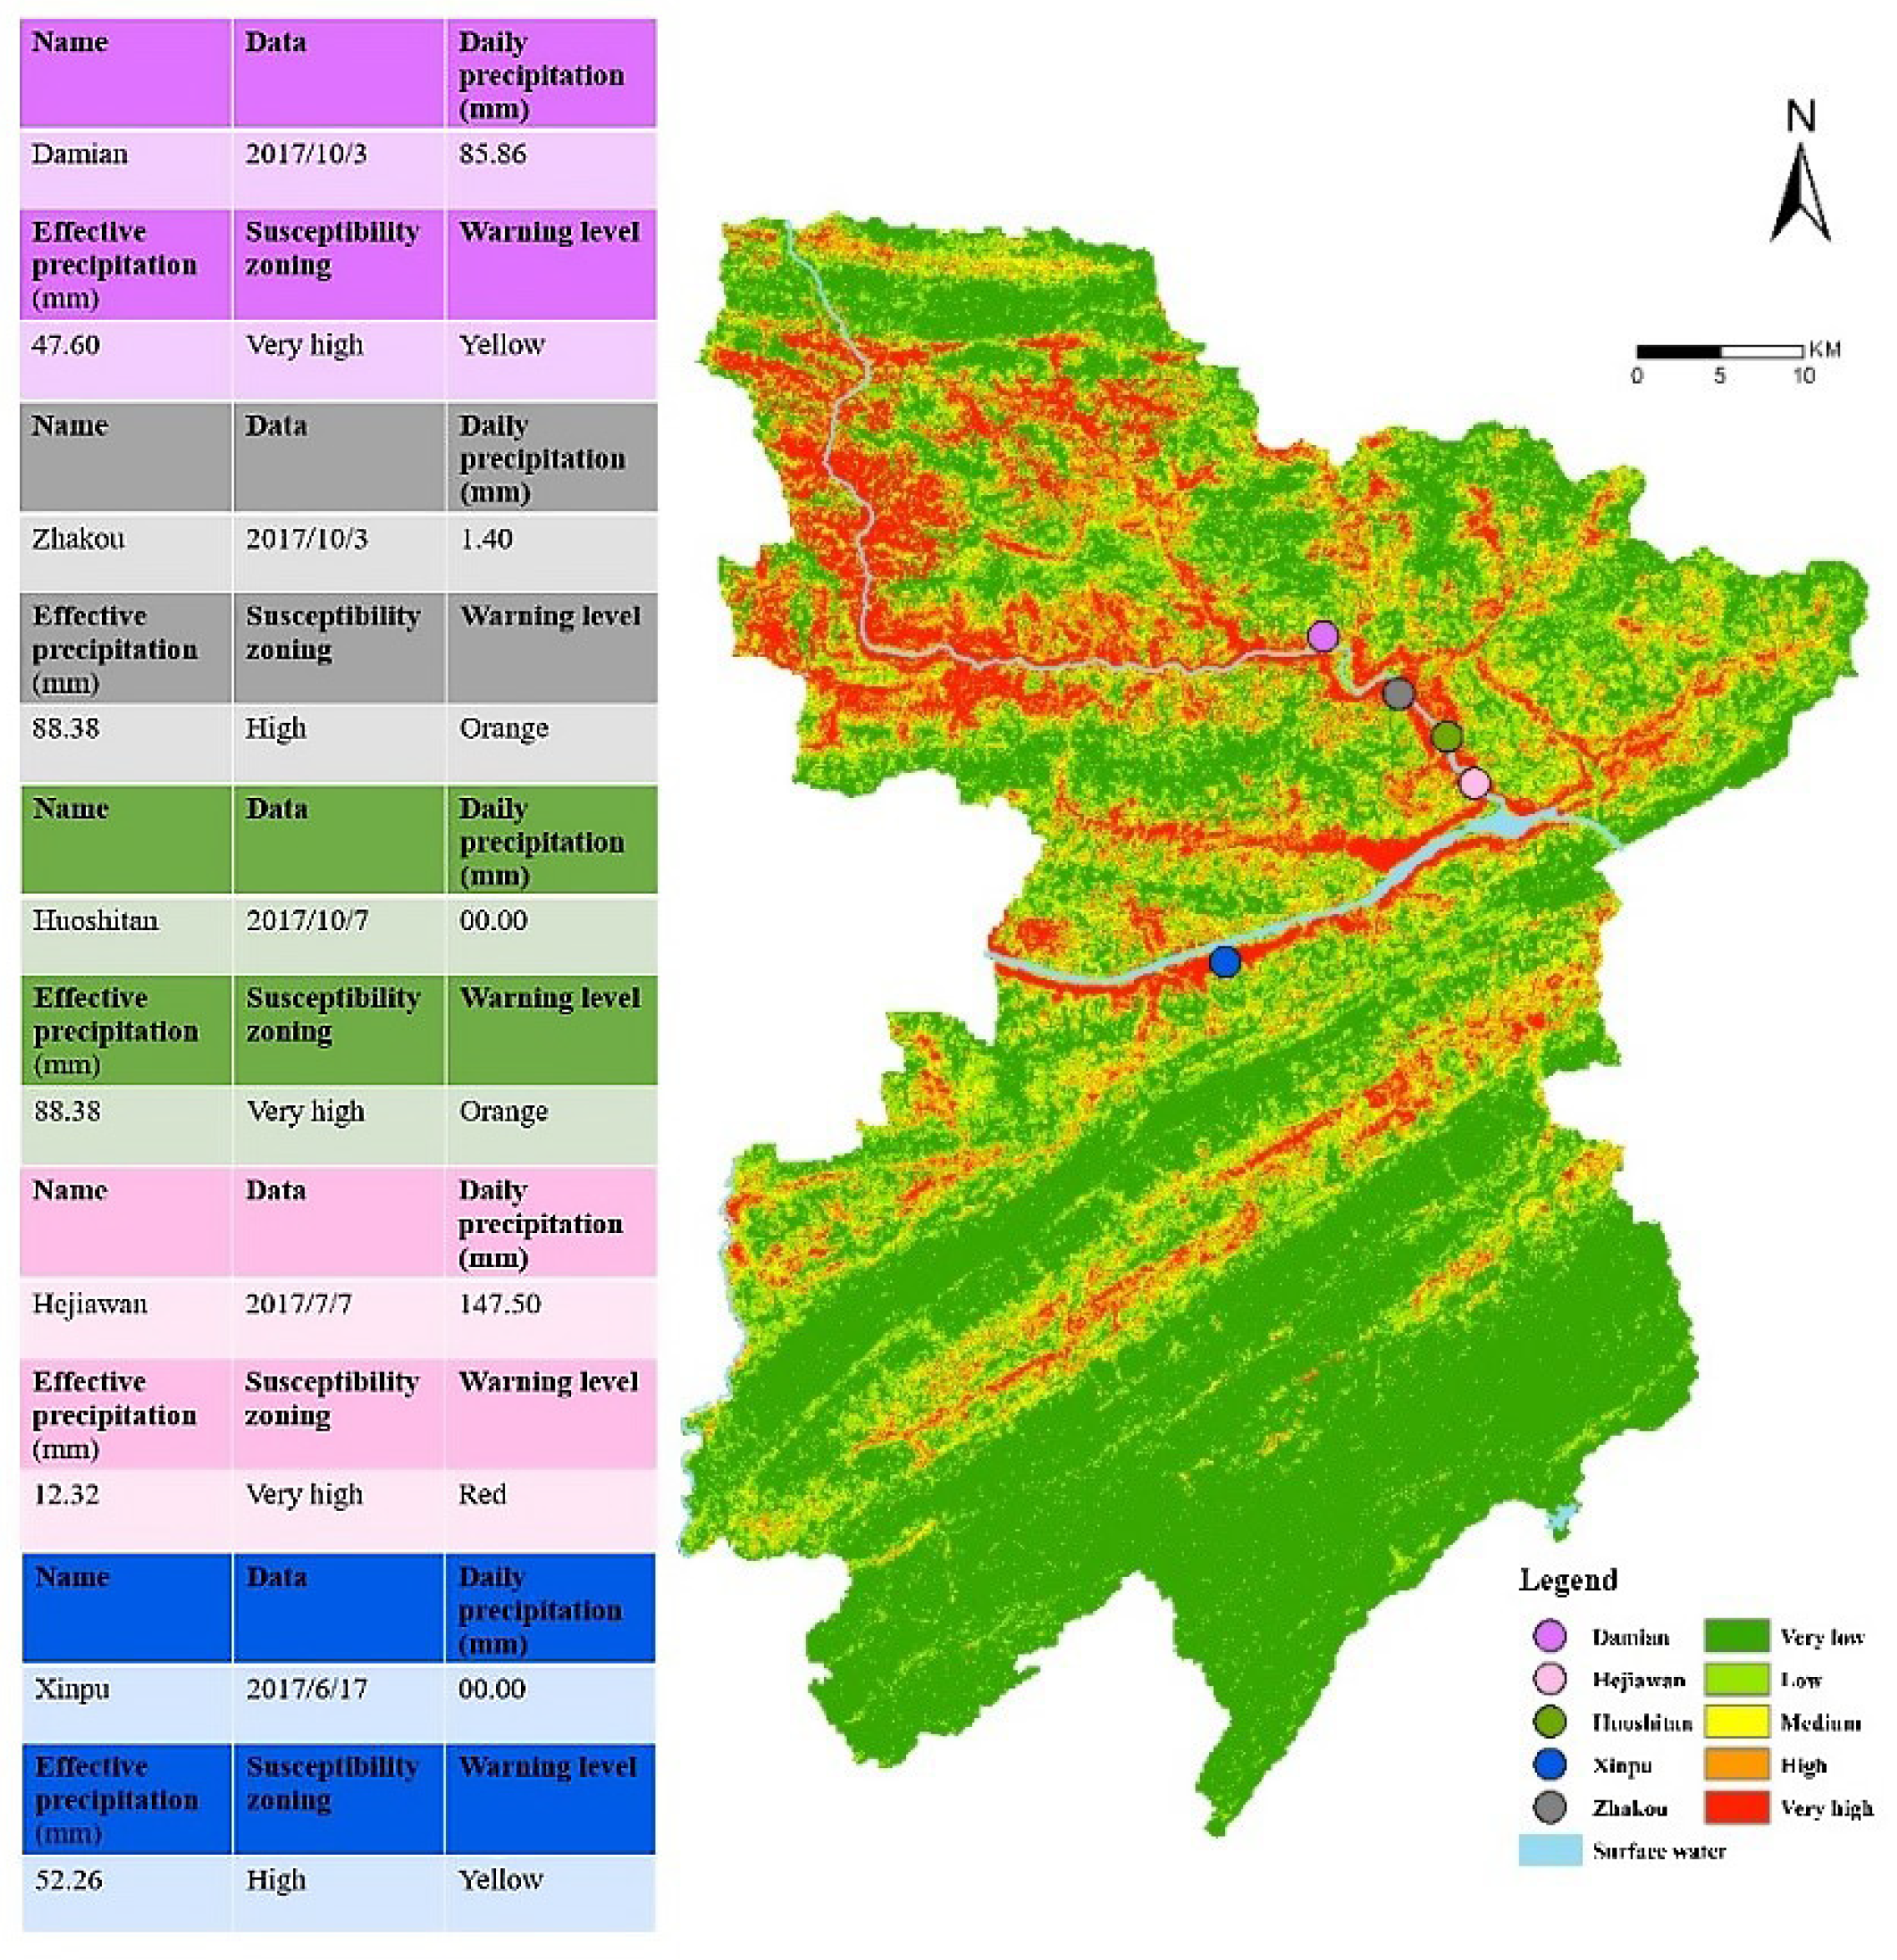
| Number | Name | Susceptibility Zoning | Antecedent Precipitation (mm) | Daily Precipitation (mm) | Warning Level | Actual Catastrophe | ||
|---|---|---|---|---|---|---|---|---|
| Antecedent Precipitation | Daily Precipitation | Adjusted Level | ||||||
| 1 | Damian | Very high | 47.6 | 85.86 | Safe | Yellow | Yellow | Continuous deformation Continuous deformation |
| 2 | Hejiawan | Very high | 12.32 | 147.5 | Safe | Red | Red | Small area collapse |
| New deformation crack | ||||||||
| 3 | Huoshitan | Very high | 88.38 | 0 | Orange | Blue | Orange | Continuous deformation |
| Multiple cracks | ||||||||
| 4 | Zhakou | High | 93.8 | 1.4 | Orange | Blue | Orange | Continuous deformation |
| Multiple cracks | ||||||||
| 5 | Xinpu | High | 52.26 | 0 | Yellow | Blue | Yellow | Local deformation |
Publisher’s Note: MDPI stays neutral with regard to jurisdictional claims in published maps and institutional affiliations. |
© 2022 by the authors. Licensee MDPI, Basel, Switzerland. This article is an open access article distributed under the terms and conditions of the Creative Commons Attribution (CC BY) license (https://creativecommons.org/licenses/by/4.0/).
Share and Cite
Sun, D.; Gu, Q.; Wen, H.; Shi, S.; Mi, C.; Zhang, F. A Hybrid Landslide Warning Model Coupling Susceptibility Zoning and Precipitation. Forests 2022, 13, 827. https://doi.org/10.3390/f13060827
Sun D, Gu Q, Wen H, Shi S, Mi C, Zhang F. A Hybrid Landslide Warning Model Coupling Susceptibility Zoning and Precipitation. Forests. 2022; 13(6):827. https://doi.org/10.3390/f13060827
Chicago/Turabian StyleSun, Deliang, Qingyu Gu, Haijia Wen, Shuxian Shi, Changlin Mi, and Fengtai Zhang. 2022. "A Hybrid Landslide Warning Model Coupling Susceptibility Zoning and Precipitation" Forests 13, no. 6: 827. https://doi.org/10.3390/f13060827