Article

Three Adhesive Recipes Based on Magnesium Lignosulfonate, Used to Manufacture Particleboards with Low Formaldehyde Emissions and Good Mechanical Properties

by
Gabriela Balea (Paul)
,
Aurel Lunguleasa
*,
Octavia Zeleniuc
and
Camelia Coşereanu
Wood Processing and Design of Wooden Product Department, Transilvania University of Brasov, 29 Street Eroilor, 500038 Brasov, Romania
*
Author to whom correspondence should be addressed.
Forests 2022, 13(5), 737; https://doi.org/10.3390/f13050737
Submission received: 17 March 2022 / Revised: 6 May 2022 / Accepted: 6 May 2022 / Published: 9 May 2022
(This article belongs to the Special Issue Novelties in Wood Engineering and Forestry)

Abstract

:
Adhesives represent an important part in the wood-based composite production, and taking into account their impact on the environment and human health, it is a challenge to find suitable natural adhesives. Starting from the current concerns of finding bio-adhesives, this paper aims to use magnesium lignosulfonate in three adhesive recipes for particleboard manufacturing. First, the adhesive recipes were established, using oxygenated water to oxidize magnesium lignosulfonate (Recipe 1) and adding 3% polymeric diphenylmethane diisocyanate (pMDI) crosslinker (Recipe 2) and a mixture of 2% polymeric diphenylmethane diisocyanate with 15% glucose (Recipe 3). The particleboard manufacturing technology included operations for sorting particles and adhesive recipes, pressing the mats, and testing the mechanical strengths and formaldehyde emissions. The standardized testing methodology for formaldehyde emissions used in the research was the method of gas analysis. Tests to determine the resistance to static bending and internal cohesion for all types of boards and recipes were also conducted. The average values of static bending strengths of 0.1 N/mm2, 0.38 N/mm2, and 0.41 N/mm2 were obtained for the particleboard manufacturing with the three adhesive recipes and were compared with the minimal value of 0.35 N/mm2 required by the European standard in the field. Measuring the formaldehyde emissions, it was found that the three manufacturing recipes fell into emission classes E1 and E0. Recipes 2 and 3 were associated with good mechanical performances of particleboards, situated in the required limits of the European standards. As a main conclusion of the paper, it can be stated that the particleboards made with magnesium-lignosulphonate-based adhesive, with or without crosslinkers, can provide low formaldehyde emissions and also good mechanical strengths when crosslinkers such as pMDI and glucose are added. In this way magnesium lignosulfonate is really proving to be a good bio-adhesive.

1. Introduction

Formaldehyde emission is a current problem for wood-based composite materials, including particleboards. In addition to irritation of the nose and eyes and respiratory cancer, long exposure to formaldehyde emission has been shown to have a carcinogenic effect on human blood, causing irreversible mutations [1,2]. Therefore, since 1970, the limit of emissions of formaldehyde had to be continuously reduced, falling within tight tolerances [3]. It should be recognized that wood, due to its chemical composition, has a certain formaldehyde content that is acceptable to human breathing, which could be taken as a reference in the classification of formaldehyde emissions from wood-based boards. Common European wood species, such as beech, spruce, oak, pine, etc., have values of formaldehyde emission of 0.114–0.431 mg/m2h for a moisture content of over 50% (decreasing moisture content also decreases formaldehyde emissions) [3]. The most used methods for testing the formaldehyde emissions and contents of wood composites are the following [3]: large and normal chamber method according to EN 717-1: 2004 [4] and ASTM E 1333: 2014 [5], the gas analysis method according to standard EN 717-2: 1995 [6] and ISO 12460-3: 2015, the perforator method according to EN 120: 1992 [7], and the desiccator method according to JIS A 1460: 2001 [8]. Less used is the vial method according to EN 717-3: 1996 [9]. The permissible emission limits and formaldehyde contents are given in Table 1 [3]. In European countries, only the E1 class is allowed for wood-based panels, and, in addition, other countries already require the E0 class, which is half of E1.
It is well-known that formaldehyde-based adhesives, such as urea-formaldehyde (UF) and phenol-formaldehyde (PF) are not environmentally friendly because of formaldehyde release. In this context, some solutions must be found to modify or replace them. Because the main material that increases the amount of formaldehyde in a particleboard is the adhesive (except pMDI—polymeric diphenylmethane diisocyanate), some concerns about reducing formaldehyde emissions/content and obtaining bio-adhesives or green adhesives have had and continue to have three main directions:
  • Reducing emissions by using formaldehyde catchers in the adhesive recipe of urea-formaldehyde [UF] or phenol-formaldehyde [PF] adhesives;
  • The use of bio-adhesives with very low formaldehyde emissions/contents to replace the classical synthetic adhesives;
  • The use of crosslinking agents, both for classic adhesives and for bio-adhesives.
The first method of reducing emissions by using formaldehyde catchers has been used for a long time and has gained the attention of many researchers [10,11]. The emission of formaldehyde from urea-formaldehyde adhesives depends on the molar ratio between urea and formaldehyde and also on the environmental conditions during the manufacturing process (temperature, air humidity, etc.) [12]. Usually, these catchers are obtained from natural materials such as bio-oils, tannin, soy, or lignin [3,13] and are used in recipes with UF and UMF resins for MDF (medium-density fiberboard), with formaldehyde emissions of 0.04–0.08 ppm or 2.5–3.0 mg/100 g. Various adhesives were obtained by gradually replacing the phenol in phenol-formaldehyde adhesives with lignosulfonates. The best mechanical strengths were obtained by adding 20% lignosulfonate to the PF resin [14]. The use of the same recipes in particleboard manufacturing led to emission class E0 (equivalent to class F ***), with values of 0.02–0.04 ppm or 3–3.5 mg/100 g [3]. Another formaldehyde catcher was soy protein or rapeseed, which were used in the case of UF resins for the manufacture of particleboard with a density of 680 kg/m3 and a formaldehyde emission belonging to class E1 [15,16,17,18]. Other catchers of formaldehyde were wheat gluten as well as the leftovers from the production of starch, pea protein, or cottonseed protein [19,20,21].
The tannins used in the production of adhesives for wood-based composites reduce the emission of formaldehyde, but in a pure state they do not provide good strengths when used in combination with classical UF or PF adhesives [22]. Particleboard made with tannin and formaldehyde adhesives had very low formaldehyde emissions and induced good mechanical strength for indoor use panels [23,24,25,26]. Another study [27] investigated the role of nano-clay (cloisite Na+) in reducing formaldehyde emissions from particleboards. The specimens without the addition of nano-clay emitted about three times more formaldehyde compared to the boards that contained only 1% nano-clay. Other acid catalysts, such as oxalic or citric acid, have reduced the formaldehyde content from 4.1 mg/100 g to 3.5 mg/100 g. Moreover, the addition of pMDI reduced this formaldehyde content by half. The addition of 1.5% silicon nano-dioxide (SiO2) improved the strength of UF resin-bonded boards and substantially improved the emission of formaldehyde [28].
Usually, bio-adhesives use waste or other natural materials, such as plant extract, wood biomass, vegetable and animal proteins, etc. However, they have a low reactivity, which is why more studies are needed to increase their reactivity, but the raw materials used could increase the price of the final board. Moreover, the mechanical strengths of the boards with bio-adhesives are lower than those obtained with the classical synthetic adhesives UF or PF. One of these bio-adhesives is lignin in the form of ammonium lignosulfonate [29], alone or in combination with pMDI resin. Lignin from lignosulphonate has the capacity of adhesion, as the native lignin has in time of tree growth. Some researchers in the field of bio-adhesives have obtained an adhesive based on soy protein with modest hydrophobic and mechanical performance. Soy protein has been mixed with lignin in other studies [30], thereby improving water resistance. The use of other types of proteins, such as wheat gluten, which is a by-product of starch production, pea protein, or cottonseed protein, has also been considered. The most used adhesive in the lignocellulosic boards is the urea-formaldehyde adhesive UF; it has the highest mechanical strength (well above the minimum required limit), which is why in the recipe of this adhesive solution filler is included to reduce the costs of adhesion. This adhesive also has the highest formaldehyde emissions, requiring formaldehyde catchers, which greatly increase the cost of adhesion. This is why bio-adhesives are the cheap solution to replace UF adhesive. Even if the mechanical performance of the boards is weaker, it can fall within the minimum required limit of European standards [10].
Crosslinking agents promoted the formation of intermolecular bonds between polymer chains (glyoxal, pMDI, sugars, furfuryl and furfuryl alcohol, citric acid, maleic anhydride, etc.). One of these agents is glyoxal [29]; it was noticed that when using a mixture of 0.5% glyoxal and 50% lignin as an adhesive in the production of particleboard and plywood, the panels recorded good mechanical strengths and were also environmentally friendly. Another crosslinking agent used in the particleboard manufacturing is pMDI [31], used in proportions of 4, 6, and 8%, with favorable effects on water resistance and mechanical strength. Moreover, the tannins can be mixed in the adhesives used for the production of plywood, chipboard, OSB, MDF, glulam, and LVL. Tannin extract offers a significant potential for resorcinol replacement, thus reducing the costs of gluing in the production of fiberboard-type wood composites [32]. Some studies have shown that the addition of nano-clays contributes to an improvement in the mechanical strength of boards with lignin-based adhesives [33,34].
Some researchers have shown that addition of different share rates of phenolated Kraft lignin [34] or lignosulfonates in PF and UF resins could reduce the formaldehyde emission. Industrial lignin (Kraft lignin) or in the form of lignosulfonate (such ammonium or magnesium lignosulfonates) is a residual by-product that is obtained after the production of cellulose (pulp and paper) following the chemical separation of cellulose from lignin. Therefore, lignosulfonate is a residual and natural product, as it is obtained from wood, which is why it is a good bio-adhesive. Moreover, being a chemical constituent of wood, it has a low formaldehyde emission. In its pure state, lignin has low adhesion, and its reactivity needs to be improved. In this regard, hydrolyzed lignin treated with oxygen plasma was obtained [35] with good results on changing the chemical structure of lignin and increasing reactivity [36], increasing reactivity by hydroxy methylation [37,38] and oxidation of this [36,39]. The oxidation of lignin was a practical way to weaken its structure, being more easily polymerizable [40]. The simplest oxidation procedure is the addition of oxygen peroxide, especially due to its ecological characteristics [41,42]. Oxidation was performed both in an acidic medium using FeSO4 as reagents and in a basic medium with NaOH. Research on the use of magnesium lignosulfonate as a bio-adhesive has been conducted for veneered fiberboards [43,44,45,46]. Actual research [47,48,49,50,51,52] has shown that the introduction of a small percentage of ammonium lignosulfonate in the boards leads to good mechanical properties and a formaldehyde content of only 1.1 mg/100 g of dry plate, super quality E0. Other research has examined the use of recycled wood [53], the use of magnesium lignosulfonate for wood composites [54], the availability of wood and vegetable resources for the next 20 years in the Czech Republic [55], and the main bio-adhesives used in the last decade [56].
From the analysis of the research works in the field, a first conclusion can be drawn, namely, that the bio-adhesives based on lignosulfonates occupied an important place in international research on reducing the emission/content of formaldehyde in particleboard, but their performance has not been fully investigated. There are also a lot of studies oriented to increase the reactivity of lignin, as its reactivity is low in a pure state, the most widely used method being that of oxidation. Last but not least, there are very few studies on the use of magnesium lignosulfonate in the manufacture of bio-adhesives for particleboard. The general objective of the present research work is to manufacture particleboards with low formaldehyde emissions, using three adhesive recipes based on magnesium lignosulfonate that is oxidized with hydrogen peroxide. These boards will have to meet the mechanical strength conditions (MOR, MOE, and IB) imposed by the European standard EN 312: 2003 [57] for indoor uses in a dry environment (type P2). Moreover, the boards will have to fall into the E1 class of formaldehyde (or lower), corresponding to the European standard EN 717-2: 1995 [6] with a limit of 3.5 mg/m2h obtained by the gas analysis method. In order s to fall into emission classes E0 (corresponding to emission class F ****) using the gas analysis method, the measured value for the particleboard’s formaldehyde emissions must be below 1.4 mg/m2h.

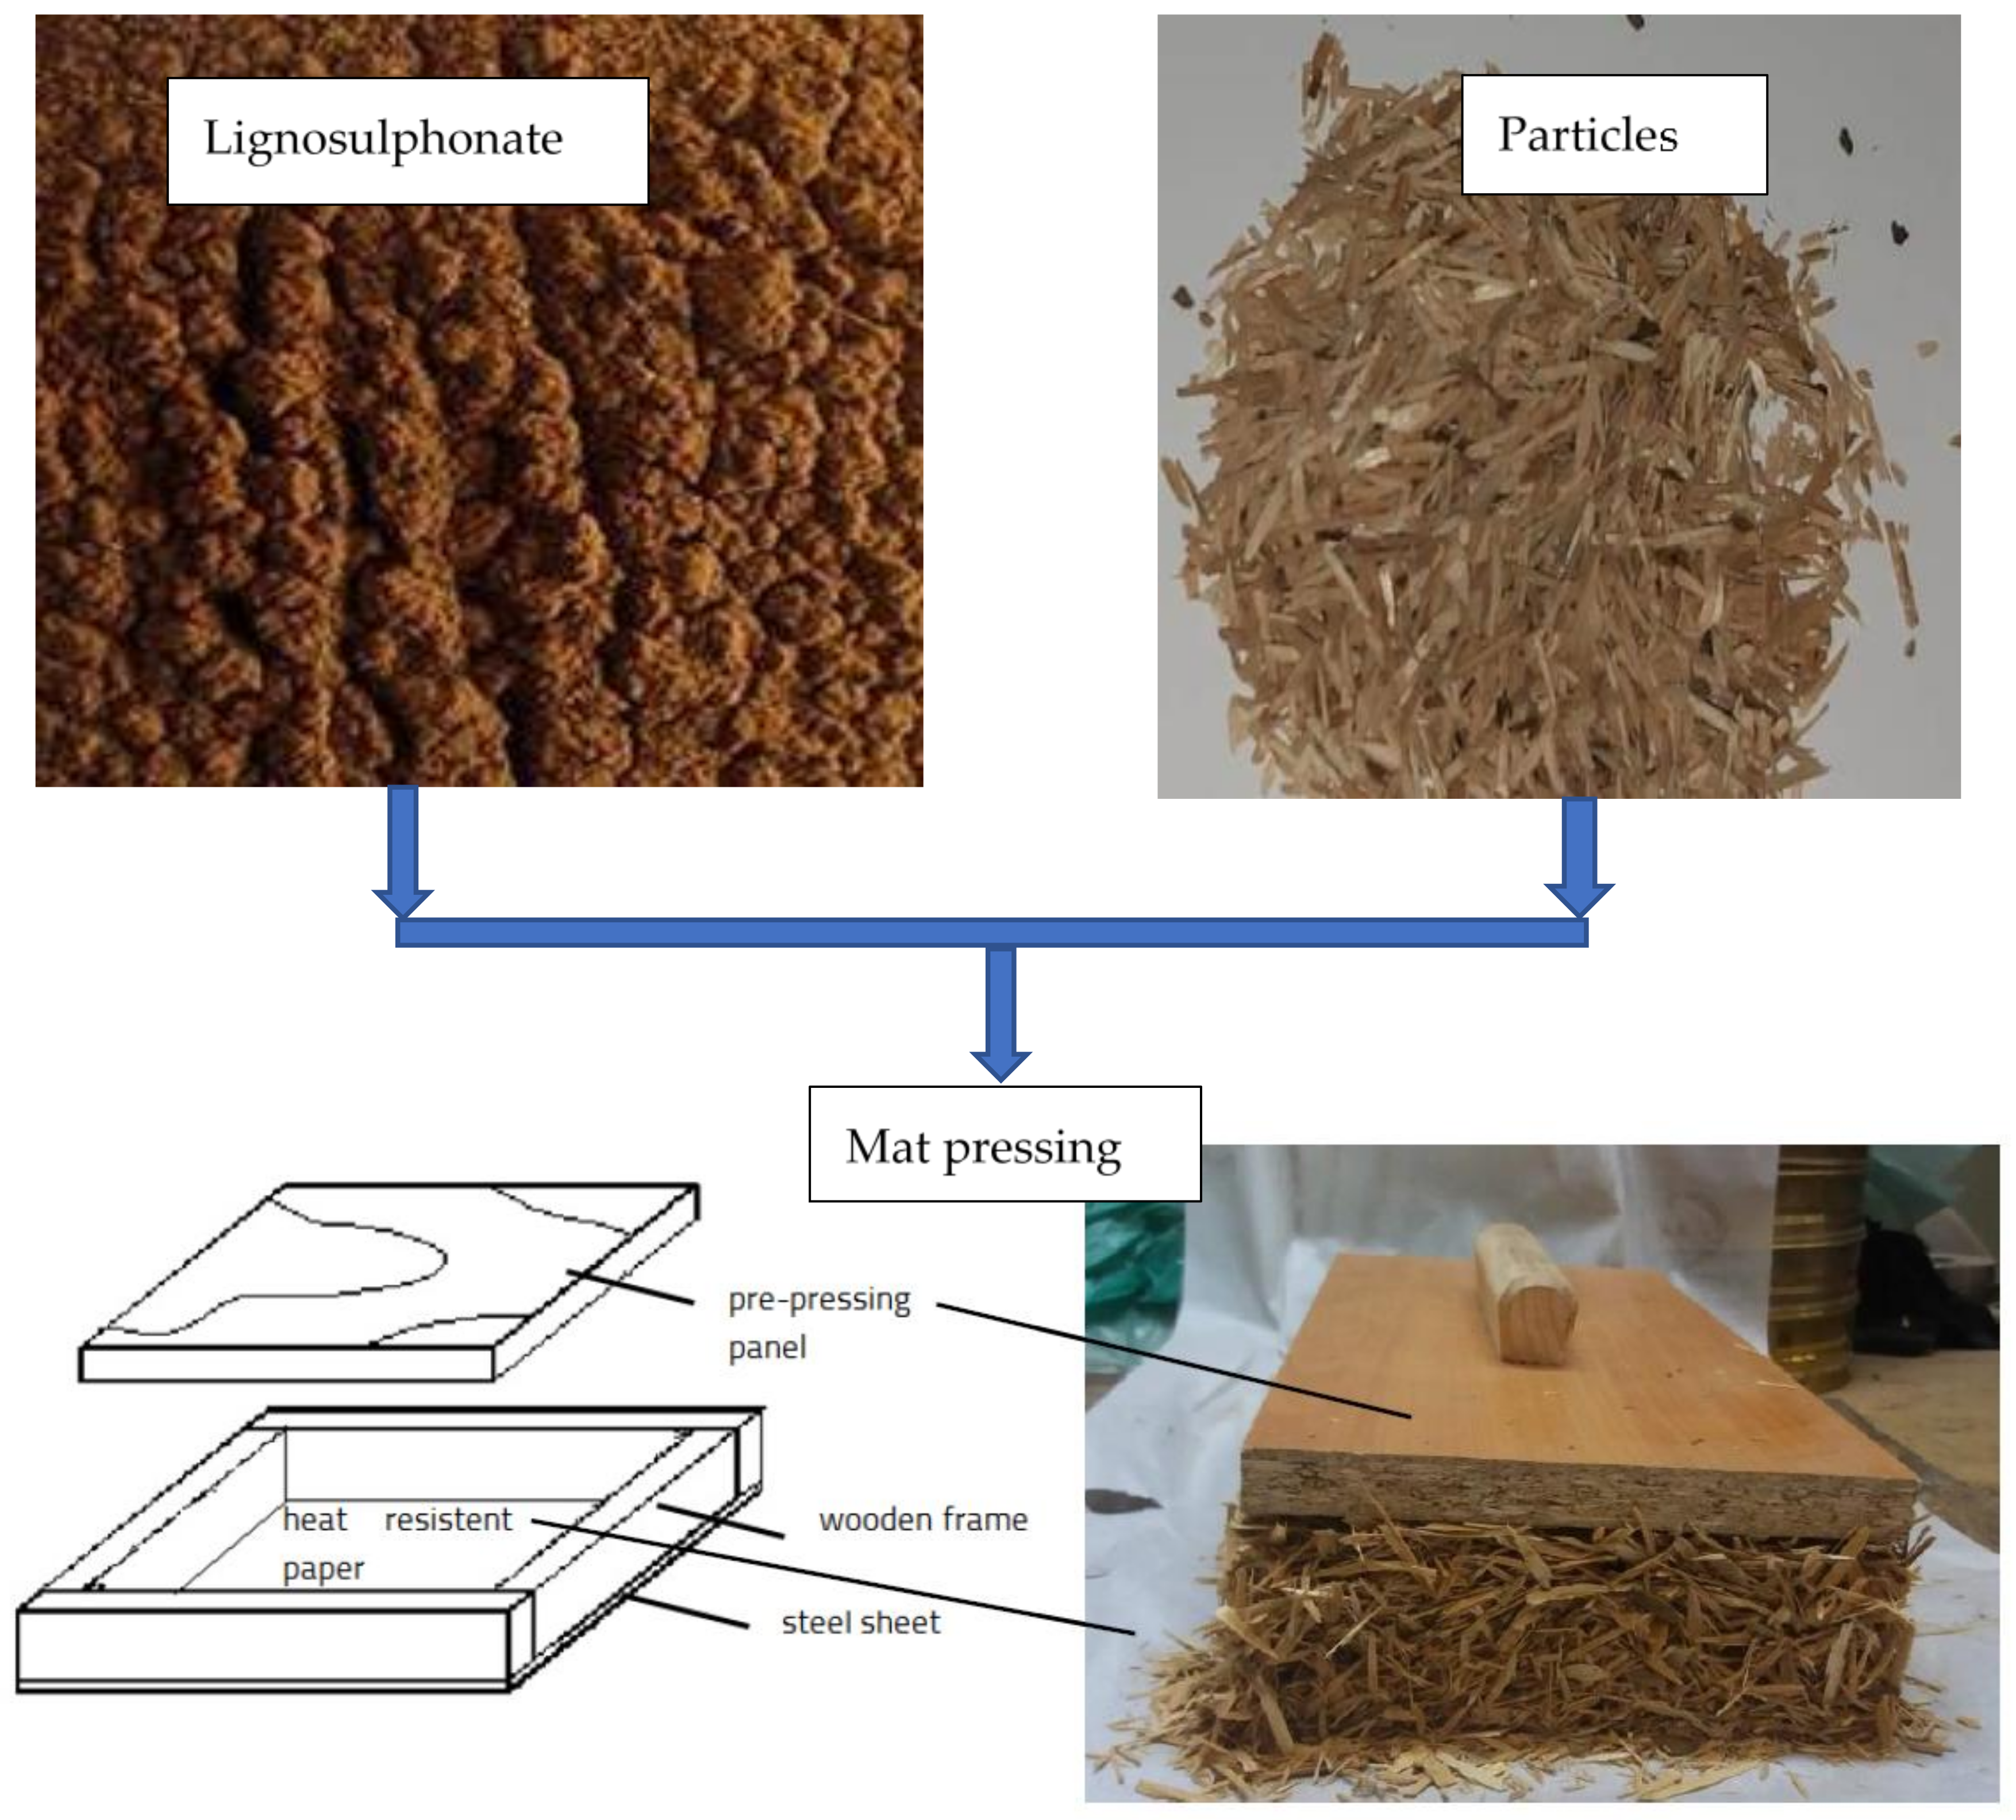
2. Materials and Methods

Magnesium lignosulphonate. There are five types of water-soluble lignosulfonates: magnesium lignosulfonate, calcium lignosulfonate, sodium lignosulfonate, potassium lignosulfonate, and ammonium lignosulfonate. They are differentiated by the method of cellulose extraction (sulfite, Kraft, basic, acid, etc.) and contain small amounts of magnesium, calcium, sodium, potassium, or ammonia. The most common ones are ammonium and magnesium sulphonate, with no differences in the formaldehyde emissions and mechanical properties of wooden composites [11,13,14]. Magnesium lignosulphonate (Lignex MG) was purchased from Sappi Biotech GmbH (Düsseldorf, Germany) in an unmodified state and was used in the preparation of the bio-adhesive for particleboard manufacturing. The physical appearance of magnesium lignosulfonate was in the form of a yellowish-brown powder. It was obtained by the process of purification, evaporation, chemical treatment, and drying of the black liquid waste resulting from the cellulose (pulp and paper) manufacturing process. The characteristics of magnesium lignosulfonate (Lignex MG), as stated in the data sheet issued by the manufacturer, are presented in Table 2.
Lignin oxidation. In order to obtain the recipes, the lignin powder was oxidized with 30% hydrogen peroxide (H2O2). The final H2O2 content was 5.7% by weight of the resin. NaOH was used to raise the pH to 9. The recipe for preparation was as follows: 460 g of magnesium lignosulfonate; 35 g of 30% hydrogen peroxide (7.6% from magnesium lignosulfonate); 246 mL of distilled water (53.5% by mass from magnesium lignosulfonate), and 66 mL of sodium hydroxide at a concentration of 50% (14.3% by mass of magnesium lignosulfonate). The dry matter content of the bio-adhesive thus obtained was 57%, and the flow time through the viscometry cup with a diameter of 6 mm was 3 min and 11 s.
Wood particles. The particleboards were made of beech wood particles (30%) (Fagus sylvatica) and softwood, usually spruce (Picea abies) and pine (Pinus sylvestris) (70%). The moisture content of the dried particles was of 6.8%. Particles were selected from each sample for the entire quantity, using the quarter method, and scanned at 1200 dpi on an HP ScanJet 7650 scanner along with a dimensional reference (in mm). For a dimensional evaluation of the scanned images, they were imported into AutoCAD (2018) and adjusted to a 1: 1 scale. Measurements of length and width were then performed in the AutoCAD program. The size of the fine particles was determined using a Nikon YS100 microscope, which was made in Japan, with an accuracy of 0.01 mm. Samples of 25 g were extracted from particle bags provided from the Kastamonu Romania SA company (Reghin, Romania).
Granulometry analysis. Coarse and fine wood particles were analyzed as participation rates using the Retsch-type vibrating screen, which was made in Germany, setting the vibration of the sieves for 10 min. For coarse particles, the apparatus was equipped with five sieves placed from top to the bottom, starting with the sieve with the largest meshes of 4.00 mm × 4.00 mm, then 3.15 mm × 3.15 mm, 2.00 mm × 2.00 mm, 1.25 mm × 1.25 mm, 1.00 mm × 1.00 mm, and ending with the collector cylinder for the rest. The mass of each sample was 25 g. The particles were screened at a frequency of 60 oscillations/min, then they were collected from each sieve and weighed to the nearest 0.01 g. In order to analyze the fine chips from the point of size distribution, they were screened with the same electrical equipment using 1.00 mm × 1.00 mm, 0.80 mm × 0.80 mm, 0.53 mm × 0.53 mm, 0.40 mm × 0.40 mm, and 0.16 mm × 0.16 mm mesh screens. The share distribution of the particles was calculated for each type of particle (coarse and fine) and for each sieve separately, with the next relation (Equation (1)):
Cd = mf : m × 100 [%]
where Cd is the particle distribution in %; mf is the mass of the fraction collected in the sieve in g; and m is the mass of the whole sample expressed in g.
For each average value of the particle size, five experimental tests were made. Particles smaller than those obtained on sieves 0.4 mm × 0.4 mm, 0.16 mm × 0.16 mm, and the rest were considered dust and were removed from those for making particleboards.
Particleboard manufacturing. Based on the experience of the manufacturer Kastamonu of particles and boards and also on the research results of other groups of researchers [35,40], in order to obtain well-compacted boards, after weighing the remaining chips in each sieve and removing dust, the following proportion was established within the boards: 35% coarse (large) particles (those sifted and left in the 2 mm × 2 mm sieve) and 65% fine chips (those sifted and left in the 0.5 mm × 0.5 mm sieve). A mixture of 15% adhesive solution and 85% in-factory particles (percent by mass, particles absolutely dry) was made using a paddle drum by spraying the adhesive on the particles. The particleboard mat was placed on a 3 mm thick steel sheet covered with heat-resistant paper. For the formation of the particle mat, there were used beech wood frames with internal dimensions of 420 mm × 420 mm × 50 mm and steel stopers with a thickness of 16 mm to limit the thickness of the boards to this value. The target density established for all particleboard was 650 kg/m3 (comparable to that of agglomerated boards with urea-formaldehyde adhesive manufactured at the Kastamonu company), with the boards having the dimensions of 450 mm × 450 mm at a temperature of 180 °C, a pressure of 2.5 MPa, and a pressing time of 16 mm (i.e., 1 min for each mm of thickness). After evacuation from the hot press, the boards were conditioned at a temperature of 20 °C and a relative humidity of 65% for 7 days in order to homogenize the stresses and to stabilize the moisture content to 10%. A minimum of 10 chipboards were manufactured for each type of recipe.
The three adhesive recipes. For the manufacture of particleboard, there was a basic recipe including oxidized magnesium lignosulfonate (15% of the weight of the dry wood particles) that was marked as Recipe 1 and two others, which differed by the addition of two crosslinking agents, respectively, pMDI resin (for Recipe 2, in a proportion of 3% by mass of the dry particles) and a combination of pMDI resin with glucose (for Recipe 3, in a total proportion of 5% of the amount of particles or separately as 2.9% pMDI and 2.2% glucose related to the dry particle mass). Some preliminary research as well as the bibliographic study [11] showed that non-oxidized lignosulfonate has very poor adhesive properties, which is why all adhesive recipes contained hydrogen peroxide. The percentage of dry adhesive was also considered to be 15% of the amount of dry particle mass. Sodium hydroxide was introduced in order to obtain a basic pH of 8–9 to add a high level of adhesiveness. The three manufacturing recipes are presented in Table 3.
Gas analysis method for formaldehyde emissions. The formaldehyde emissions, determined by the gas analysis method, used specimens with dimensions of 400 mm × 50 mm × 16 mm. For testing, the specimens were sealed on the edge with self-adhesive foil, leaving only the faces of the specimens free. The specimens were placed in a chamber with a constant temperature of 60 ± 0.5 °C and an air humidity of less than 3%, in the direction of the air current. The formic aldehyde released from the samples and the air with formaldehyde was passed through washing dishes with distilled water that absorbs this formaldehyde. The determination of formaldehyde emission is based on the Hantzsch reaction, according to which formaldehyde reacts with acetylacetone and ammonium acetate, resulting in diacetyl-dihydrouridine (DDL), with a maximum absorption spectrum of 412 nm. Therefore, in each of the 4 h of testing, 10 mL of aqueous solution was taken and placed in a vial to which 10 mL of acetylacetone solution and 10 mL of ammonium acetate solution were added. The absorption of this mixed solution was determined at 412 nm using a Jenway spectrophotometer (Staffordshire, UK). In parallel, the absorption of the control sample with distilled water was determined. Based on these data, the emission of formaldehyde was determined with the following relation (Equation (2)):
FEi = ((As − Ab) × f × V) : F [mg/m2h]
where FEi is the formaldehyde emission in mg/m2h; i = 1, 2, 3, 4 are indicative of the time in h at which the determination was made; As is the absorption from the washing dishes with formic aldehyde; Ab is the absorption etalon for distilled water; f is the slope of the calibration curve in mg/mL; V is the volume of the volumetric flask in ml; and F is the emitting unsealed surface in m2.
An average value was determined as the arithmetic mean of the values obtained in a time of 4 h and represented the final value of formaldehyde. The comparison of the formaldehyde emission was made with the ISO 12460-3: 2015 standard [58].
Mechanical properties. After conditioning, the boards were cut into specimens on a universal circular saw. The minimum number of specimens for the mechanical tests was chosen according to the European standard EN 310: 1993 [59] for MOR and MOE and according to EN 319: 1993 [60] for the internal bond. The mechanical tests were performed on a universal Zwick/Roell Z010 machine (Ulm, Germany), with the bending test quantifying the strength and elasticity of the boards and the internal bond test showing the adhesion strength. The bending test consisted of applying a static load in the middle of the specimens supported on two supports, and the internal cohesion test was performed by applying a tensile force on the specimens glued with epoxy adhesive on two metal supports. The calculation relationships used by the universal test machine software were as follows (Equation (3)):
MOR = (3 × Fbmax × l1) : (2 × b × t2) [N/mm2]
MOE = (l13(F2 − F1)) : (4 × b × t2(f2 − f1)) [N/mm2]
IB = Fcmax : (l2 × l3) [N/mm2]
where MOR is the modulus of resistance in N/mm2; Fbmax is the maximum of bending force in N; l1 is the distance between the fulcrums in mm; b is the width of the sample in mm; t is the thickness of the sample in mm; MOE is the modulus of elasticity in N/mm2; F2 is the force of 40% from the maximum force in N; F1 is the force of 10% from the maximum force in N; f2 is the deformation corresponding to the F2 force in mm; f1 is the deformation corresponding to the F1 force in mm; Fcmax is the maximum of the compression (breaking) force in N; l2 is one of the plane dimensions of the IB sample in mm; and l3 is the second plane dimension of the IB sample in mm.
The values of the obtained mechanical properties were compared with those of the standard EN 312: 2004 [57] for the interior-type P2 boards, including that for furniture uses. The increase in the real values compared to the reference ones was determined with the help of a relation as follows (Equation (4)):
Ip = (Vmax − Vmin): Vref × 100 [%]
where Ip is the increasing of properties in %; Vmax is the maximum value; Vmin is the minimum value; and Vref is the reference value (can be Vmax or Vmin).
The density profile on thickness. The density profile was determined using an X-ray machine, DPX 300 (IMAL group, San Damaso, Italy). Square-shaped specimens with sides of 50 mm were weighed with an EU-C-LCD precision scale (Gibertini Elettronica, Novate Milanese, Italy), and their dimensions were measured with the same profilometer. Because the visibility and clarity of the density profile left something to be desired, the values were imported into an Excel sheet and the respective graph was recreated.
Statistical analysis. The obtained values were statistically processed by determining the survey median and the standard deviation for a confidence interval of 95% and an alpha error of 0.05. The standard deviation was also applied to the graphs obtained in Microsoft Excel (2018). A one-way ANOVA was used to observe the dependence of one median on other one when the null hypothesis was considered. The statistical analysis program Minitab 18 (2018) was used to obtain the empirical cumulative distribution function (CDF) graphs under the same 95% confidence interval.

3. Results

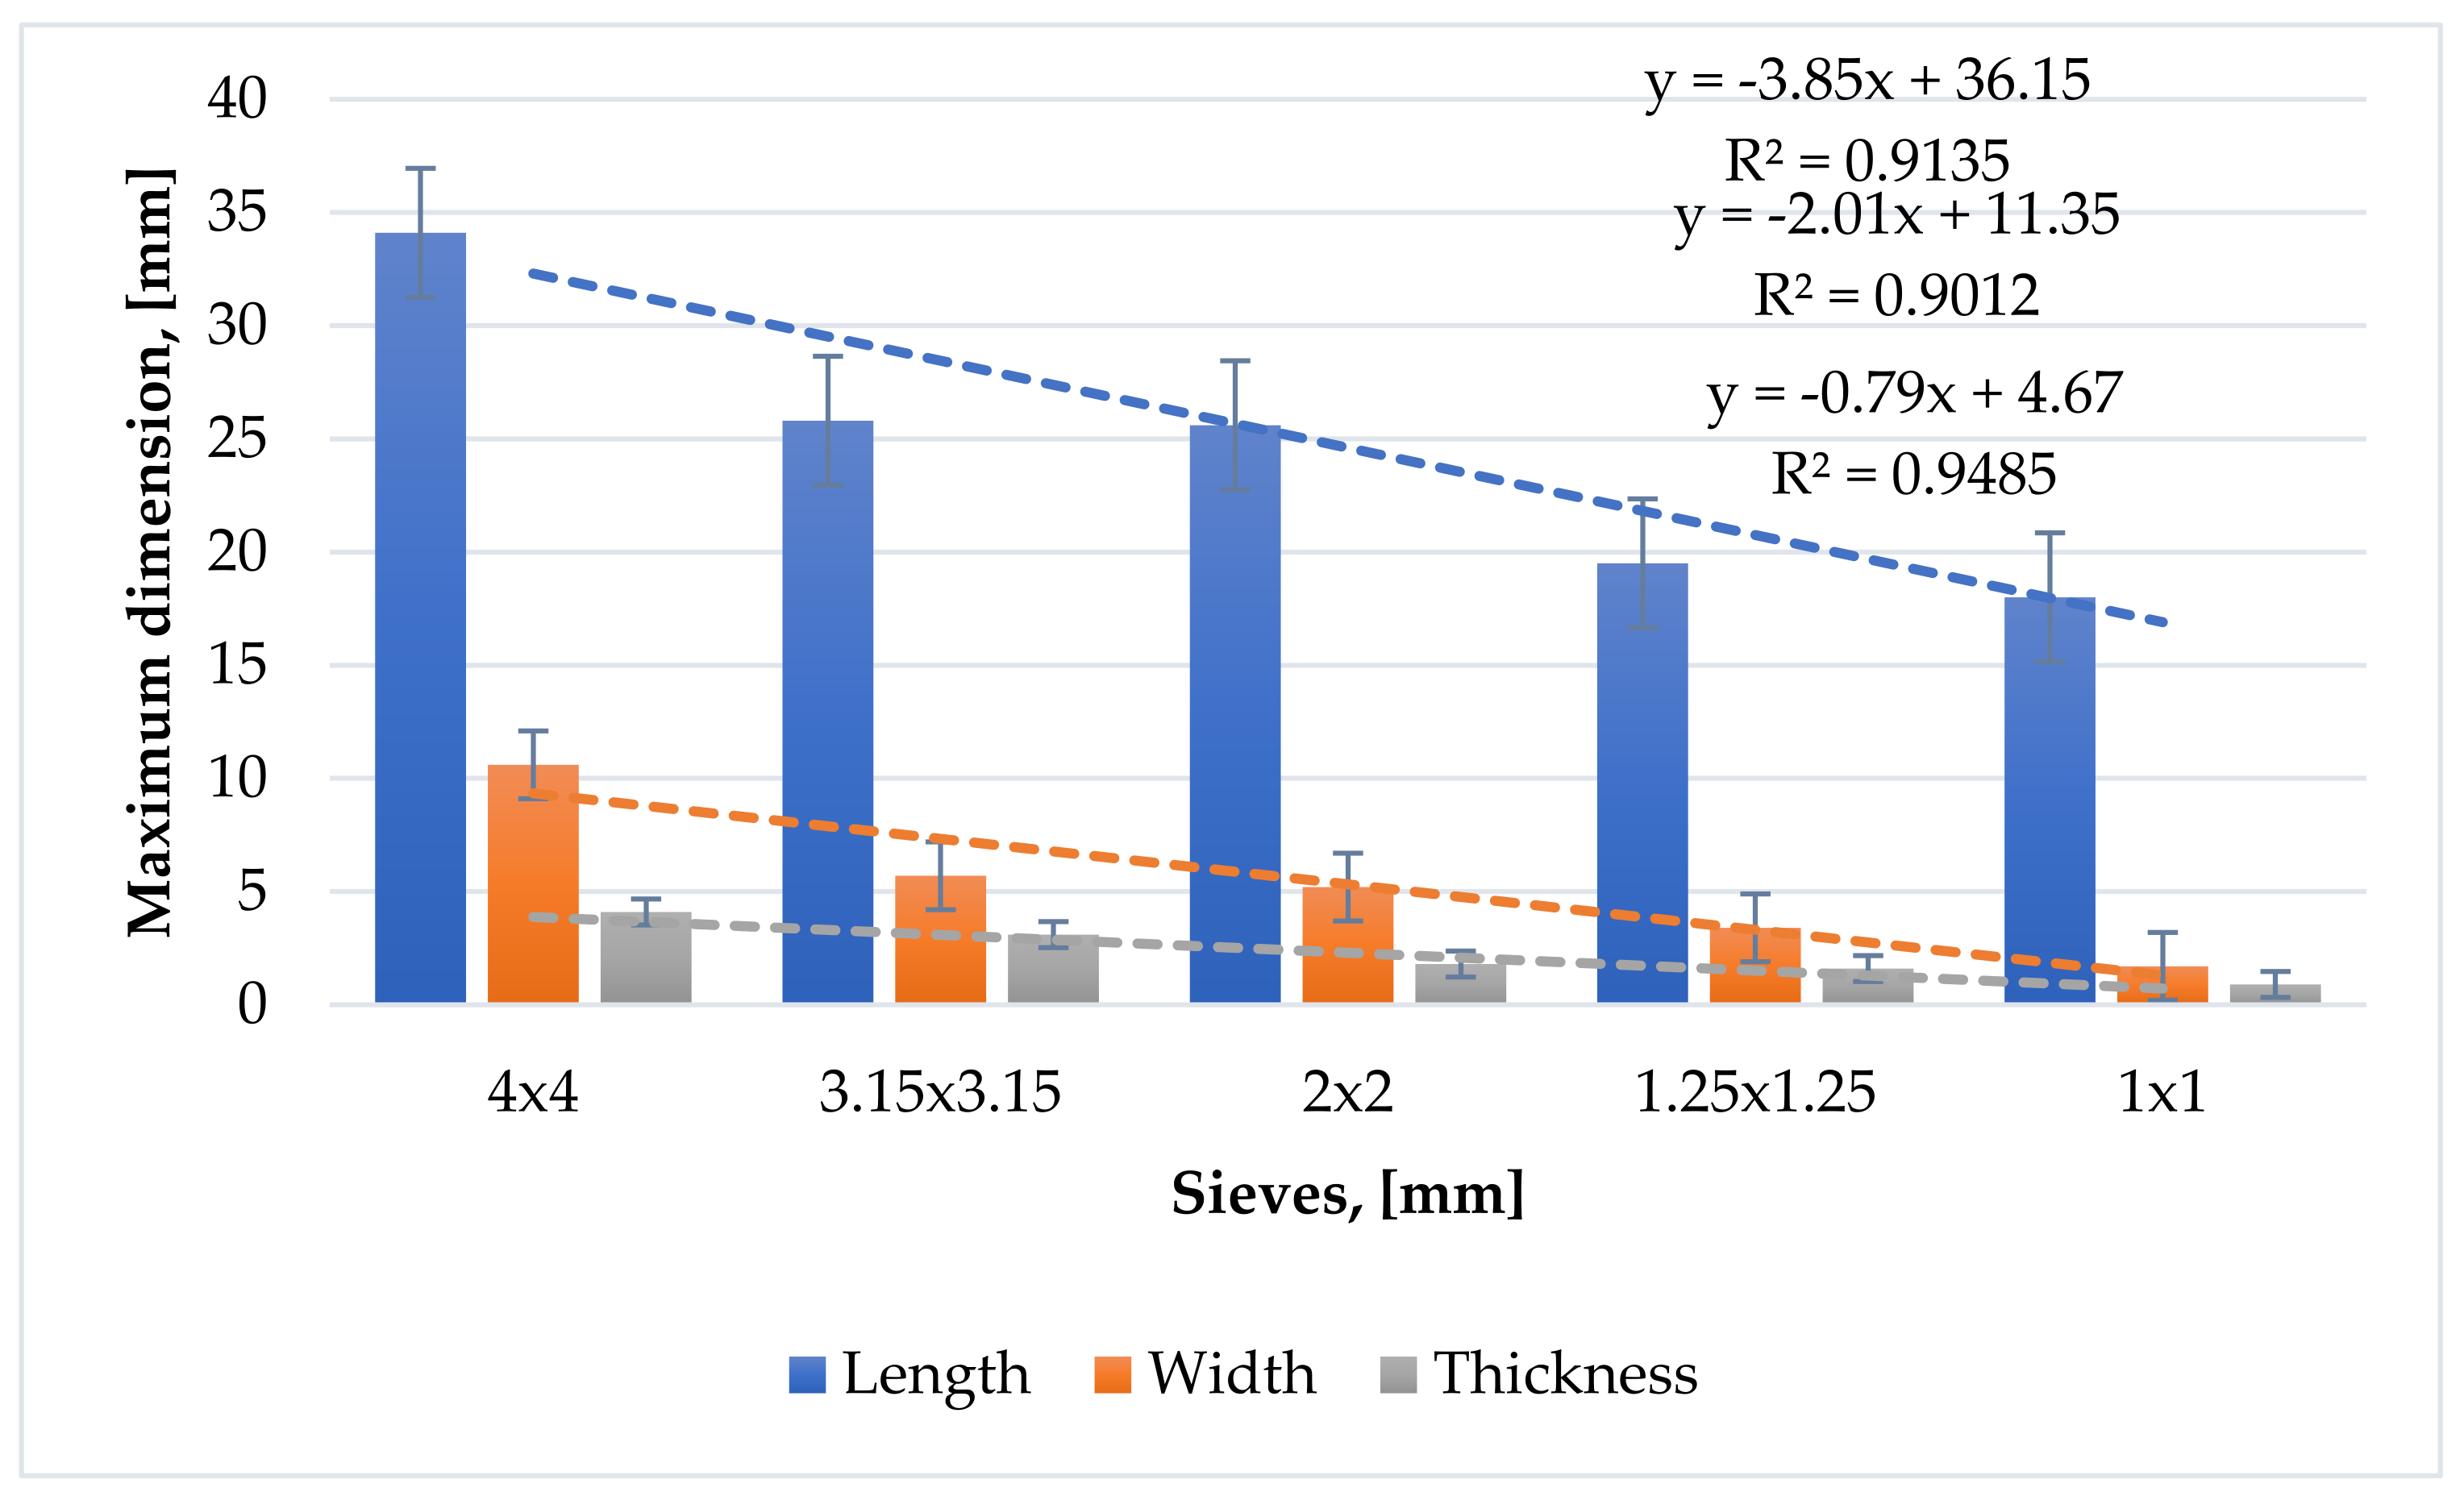
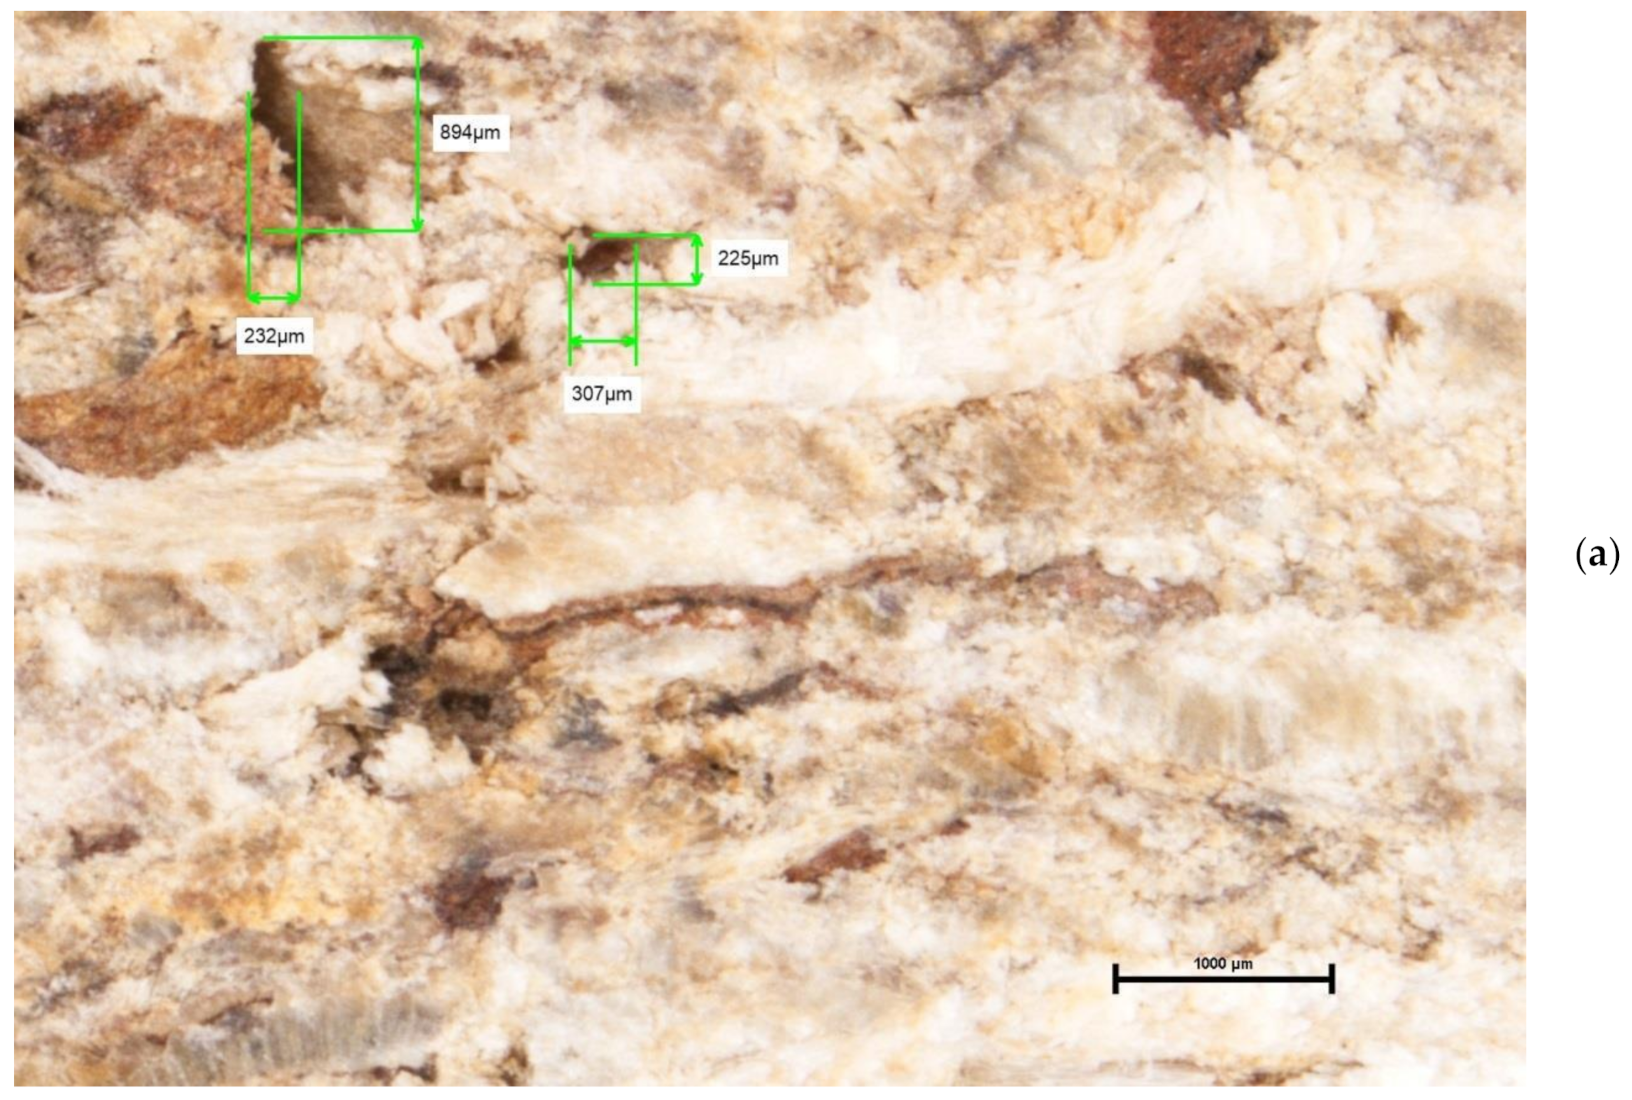
3.1. The Particle Dimensions

Overall, the particle sizes ranged from 2.4 mm to 34.1 mm in length, from 0.5 mm to 10.6 mm in width, and from 0.1 mm to 4.1 mm in thickness. Correspondence between the size of the sorting sites and the dimensions of the particles were as follows:
-
For the 4.00 mm × 4.00 mm sieve, the length range was 7.6–25.8 mm, the width was 4.1–10.6 mm, and the thickness was 0.2–4.1 mm;
-
For the 3.13 mm × 3.15 mm sieve, the length range was 6.1–34.1 mm, the width was 4.1–5.7 mm, and the thickness was 0.2–4.1 mm;
-
For the 2.00 mm × 2.00 mm sieve, the length range was 4.2–20.1 mm, the width was 1.1–5.2 mm, and the thickness was 0.2–1.8 mm;
-
For the 1.25 mm × 1.25 mm sieve, the length range was 3.7–19.5 mm, the width was 0.9–3.4 mm, and the thickness was 0.2–1.6 mm;
-
For the 1.00 mm × 1.00 mm sieve, the length range was 2.4–18 mm, the width 0.5–1.7 mm, and the thickness 0.1–0.9 mm.
Figure 1 clearly shows the high dimensional difference between the length and the other two dimensions of the particles, proving that they have a needle shape, a characteristic necessary for the production of quality particleboards. It was observed (Figure 1) that once the dimensions of the sieves decreased, the maximum dimensions of the particles also decreased, so there is a relationship of direct proportionality between them. The high Pearson R2 coefficient values, higher than 0.9 in all three cases, show that the linear regression equation for estimating the variation is very good. It was also observed that the smallest variation was in the case of particle thickness, and the largest variation was in the case of particle width. The same analysis can be conducted in the case of the minimum or average dimensions of the used particles, with the results being the same.

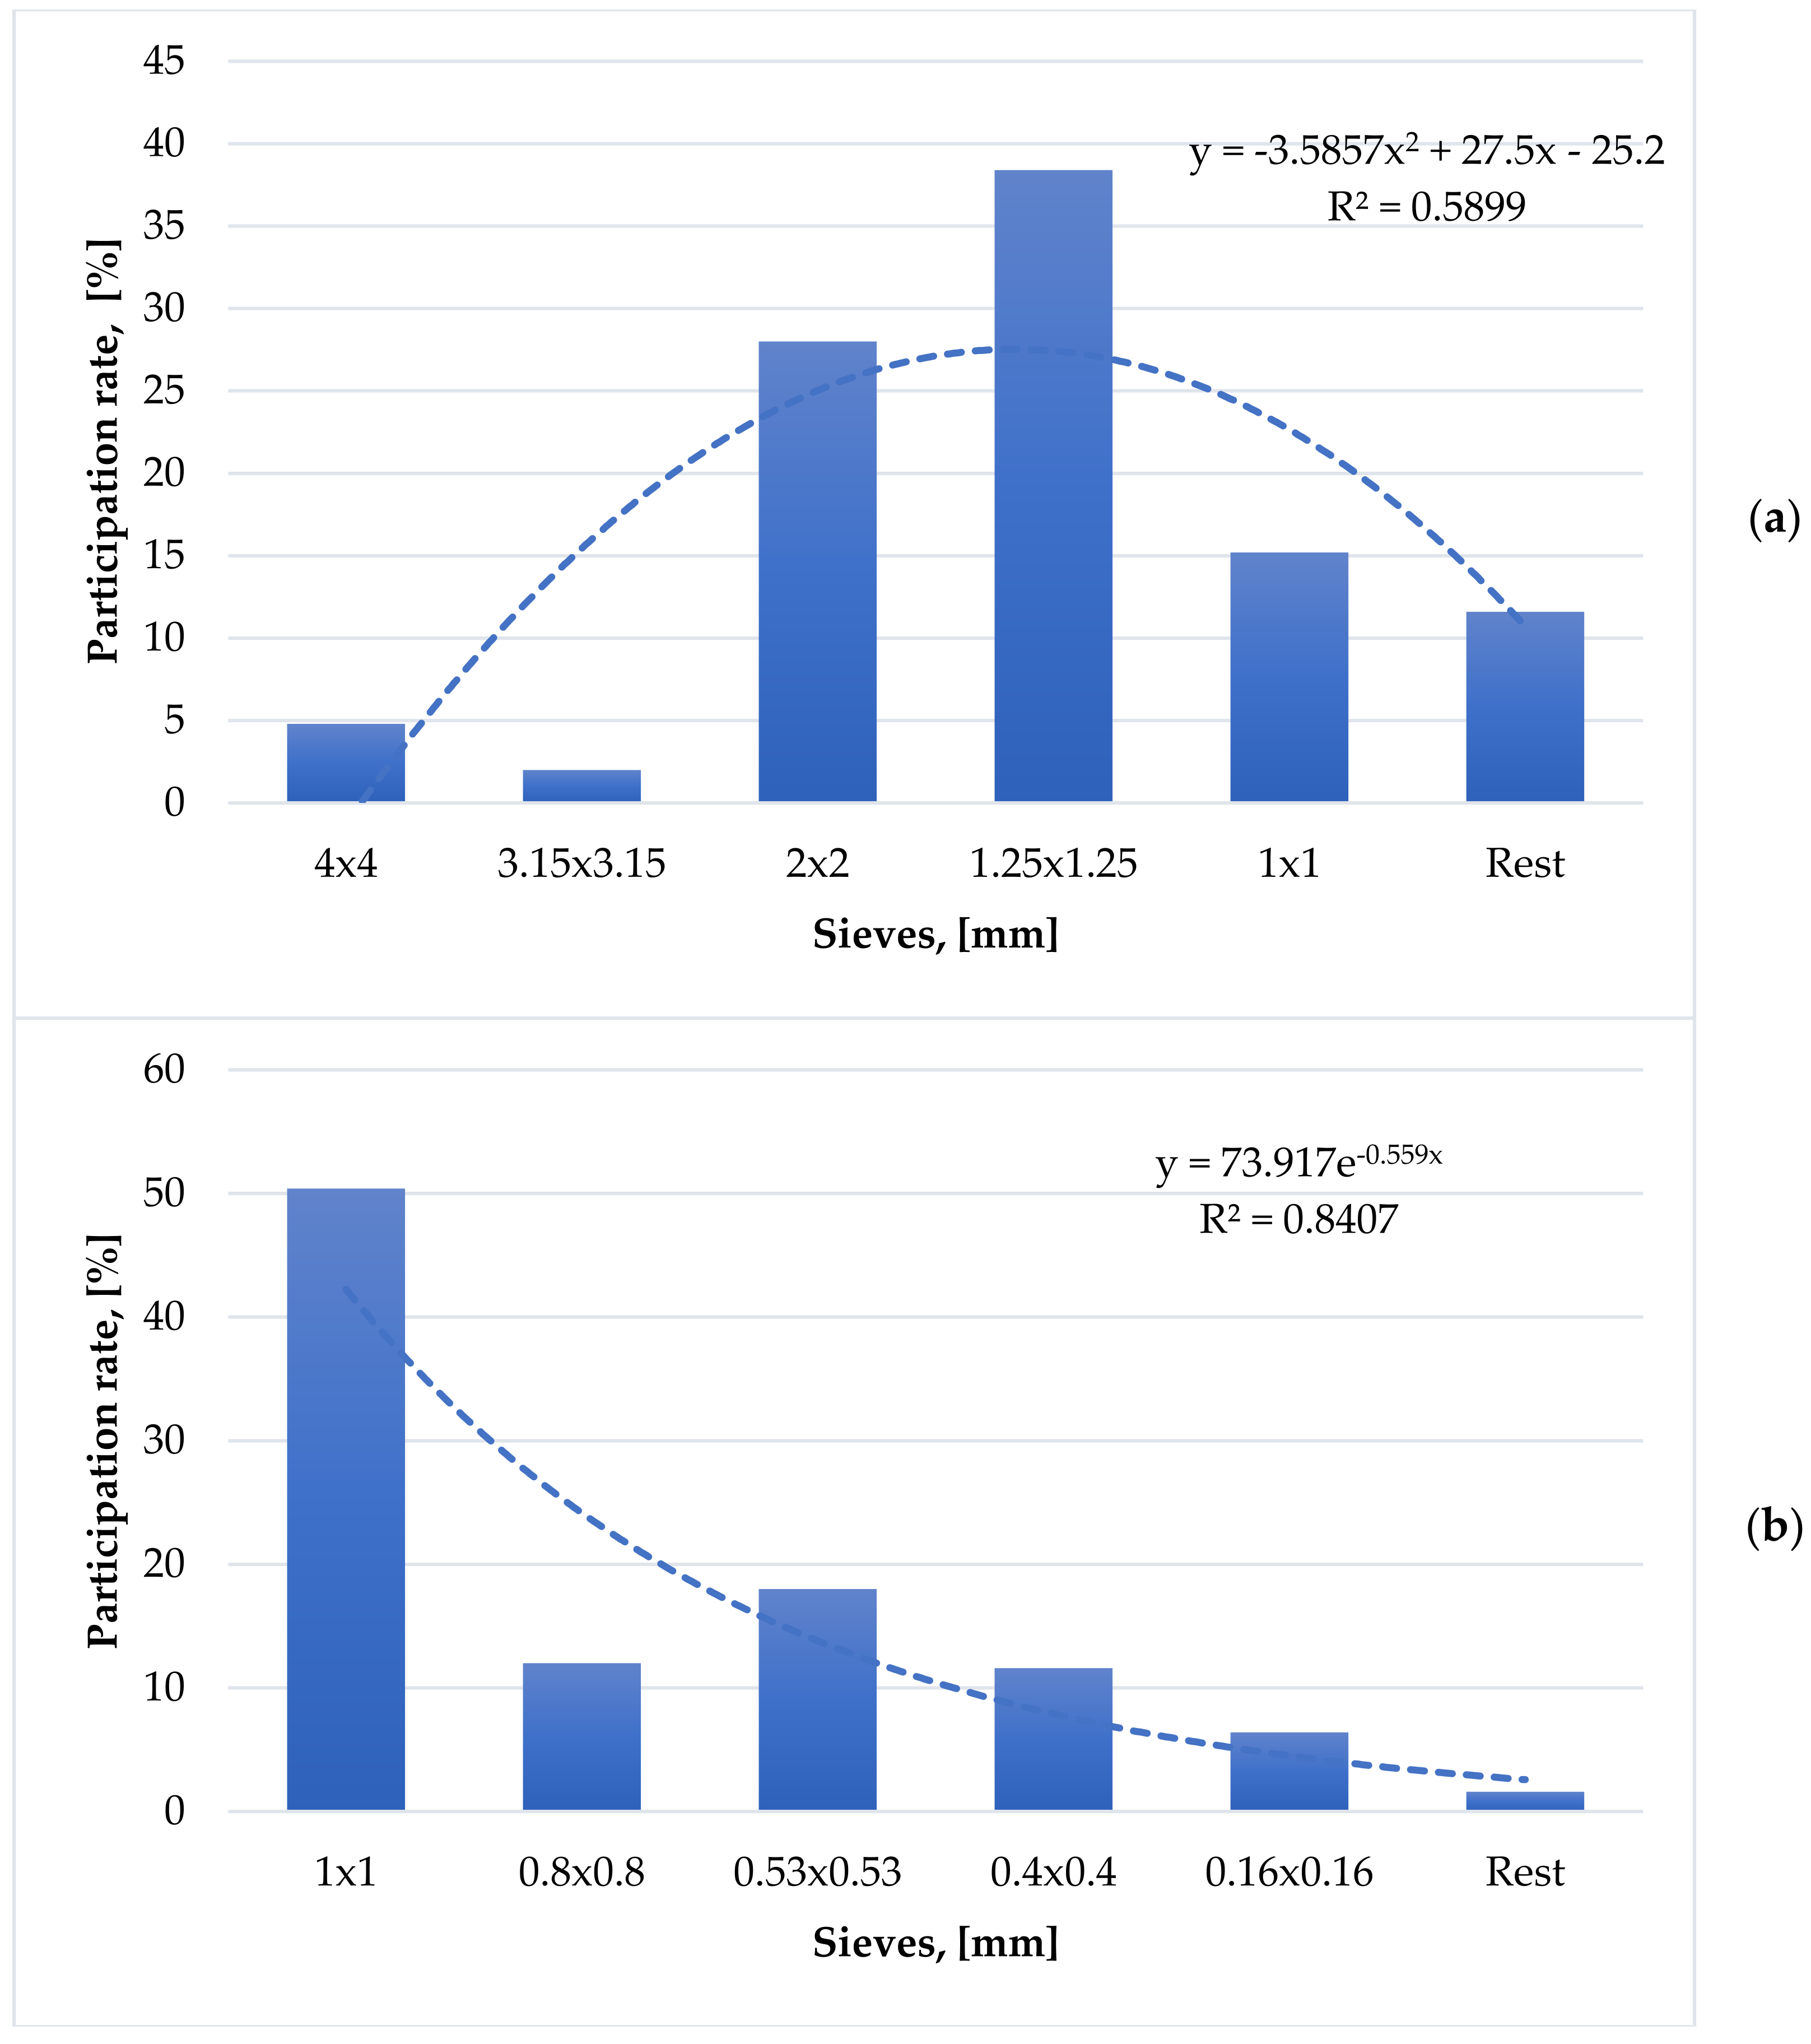
3.2. Granulometry of Wooden Particles

The particle size analysis was performed differently on large and fine particles, because the percentage of their mass participation in the board was different, in order to obtain a superior compaction. From the point of view of the coefficient of determination, R2 (0.58 in the case of large particles and 0.84 in the case of fine particles) (Figure 2a,b), a certain dimensional non-uniformity and a poor correlation of the participation rate was observed when obtaining these maximum values by a 2nd degree polynomial equation in the case of large particles and an exponential equation in the case of fine particles. From the same point of view, the fine particles have a granulometry superior to the large ones.
A central value of 1.21 mm was found in the case of coarse particles and 0.64 mm in the case of fine ones. A displacement in the values of coarse particles was also observed (Figure 2a) to the right beyond the 1.25 mm × 1.25 mm sieve, with a rest value over 10%, in addition to a displacement in the values of fine particles (Figure 2b) to the left beyond the 0.53 mm × 0.53 mm sieve. From this tendency of particle positioning, it can be determined that the median value of the total particle dimensions was around the 1 mm × 1 mm sieve.

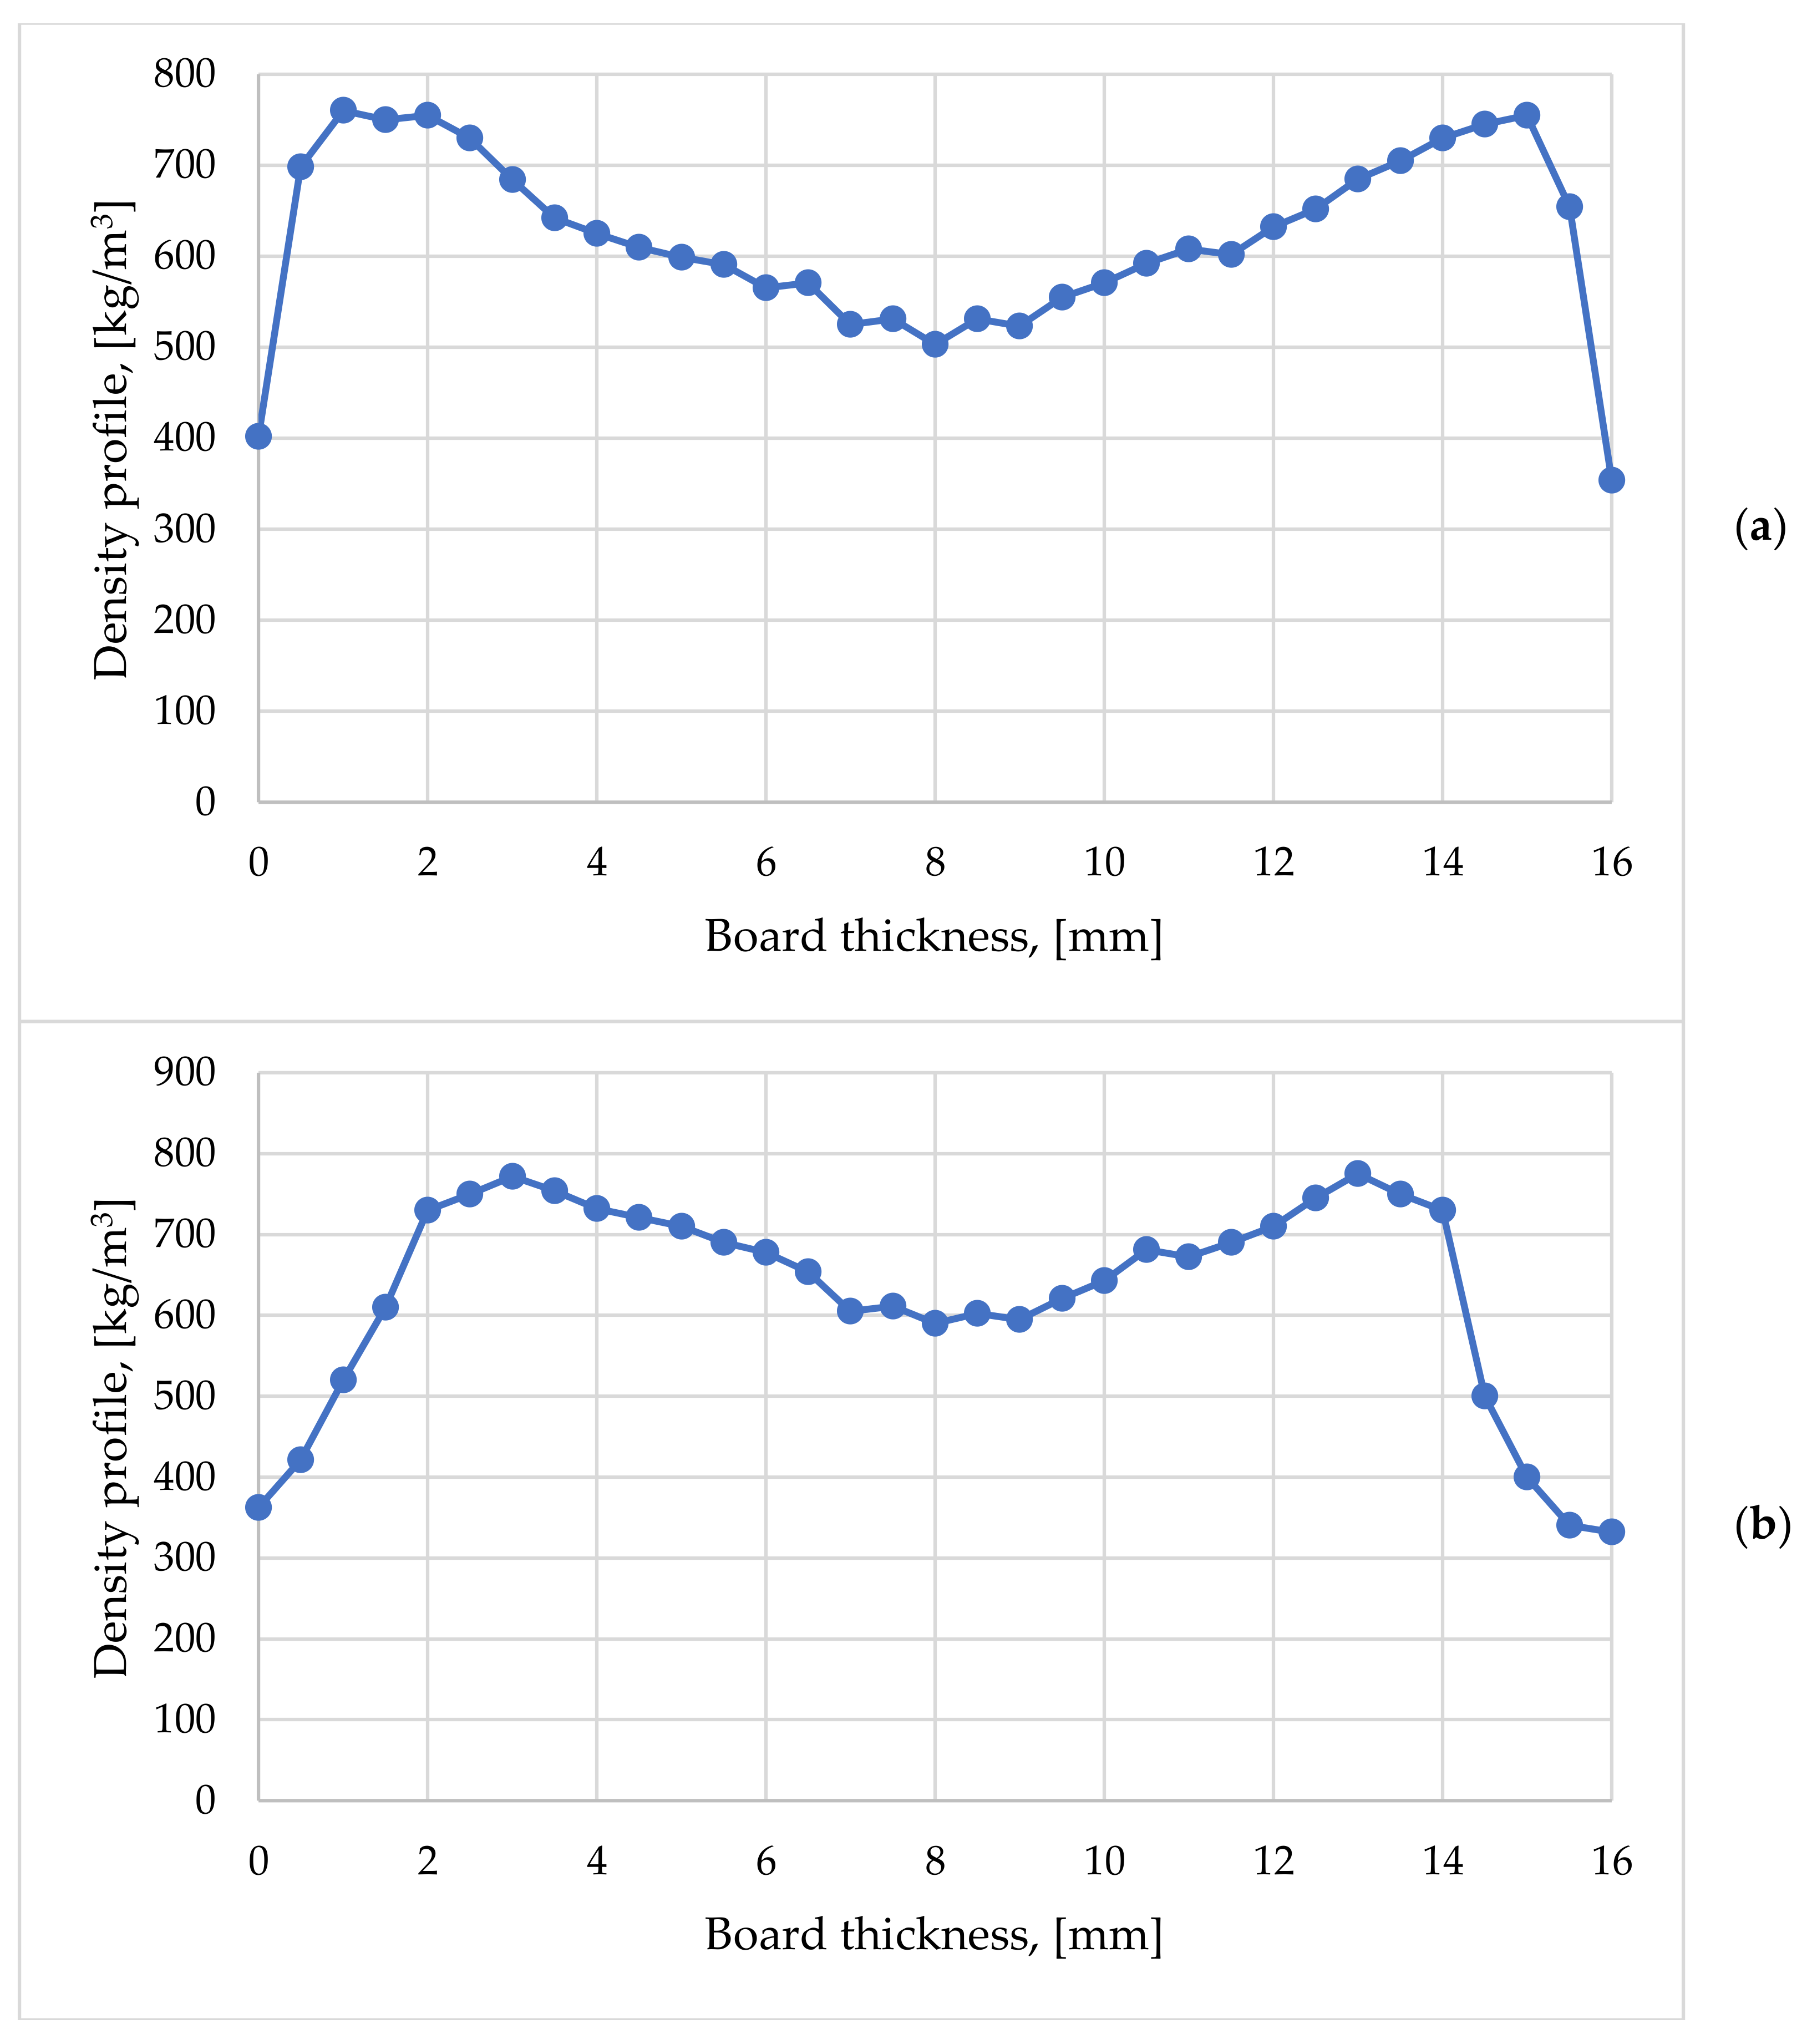
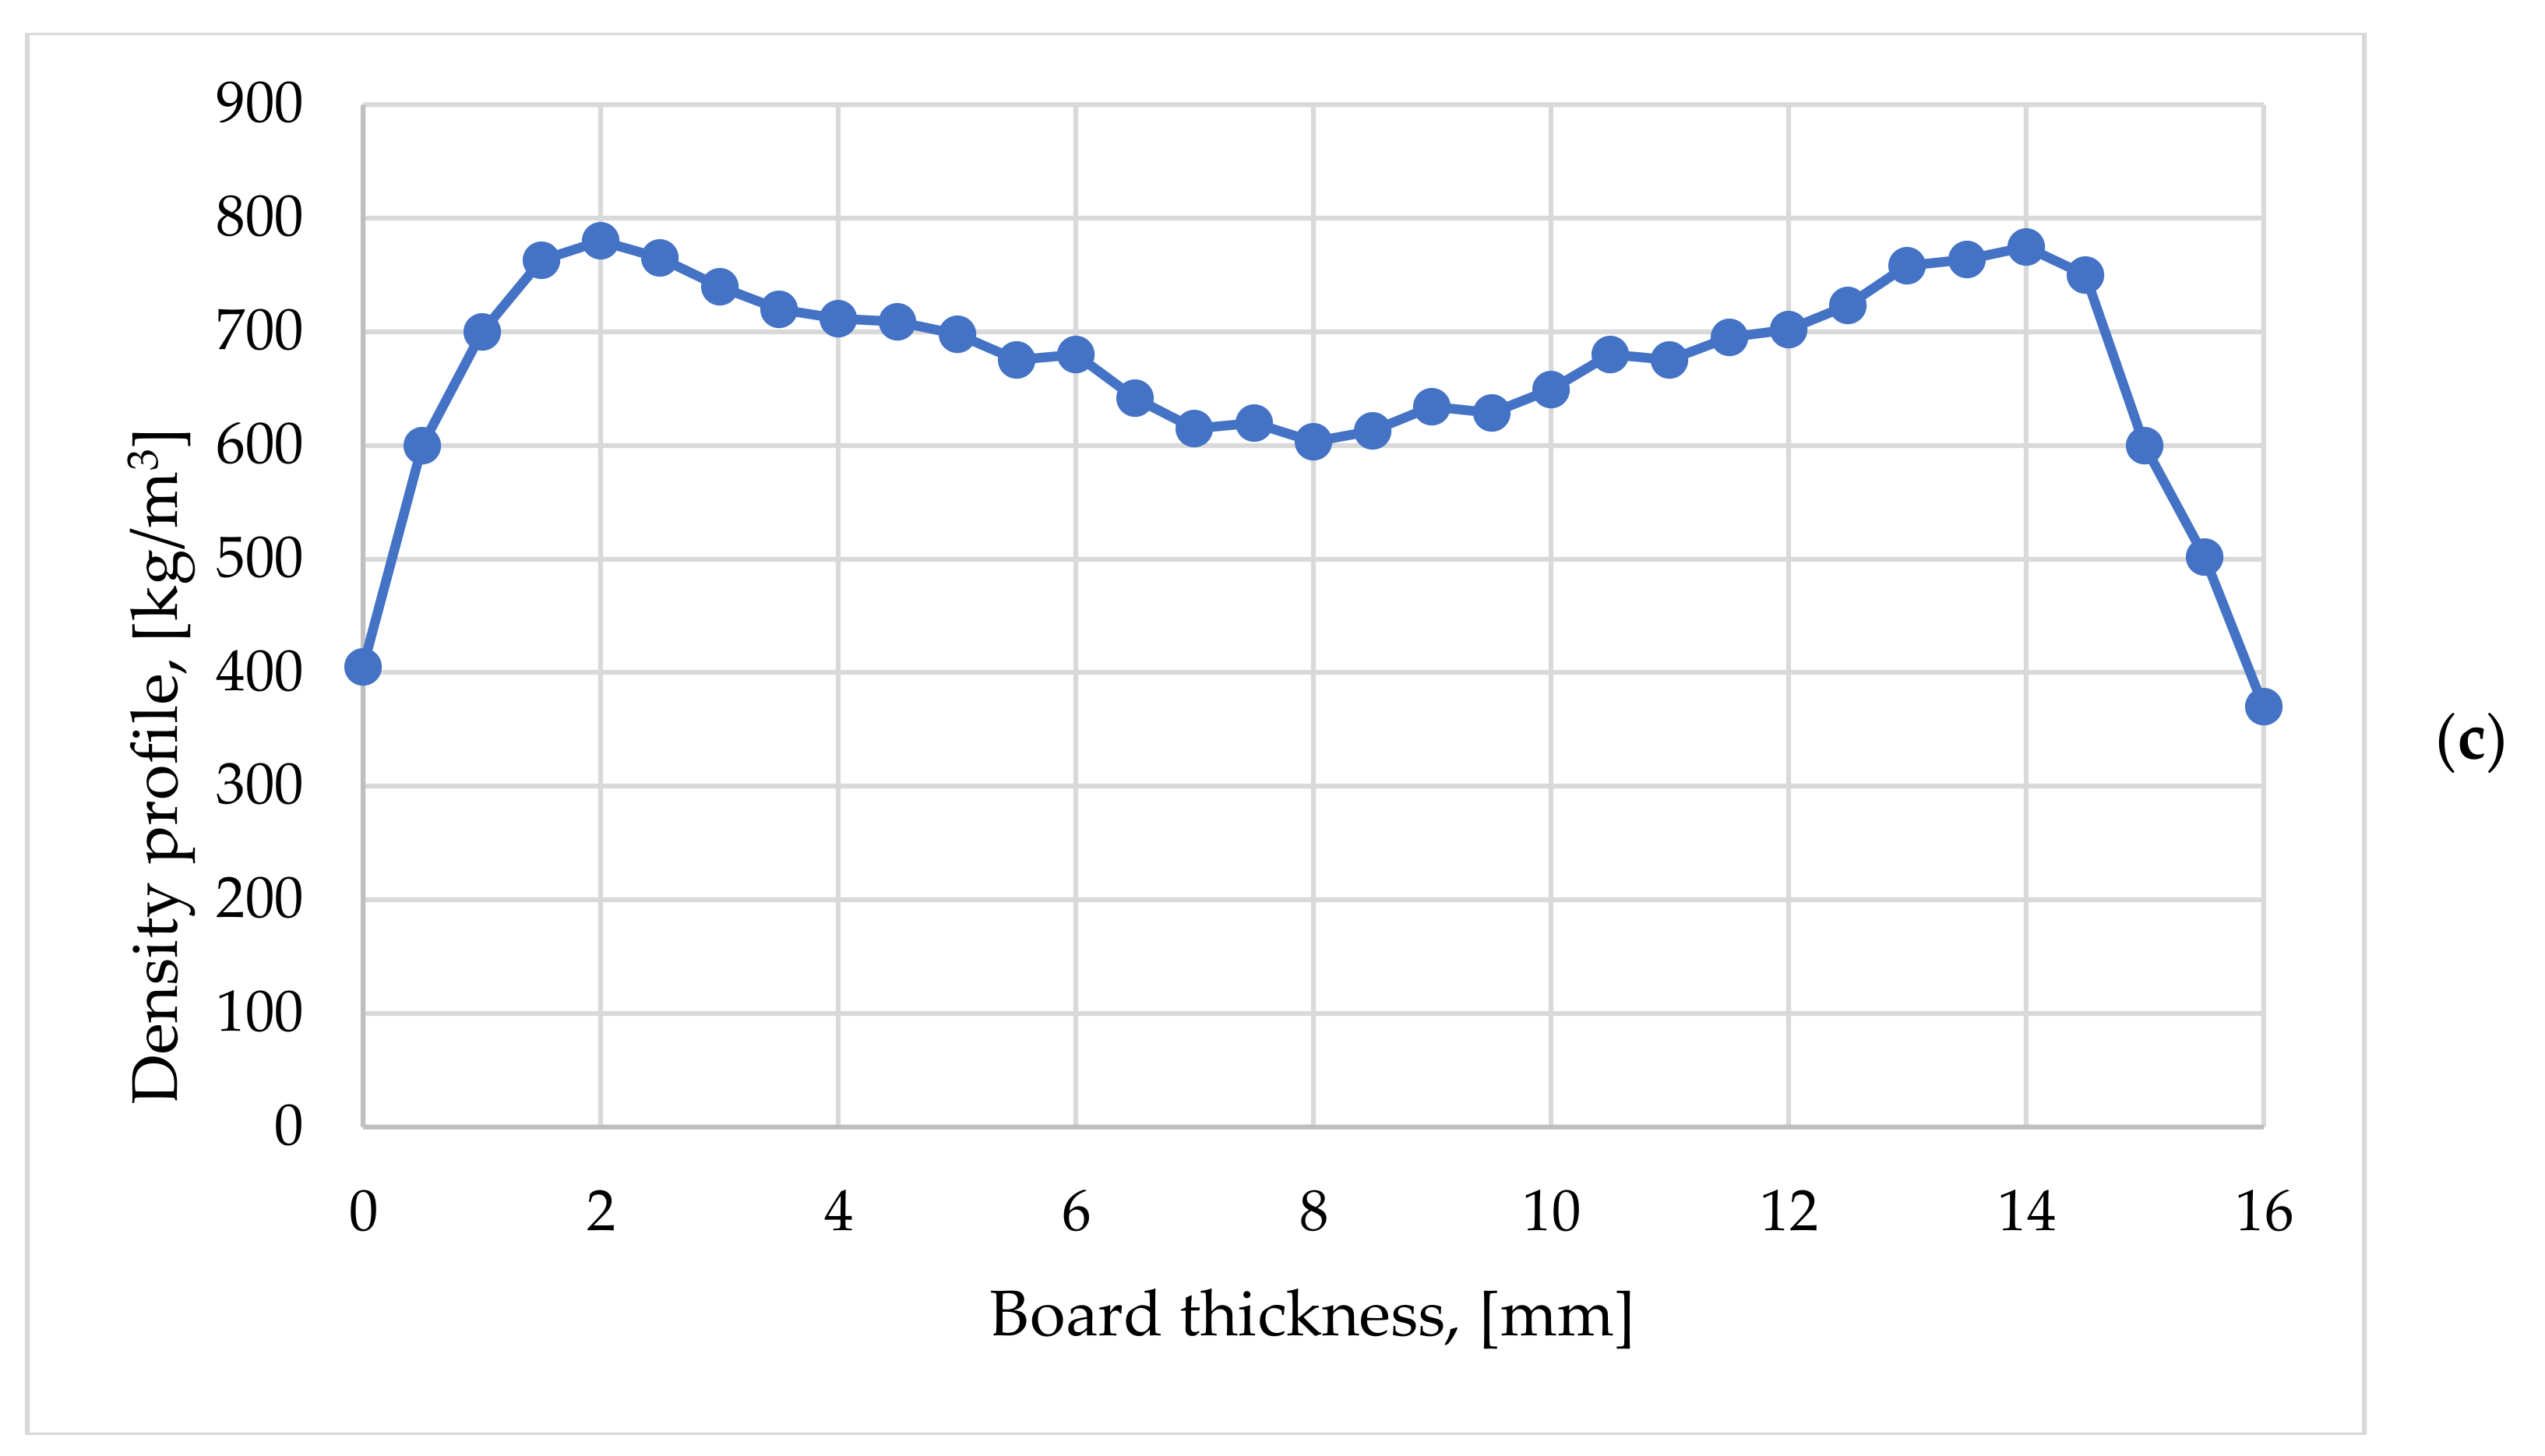
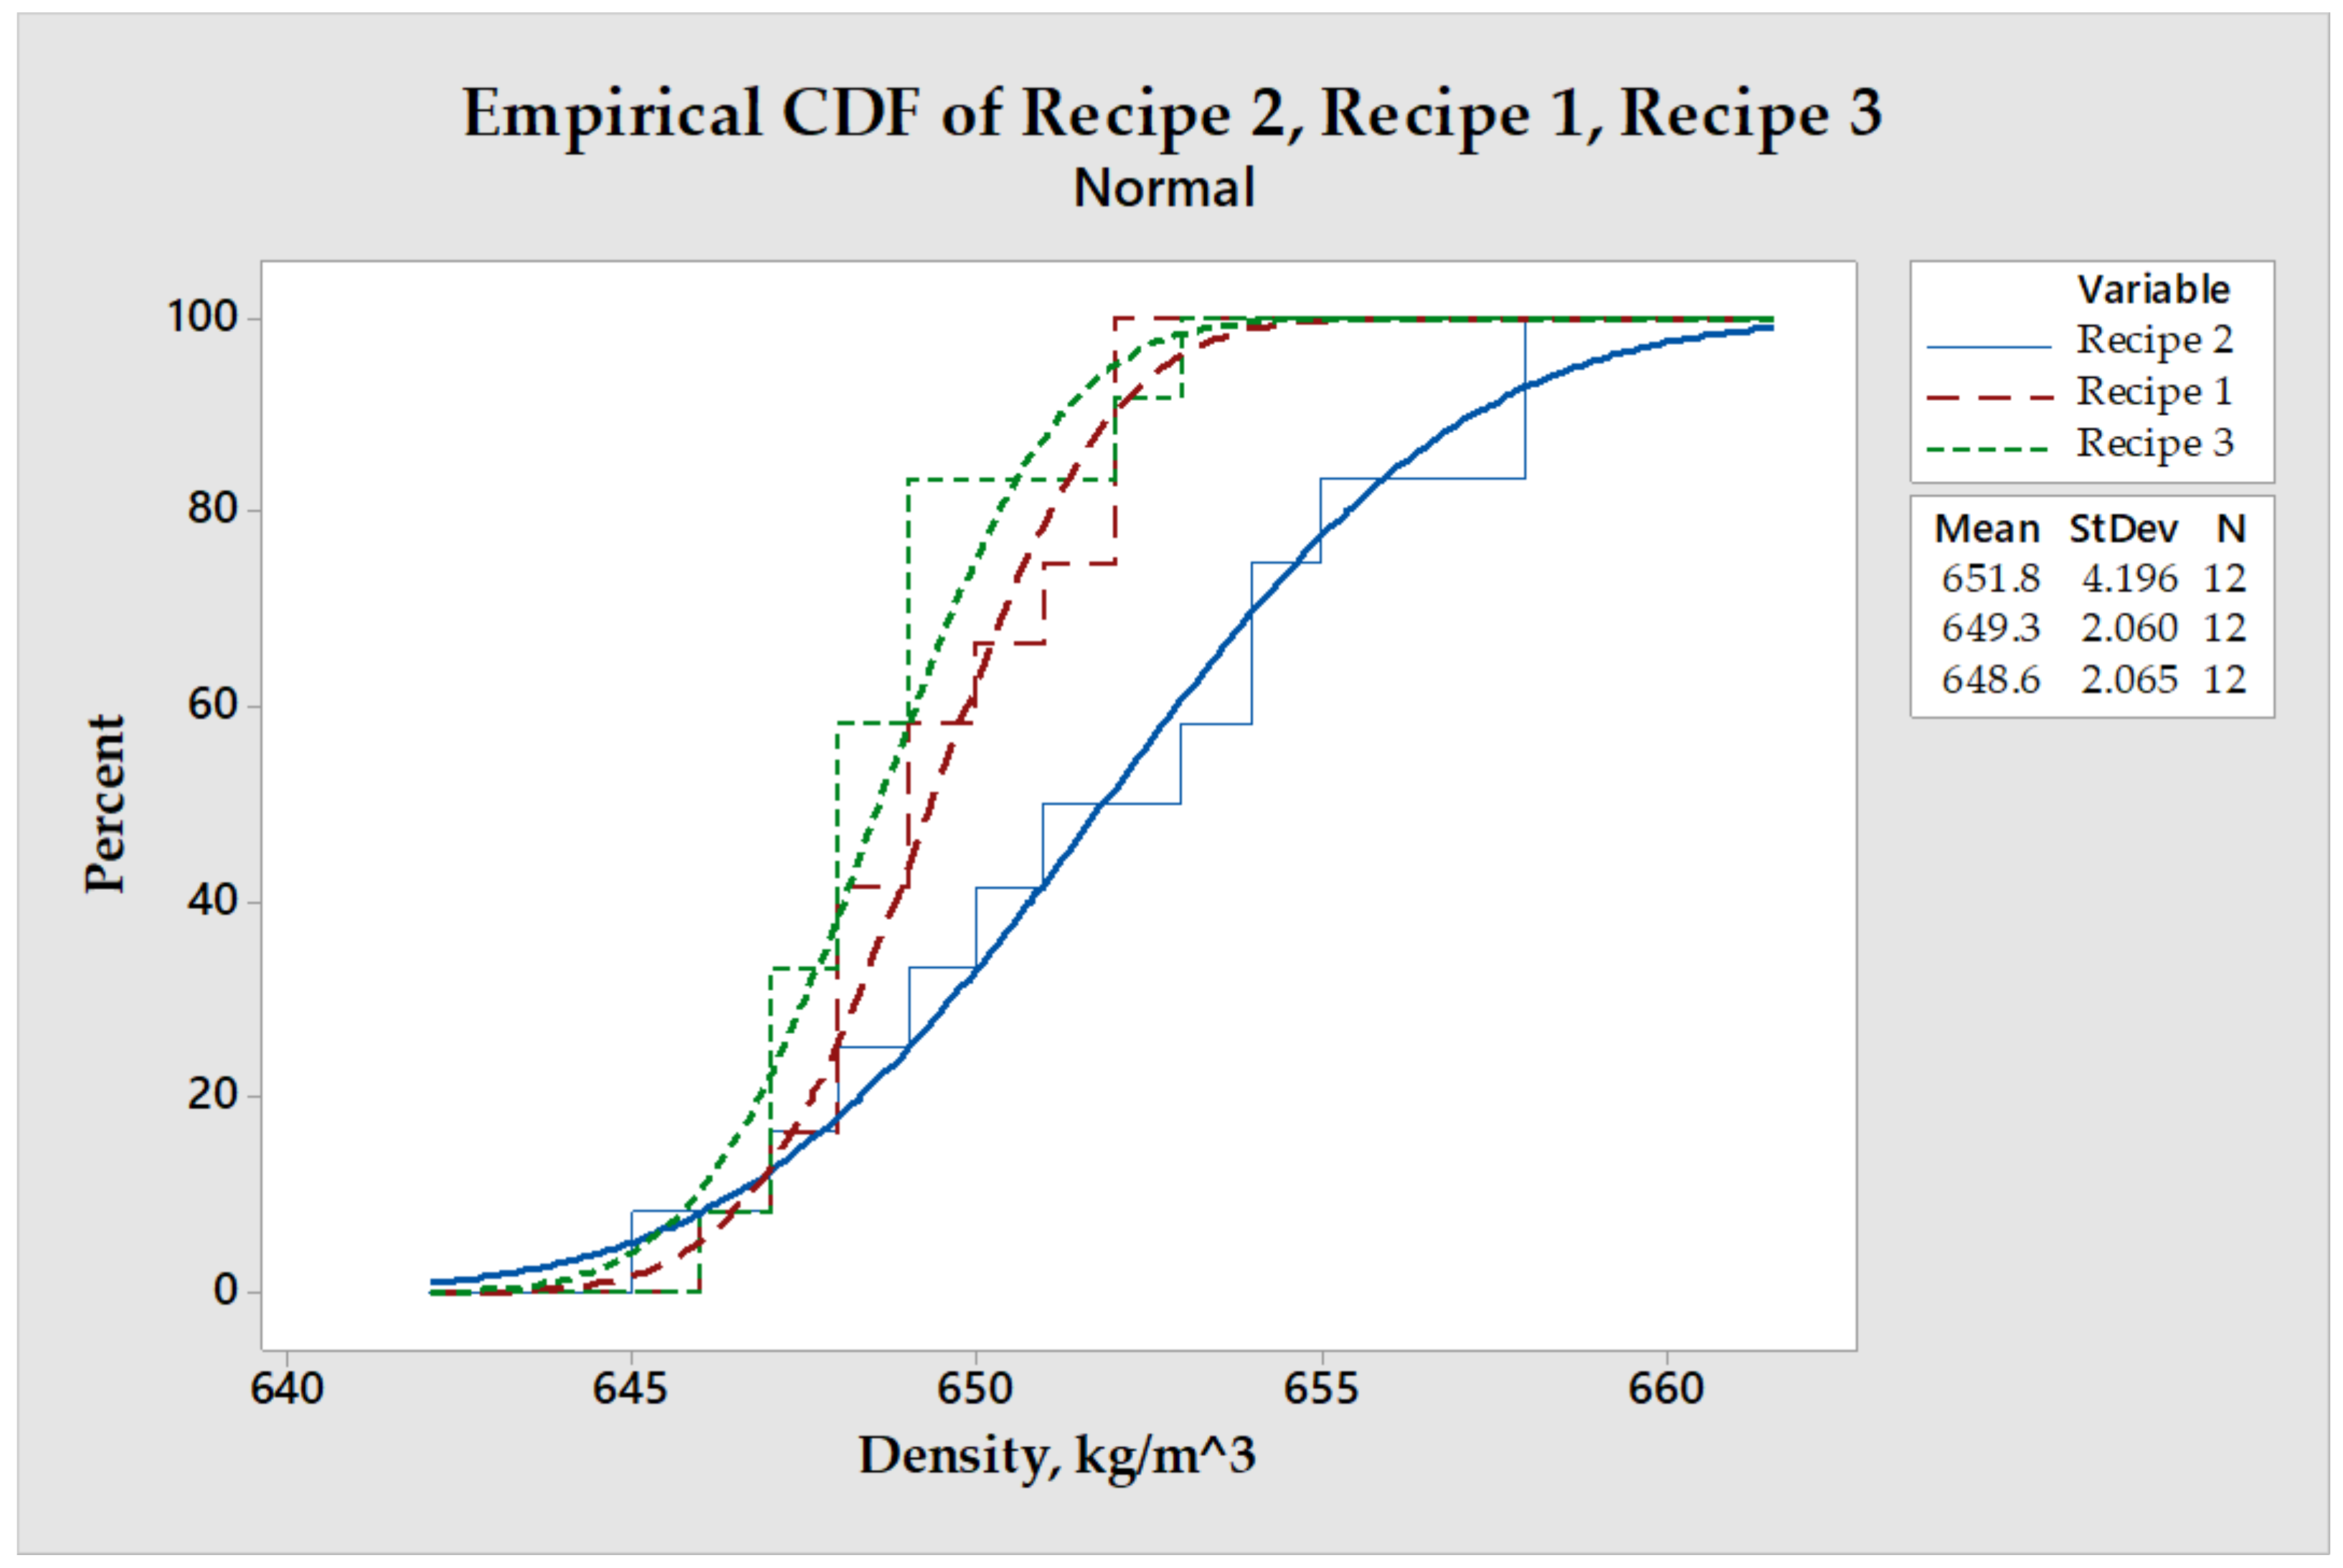
3.3. Density Profile on Thickness

The average densities of each of the three types of particleboards, obtained based on the EN 323: 1993 standard [61], were around 650 ± 20 kg/m3, similar to the density of particleboard manufactured with UF resin at a medium moisture content of 10%, determined based on EN 322: 1993 [62]. In general, all three density profile diagrams (corresponding to the three manufacturing particleboards based on three different recipes) followed the same rules:
-
they had two symmetrical maximum peaks that were arranged a few millimeters from the faces as well as a minimum located in the middle area of the board;
-
the lowest density values were arranged in the exterior areas of the boards due to the thickness relaxation of this area after evacuation from the press;
-
a slight deviation of the densities towards one of the particleboard faces was determined by the fact that during the formation of the particle mat the small particles tended to migrate to the bottom of the mat, and the fine particles have a higher degree of densification than the coarse particles.
The vertical density profiles are presented in Figure 3. It could be observed that the in cases of Recipes 1 and 2, the diagrams are quite similar, with low surface densities of about 400 kg/m3 (Recipe 1) and 370 kg/m3 (Recipe 2), which increased to 750 kg/m3 and 780 kg/m3 at 1.1 mm and 2.9 mm from the surface. In the core layer, the densities were reduced to values of about 500 kg/m3 and 595 kg/m3, respectively. The uniform and nearly flat shape of the vertical profile of boards (785 kg/m3 on the faces and 610 kg/m3 in the core) were obtained for Recipe 3.

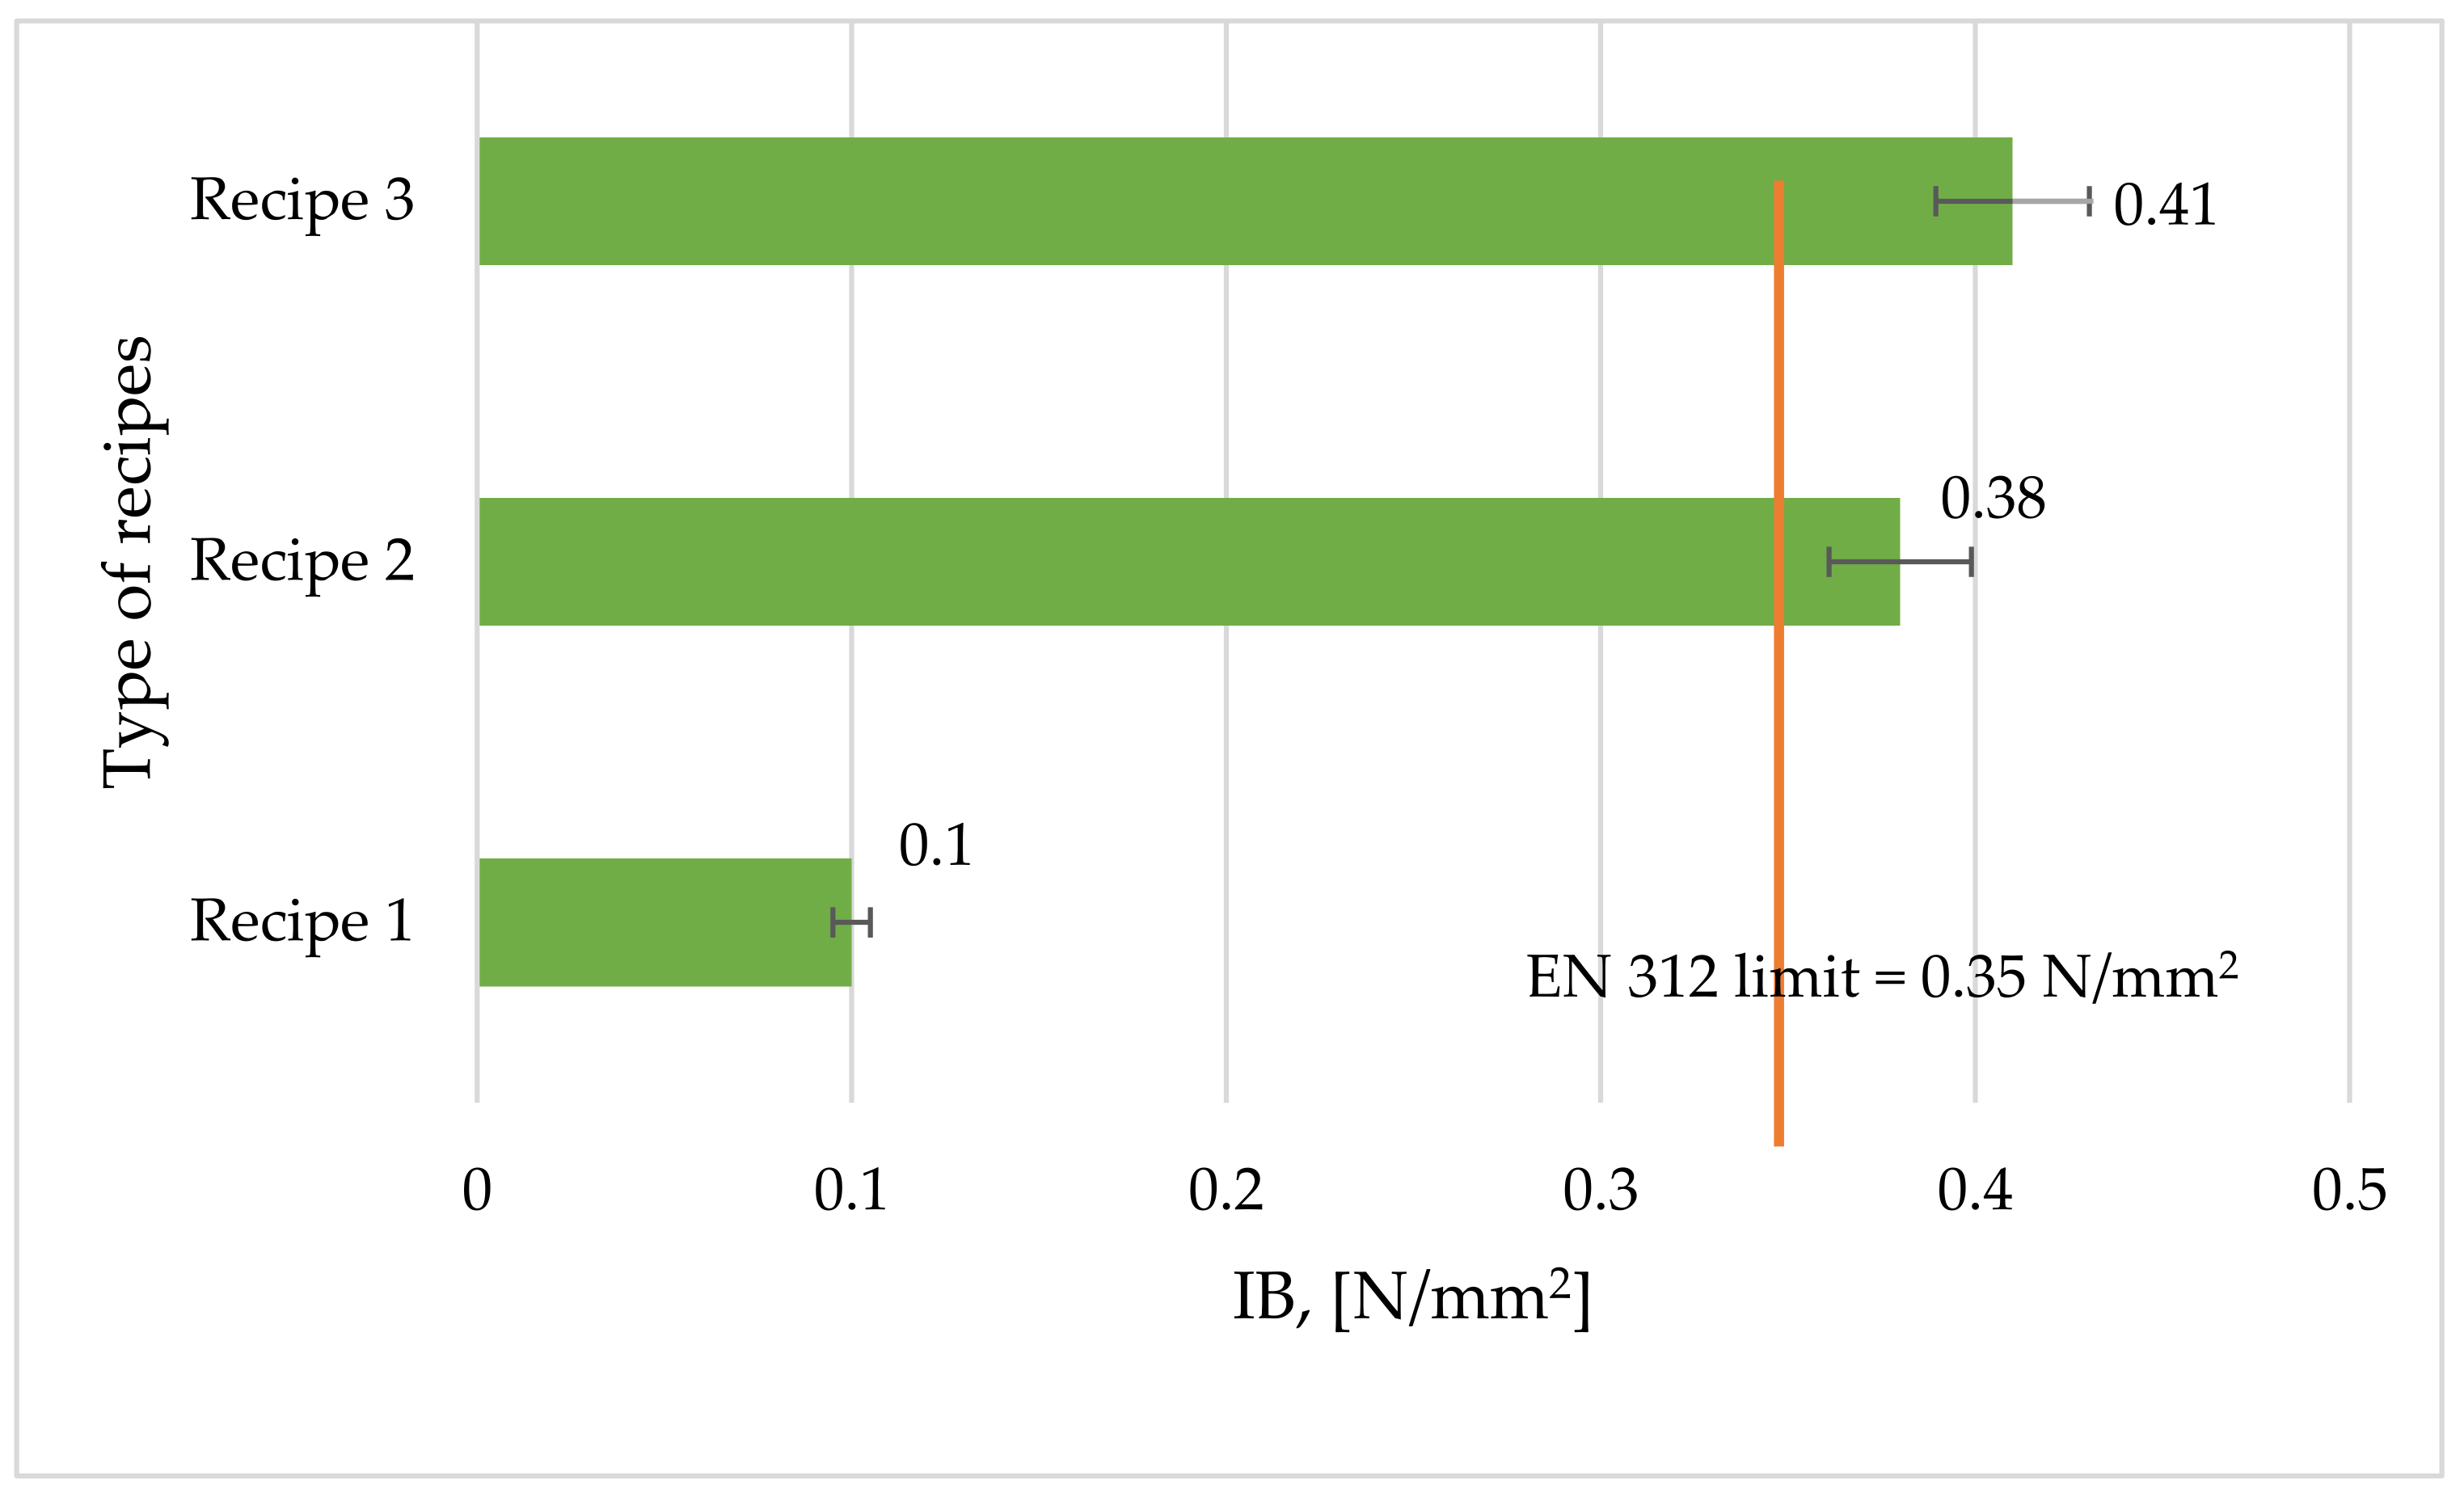
3.4. Internal Bond (IB)

The adhesiveness quality of each adhesive recipe is usually given by the value of the resistance to an internal bond test (which indicates the strength of the core area and is influenced by the core density, particle geometry, and adhesive quantity and distribution). From this point of view, Recipe 2 and Recipe 3 were clearly better than Recipe 1 (Figure 4). This means that the introduction of the two crosslinkers lead to an increase in the cohesive property of the particles. Thus, the introduction in the recipe of the pMDI crosslinker had a medium effect, namely, 3.8 times higher than in the case of the boards without this crosslinker (Recipe 1). The addition of glucose in the adhesive recipe (Recipe 3) led to a slight increase in IB by 7.8% compared to Recipe 2 but 4.1 times higher than the board without crosslinkers (Recipe 1).
If the comparison with the minimum value of 0.35 N/mm2 of the European standard EN 312 [57] is made, it was observed that the boards obtained with Recipe 1, without crosslinkers, did not correspond to the requirements of the standard, with the difference being very high: 2.91 times. Therefore, the boards obtained using only oxidized magnesium lignosulfonate are not suitable in terms of internal bond. They are recommended to be used in situations where the cohesion of the boards may be neglected. The other two types of boards had an IB above the minimum allowable value, exceeding it by 8.5% when 3% pMDI crosslinker was used or by 17.1% when a combination of glucose with pMDI (about 5%) crosslinkers (Recipe 3) was used. It is obvious that pMDI and glucose as crosslinkers had a positive influence on the IB strength of the experimental particleboards. Other studies showed improvements in IB by using a combination of bio-based materials (glyoxalase lignin, ammonium lignosulfonates, tannin, and soya) or urea-based resin with pMDI [3,14,16].

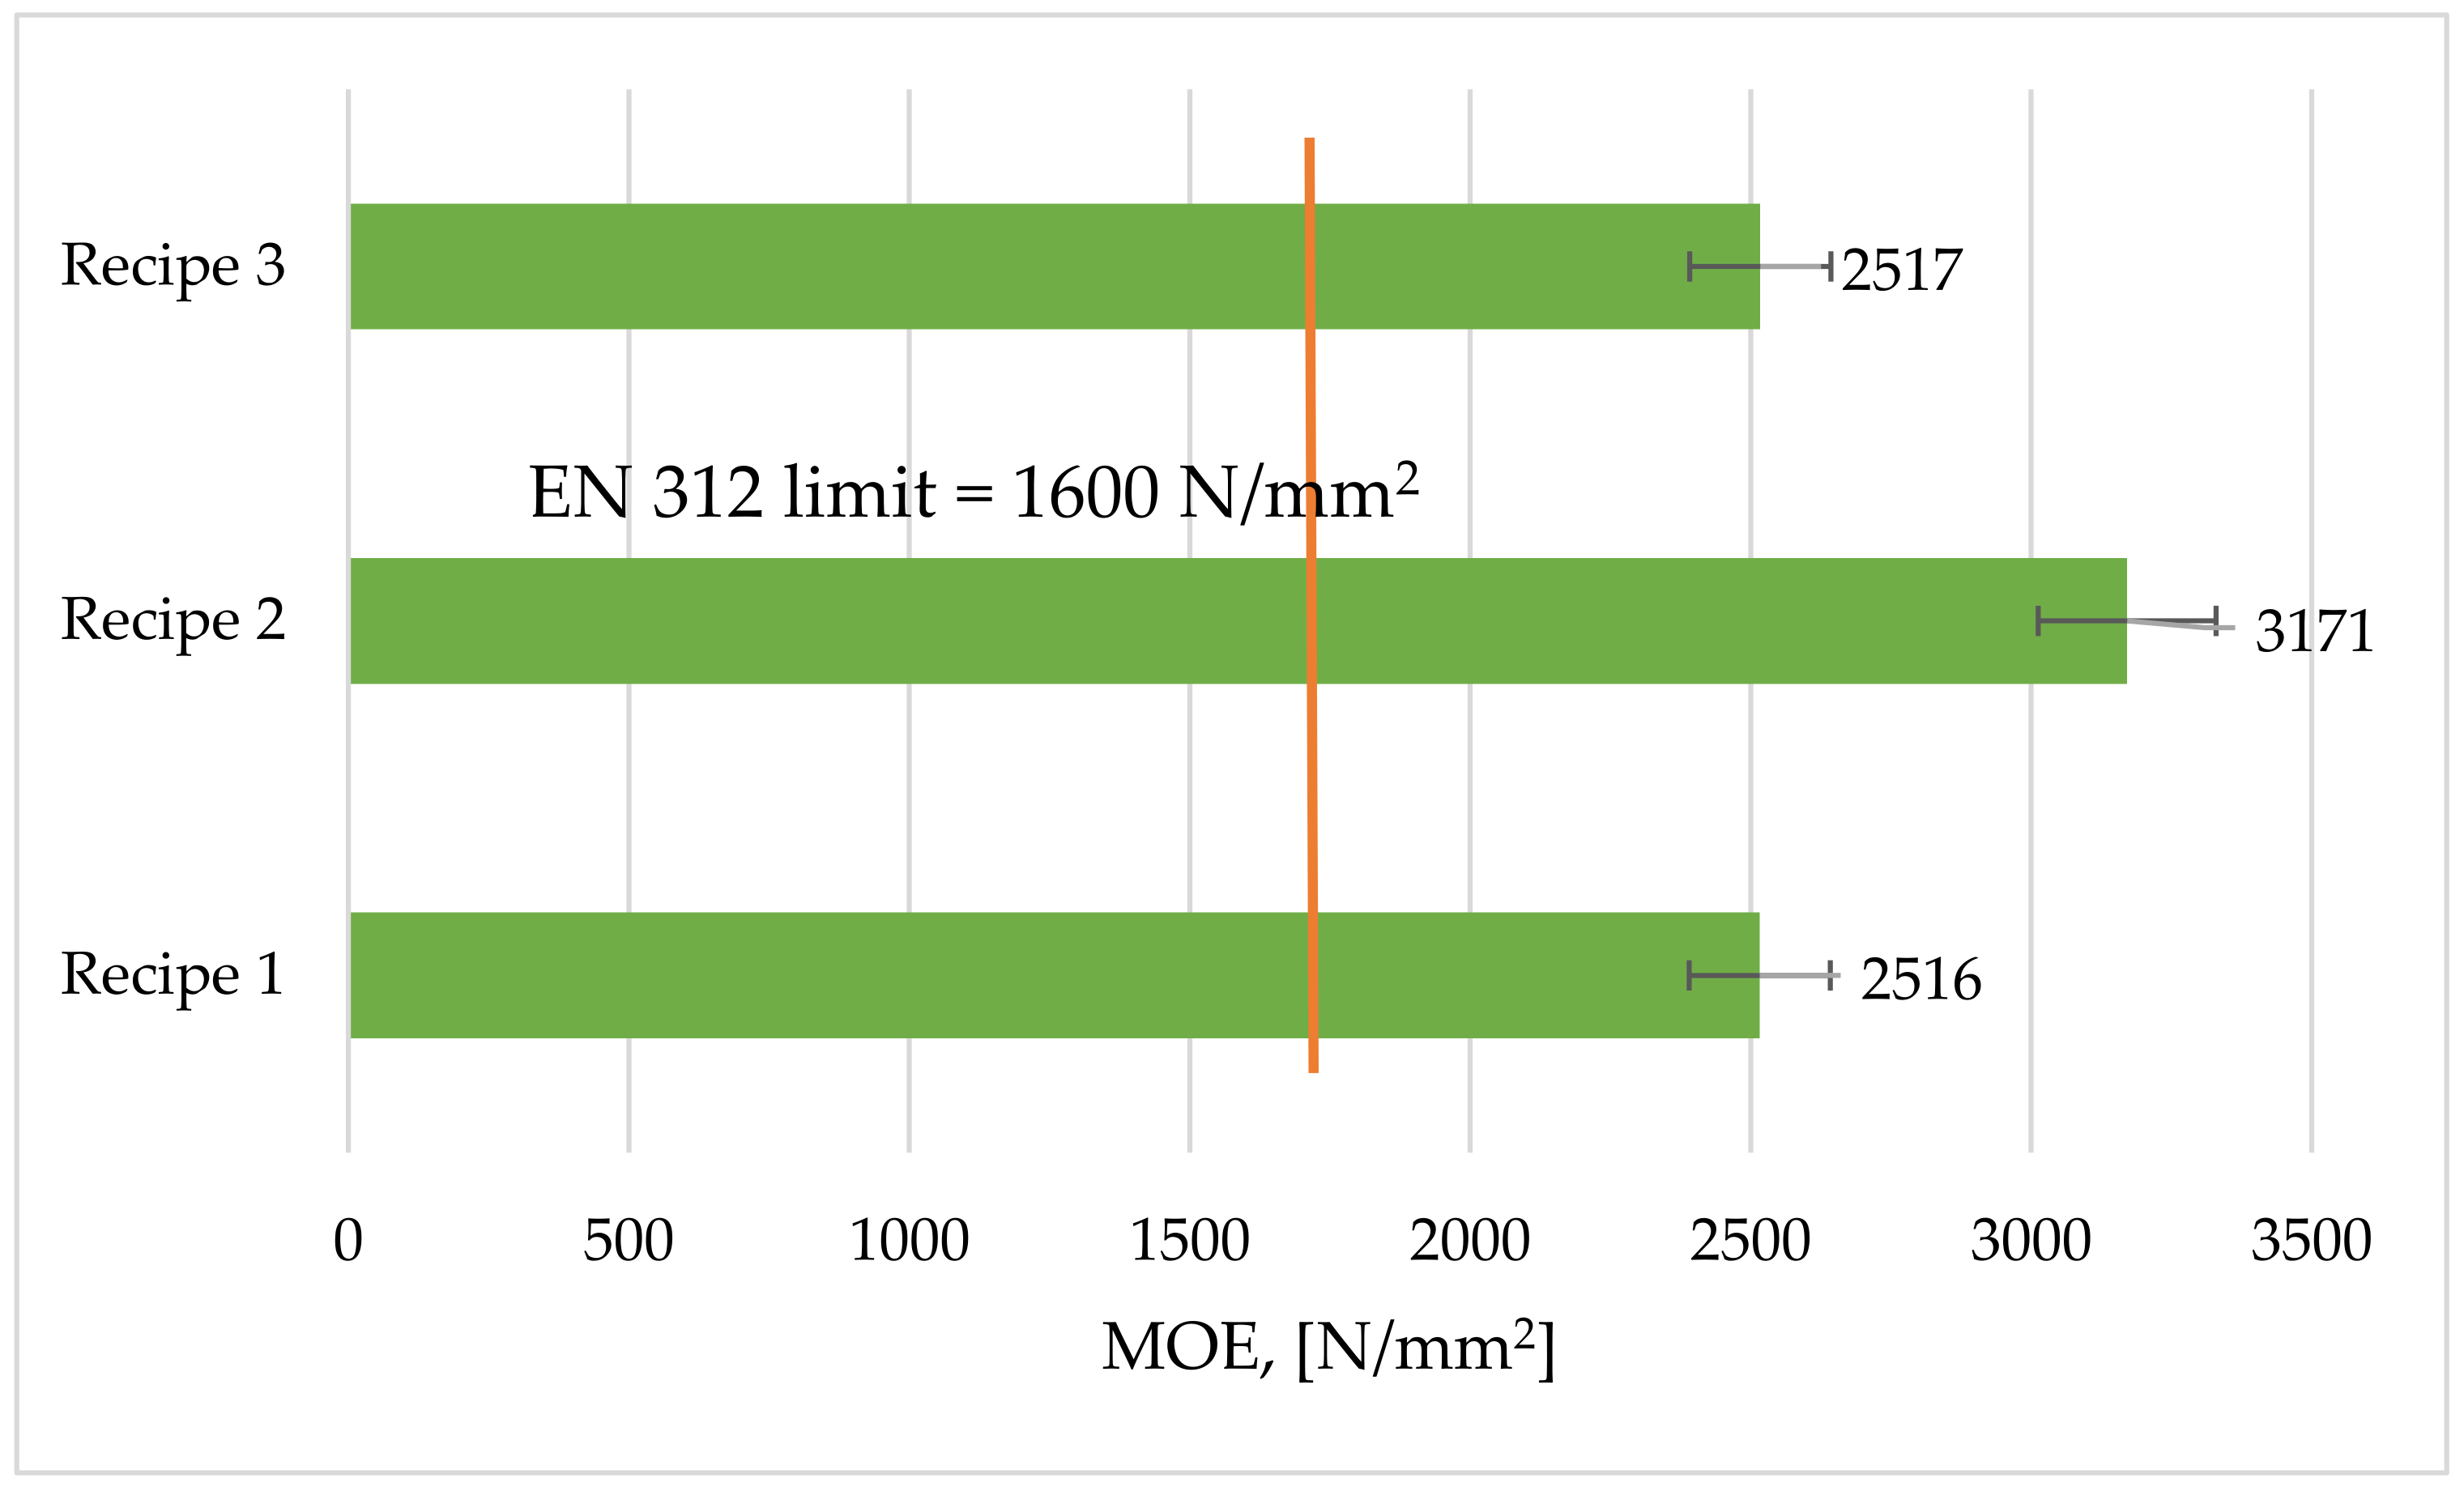
3.5. Modulus of Elasticity (MOE)

The moduli of elasticity that were obtained with each of the three recipes had very good values. The best elasticity values (Figure 5) belonged to that boards obtained with Recipe 2 (with the addition of 3% pMDI), which were 26% higher than the boards without crosslinkers (Recipe 1) and 25.9% higher than the boards with the addition of pMDI and glucose crosslinkers (Recipe 3). It turns out that the addition of separate pMDI crosslinker and a combination of pMDI and glucose added a positive value to the particleboard elasticity.
Compared to the limit value of 1600 N/mm2 specified by the European standard EN 312, it was found that all MOE values exceeded the limit. The boards obtained with Recipe 1 exceeded it by 57%, the boards obtained with Recipe 2 exceeded it by 98.1%, and the boards obtained with Recipe 3 exceeded it by 57.3%. The most elastic panels were those obtained with the pMDI crosslinker (Recipe 2).

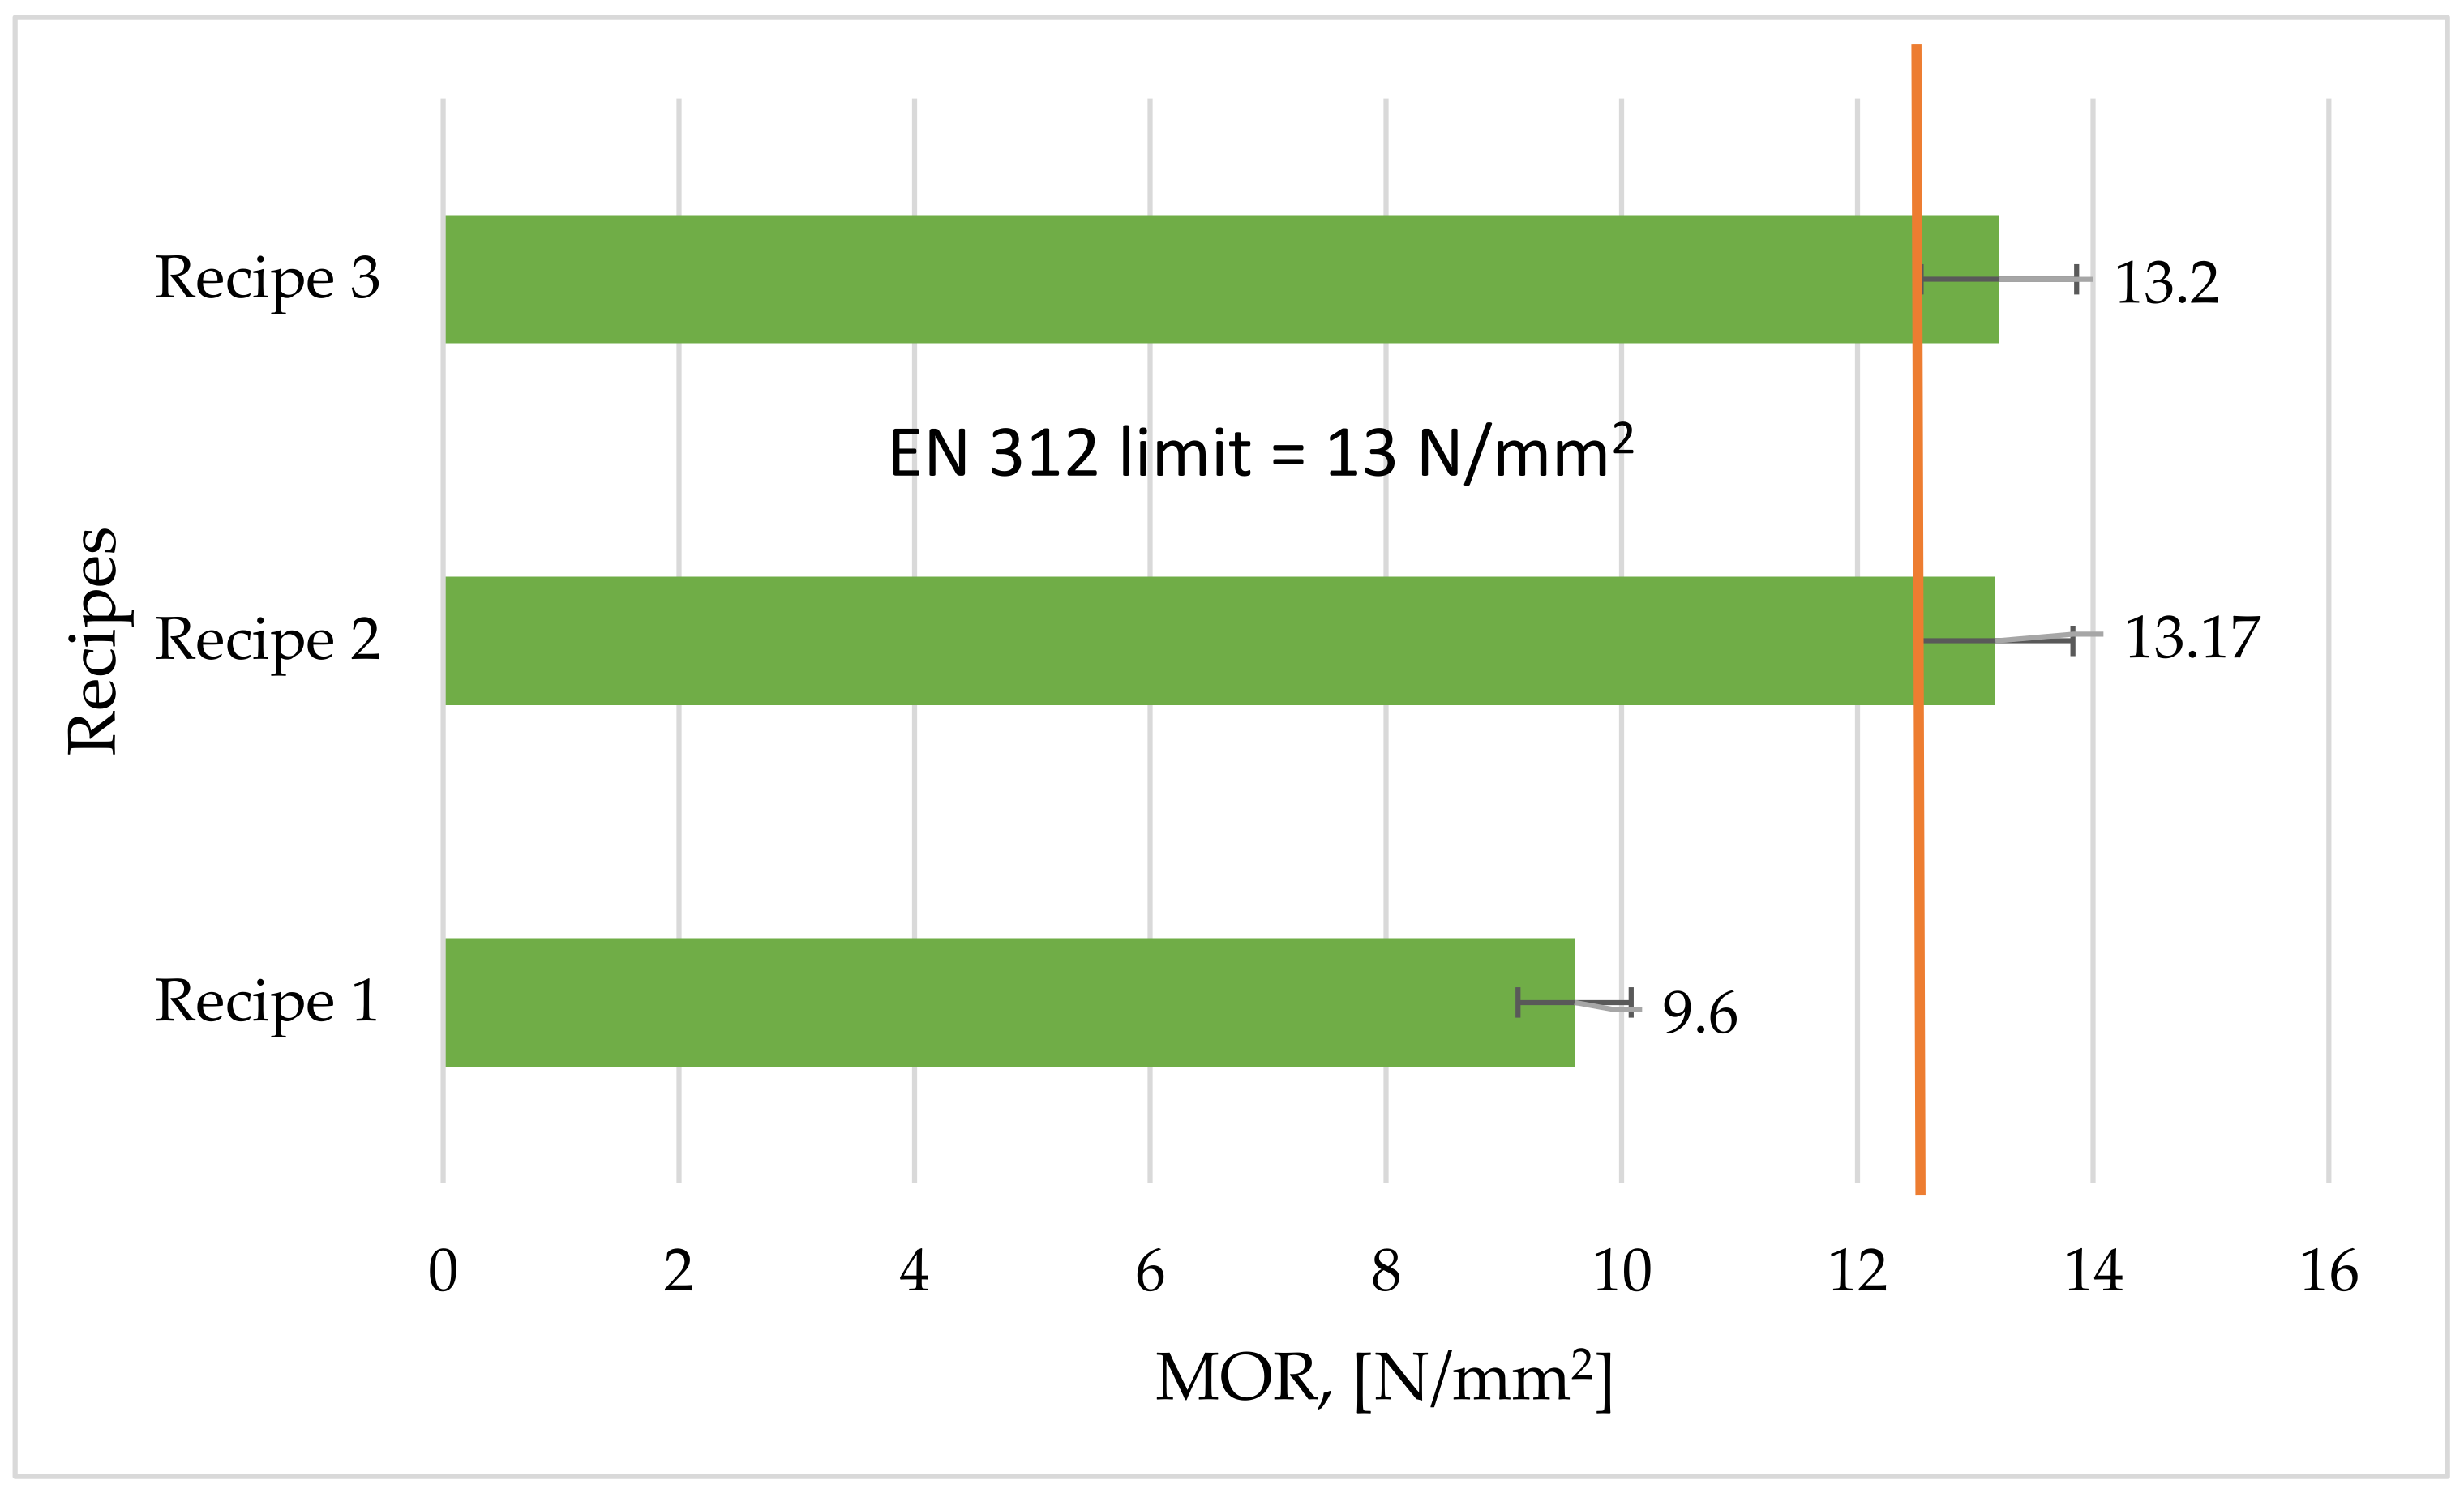
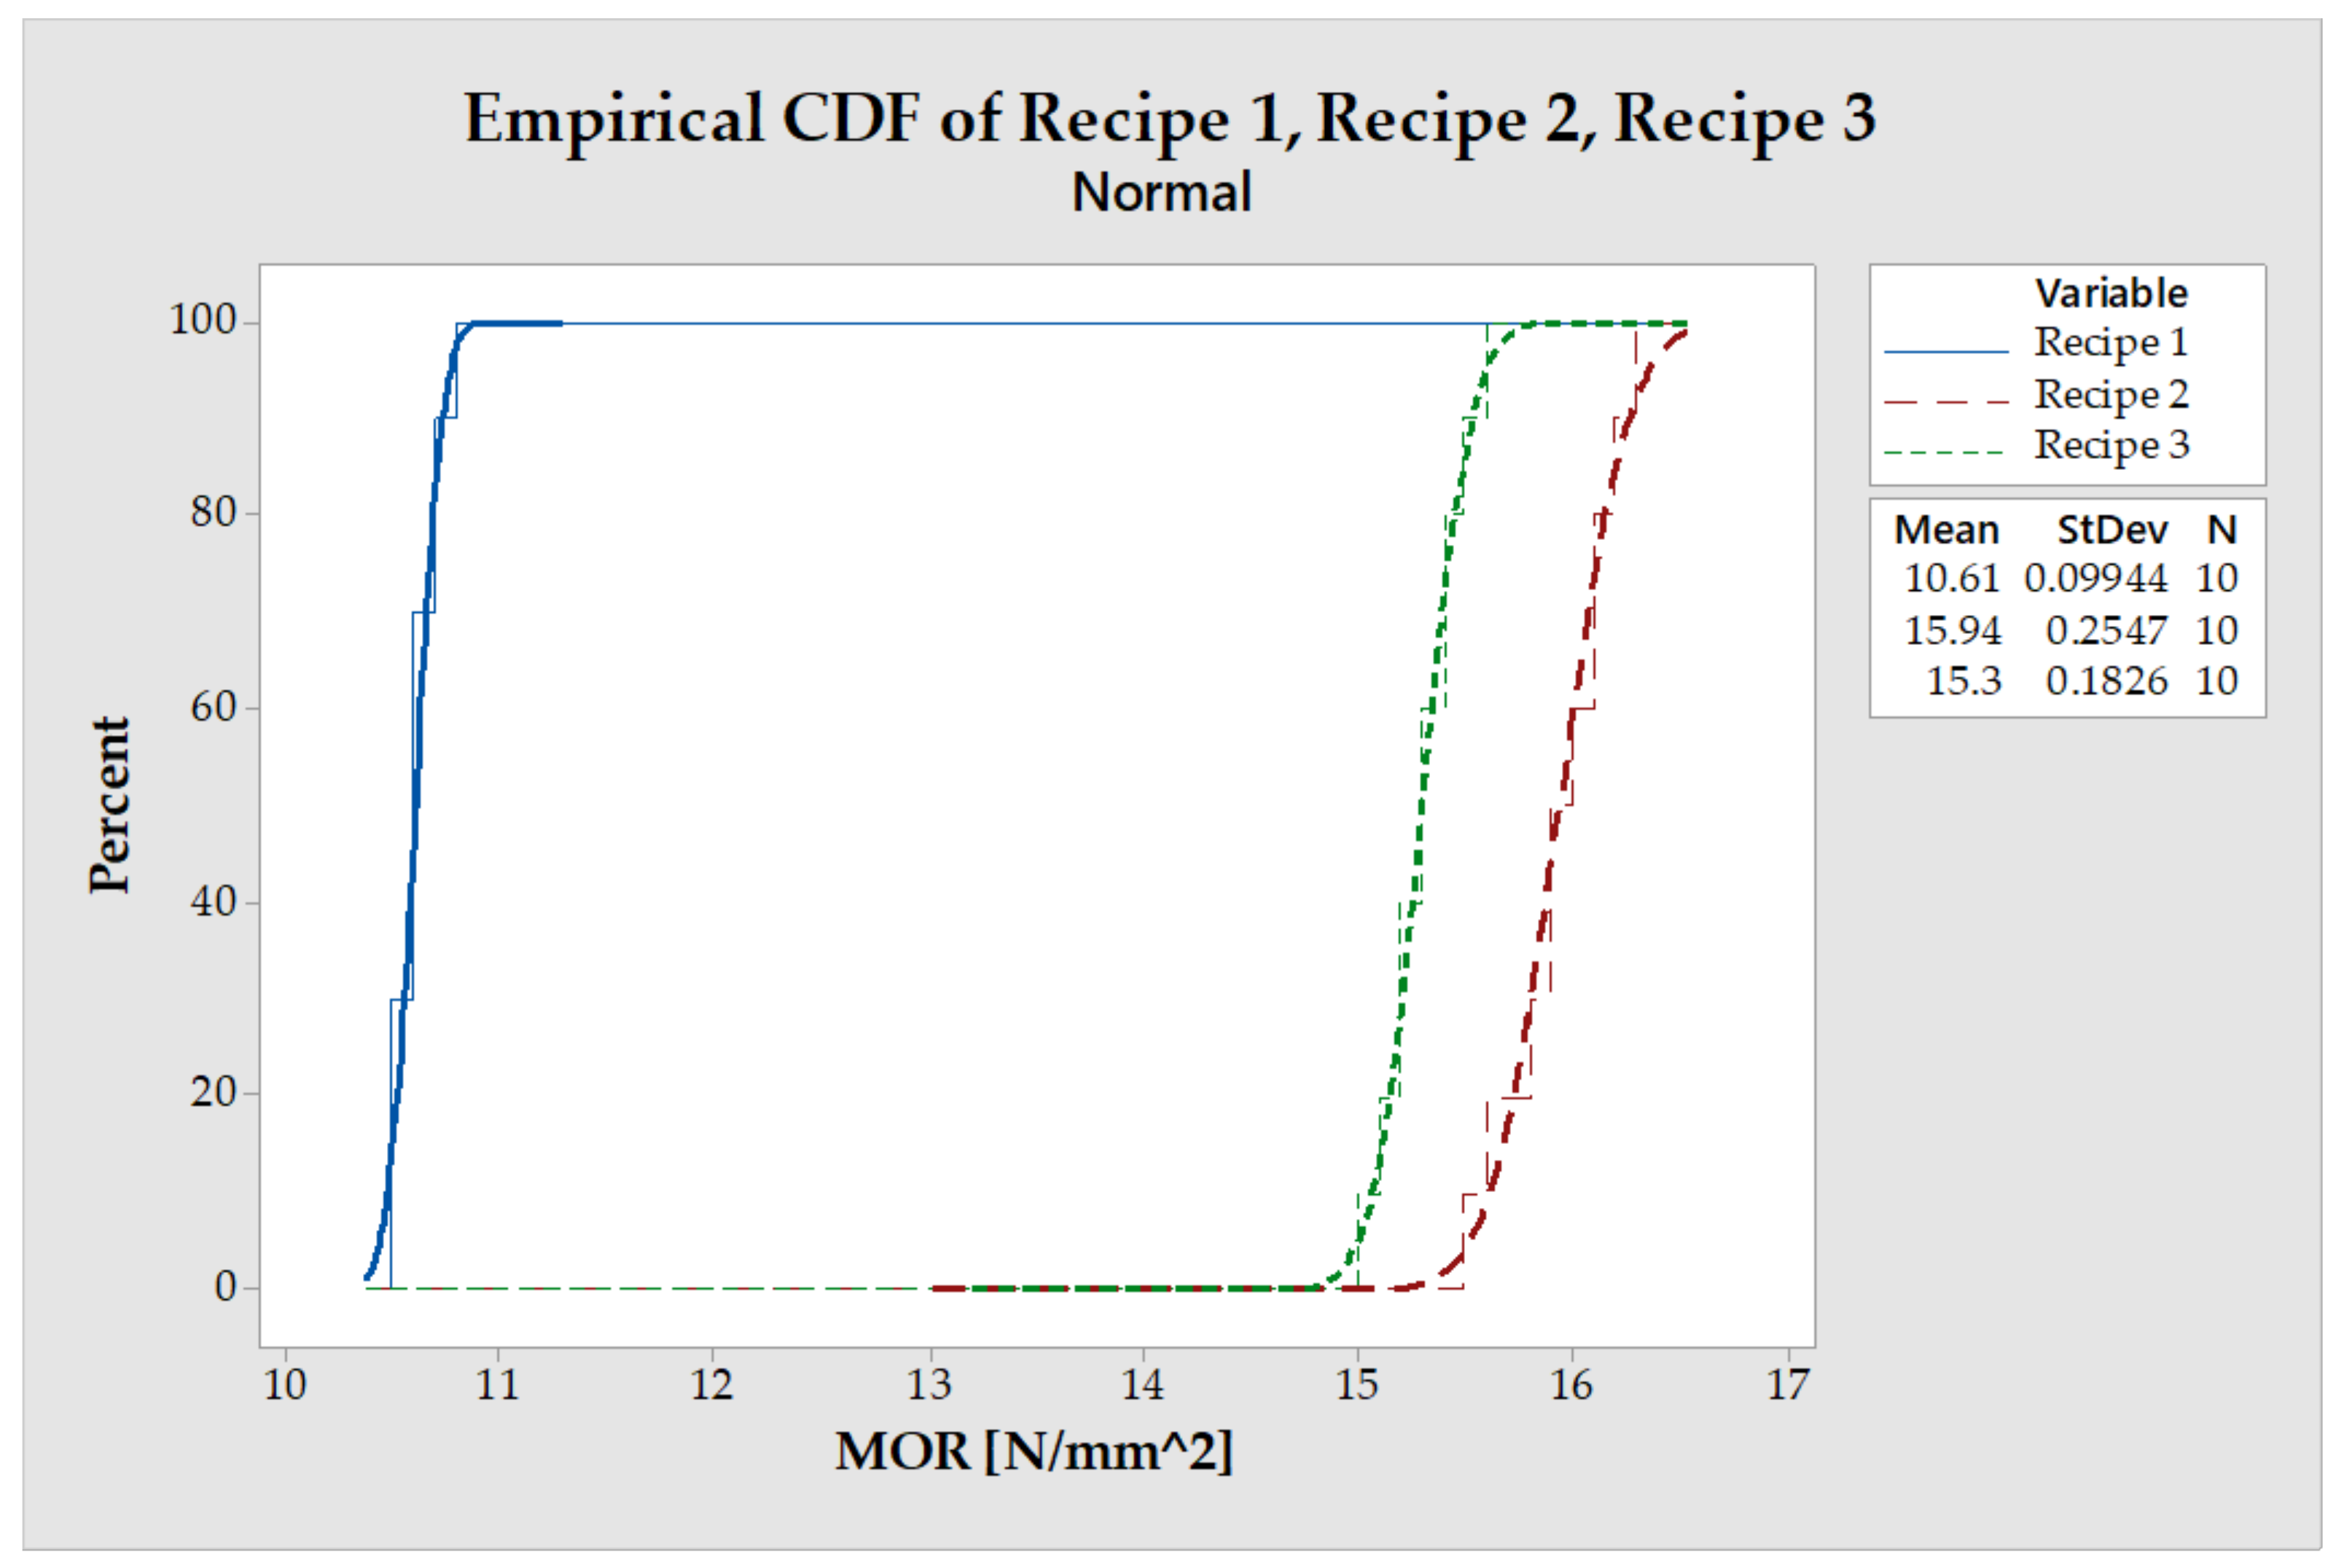
3.6. Modulus of Resistance (MOR)

The modulus of resistance for static bending resulting from laboratory tests differed from one adhesive recipe to another, with Recipe 3 on top (having both crosslinkers), providing the best board strength (Figure 6). Compared to the other two recipes, the boards obtained with Recipe 3 had an MOR 37.5% higher than the boards without crosslinkers (Recipe 1) and only 0.2% higher than the boards with Recipe 2 (with the pMDI crosslinker). Thus, it was shown that the introduction of the two crosslinkers (separately or in combination) significantly increased the resistance to static bending of the boards.
Comparing the real MOR values with the limit value of 13 N/mm2, imposed by the EN 312 standard, it was found that the boards bonded with Recipe 1 (without crosslinkers) are not recommended, having a value 27.1% below the allowable limit. Boards made with Recipe 2 (with the pMDI crosslinker) had a value with above the standard limit, and boards made with Recipe 3 (with the pMDI and glucose crosslinkers) had values 1.5% above the standard limit. Therefore, from the point of view of the MOR, the boards obtained with Recipes 2 and 3, for which crosslinkers were used, are recommended for P2-type panels (jointed panels used for indoor conditions). The addition of pMDI obviously improved MOE and MOR values (MOR: 11.1 N/mm2, MOE: 2056 N/mm2) as was also observed by other authors [54,55].

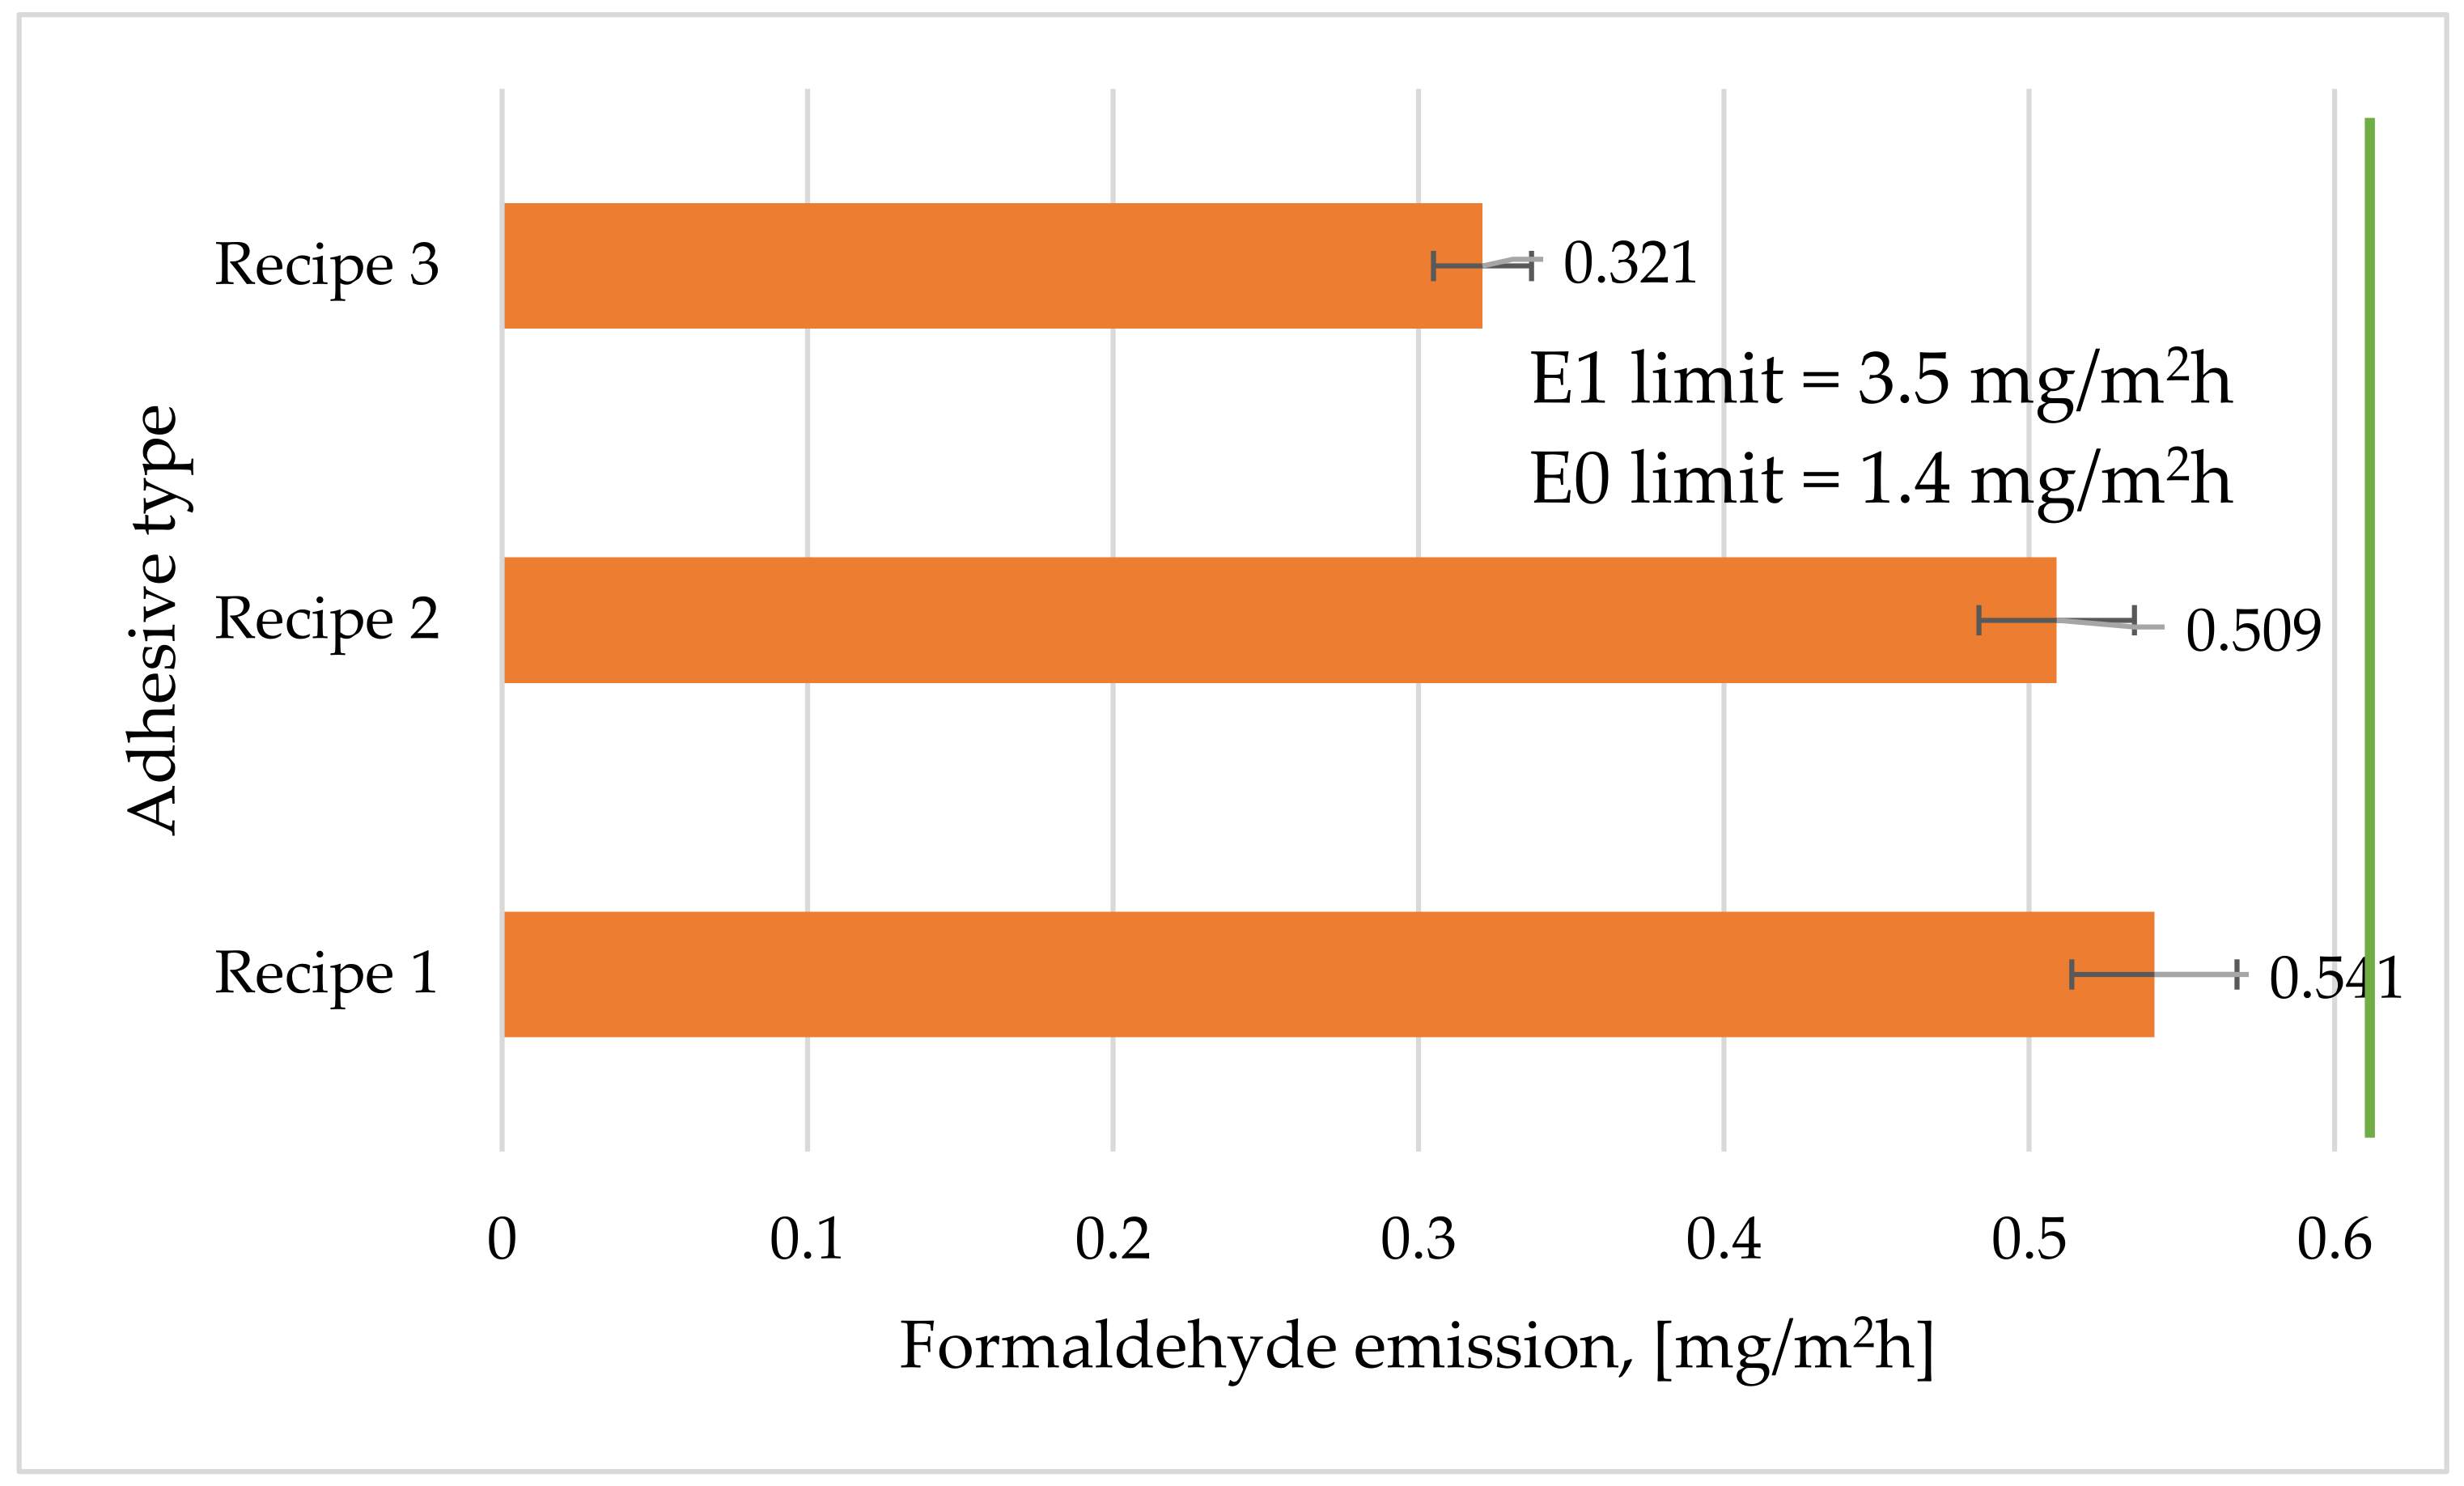
3.7. Emission of Formaldehyde

Regarding the formaldehyde emissions, the values obtained for the particleboards with the three adhesive recipes were compared with the average reference value of 3.5 mg/m2h imposed by EN 717-2: 1995 for emission class E1 and with the value of 1.4 mg/m2h for emission class E0 (Figure 7). All results were in the E1 and E0 emission classes, but the particleboards obtained with Recipe 3 had the lowest emissions, which meant that the addition of crosslinkers significantly reduced the formaldehyde emissions. In the case of Recipe 1, the value obtained for formaldehyde emission was low, 6.4 times lower than the standardized E1 limit and 2.5 times lower than the standardized E0 limit, which places these boards in the category of particleboards with ultra-low formaldehyde emission, close to that of natural wood [20]. By combining this value with the mechanical strengths (MOR and IB) of this type of particleboard, this board is recommended to be used in the field where no high-strength particleboards are required (i.e., paneling, decorative furniture, etc.).
It can also be observed in Figure 7 that the addition of only 3% pMDI crosslinker in Recipe 2 decreased the formaldehyde emission by 5.9% compared to boards with Recipe 1. This showed that the introduction of pMDI crosslinker is beneficial, with this crosslinking being considered to have zero formaldehyde emission and major improvements in particleboard strength [29]. The average free formaldehyde emission for magnesium lignosulfonate adhesive modified by oxidation with H2O2 and the addition of pMDI and glucose (Recipe 3) was below the maximum standardized limit (beyond 10 times lower, more precisely 10.9 times) for emission class E1 (3.5 mg/m2h limitative value) and 4.36 times lower compared to class E0 (1.4 mg/m2h limitative value), which is required by the European standard EN 717-2: 1995 [7]. This demonstrated that the introduction of the PMDI-glucose crosslinker combination strongly decreases formaldehyde emissions, remaining, as in the case of Recipe 1, below the E0 class limit of 1.4 mg/m2h and getting closer to that of solid wood [20].

4. Discussion

The geometry of wood particles has a positive influence and could give good resistance to the particleboards if they have a needle shape where the length is much larger than the width and thickness [45]. Large differences were observed between coarse and fine chips, as observed using granulometry (Figure 2a,b) and as the variation equations from the figures specified. Moreover, in Figure 1 it was observed that the width and thickness of the particles are very close to each other when the dimensions of the sieves decrease, and at a certain moment (when the sieves are smaller than 1 mm × 1 mm) it is no longer possible differentiate between width and thickness. Therefore, in the research, a clear separation was made between the two categories of particles (coarse and fine), as other authors have specified before [44,45]. Referring to the granulometry analysis, large differences were observed between coarse and fine particles in terms of participation rate. The participation rate analysis for particles with diverse geometry is justified by the fact that the particles are mostly inhomogeneous in terms of size and shape. As a result, two particles going through the same sieve with the same mesh size may differ in shape [17].
The particleboard vertical profile of density obtained with Recipe 2 differs from the one with Recipe 1 by the distance of the peak density, which is situated at 2.9 mm from the surface compared to 1 mm in Recipe 1, which means that the calibration operation requires the removal of thicker layers to have a good density of faces. It is known that not all this area should be removed during calibration and only the relaxation area should be removed after pressing, about 0.2–0.4 mm. Some authors [63,64] observed that in order to obtain high strengths the peaks of the density profile must be around 900 kg/m3, a value that can also be observed from the density profile of the boards in Figure 3. It was also found that the short pressing time brings the two peaks very close to the board surface, and the high pressing time sends the two peaks to the central area of the board. From this point of view, the boards obtained in the research had a high pressing time of 16 min, with the two peaks of density being slightly away from the surface of the board. More distance was obtained with Recipe 2. The vertical density profiles are presented in Figure 3. It could be observed that in case of Recipes 1 and 2, the shapes are quite similar, with low surface densities of about 400 kg/m3 (Recipe 1) and 370 kg/m3 (Recipe 2), which increased to 750 kg/m3 and 780 kg/m3 at 1.1 mm and 2.9 mm from the surface. In the core layer, the densities were reduced to values of about 500 kg/m3 and 595 kg/m3, respectively. The uniform and nearly flat shape of vertical profile of boards (785 kg/m3 on the faces and 610 kg/m3 in the core) was obtained for Recipe 3. This demonstrates higher mechanical properties that were obtained in the case of Recipe 3 compared to Recipes 1 and 2. Similar results in the density profile were obtained by other authors [64]. The addition of glucose to Recipe 3 determined the decrease in the differences between the densities for the core and faces and also the distance between the peak of maximum density, which leads to more uniform density along the thickness of a board. The addition of pMDI and glucose as crosslinking agents improved the internal cohesion of particles [13].
Even if the average board densities of the experimental panels were around 650 kg/m3, the variation in the values differed from one board to another. This is given by the different standard deviations of the three values of 4.196, 2.060, and 2.065 (Figure 8), as other authors have stated before [15]. Other authors [15,18] have established that the optimal density of particleboard could be 680 kg/m3.
The empirical cumulative distribution function (CDR) in Figure 8 shows the statistical distribution of density values. Moreover, if the confidence interval of 95% is taken into account, the intervals of density variation were found to be 645–653 kg/m3 for Recipe 1, 643–660 kg/m3 for Recipe 2, and 644–652 kg/m3 for Recipe 3. The intervals calculated statistically and based on the median and the standard deviation overlapped perfectly with those visible in Figure 8 in the middle area.
Table 4 shows the one-way ANOVA statistical analysis for the density of the boards obtained with Recipes 1 and 2. It was found that, out of the 12 values on the basis of which the means of the densities of the two different types of boards were determined as a manufacturing recipe, only 1 value does not match. Moreover, the low values of the F-value and p-value highlighted the normality of the distribution for 95% confidence and the correctness of the statistical analysis.
The quality of adhesion was assessed by an internal cohesion test that indicated the strength of the core region. This is influenced by the core density, particle geometry, and adhesive quantity and distribution. A lower value of IB (of 0.18 N/mm2 and below 0.16 N/mm2) was also obtained by Da Silva et al. [44] in the case of solely using calcium and magnesium lignosulfonates as adhesives for particleboard manufacturing without crosslinkers. It is obvious that pMDI and glucose as crosslinkers had a positive influence on the IB strength of the experimental particleboards. Other studies showed improvements in IB by using a combination of bio-based materials (glyoxalase lignin, ammonium lignosulphonates, tannin, and soya) or urea-based resin with pMDI [26,48].
Static bending strength is one of the most important mechanical properties of particleboards, along with the internal bond [29,30,31]. Figure 9 shows the graphical empirical CDF for all three manufacturing board types, which highlights the small variation in values. This is evidenced by the small standard deviations of 0.09, 0.25, and 0.18 N/mm2 for Recipes 1, 2, and 3, respectively. Taking into account the 95% confidence interval, the variation ranges of the MOR of 10.41–10.80 N/mm2 for Recipe 1, of 15.43–16.44 N/mm2 for Recipe 2, and of 14.93–15.66 N/mm2 for Recipe 3 were obtained, which are the same as those observable on the CDF chart. The addition of pMDI obviously improved MOE and MOR values (MOR: 11.1 N/mm2, MOE: 2056 N/mm2) as was also observed by Hemmila et al. [65] (MOR: 5 N/mm2, MOE: 2000 N/mm2). Similar results for MOR and lower values for MOE compared to those obtained with Recipe 1 were found by Bekhta et al. [66] by replacing a urea-formaldehyde adhesive with 10–20% magnesium lignosulfonate and by Hemmila et al. [51,65] for boards with particleboards produced with urea-melamine-formaldehyde. An increase in the content of lignosulfonate solution in the adhesive recipe can lead to an increase in the moisture content, a greater fragility of the boards, and a higher content of the steam–gas mixture in the process of pressing, determining in this way a decrease in the MOE and MOR values [65,66,67].
Many studies [3,13] have shown a decrease in formaldehyde emissions when using lignosulfonates in the case of composite boards, such as MDF or plywood, using percentages greater than 20% in order to obtain the E1 emission class [14]. In the research, the use of 15% lignosulfonate compared to the amount of chips in the particleboard manufacturing led to obtain the emission class E0 and even below to that of wood formaldehyde emission. Moreover, all research using lignosulfonates, whether based on magnesium or ammonium [25,29,33], has had a beneficial effect on reducing formaldehyde emissions from composite boards. It was shown in this way that the small differences between the two lignosulfonates, of percentages of less than 6% of magnesium or ammonium, do not have an influence on the formaldehyde emissions. The low formaldehyde emissions of experimental boards with pMDI and glucose participation may be explained by the short time of adhesive film curing the adhesive on the particle surfaces, which can block the release of formaldehyde from the surface of wood particles. This theory is supported by the microscopic images, where a good adhesion between wood particles can be noticed.
Several studies [44,50,67] concluded that substances with hydroxyl groups positively influence the internal bond of the lignocellulosic composites and their low formaldehyde emission. Thus, D-glucose, which has hydroxyl groups in its composition, can decrease the emission of formaldehyde. Recent research [54] has shown that magnesium lignosulfonate (15% by weight of wood particles) can be used in fiberboard manufacturing with good mechanical and physical properties. Their low formaldehyde emission (1.1 mg/100 g oven dry panel, super E0 class), recommend them for indoor uses.
Figure 10 presents a sketch of the main research activities, putting the stress on raw materials (lignosulphonate and chips) and the pressing of chip mats.
The images of microscopic analysis (Figure 11) of the particleboard structure show the interconnections between particles. Larger gaps between the bonded wood particles and the adhesive agglomeration in some areas in the structures without crosslinkers were observed (Recipe 1) (Figure 11a). The structures of particleboards with Recipes 2 and 3 (Figure 11b,c) were characterized by small and rare gaps and a more uniform distribution of adhesive, which led to higher values of MOR, MOE, and IB compared to panels with Recipe 1.

5. Conclusions

The use of all three adhesive recipes that were based on the magnesium lignosulfonate for particleboard manufacturing had significantly impacts in reducing formaldehyde emissions by classifying them in the E0 and super E0 classes. This demonstrated that magnesium-lignosulfonate-based bio-adhesives can successfully replace the classic urea-formaldehyde or phenol-formaldehyde adhesives (with high formaldehyde emission).
The granulometric analysis of the wood particles demonstrated the importance of the different participation rates of the coarse and fine particles in the structure of the panels. The participation rates of the two chip fractions led to a good internal cohesion of the chipboard and resistance to static bending.
The particleboards glued with magnesium lignosulfonate in combination with pMDI and glucose (Recipe 2 and Recipe 3) had very good strengths. The recorded values of internal bond, MOR, and MOE exceeded the limit values of the EN 312 standard for P1-type panels. In this way, it was shown that in addition to magnesium lignosulfonate, particleboard manufacturing recipes must also contain some crosslinkers, which will increase the strengths of the boards.
The density profiles of the experimental panels showed a good adhesion of particles by the higher IB obtained with Recipes 2 and 3, which complied with the general principles and proved that the parameters of the pressing process are decisive in this direction.
The hydroxyl groups of D-glucose (Recipe 3) might lower the emission of formaldehyde to the level of some natural wood species.

Author Contributions

Conceptualization, A.L. and G.B.; methodology, O.Z.; software, A.L.; validation, C.C., O.Z. and A.L.; formal analysis, C.C.; investigation, G.B.; resources, G.B.; data curation, G.B.; writing—original draft preparation, A.L.; writing—review and editing, C.C.; visualization, O.Z.; supervision, C.C.; project administration, A.L.; funding acquisition, A.L. All authors have read and agreed to the published version of the manuscript.

Funding

This research received no external funding.

Data Availability Statement

Not applicable.

Acknowledgments

The authors would like to thank the management of the Transilvania University of Brasov for the administrative and technical support provided during this research.

Conflicts of Interest

The authors declare no conflict of interest.

References

  1. Nelson, N.; Levine, R.J.; Albert, R.E.; Blair, A.E.; Griesemer, R.A.; Landrigan, P.J.; Stayner, L.T.; Swenberg, J.A. Contribution of Formaldehyde to Respiratory Cancer. Environ. Health Perspect 1986, 70, 23–35. [Google Scholar] [CrossRef] [PubMed]
  2. Casteel, S.W.; Vernon, R.J.; Bailey, E.M., Jr. Formaldehyde: Toxicology and Hazards. Vet. Hum. Toxicol. 1987, 29, 31–33. Available online: https://europepmc.org/article/MED/3824872 (accessed on 3 February 2022).
  3. Athanassiadou, E.; Tsiantzi, S.; Markessini, C. Producing Panels with Formaldehyde Emission at Wood Levels. COST E49 paper. 2009. Available online: https://chimarhellas.com/wp-content/uploads/2021/06/athanassiadou-tsiantzi-markessini-paper-2.pdf (accessed on 26 January 2022).
  4. EN 717-1:2004; Wood-Based Panels. Determination of Formaldehyde Release. Formaldehyde Emission by the Chamber Method. European Committee for Standardization: Brussels, Belgium, 2004.
  5. ASTM E1333-14; Standard Test Method for Determining Formaldehyde Concentrations in Air and Emission Rates from Wood Products Using a Large Chamber. ASTM International: West Conshohocken, PA, USA, 2010.
  6. EN 717-2: 1994/AC:2002; Wood-Based Panels—Determination of Formaldehyde Release—Part 2: Formaldehyde Release by the Gas Analysis Method. European Committee for Standardization: Brussels, Belgium, 2002.
  7. EN ISO 12460-5:2015; Wood-Based Panels—Determination of Formaldehyde Release—Part 5: Extraction Method (Called the Perforator Method). European Committee for Standardization: Brussels, Belgium, 2015.
  8. JIS A 1460:2001; Building Boards Determination of Formaldehyde Emission—Desiccator Method. Japanese Industrial Standard: Tokyo, Japan, 2001.
  9. EN 717-3:1997; Wood-Based Panels—Determination of Formaldehyde Release—Part 3: Formaldehyde Release by the Flask Method. European Committee for Standardization: Brussels, Belgium, 1997.
  10. Dunkey, M. Urea Formaldehyde (UF) Adhesive Resins for Wood. Int. J. Adhes. Adhes. 1998, 18, 95–107. [Google Scholar] [CrossRef]
  11. Akhtar, A.; Lutfullah, G.; Zahoorulah, U. Lignosulfonate—Phenolformaldehyde Adhesive: A Potential Binder for Wood Panel Industry. J. Chem. Soc. Pak. 2011, 33, 535–538. [Google Scholar]
  12. Gavrilović-Grmuša, I.; Dunky, M.; Milijković, J.; Djiporović-Momčilović, M. Influence of the Degree of Condensation of Urea-Formaldehyde Adhesives on the Tangential Penetration into Beech and Fir and on the Shear Strength of the Adhesive Joints. Eur. J. Wood Prod. 2012, 70, 655–665. [Google Scholar] [CrossRef]
  13. Pizzi, A. Bioadhesives for Wood and Fibres: A critical Review. Rev. Adhes. Adhes. 2013, 1, 88–113. [Google Scholar] [CrossRef]
  14. Alonso, M.V.; Oliet, M.; Rodriguez, F.; Garcia, J.; Gilarranz, M.A.; Rodriguez, J.J. Modification of Ammonium Lignosulfonate by Phenolation for Use in Phenolic Resins. Biores. Tech. 2005, 96, 1013–1018. [Google Scholar] [CrossRef]
  15. Santoni, I.; Pizzo, B. Evaluation of Alternative Vegetable Proteins as Wood Adhesives. Ind. Crops Prod. 2013, 45, 148–154. [Google Scholar] [CrossRef]
  16. Fapeng, W.; Jifu, W.; Chunpeng, W.; Fuxiang, C.; Xiaohuan, L.; Jiuyin, P. Fabrication of Soybean Protein-Acrylate Composite Mini-Emulsion toward Wood Adhesive. Eur. J. Wood Wood Prod. 2017, 76, 305–313. [Google Scholar] [CrossRef]
  17. Dukarska, D.; Derkowski, A. Rape Straw-Wood Particleboards Resinated with UF Resin and Supplemented with Nano-SiO2. Ann. Wars. Univ. Life Sci.—SGGW. For. Wood Technol. 2014, 85, 49–52. [Google Scholar]
  18. Pradyawong, S.; Qi, G.; Li, N.; Sun, X.S.; Wang, D. Adhesion Properties of Soy Protein Adhesives Enhanced by Biomass Lignin. Int. J. Adhes. Adhes. 2017, 75, 66–73. [Google Scholar] [CrossRef] [Green Version]
  19. Eom, Y.-G.; Kim, H.-J.; Kim, J.-S.; Kim, S.-M.; Kim, J.-A. Reduction of Formaldehyde Emission from Particleboards by Bio-Scavengers. Makchae Konghak 2006, 34, 29–41. [Google Scholar]
  20. Salem, M.Z.M.; Böhm, M. Understanding of Formaldehyde Emissions from Solid Wood: An Overview. BioResources 2013, 8, 4775–4790. [Google Scholar] [CrossRef]
  21. Ghaffar, S.H.; Fan, M. Lignin in Straw and Its Applications as an Adhesive. Inter. J. Adhes. Adhes. 2014, 48, 92–101. [Google Scholar] [CrossRef]
  22. Neimsuwan, T.; Hengniran, P.; Siramon, P.; Punsuvon, V. Effect of Tannin Addition as a Bio-Scavenger on Formaldehyde Content in Particleboard. J. Trop. For. Res. 2017, 1, 45–56. [Google Scholar]
  23. Xi, X.; Pizzi, A.; Delmotte, L. Isocyanate-Free Polyurethane Coatings and Adhesives from Mono- and Di-Saccharides. Polymers 2018, 10, 402. [Google Scholar] [CrossRef] [Green Version]
  24. Pichelin, F.; Nakatani, M.; Pizzi, A.; Wieland, S.; Despres, A.; Rigolet, S. Structural Beams from Thick Wood Panels Bonded Industrially with Formaldehyde-Free Tannin Adhesives. For. Prod. J. 2006, 56, 31–36. [Google Scholar]
  25. Bertaud, F.; Tapin-Lingua, S.; Pizzi, A.; Navarette, P.; Petit-Conil, M. Development of Green Adhesives for Fiberboard Manufacturing, Using Tannins and Lignin from Pulp Mill Residues. Cell. Chem. Technol. 2012, 46, 449–455. [Google Scholar]
  26. Mansouri, H.R.; Navarrete, P.; Pizzi, A.; Tapin-Lingua, S.; Benjelloun-Mlayah, B.; Pasch, H.; Rigolet, S. Synthetic-Resin-Free Wood Panel Adhesives from Mixed Low Molecular Mass Lignin and Tannin. Eur. J. Wood Wood Prod. 2011, 69, 221–229. [Google Scholar] [CrossRef] [Green Version]
  27. Ismita, N.; Ranjan, M.; Semwal, P.; Prakash, A. Reduction in Formaldehyde Emission Liberation from Urea Formaldehyde Due to Closite Na+ Addition. Inter. J. Chem. Stud. 2018, 6, 3502–3504. [Google Scholar]
  28. Roumeli, E.; Papadopoulou, E.; Pavlidou, E.; Vourlias, G.; Bikiaris, D.; Paraskevopoulos, K.; Chrissafis, K. Synthesis, Characterization and Thermal Analysis of Urea-Formaldehyde/Nano SiO2 Resins. Thermochim. Acta 2012, 527, 33–39. [Google Scholar] [CrossRef]
  29. Hemmila, V.; Adamopoulos, S.; Hosseinpourpia, R.; Ahmed, S.I. Ammonium Lignosulfonate Adhesives for Particleboards with pMDI and Furfuryl Alcohol as Crosslinkers. Polymers 2019, 11, 1633. [Google Scholar] [CrossRef] [PubMed] [Green Version]
  30. Núñez-Decap, M.; Ballerini-Arroyo, A.; Alarćon-Enos, J. Sustainable Particleboards with Low Formaldehyde Emissions Based on Yeast Protein Extract Adhesives Rhodotorula rubra. Eur. J. Wood Wood Prod. 2018, 76, 1279–1286. [Google Scholar] [CrossRef]
  31. Younessi-Kordkheili, H.; Pizzi, A. Improving the Physical and Mechanical Properties of Particleboards Made from Urea-Glyoxal Resin by Addition of pMDI. Eur. J. Wood Wood Prod. 2018, 76, 871–876. [Google Scholar] [CrossRef]
  32. Boran, S.; Usta, M.; Ondaral, S.; Gümüşkaya, E. The Efficiency of Tannin as a Formaldehyde Scavenger Chemical in Medium Density Fiberboard. Compos. Part B 2012, 43, 2487–2491. [Google Scholar] [CrossRef]
  33. Antov, P.; Mantanis, G.I.; Savov, V. Development of Wood Composites from Recycled Fibres Bonded with Magnesium Lignosulfonate. Forests 2020, 11, 613. [Google Scholar] [CrossRef]
  34. Younesi-Kordkheili, H.; Pizzi, A.; Niyatzade, G. Reduction of Formaldehyde Emission from Particleboard by Phenolated Kraft Lignin. J. Adhes. 2015, 92, 485–497. [Google Scholar] [CrossRef]
  35. Zhou, X.; Zheng, F.; Lv, C.; Tang, L.; Wei, K.; Liu, X. Properties of Formaldehyde-Free Environmentally Friendly Lignocellulosic Composites Made from Poplar Fibres and Oxygen-Plasma-Treated Enzymatic Hydrolysis Lignin. Compos. Part B Eng. 2013, 53, 369–375. [Google Scholar] [CrossRef]
  36. Hu, L.; Pan, H.; Zhou, Y.; Zhang, M. Methods to Improve Lignin’s Reactivity as a Phenol Substitute and as a Replacement for Other Phenolic Compounds: A Brief Review. BioResource 2011, 6, 3515–3525. [Google Scholar] [CrossRef]
  37. Malutan, T.; Nicu, R.; Popa, V.I. Contribution to the Study of Hydroxymetylation Reaction of Alkali Lignin. BioResource 2008, 3, 13–20. [Google Scholar]
  38. Aro, T.; Fatehi, P. Production and Application of Lignosulfonates and Sulfonated Lignin. Chem. Sus. Chem. 2017, 10, 1861–1877. [Google Scholar] [CrossRef]
  39. Klapiszewski, L.; Jamrozik, A.; Strzemiecka, B.; Matykiewicz, D.; Voelkel, A.; Jesionowski, T. Activation of Magnesium Lignosulfonate and Kraft Lignin: Influence on the Properties of Phenolic Resin-Based Composites for Potential Applications in Abrasive Materials. Int. J. Mol. Sci. 2017, 18, 1224. [Google Scholar] [CrossRef] [PubMed] [Green Version]
  40. Fernandes, M.R.C.; Huang, X.; Abbenhuis, H.C.I.; Hensen, E.J.M. Lignin Oxidation with an Organic Peroxide and Subsequent Aromatic Ring Opening. Int. J. Biol. Macromol. 2019, 123, 1044–1051. [Google Scholar] [CrossRef] [PubMed]
  41. Junghans, U.; Bernhardt, J.J.; Wollnik, R.; Triebert, D.; Unkelbach, G.; Pufky-Heinrich, D. Valorization of Lignin via Oxidative Depolymerization with Hydrogen Peroxide: Towards Carboxyl-Rich Oligomeric Lignin Fragments. Molecules 2020, 25, 2717. [Google Scholar] [CrossRef] [PubMed]
  42. Geng, X.; Li, K. Investigation of Wood Adhesives from Kraft Lignin and Polyethylenimine. J. Adhes. Sci. Technol. 2006, 20, 847–858. [Google Scholar] [CrossRef]
  43. Khan, M.A.; Ashraf, S.M. Development and Characterization of Groundnut Shell Lignin Modified Phenol Formaldehyde Wood Adhesive. Indian J. Chem. Technol. 2006, 13, 347–352. [Google Scholar]
  44. Da Silva, M.A.; Dos Santos, P.V.; Silva, G.C.; Costa Lelis, R.C.; Do Nascimento, A.M.; Brito, E.O. Using Lignosulfonate and Phenol-Formaldehyde Adhesive in Particleboard Manufacturing. Sci. For. 2017, 45, 423–433. [Google Scholar]
  45. Cetin, N.; Özmen, N. Use of Organosolv Lignin in Phenol-Formaldehyde Resins for Particleboard Production II. Par-Ticleboard Production and Properties. Int. J. Adhes. Adhes. 2002, 22, 481–486. [Google Scholar] [CrossRef]
  46. Cetin, S.; Özmen, N. Studies on Lignin-Based Adhesives for Particleboard Panels. Turk. J. Agric. For. 2003, 27, 183–189. [Google Scholar]
  47. Duan, H.; Qiu, T.; Guo, L.; Ye, J.; Li, X. The Microcapsule-Type Formaldehyde Scavenger: The Preparation and the Application in Urea-Formaldehyde Adhesives. J. Hazard. Mater. 2015, 293, 46–53. [Google Scholar] [CrossRef]
  48. Mansouri, N.-E.; Pizzi, A.; Salvado, J. Lignin-Based Polycondensation Resins for Wood Adhesives. J. Appl. Polym. Sci. 2007, 103, 1690–1699. [Google Scholar] [CrossRef]
  49. Ghorbani, M.; Liebner, F.; van Herwijnen, H.W.G.; Pfungen, L.; Krahofer, M.; Budjav, E.; Konnerth, J. Lignin Phenol Formaldehyde Resoles: The Impact of Lignin Type on Adhesive Properties. BioResource 2016, 11, 6727–6741. [Google Scholar] [CrossRef] [Green Version]
  50. Ibrahim, M.N.M.; Zakaria, N.; Sipaut, C.S.; Sulaiman, O. Chemical and Thermal Properties of Lignins from Oil Palm Biomass as a Substitute for Phenol in a Phenol Formaldehyde Resin Production. Carbohydr. Polym. 2011, 86, 112–119. [Google Scholar] [CrossRef] [Green Version]
  51. Kim, S.; Kim, H.-J.; Kim, H.-S.; Lee, H.H. Effect of Bio-Scavengers on the Curing Behavior and Bonding Properties of Melamineformal-Dehyde Resins. Macromol. Mater. Eng. 2006, 291, 1027–1034. [Google Scholar] [CrossRef]
  52. Mancera, C.; Ferrando, F.; Salvado, J.; El Mansouri, N.E. Kraft Lignin Behaviour during Reaction in Alkaline Medium. Biomass Bioenergy 2011, 35, 2072–2079. [Google Scholar] [CrossRef]
  53. Ramesh, M.; Rajeshkumar, L.; Sasikala, G.; Balaji, D.; Saravanakumar, A.; Bhuvaneswari, V.; Bhoopathi, R.A. Critical Review on Wood-Based Polymer Composites: Processing, Properties, and Prospects. Polymers 2022, 14, 589. [Google Scholar] [CrossRef]
  54. Antov, P.; Savov, V.; Krišt’ák, L’.; Réh, R.; Mantanis, G.I. Eco-Friendly, High-Density Fiberboards Bonded with Urea-Formaldehyde and Ammonium Lignosulfonate. Polymers 2021, 13, 220. [Google Scholar] [CrossRef]
  55. Procházka, P.; Honig, V.; Bouček, J.; Hájková, K.; Trakal, L.; Soukupová, J.; Roubík, H. Availability and Applicability of Wood and Crop Residues for the Production of Wood Composites. Forests 2021, 12, 641. [Google Scholar] [CrossRef]
  56. Ramesh, M.; Rajesh Kumar, L. Green Adhesives: Preparation, Properties and Applications. In Bioadhesives, 1st ed.; Inamuddin, R.B., Mohd, I.A., Abdullah, M.A., Eds.; Elsevier: Toronto, ON, Canada, 2020. [Google Scholar] [CrossRef]
  57. EN 312; Particleboards. Specifications. European Committee for Standardization: Brussels, Belgium, 2003.
  58. ISO 12460-3:2015; Wood-Based Panels—Determination of Formaldehyde Release—Part 3: Gas Analysis Method. International Organization for Standardization: Geneva, Switzerland, 2015.
  59. EN 310; Wood-Based Panels. Determination of Modulus of Elasticity in Bending and of Bending Strength. European Committee for Standardization: Brussels, Belgium, 1993.
  60. EN 319; Particleboards and Fibreboards. Determination of Tensile Strength Perpendicular to the Plane of the Board. European Committee for Standardization: Brussels, Belgium, 1993.
  61. EN 323:1993; Wood-Based Panels—Determination of Density. European Committee for Standardization: Brussels, Belgium, 1993.
  62. EN 322:1993; Wood-Based Panels—Determination of Moisture Content. European Committee for Standardization: Brussels, Belgium, 1993.
  63. Suo, S.; Bowyer, J. Simulation Modeling of Particleboard Density Profile. Wood Fiber Sci. 1994, 26, 397–411. [Google Scholar]
  64. Gamage, N.; Setunge, S. Modelling of Vertical Density Profile of Particleboard, Manufactured from Hardwood Sawmill Residue. Wood Mater. Sci. Eng. 2014, 9, 157–167. [Google Scholar] [CrossRef]
  65. Bekhta, P.; Noshchenko, G.; Réh, R.; Kristak, L.; Sedliacik, J.; Antov, P.; Mirski, R.; Savov, V. Properties of Eco-Friendly Particleboards Bonded with Lignosulfonate-Urea-Formaldehyde Adhesives and pMDI as a Crosslinker. Materials 2021, 14, 4875. [Google Scholar] [CrossRef]
  66. Hu, J.-P.; Guo, M.-H. Influence of Ammonium Lignosulfonate on the Mechanical and Dimensional Properties of Wood Fiber Biocomposites Reinforced with Polylactic Acid. Ind. Crop. Prod. 2015, 78, 48–57. [Google Scholar] [CrossRef]
  67. Costa, S.; Costa, C.; Madureira, J.; Valdiglesias, V.; Teixeira-Gomes, A.; de Pinho, P.G.; Laffon, B.; Teixeira, J.P. Occupational Exposure to Formaldehyde and Early Biomarkers of Cancer Risk,1 Immunotoxicity and Susceptibility. Environ. Res. 2019, 179, 108740. [Google Scholar] [CrossRef] [PubMed]
Figure 1. Correlation between maximum of coarse chip dimensions and the sieve dimensions.
Forests 13 00737 g001
Figure 2. Granulometry of particles: (a) for coarse particles; (b) for fine particles.
Forests 13 00737 g002
Figure 3. Particleboard density profiles: (a) for Recipe 1; (b) for Recipe 2; (c) for Recipe 3.
Forests 13 00737 g003aForests 13 00737 g003b
Figure 4. Internal bond of all three experimental particleboards.
Forests 13 00737 g004
Figure 5. Moduli of elasticity for all three types of experimental particleboards.
Forests 13 00737 g005
Figure 6. Modulus of Resistance (MOR) for all experimental particleboards.
Forests 13 00737 g006
Figure 7. Formaldehyde emission for the three types of experimental particleboards.
Forests 13 00737 g007
Figure 8. Empirical CDF for density of experimental particleboard.
Forests 13 00737 g008
Figure 9. Empirical CDF of modulus of resistance (MOR) for the three types of chipboards.
Forests 13 00737 g009
Figure 10. Scheme of research activities.
Forests 13 00737 g010
Figure 11. Images with 30× magnification taken on core of panel: (a) without crosslinker (Recipe 1); (b) with pDMI (Recipe 2); (c) with pMDI and glucose (Recipe 3).
Forests 13 00737 g011aForests 13 00737 g011b
Table 1. Permissible limits of formaldehyde emission for particleboards.
MethodsStandardPermissible LimitsEmission Class
Chamber methodEN 717-1: 2004≤0.1 ppm or ≤0.12 mg/m3
>0.1 ppm
E1
E2
Large chamber methodASTM E 1333:20140.14 ppm
0.18 ppm
0.09 ppm
E1
F ***
F ****
Perforator methodEN 120: 1992≤8 mg/100 g
8–30 mg/100 g
E1
E2
Gas analysis methodEN 717-2: 19953.5 mg/m2h
1.4 mg/m2h
E1
E0
Desiccator methodJIS A 1460:20011.5 mg/L
0.5 mg/L
0.3 mg/L
F **
F ***
F ****
Table 2. Characteristics of magnesium lignosulphonate.
No.CharacteristicsValues
1Dry mater content93 ± 2%
2Magnesium content, minimum6 ± 1%
3pH5.5 ± 1
4Bulk density400 kg/m3
5Ignition temperature530 °C
6Water insolubility, maximum1%
7Moisture content, maximum7%
Table 3. Composition of experimental panels.
SpecificationsRecipe 1Recipe 2Recipe 3
Particles, 7% Mc1838 g1838 g1838 g
Magnesium lignosulphonate460 g275 g275 g
Hydrogen peroxide, 30%35 g21 g22 g
Distilled water246 g147 g145 g
Sodium hydroxide, 50%66 mL39 mL38 mL
pMDI-55 g54 g
Glucose--41 g
Dry matter content60.1%59.9%55.7%
Table 4. Analysis of Variance (ANOVA) for particleboard densities.
SourceDFAdj. SSAdj. MSF-Valuep-Value
Recipe 11097.8316.310.850.0582
Error195.8319.17
Total11193.67
Publisher’s Note: MDPI stays neutral with regard to jurisdictional claims in published maps and institutional affiliations.

