
Analysis of Ciliate Community Diversity in Decaying Pinus nigra Logs

 ,
,  and
and
Abstract
:1. Introduction
2. Materials and Methods
2.1. Study Area
2.2. Experimental Design and Deadwood Sampling
2.3. DNA Extraction and Molecular Analysis
2.3.1. PCR-DGGE
2.3.2. Sequence Analysis
2.3.3. Real-Time PCR
2.4. Physical and Chemical Properties
2.5. Statistical Analyses
2.6. Nucleotide Sequence Accession Number
3. Results
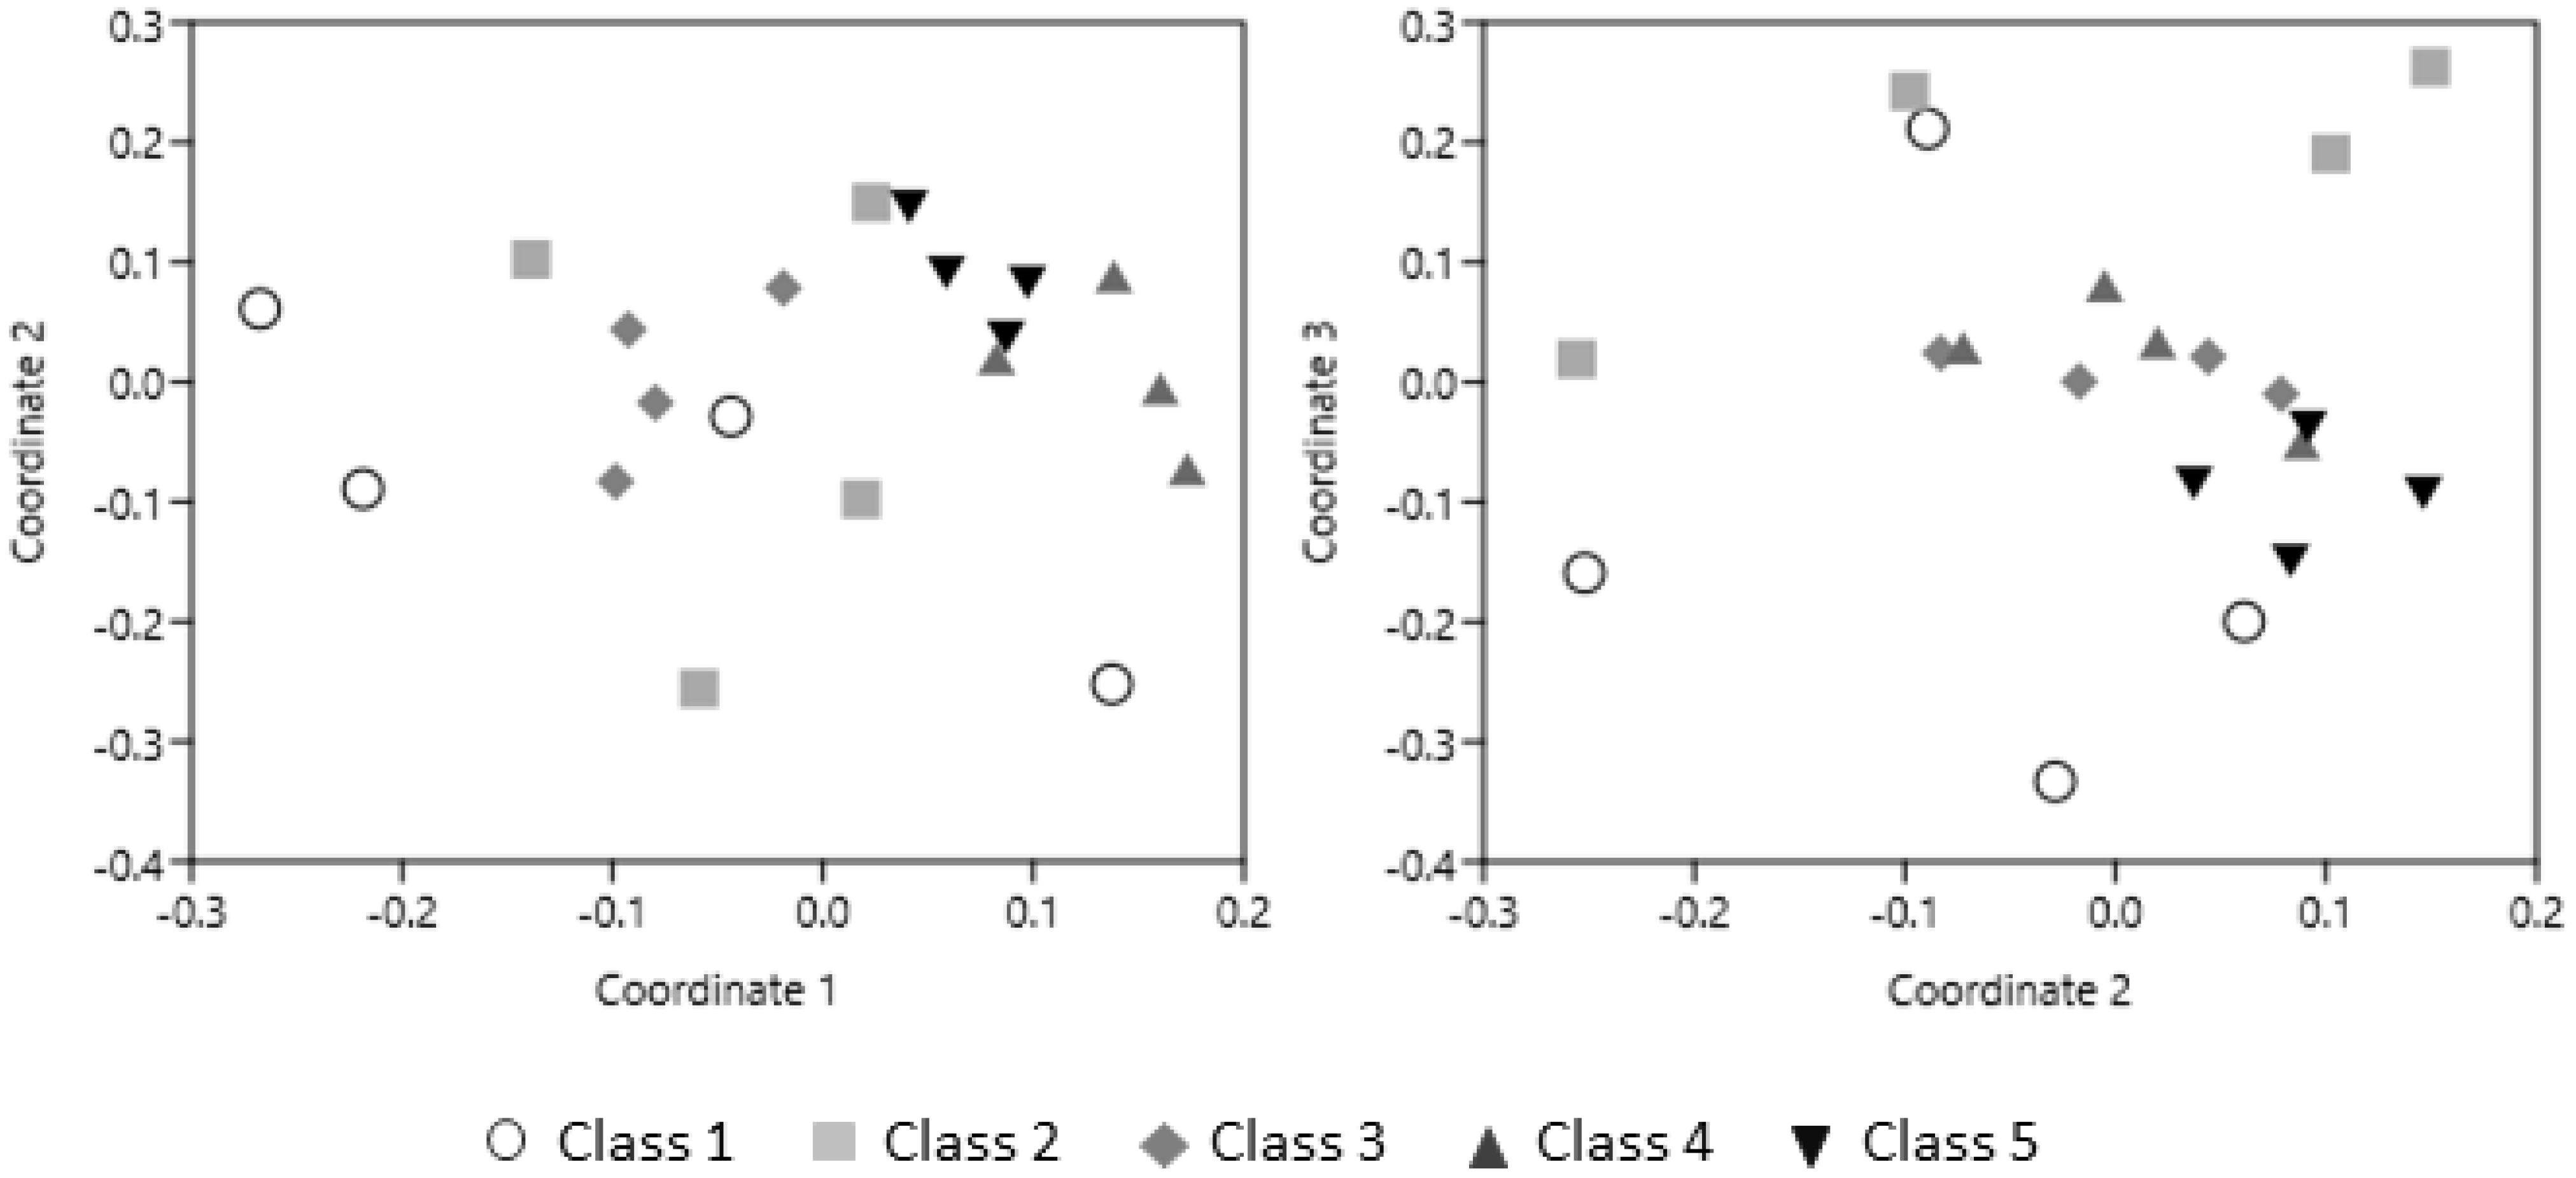
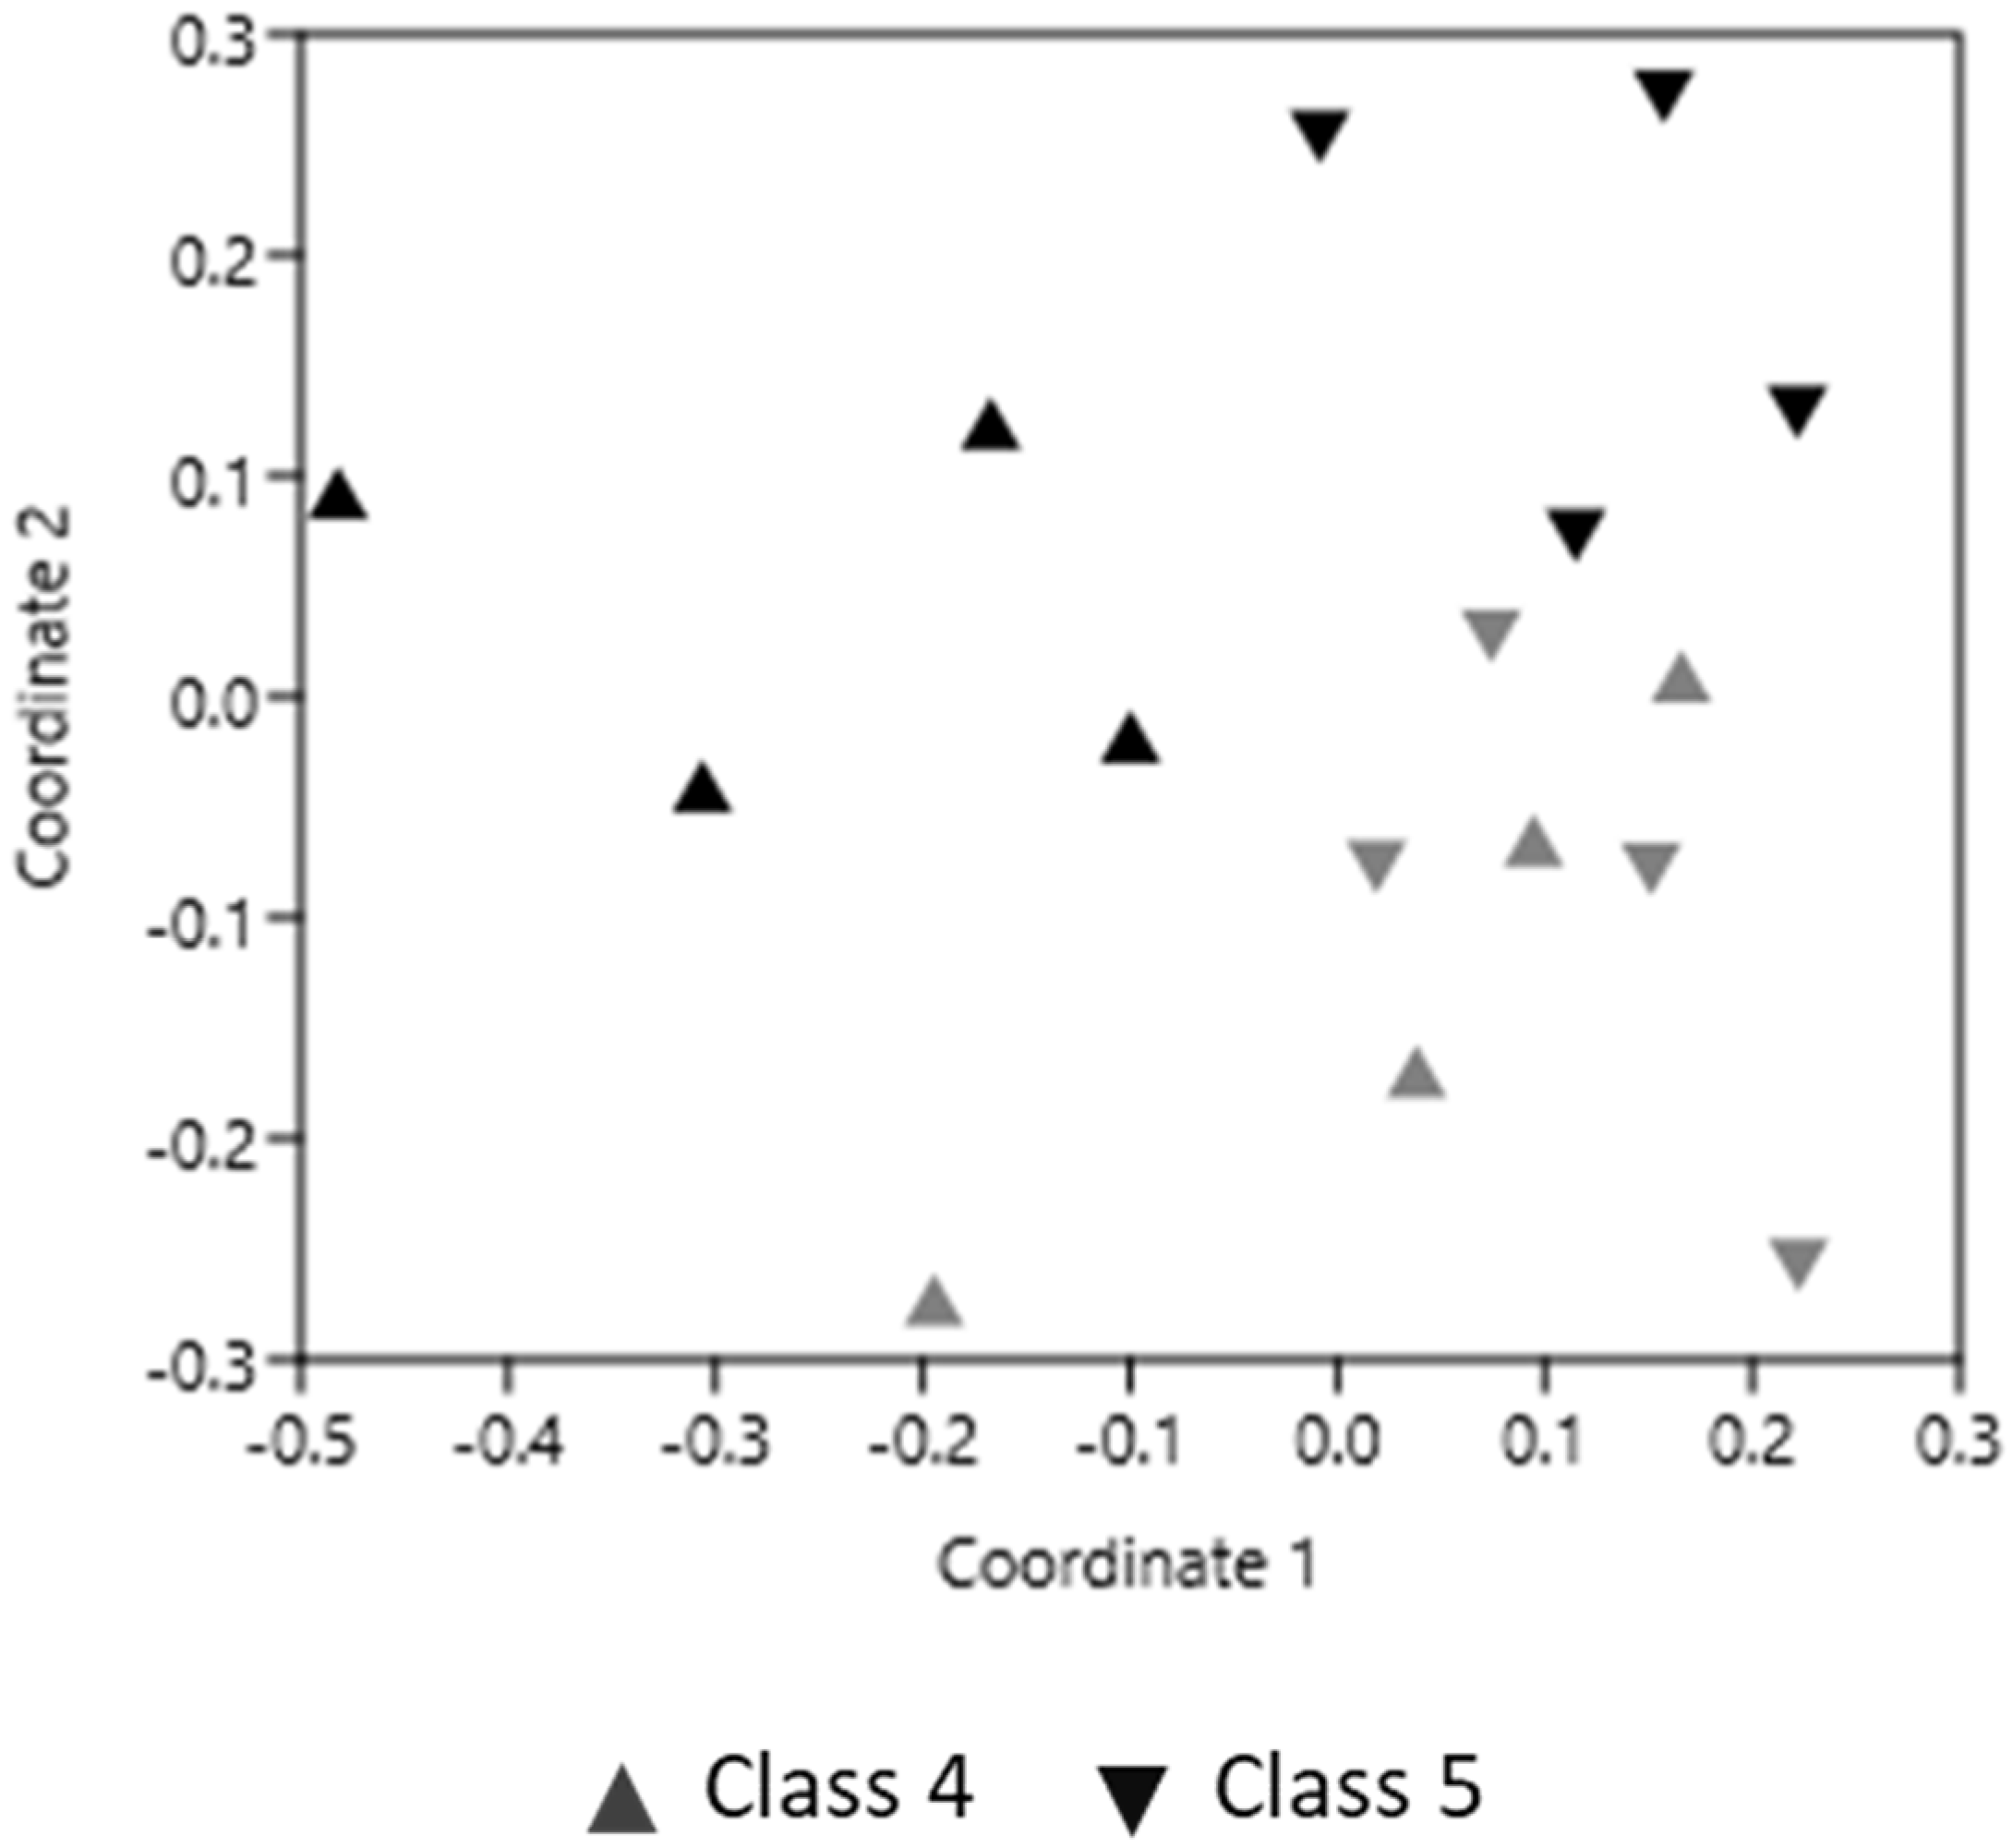
3.1. PCR-DGGE Analysis
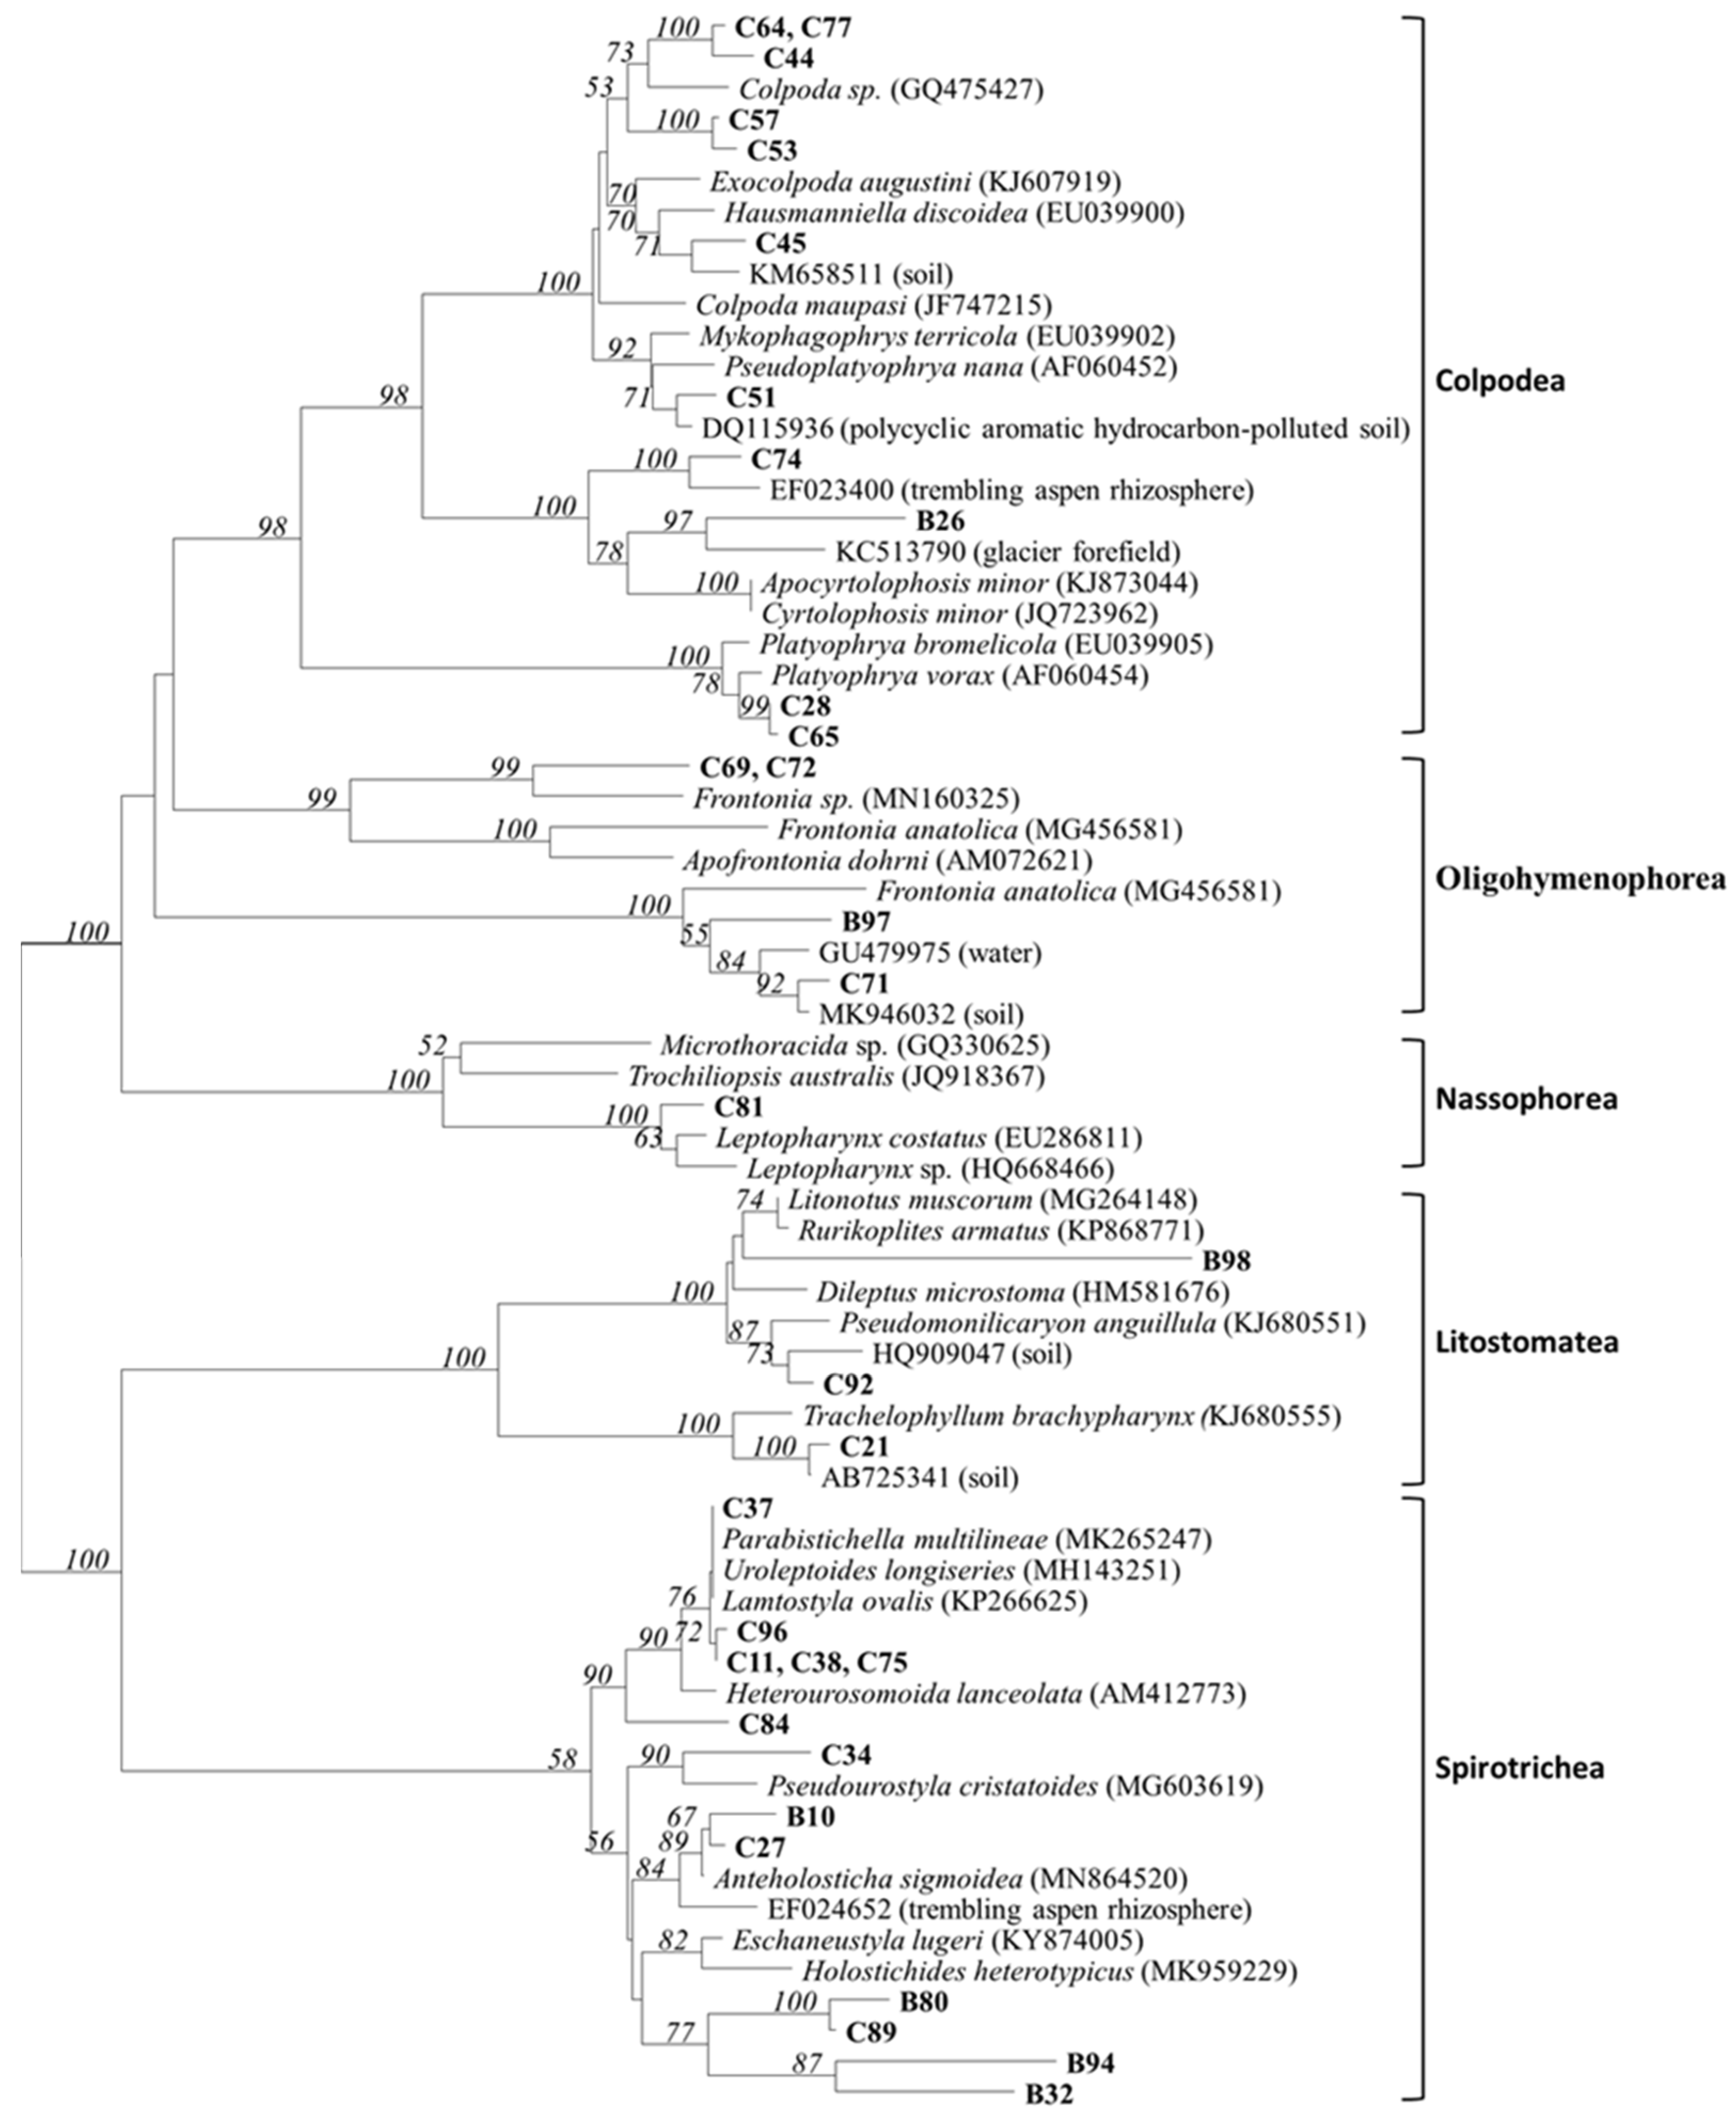
3.2. Sequence Analysis
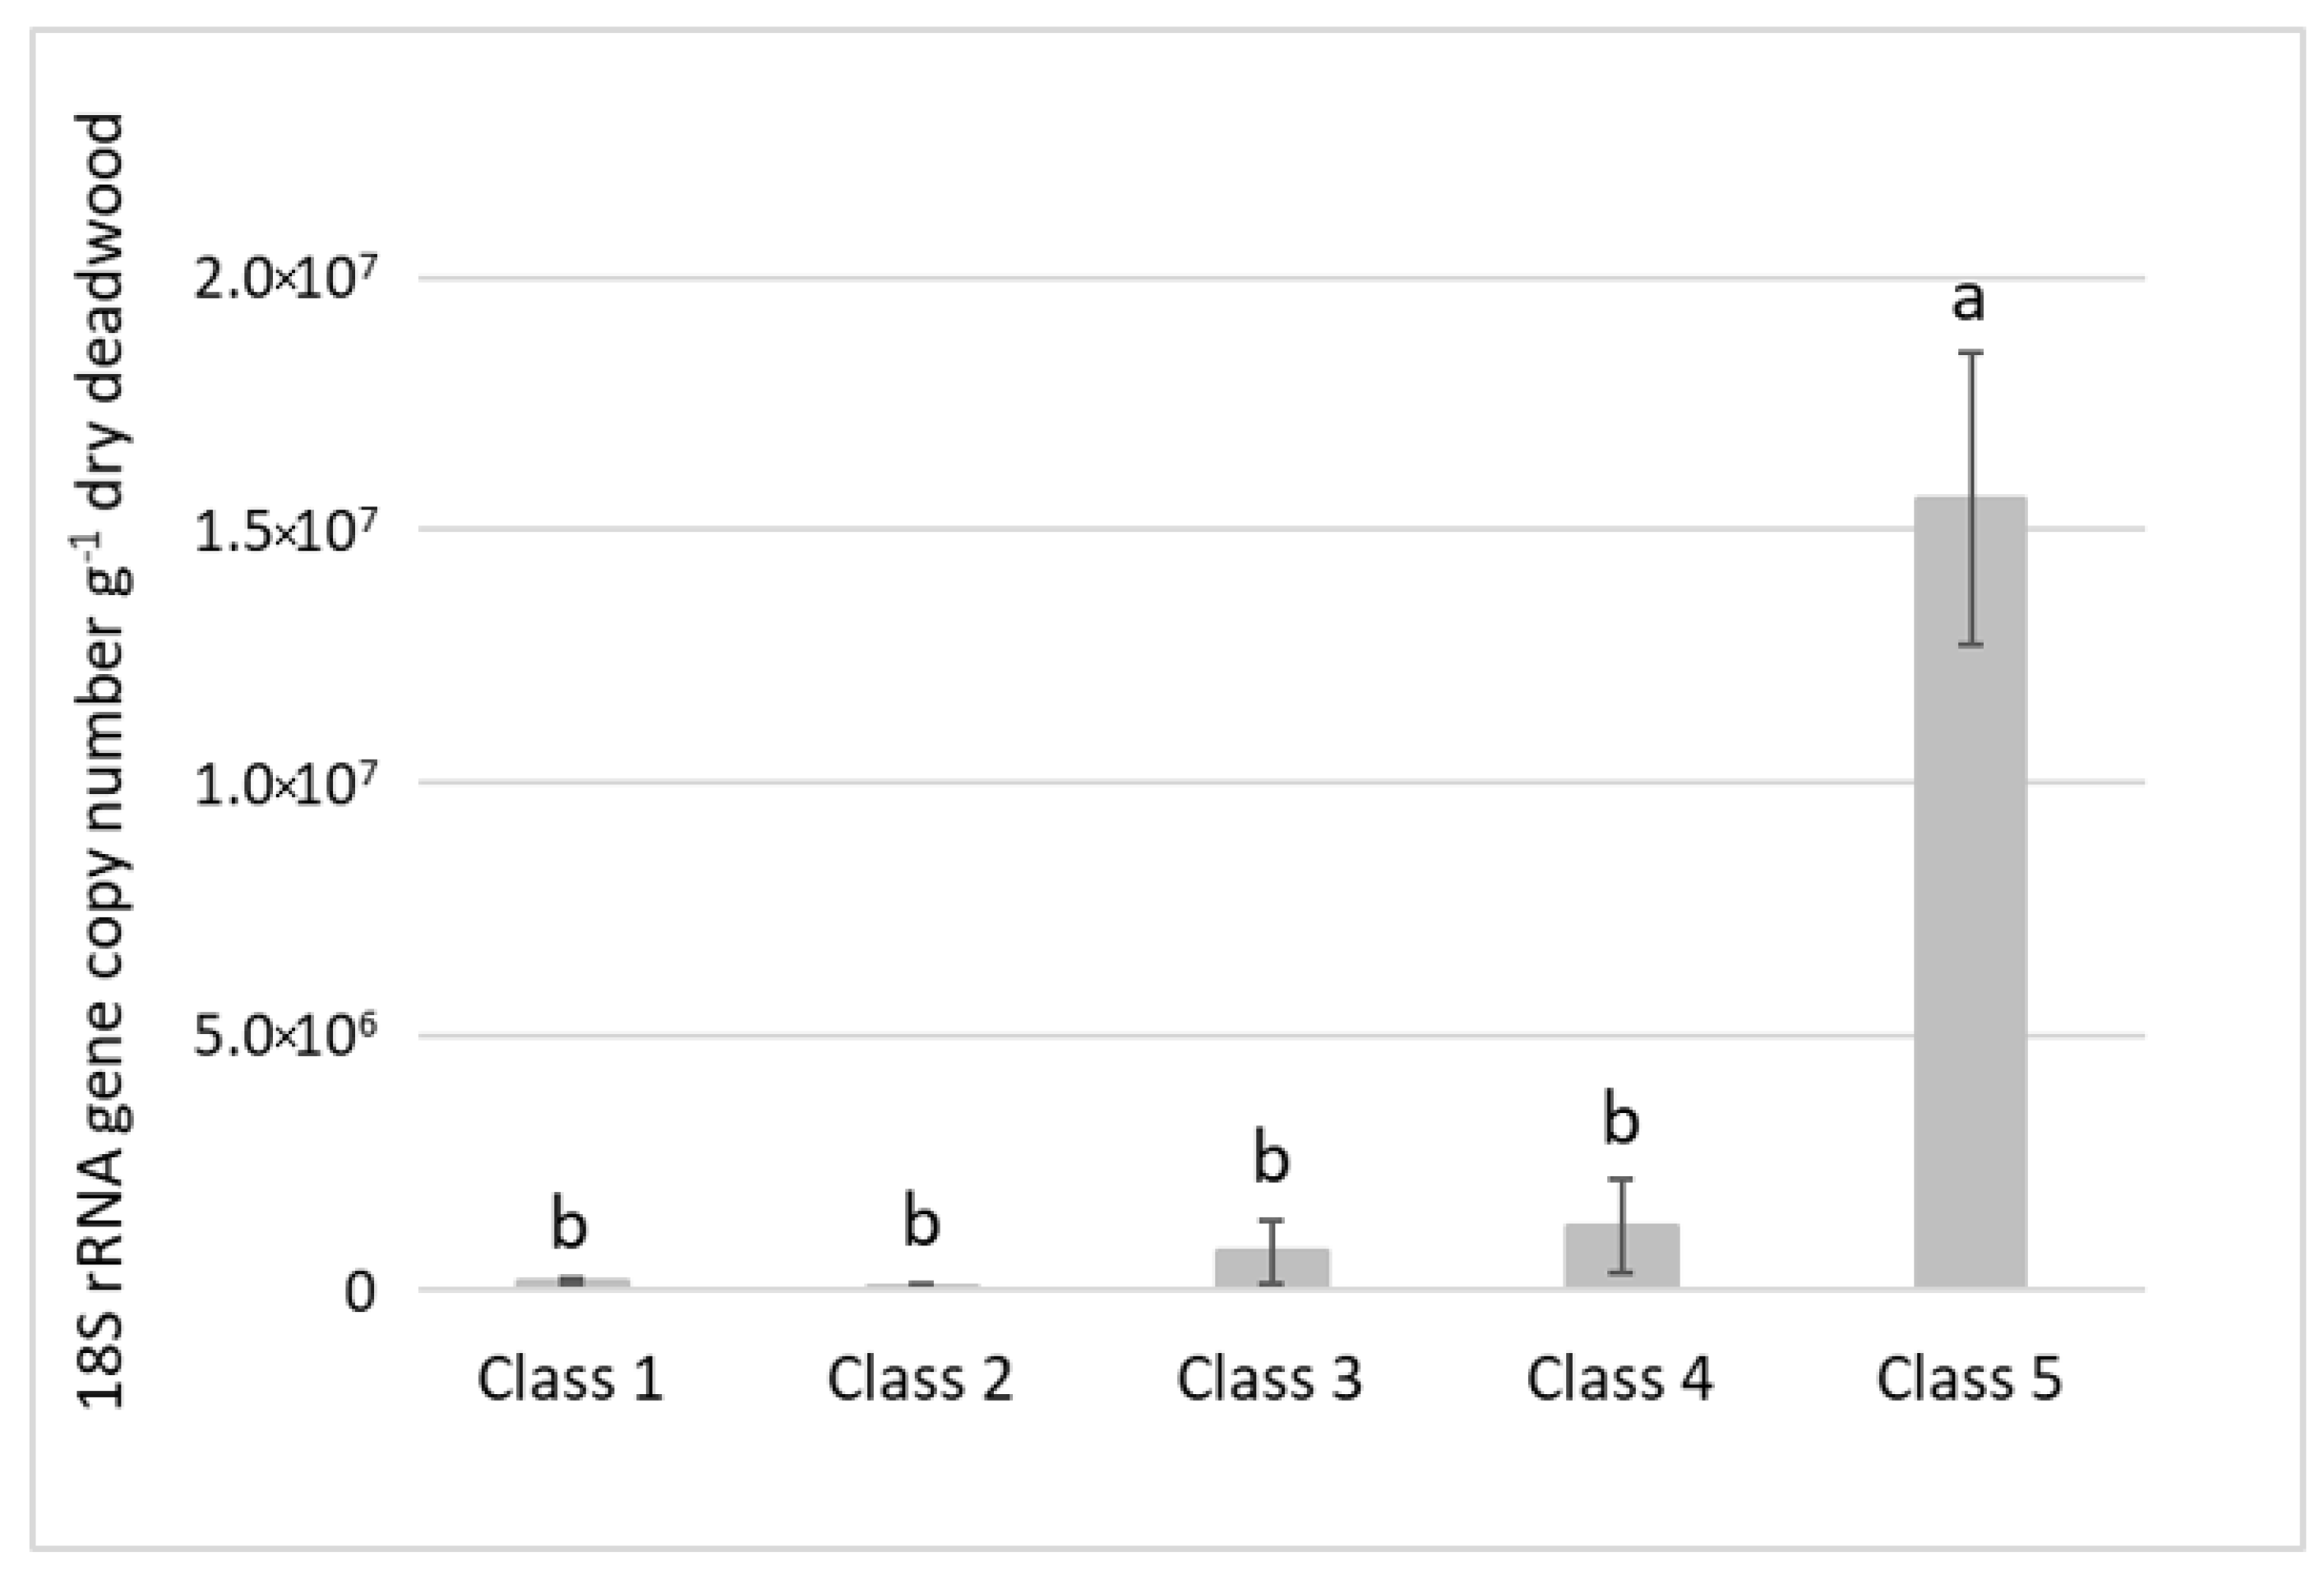
3.3. Quantification of Deadwood Ciliate Community
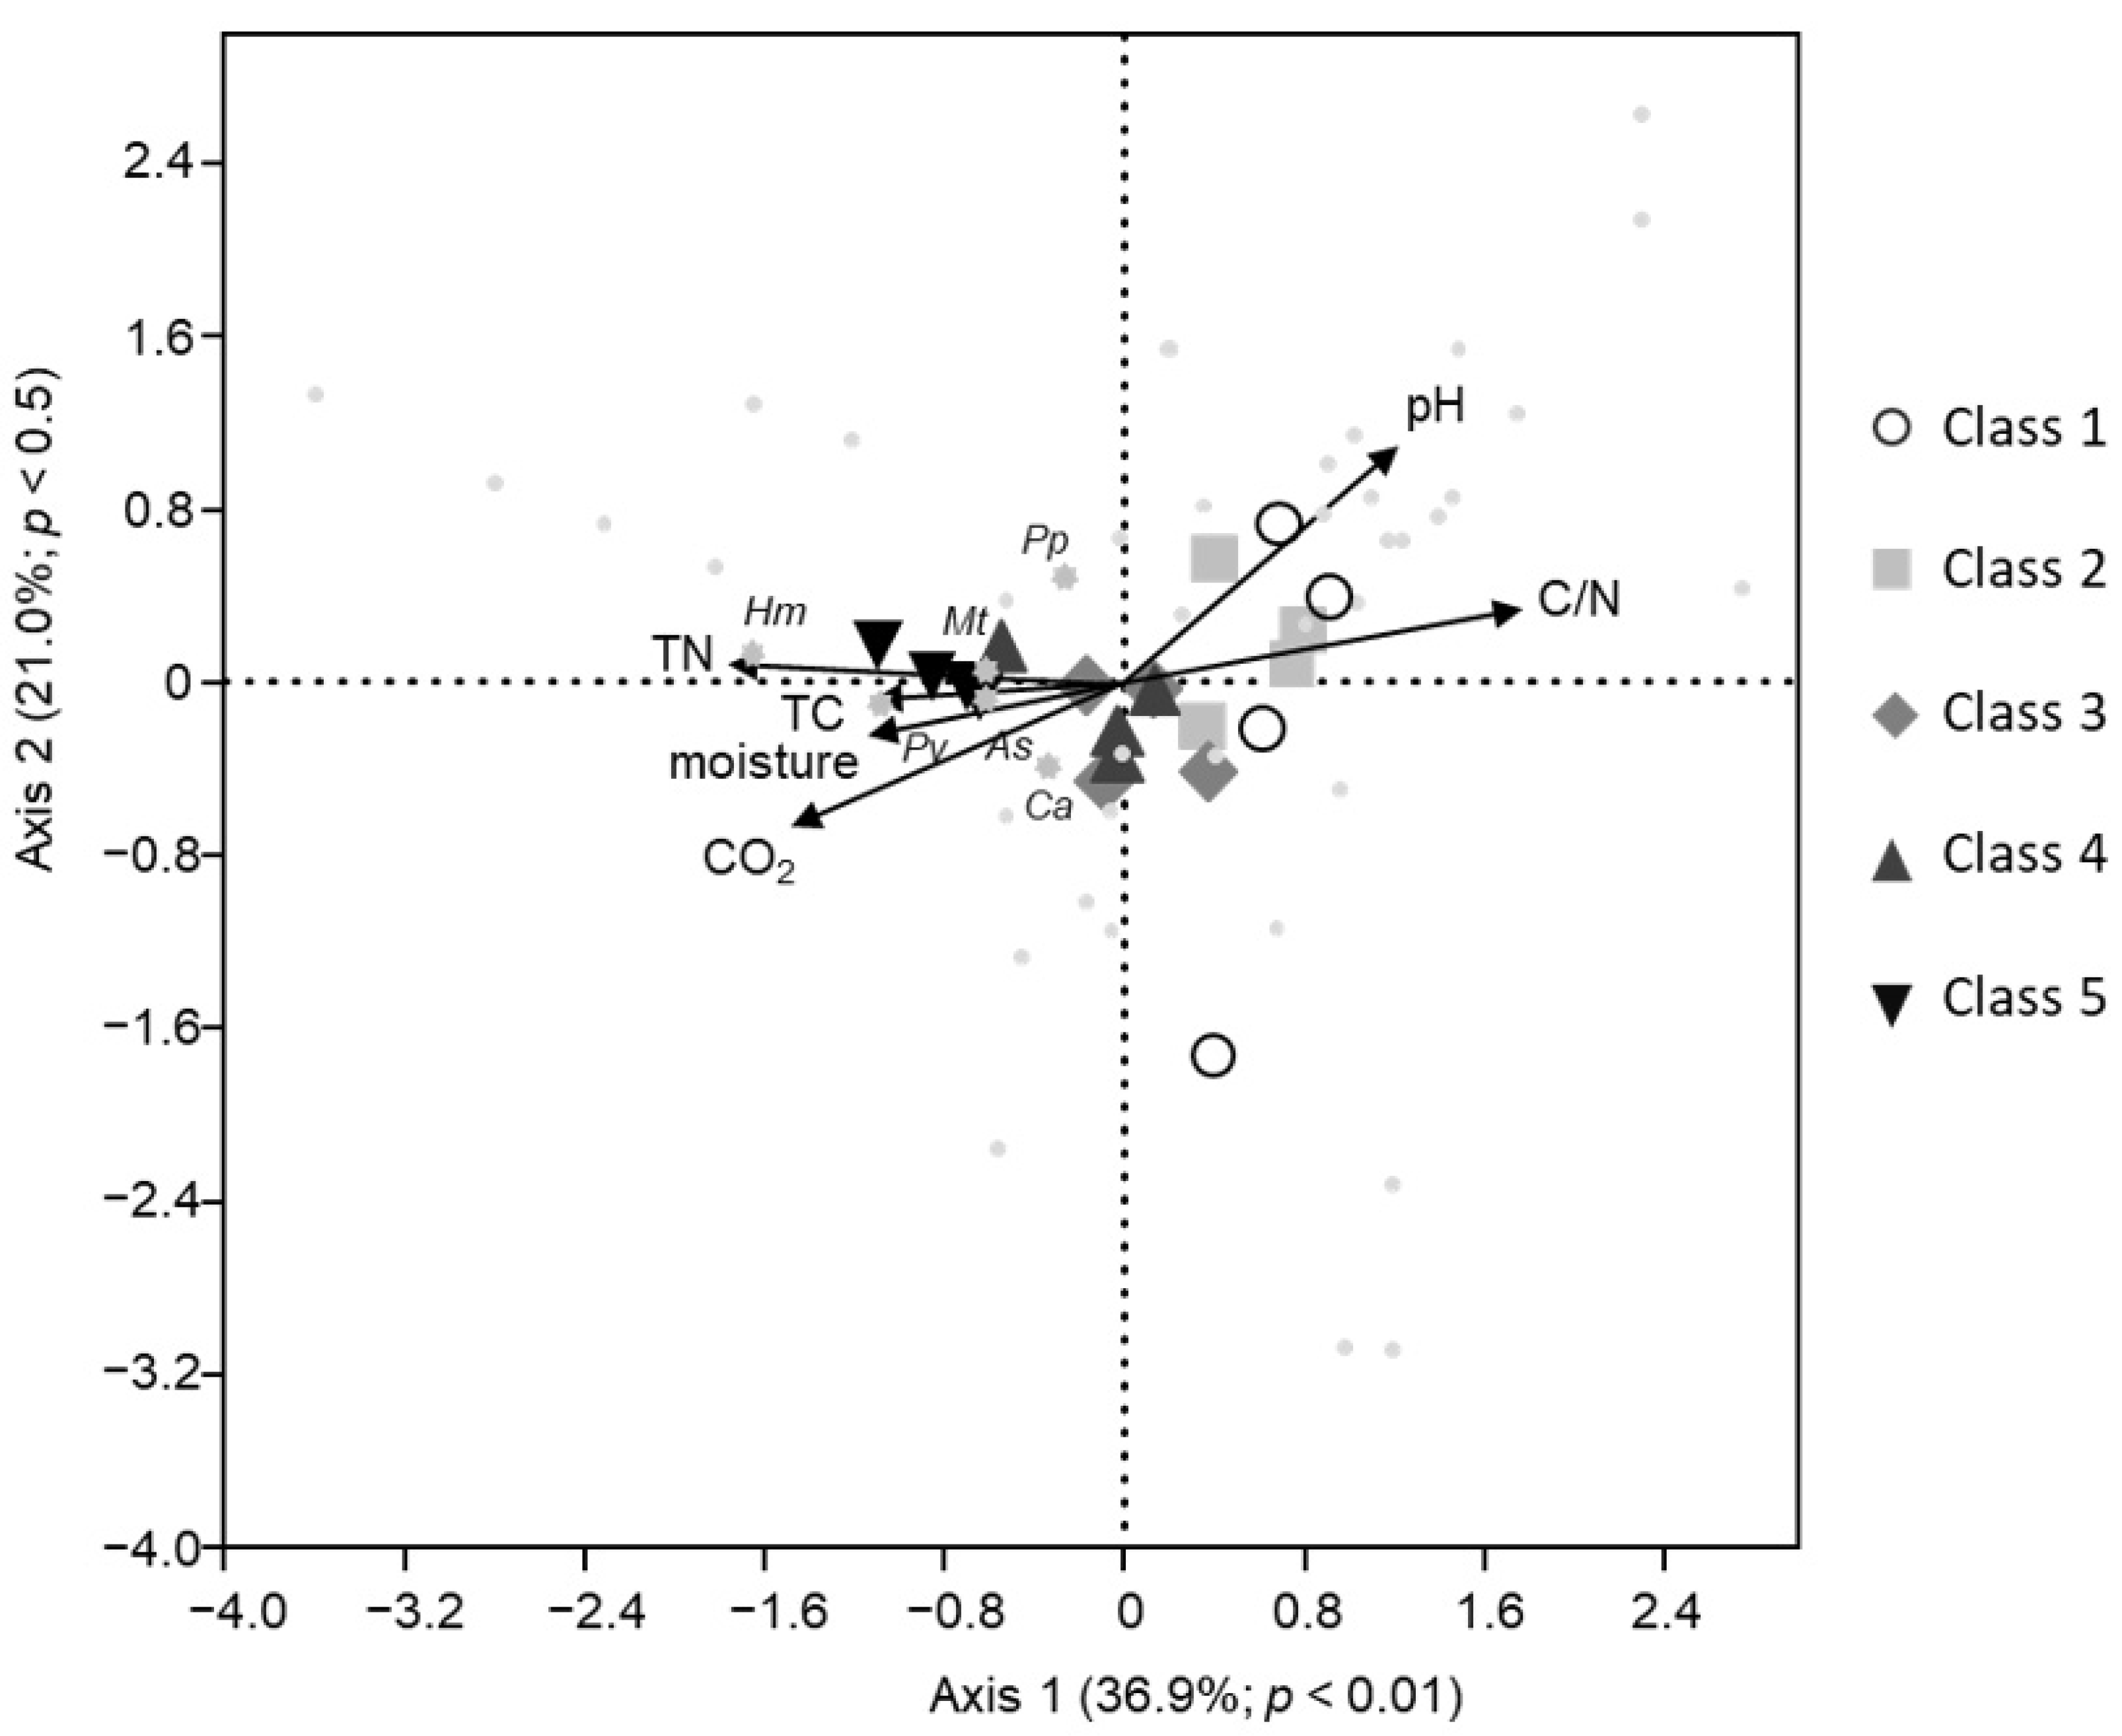
3.4. Correlation Analysis
4. Discussion
Supplementary Materials
Author Contributions
Funding
Institutional Review Board Statement
Informed Consent Statement
Data Availability Statement
Acknowledgments
Conflicts of Interest
References
- Fichtner, A.; Härdtle, W. Forest Ecosystems: A Functional and Biodiversity Perspective. In Perspectives for Biodiversity and Ecosystems. Environmental Challenges and Solutions; Hobohm, C., Ed.; Springer: Cham, Switzerland, 2021; Volume 16, pp. 383–405. [Google Scholar]
- Foissner, W.; Berger, H.; Xu, K.; Zechmeister-Boltenstern, S. A huge, undescribed soil ciliate (Protozoa: Ciliophora) diversity in natural forest stands of Central Europe. Biodivers. Conserv. 2005, 14, 617–701. [Google Scholar] [CrossRef]
- Paletto, A.; Ferretti, F.; De Meo, I.; Cantiani, P.; Focacci, M. Ecological and environmental role of deadwood in managed and unmanaged forests. In Sustainable Forest Management; Diez, J.J., Ed.; InTech Open Access Publisher: London, UK, 2012; pp. 219–238. [Google Scholar]
- Müller, J.; Bütler, R. A review of habitat thresholds for dead wood: A baseline for management recommendations in European forests. Eur. J. For. Res. 2010, 129, 981–992. [Google Scholar] [CrossRef]
- Müller-Using, S.; Bartsch, N. Decay dynamic of coarse and fine woody debris of a beech (Fagus sylvatica L.) forest in Central Germany. Eur. J. For. Res. 2009, 128, 287–296. [Google Scholar] [CrossRef] [Green Version]
- Jia, T.; Liang, X.; Guo, T.; Chai, B. Impact of nutrients on protozoa community diversity and structure in litter of two natural grass species in a copper tailings dam, China. Microorganisms 2021, 9, 2250. [Google Scholar] [CrossRef]
- Domonell, A.; Brabender, M.; Nitsche, F.; Bonkowski, M.; Arndt, H. Community structure of cultivable protists in different grassland and forest soils of Thuringia. Pedobiologia 2013, 56, 1–7. [Google Scholar] [CrossRef]
- Foissner, W. Soil protozoa: Fundamental problems ecological significance, adaptations in ciliates and testaceans, bioindicators, and guide to the literature. Prog. Protistol. 1987, 2, 69–212. [Google Scholar]
- Adl, M.S.; Gupta, V.S. Protists in soil ecology and forest nutrient cycling. Can. J. For. Res. 2006, 36, 1805–1817. [Google Scholar] [CrossRef]
- Bartošová, P.; Tirjaková, E. Diversity and ecology of ciliates (Alveolata: Ciliophora) living in the bark and decaying wood mass in Slovakia. Acta Protozool. 2008, 47, 173–187. [Google Scholar]
- Foissner, W. Notes on the soil ciliate biota (Protozoa, Ciliophora) from the Shimba Hills in Kenya (Africa): Diversity and description of three new genera and ten new species. Biodivers. Conserv. 1999, 8, 319–389. [Google Scholar] [CrossRef]
- Bonkowski, M. Protozoa and plant growth: The microbial loop in soil revisited. New Phytol. 2004, 162, 617–631. [Google Scholar] [CrossRef]
- Chandarana, K.A.; Amaresan, N. Soil protists: An untapped microbial resource of agriculture and environmental importance. Pedosphere 2022, 32, 184–197. [Google Scholar] [CrossRef]
- Verni, F.; Rosati, G. Resting cysts: A survival strategy in Protozoa Ciliophora. Ital. J. Zool. 2011, 78, 134–145. [Google Scholar] [CrossRef]
- Adl, S.M.; Coleman, D.C. Dynamics of soil protozoa using a direct count method. Biol. Fertil. Soils 2005, 42, 168–171. [Google Scholar] [CrossRef]
- Bamforth, S.S. Proportions of active ciliate taxa in soils. Biol. Fert. Soils 2001, 33, 197–203. [Google Scholar] [CrossRef]
- Foissner, W. Protist diversity and distribution: Some basic considerations. Biodivers. Conserv. 2008, 17, 235–242. [Google Scholar] [CrossRef]
- Jousset, A.; Lara, E.; Nikolausz, M.; Harms, H.; Chatzinotas, A. Application of the denaturing gradient gel electrophoresis (DGGE) technique as an efficient diagnostic tool for ciliate communities in soil. Sci. Total Environ. 2010, 408, 1221–1225. [Google Scholar] [CrossRef] [PubMed] [Green Version]
- Muyzer, G.; de Waal, E.C.; Uitterlinden, A. profiling of complex microbial populations using denaturing gradient gel electrophoresis analysis of polymerase chain reaction-amplified genes coding for 16S rRNA. App. Environ. Microbiol. 1993, 59, 695–700. [Google Scholar] [CrossRef] [Green Version]
- Pastorelli, R.; Paletto, A.; Agnelli, A.E.; Lagomarsino, A.; De Meo, I. Microbial diversity and ecosystem functioning in deadwood of black pine of a temperate forest. Forests 2021, 12, 1418. [Google Scholar] [CrossRef]
- Pastorelli, R.; Agnelli, A.E.; De Meo, I.; Graziani, A.; Paletto, A.; Lagomarsino, A. Analysis of microbial diversity and greenhouse gas production of decaying pine logs. Forests 2017, 8, 224. [Google Scholar] [CrossRef] [Green Version]
- Næsset, E. Relationship between relative wood density of Picea abies logs and simple classification systems of decayed coarse woody debris. Can. J. For. Res. 1999, 14, 454–461. [Google Scholar] [CrossRef]
- Fridman, J.; Walheim, M. Amount, structure, and dynamics of dead wood on managed forestland in Sweden. Forest Ecol. Manag. 2000, 131, 23–36. [Google Scholar] [CrossRef]
- Paletto, A.; Tosi, V. Forest canopy cover and canopy closure: Comparison of assessment techniques. Eur. J. For. Res. 2009, 128, 265–272. [Google Scholar] [CrossRef]
- Lara, E.; Berney, C.; Harms, H.; Chatzinotas, A. Cultivation-independent analysis reveals a shift in ciliate 18S rRNA gene diversity in a polycyclic aromatic hydrocarbon-polluted soil. FEMS Microbiol. Ecol. 2007, 62, 365–373. [Google Scholar] [CrossRef] [PubMed] [Green Version]
- Ting, L.T.; King, W.S.; Hong, L.W.; Ali, S.R.A. New combination of primer pairs for PCR-DGGE detection of soil ciliates. Malays. Appl. Biol. 2015, 44, 67–72. [Google Scholar]
- Chromas Lite Software, v2.1.1. Available online: http://www.technelysium.com.au/chromas_lite.htm (accessed on 27 March 2021).
- BLAST. Available online: http://www.ncbi.nlm.nih.gov/BLAST (accessed on 27 March 2021).
- Larkin, M.A.; Blackshields, G.; Brown, N.P.; Chenna, R.; McGettigan, P.A.; McWilliam, H.; Lopez, R.; Thompson, J.D.; Gibson, T.J.; Higgins, D.G. Clustal W and Clustal X version 2.0. Bioinformatics 2007, 23, 2947–2948. [Google Scholar] [CrossRef] [PubMed] [Green Version]
- Jukes, T.H.; Cantor, C.R. Evolution of protein molecules. In Mammalian Protein Metabolism; Munro, H.N., Ed.; Academic Press: New York, NY, USA; London, UK, 1969; Volume 3, pp. 21–132. [Google Scholar]
- Saitou, N.; Nei, M. The neighbor-joining method: A new method for reconstructing phylogenetic trees. Mol. Biol. Evol. 1987, 4, 406–425. [Google Scholar] [PubMed]
- Van de Peer, Y.; De Wachter, R. Construction of evolutionary distance trees with TREECON for Windows: Accounting for variation in nucleotide substitution rate among sites. Bioinformatics 1997, 13, 227–230. [Google Scholar] [CrossRef] [PubMed]
- Webster, N.S.; Taylor, M.W.; Behnam, F.; Lucker, S.; Rattei, T.; Whalan, S.; Horn, M.; Wagner, M. Deep sequencing reveals exceptional diversity and modes of transmission for bacterial sponge symbionts. Environ. Microbiol. 2010, 12, 2070–2082. [Google Scholar] [CrossRef] [Green Version]
- Pfaffl, M.W. A new mathematical model for relative quantification in real-time RT–PCR. Nucleic Acids Res. 2001, 29, e45. [Google Scholar] [CrossRef]
- Hammer, Ø.; Harper, D.A.T.; Ryan, P.D. PAST: Palaeontological statistics software package for education and data analysis. Palaeontol. Electron. 2001, 4, 9. [Google Scholar]
- Zhang, P.; Tian, X.; He, X.; Song, F.; Ren, L.; Jiang, P. Effect of litter quality on its decomposition in broadleaf and coniferous forest. Eur. J. Soil Biol. 2008, 44, 392–399. [Google Scholar] [CrossRef]
- Ramette, A. Multivariate analyses in microbial ecology. FEMS Microbiol. Ecol. 2007, 62, 142–160. [Google Scholar] [CrossRef] [PubMed] [Green Version]
- Fukami, T.; Dickie, I.A.; Wilkie, P.; Paulus, B.C.; Park, D.; Roberts, A.; Buchanan, P.K.; Allen, R.B. Assembly history dictates ecosystem functioning: Evidence from wood decomposer communities. Ecol. Lett. 2010, 13, 675–684. [Google Scholar] [CrossRef] [PubMed]
- Chesson, P. Mechanisms of maintenance of species diversity. Ann. Rev. Ecol. Syst. 2000, 31, 343–366. [Google Scholar] [CrossRef] [Green Version]
- Segre, H.; Ron, R.; de Malach, N.; Henkin, Z.; Mandel, M.; Kadmon, R. Competitive exclusion, beta diversity, and deterministic vs. stochastic drivers of community assembly. Ecol. Lett. 2014, 17, 1400–1408. [Google Scholar] [CrossRef] [PubMed]
- Wang, X.; Li, H.; Bezemer, T.M.; Hao, Z. Drivers of bacterial beta diversity in two temperate forests. Ecol. Res. 2016, 31, 57–64. [Google Scholar] [CrossRef]
- Geisen, S.; Mitchell, E.A.; Adl, S.; Bonkowski, M.; Dunthorn, M.; Ekelund, F.; Fernández, L.D.; Jousset, A.; Krashevska, V.; Singer, D.; et al. Soil protists: A fertile frontier in soil biology research. FEMS Microbiol. Rev. 2018, 42, 293–323. [Google Scholar] [CrossRef]
- Spiegel, F.W.; Moore, D.L.; Feldman, J. Tychosporium acutostipes, a new protostelid which modifies the concept of the protosteliidae. Mycologia 1995, 87, 265–270. [Google Scholar] [CrossRef]
- Xiong, W.; Li, R.; Guo, S.; Karlsson, I.; Jiao, Z.X.; Xun, W.B.; Kowalchuk, G.A.; Shen, Q.R.; Geisen, S. Microbial amendments alter protist communities within the soil microbiome. Soil Biol. Biochem. 2019, 135, 379–382. [Google Scholar] [CrossRef]
- Santos, S.S.; Schöler, A.; Nielsen, T.K.; Hansen, L.H.; Schloter, M.; Winding, A. Land use as a driver for protist community structure in soils under agricultural use across Europe. Sci. Total. Environ. 2020, 717, 137228. [Google Scholar] [CrossRef]
- Foissner, W. An updated compilation of world soil ciliates (Protozoa, Ciliophora), with ecological notes, new records, and descriptions of new species. Eur. J. Protistol. 1998, 34, 195–235. [Google Scholar] [CrossRef]


| Moisture (%) | TC (%) | TN (%) | C/N Ratio | pH | CO2 (mg CO2 g−1) | |
|---|---|---|---|---|---|---|
| Class 1 | 52.2 (2.5) ab | 48.5 (0.4) b | 0.18 (0.02) b | 281.3 (28.7) a | 4.5 (0.3) | 0.9 (0.3) bc |
| Class 2 | 41.7 (4.7) b | 48.3 (0.8) b | 0.21 (0.03) b | 240.0 (32.9) ab | 4.6 (0.3) | 0.5 (0.1) c |
| Class 3 | 63.3 (3.0) a | 48.4 (1.0) b | 0.27 (0.03) b | 184.8 (19.9) abc | 4.0 (0.1) | 1.3 (0.3) ab |
| Class 4 | 54.6 (3.4) ab | 49.1 (0.5) ab | 0.31 (0.01) b | 158.0 (6.3) bc | 4.1 (0.1) | 1.5 (0.1) ab |
| Class 5 | 51.5 (10.6) ab | 52.2 (1.3) a | 0.55 (0.08) a | 102.7 (18.7) c | 4.0 (0.1) | 1.8 (0.4) a |
| F | 4.2 | 5.0 | 11.3 | 9.0 | 1.8 | 4.0 |
| p | * | ** | *** | *** | n.s. | * |
| (a) One-Way ANOSIM | (b) Two-Way ANOSIM | ||
|---|---|---|---|
| Pratomagno-DGGE | Decay Classes 4 and 5-DGGE | ||
| Factor Location | Factor Decay Class | ||
| R | 0.46 | 0.49 | 0.47 |
| P | 0.0001 | 0.002 | 0.003 |
| Class 1 | Class 2 | Class 3 | Class 4 | Class 5 | |
|---|---|---|---|---|---|
| Class 1 | 0.40 | 0.29 | 0.43 | 0.41 | |
| Class 2 | 0.057 | 0.32 | 0.59 | 0.83 | |
| Class 3 | 0.083 | 0.057 | 0.82 | 0.80 | |
| Class 4 | 0.027 | 0.029 | 0.027 | 0.65 | |
| Class 5 | 0.029 | 0.028 | 0.026 | 0.030 |
| Clone | Nearest Match (GenBank Accession No.; % Similarity) | Taxonomical Classification |
|---|---|---|
| C11 | Paraholosticha pannonica (KY492517; 99.84%) | Paraholosticha pannonica |
| C21 | Trachelophyllum brachypharynx SKS606 (KJ680555; 97.68%) | Trachelophyllum brachypharynx |
| C27 | Anteholosticha sigmoidea INHC311 (MN864520; 99.52%) | Anteholosticha sigmoidea |
| C28 | Platyophrya vorax (AF060454; 99.21%) | Platyophrya vorax |
| C34 | Anteholosticha sigmoidea INHC311 (MN864520; 96.67%) | Unclassified Anteholosticha |
| C37 | Paraholosticha pannonica (KY492517; 100%) | Paraholosticha pannonica |
| C38 | Paraholosticha pannonica (KY492517; 99.84%) | Paraholosticha pannonica |
| C44 | Colpoda aspera CA2011 (KF111344; 97.17%) | Colpoda aspera |
| C45 | Exocolpoda augustini PAPSc-6 (KJ607919; 98.10%) | Exocolpoda augustini |
| C51 | Mykophagophrys terricola (EU039902; 98.58%) | Mykophagophrys terricola |
| C53 | Colpoda elliotti (KJ873047; 97.64%) | Colpoda elliotti |
| C57 | Colpoda elliotti (KJ873047; 97.80%) | Colpoda elliotti |
| C64 | Colpoda aspera CA2011 (KF111344; 97.17%) | Colpoda aspera |
| C65 | Platyophrya vorax (AF060454; 99.05%) | Platyophrya vorax |
| C69 | Apofrontonia dohrni (AM072621; 91.44%) | Unclassified Apofrondoniidae |
| C71 | Protocyclidium sinica JJM2009113001 (KF256822; 94.33%) | Unclassified Cyclidiidae |
| C72 | Apofrontonia dohrni (AM072621; 95.70%) | Unclassified Apofrontonia |
| C74 | Microdiaphanosoma arcuatum (GU997633; 95.74%) | Unclassified Microdiaphanosoma |
| C75 | Paraholosticha pannonica (KY492517; 99.84%) | Paraholosticha pannonica |
| C77 | Colpoda aspera CA2011 (KF111344; 97.33%) | Colpoda aspera |
| C81 | Leptopharynx costatus GZ1 (EU286811; 98.89%) | Leptopharynx costatus |
| C84 | Heterogastrostyla salina Leo2015041601 (MT739409; 97.47%) | Heterogastrostyla salina |
| C89 | Holostichides heterotypicus (MK959229; 96.51%) | Unclassified Holostichides |
| C92 | Rurikoplites longitrichus SKS951 (MF288146; 99.11%) | Rurikoplites longitrichus |
| C96 | Paraholosticha pannonica (KY492517; 99.68%) | Paraholosticha pannonica |
| B10 | Anteholosticha sigmoidea INHC311 (MN864520; 98.83%) | Anteholosticha sigmoidea |
| B26 | Microdiaphanosoma arcuatum (GU997633; 96.28%) | Unclassified Microdiaphanosoma |
| B32 | Anteholosticha sigmoidea INHC311 (MN864520; 93.66%) | Unclassified Holostichidae |
| B80 | Holostichides heterotypicus (MK959229; 95.75%) | Unclassified Holostichides |
| B94 | Holosticha multistylata (AJ277876; 94.00%) | Unclassified Holostichidae |
| B97 | Protocyclidium sinica JJM2009113001 (KF256822; 92.64%) | Unclassified Cyclidiidae |
| B98 | Rurikoplites armatus (KP868771; 95.29%) | Unclassified Rurikoplites |
Publisher’s Note: MDPI stays neutral with regard to jurisdictional claims in published maps and institutional affiliations. |
© 2022 by the authors. Licensee MDPI, Basel, Switzerland. This article is an open access article distributed under the terms and conditions of the Creative Commons Attribution (CC BY) license (https://creativecommons.org/licenses/by/4.0/).
Share and Cite
Pastorelli, R.; Cucu, M.A.; Lagomarsino, A.; Paletto, A.; De Meo, I. Analysis of Ciliate Community Diversity in Decaying Pinus nigra Logs. Forests 2022, 13, 642. https://doi.org/10.3390/f13050642
Pastorelli R, Cucu MA, Lagomarsino A, Paletto A, De Meo I. Analysis of Ciliate Community Diversity in Decaying Pinus nigra Logs. Forests. 2022; 13(5):642. https://doi.org/10.3390/f13050642
Chicago/Turabian StylePastorelli, Roberta, Maria Alexandra Cucu, Alessandra Lagomarsino, Alessandro Paletto, and Isabella De Meo. 2022. "Analysis of Ciliate Community Diversity in Decaying Pinus nigra Logs" Forests 13, no. 5: 642. https://doi.org/10.3390/f13050642