Article

Trend Analysis of Coverage Variation in Pinus yunnanensis Franch. Forests under the Influence of Pests and Abiotic Factors

1
Institute of Highland Forest Science, Chinese Academy of Forestry, Kunming 650224, China
2
Graduate School, Nanjing Forestry University, Nanjing 210037, China
*
Author to whom correspondence should be addressed.
Forests 2022, 13(3), 412; https://doi.org/10.3390/f13030412
Submission received: 18 December 2021 / Revised: 18 February 2022 / Accepted: 28 February 2022 / Published: 3 March 2022
(This article belongs to the Section Forest Health)

Abstract

:
The Yunnan pine (Pinus yunnanensis Franch.) is one of the primary forest vegetation types in Yunnan Province and has prominent economic value and ecological significance. Monitoring changes in Yunnan pine forests contributes to their health management. The normalized differential vegetation index (NDVI) is an essential indicator for studying regional vegetation change. Landsat images were used to analyze the NDVI changes of Yunnan pine forests in rainy and dry seasons as well as the NDVI changes of Yunnan pine forests from 2009 to 2020. The results showed that the NDVI in Yunnan pine forests showed opposite trends in the rainy and dry seasons, with an increase in the rainy season and a decrease in the dry season. The areas of NDVI decline during the rainy season are mainly located at the edges of the forest area, with very few within the forest area. The main reason for the decline in NDVI within the forest area was pests. From 2009 to 2020, the areas where NDVI increased and decreased were 92.23% and 7.77% of the pine forests, respectively. The decreasing areas were mainly located at the edges of the pine forests, with sporadic distribution within the forest areas. The drought led to a significant decline in NDVI in the forest area in 2010 and 2013. Due to the lack of protective measures, the forest area in Xijiekou Town was severely infested with pests, with complex NDVI changes and strong fluctuations, and areas of severe pest infestation could be detected by NDVI imagery. This study is meaningful for forest protection and explores the potential capability of Landsat imagery for pest detection.

1. Introduction

Vegetation coverage is influenced by climate and other factors such as pests, diseases, and anthropogenic activities. Furthermore, a large number of studies have shown that normalized differential vegetation index (NDVI) has a high correlation with vegetation coverage [1,2,3] and that the higher the NDVI, the higher the vegetation coverage. Therefore, NDVI is an effective indicator for monitoring variation in vegetation, which can reflect the growth of surface vegetation [4,5]. In recent years, many scholars have used NDVI product data (e.g., SPOT-VGT NDVI, GIMMS NDVI 3g, and MODIS NDVI) for vegetation change studies [6,7,8,9]. These data are superior for studying variation in vegetation in response to climate change and significant regional changes in vegetation coverage and can reflect the expansion or contraction of vegetation coverage in response to external environmental influences. In addition, vegetation variation can also be reflected through Landsat data [10]. Landsat data have worked better in studies of the mangrove forests coverage, mapping the degradation of mangroves due to shoreline changes [11]. Compared with these data, Landsat data have higher spatial resolution and are easy to obtain, which should be more advantageous in studying vegetation variation caused by pests and diseases.
In recent years, the effects of pests and diseases have led to the deterioration of forest health, which has attracted much attention. For example, Spruce et al. (2019) used MODIS NDVI data to monitor forest death due to mountain pine beetle, demonstrating the potential of MODIS NDVI data to detect variation in forest coverage in small areas due to pest impacts [12]. In contrast, the time series of Landsat images contain a wealth of information that can also be used to detect pest disturbance. The Landsat time series change detection algorithm (LandTrendr) allows the mapping of spectral trajectories associated with pest disturbance at different times and severities [13,14]. Hais et al. (2009) used Landsat images to determine differences in spectral responses between two types of forest disturbance (i.e., bark beetle outbreaks and deforestation) [15]. In a study of defoliation damage in oak forests caused by Tortrix viridana (Lep.: Tortricidae), Landsat’s NDVI images were closely related to the canopy coverage of the oak forest. The monitoring of damage by T. viridana can be achieved by monitoring changes in NDVI in oak forests [16]. In the study of damage caused by the Tomicus spp., Yu et al. (2018) used Landsat time-series data to detect the timing of outbreaks and movement trajectories [17].
This study is conducted on Yunnan pine (Pinus yunnanensis Franch.) forests in Shilin County, Kunming, Yunnan Province, China. Pine forests in the area have been under prolonged pest stress (the main pest species are Tomicus spp., Monochamus alternatus, and Dioryctria rubella Hampson), which has led to the death of Yunnan pine forests and caused substantial economic losses [18]. Therefore, there is an urgent need to monitor and evaluate variation in the coverage of Yunnan pine forests. Landsat data are used to analyze Yunnan pine forest coverage change, which is freely available from the United States Geological Survey (USGS). They are widely used in various fields such as monitoring of vegetation variation [19,20,21], crop yield estimation [22], and land utilization [23,24]. First, the NDVI of Landsat series satellite imagery was calculated. Then, the spatial and temporal characteristics of the NDVI of Yunnan pine forests in the study area were investigated utilizing one-dimensional linear trend analysis and stability analysis to explore the external factors (such as climate, anthropogenic activity, pests, etc.) that contribute to fluctuations of Yunnan pine forest coverage. We also explore the potential ability of Landsat data to monitor variation in vegetation coverage in small areas due to the effects of pests.

2. Materials and Methods
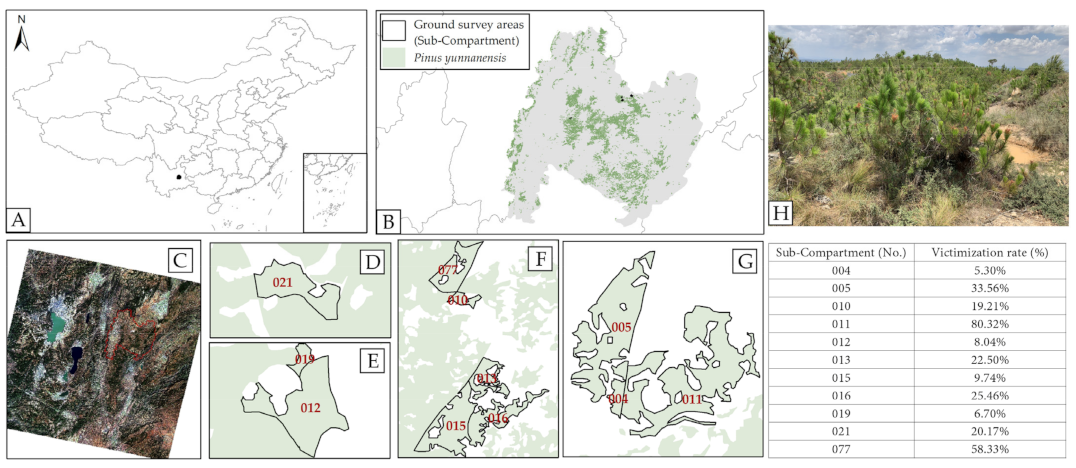
2.1. Study Area

The study area is located in Shilin Yizu Autonomous County (Shilin), Kunming, Yunnan, China (103°10′–103°41′ E, 24°30′–25°03′ N), at an altitude of 1700–1950 m. The climate of Shilin is a subtropical low-latitude plateau mountain monsoon climate, characterized by rainy and dry seasons, with a rainy season from May to October and a dry season from November to April and an average annual temperature of 14.7 °C. Shilin is a typical karst landform, and its forest vegetation is difficult to recover quickly after being destroyed. Yunnan pine is the dominant species in Shilin, covering almost half of the county’s arboreal forest area, which is important for the local ecological balance (Figure 1A). However, 80% of Yunnan pine forests are pure stands with a single stand structure. Most Yunnan pines grow in poor ground conditions, making them susceptible to pest and disease infestation [25]. Each year, pests infest thousands of hectares of Yunnan pine forests in Shilin, causing severe damage.

2.2. Ground Survey

A ground survey was conducted from 16 to 18 November 2019 to identify infested Yunnan pine forests in Heilongtan Reservoir and Xijiekou Town. According to the “Standard of Forest Pests Occurrence and Disaster (Document Number: LY/T 1681–2006)” issued by the State Forestry Administration, damaged Yunnan pines are identified. A single Yunnan pine is considered healthy when the percentage of damaged branch tips is less than 10%, whereas more than 10% indicates that it is damaged. The ground survey area is shown in Figure 1. A total of three sub-compartments (Number (No.) 012, 019, and 021) were surveyed in the forest area near Heilongtan Reservoir, and a total of eight sub-compartments (No. 004, 005, 010, 011, 013, 015, 016, and 077) were surveyed in the forest area of Xijiekou Town. During the survey, we found that the Heilongtan Reservoir forest area was well protected and had reasonable pest control, with fewer damaged trees. In contrast, the forest area in Xijiekou Town had almost no protection measures and was heavily infested with pests.

2.3. Satellite Data Sources and Pre-Processing

According to the official USGS data description, the Landsat satellite sensor is calibrated, and Landsat satellite images of all Tier 1 levels are available for time series analysis [26]. Therefore, Landsat 5 TM, Landsat 7 ETM+, and Landsat 8 OLI data with a spatial resolution of 30 m and less than 50% cloud cover in the study area (Table 1) are analyzed in this paper.
Pre-processing of the data, completed on the Google Earth Engine (GEE) platform, included operations such as demanding, de-clouding, and mask cropping. Then the NDVI of the Landsat image was calculated, and the maximum NDVI raster image was obtained by the maximum synthesis method. Moreover, the NDVI raster image of the Yunnan pine forests was extracted using the forest resources management survey data of Shilin.
Combining ground survey data, monthly changes in image values of the maximum NDVI raster images from May 2019 to October 2019 represent rainy season changes in coverage of Yunnan pine forests, while the dry season coverage variation is represented using the pixel value variation of the maximum NDVI raster image from November 2019 to April 2020. By analyzing the trends between the rainy and dry seasons in pine forests, we explore the reasons why pest detection is not appropriate during the dry season.
During the dry season, the needles on the second- and third-year branches of Yunnan pine fall off due to climatic influences, which impacts detection. In the rainy season, pests such as Tomicus spp. and Monochamus alternatus continue to damage Yunnan pine treetops until the end of the rainy season, so images of November (at the start of the dry season) for each year from 2009 to 2020 were selected for inter-annual variation analysis.

2.4. Methods

Numerous studies have shown that NDVI can be used for monitoring changes in forest coverage [1,2,3,4,5,12,16], and this study also used NDVI to monitor changes in pine forest coverage during the rainy and dry seasons from 2009 to 2020.

2.4.1. Analysis of NDVI Variation

Unchanged features generally have equal or similar grey values on remote sensing images in both time phases. In contrast, when features change, the grey values at the corresponding locations will differ significantly. Therefore, the analysis of spatial variation in NDVI is carried out using the direct image comparison method. Variation in NDVI is analyzed four times:
  • The beginning of the rainy season (May 2019);
  • The end of the rainy season (October 2019);
  • The beginning of the dry season (November 2019);
  • The end of the dry season (April 2020).
The ΔNDVI represents the difference in NDVI at different times in the same area, and it’s classification thresholds are assigned according to the NDVI coverage classes (Table 2) [1,27,28].

2.4.2. Unitary Linear Trend Analysis

The slope of the one-dimensional linear regression equation (Equation (1))is used to characterize the change in NDVI between the rainy and dry seasons in Yunnan pine forests [1,28,29,30,31].
θ Slope = n × i = 1 n i × N D V I i i = 1 n i × i = 1 n N D V I i n × i = 1 n i 2 ( i = 1 n i ) 2 ,
where variable i ∈ (1, 2, …) is the ordinal number of the time-series image by time; n is the total number of months (years); and NDVIi is the NDVI value for a month (year) i. θ Slope is the slope of linear change in NDVI.
When θ Slope > 0, it means that NDVI is on the rise during the period, and the canopy coverage of Yunnan pine forests has improved, and vice versa when the canopy coverage has degraded. The results of the slope calculations were tested for F significance, and then the slope was superimposed on the significance test results with the division criteria shown in Table 3 [32].

2.4.3. Coefficient of Variation

The stability of NDVI variation in Yunnan pine forests is expressed using the coefficient of variation (CV) [33,34], where the smaller the CV value, the smoother the vegetation change (Equation (2)).
CV = 1 NDVI ¯ × 1 n i = 1 n NDVI i NDVI ¯ 2
The CV is classified into five classes, namely high volatility (CV ≥ 0.20, F1), relatively high volatility (0.15 ≤ CV < 0.20, F2), medium volatility (0.10 ≤ CV < 0.15, F3), relatively low volatility (0.05 ≤ CV < 0.10, F4), and low volatility (CV < 0.05, F5) [5].

2.4.4. Influence of Climate on the Change of Pine Forest Coverage

Pearson correlation analysis of annual precipitation, mean annual temperature, and NDVI (mean) for 2009–2020 was carried out separately to analyze the influence of precipitation and temperature on changes in pine forest coverage.
The precipitation and temperature data for the years 2009 to 2020 were obtained from the China Meteorological Data Network (http://data.cma.cn, accessed on 6 December 2021).

2.4.5. Influence of Pests on Changes in Pine Forest Coverage

The applicability of NDVI to detect changes in pine forest coverage due to pest stress needs to be verified. Therefore, in this study, a Pearson correlation analysis was conducted between NDVI and the pine damage rate (the rate of pine trees infested by pests in a sub-compartment area of pine forests, i.e., the Victimization rate in Figure 1) of the sample plots to verify the relationship between NDVI and the canopy coverage of pine forests under pest stress. As the ground survey was conducted in November 2019, NDVI images from that month were selected to extract the NDVI of the sample plots.

2.4.6. Influence of Anthropogenic Activities on Coverage of Pine Forest

Based on the ground survey results, the influence of anthropogenic activities on the change of pine forest cover in Heilongtan Reservoir and Xijiekou Town was analyzed, positive or negative. Moreover, the reasons for the highly fluctuating NDVI of pine forests in some areas are analyzed in conjunction with the high-precision images.

3. Results

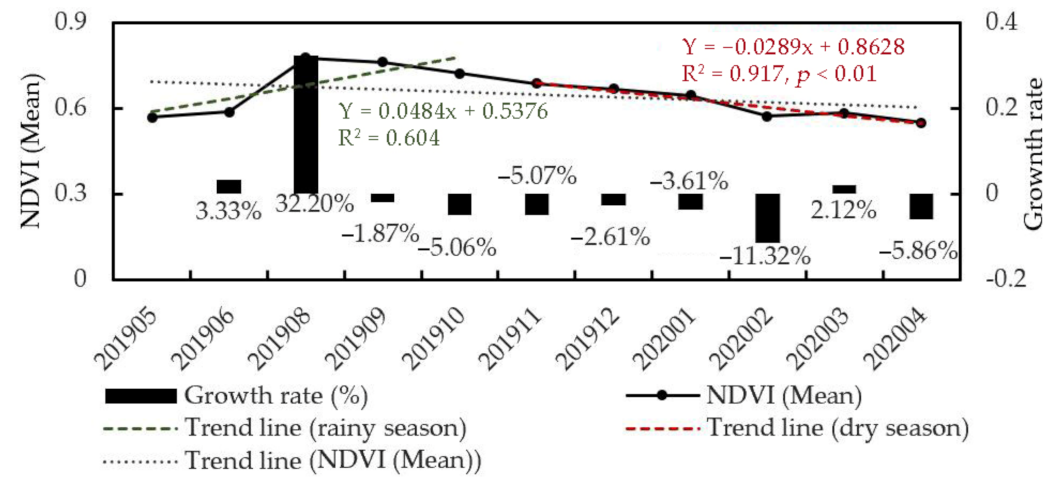
3.1. Inter-Monthly Variation in NDVI during the Rainy and Dry Seasons

3.1.1. Characteristics of NDVI Variation

The NDVI of Yunnan pine forests for the rainy season (May 2019–October 2019) and dry season (November 2019–April 2020) were categorized by month, and the mean values of the maximum NDVI raster images were calculated for each month. The results show an overall slight downward trend in the monthly average NDVI values from November 2019 to April 2020 (Figure 2), with values fluctuating in the range of 0.55–0.78. The monthly mean NDVI values ranged from 0.57–0.78 in the rainy season with an overall increasing trend, while they fluctuated in the range of 0.55–0.69 in the dry season with an overall decreasing trend (p < 0.01). NDVI values increased marginally from May to June and sharply from June to August, with a growth rate of 32.20%. NDVI values showed a continuous decline from August 2019 to February 2020, with a slow decline from September to December and a significant decline from January to February 2020. In the rainy season, Yunnan pine branches (annual shoot) produce many new needles, and vegetation coverage increases, so NDVI values increase and have a high growth rate from June to August. In contrast, the needles of the second- and third-year branch tips fall off during the dry season. The vegetation coverage decreases, hence the rapid decrease in NDVI values from January to February 2020.

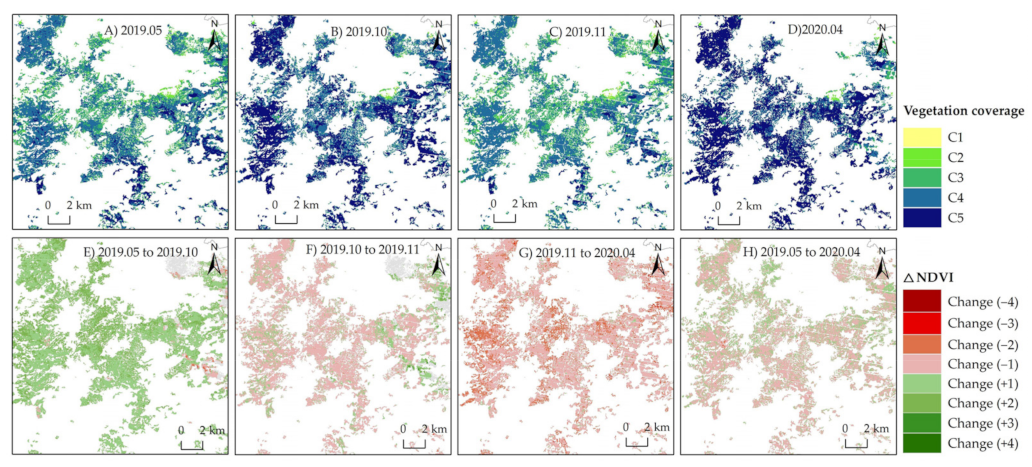
3.1.2. Spatial Variation Characteristics of NDVI

Overall, the NDVI of Yunnan pine forests showed a slight downward trend, with a significant increase in NDVI and increase in vegetation cover class during the rainy season and a considerable decrease in NDVI and decrease in vegetation cover class during the dry season (Figure 3, Table 4). From May to October, NDVI increased in 94.80% of the stands, and the cover of Yunnan pine increased (Figure 3E). Compared to October, the proportion of areas with decreasing NDVI was 77.83%, and the proportion of areas with increasing NDVI was 22.17% in Yunnan pine stands in November (Figure 3F). Compared to the NDVI image at the beginning of the dry season (November 2019), the proportion of areas where NDVI was decreasing at the end of the dry season (April 2020) in Yunnan pine forests was 92.52%, and the proportion of areas where it was increasing was 7.48% (Figure 3G). For the NDVI image at the start of the rainy season (May 2019) versus the end of the dry season (April 2020), the proportion of NDVI declining areas at the end of the dry season was slightly higher than that of rising areas at 66.41% (Figure 3H). Due to the climate and the growth habits of Yunnan pine, NDVI in pine forests increase during the rainy season and tend to decrease during the dry season.
The images of NDVI during the period of continuous increase were analyzed (May and August) (Figure 4A). We found that most of the areas where NDVI changes between Change (±3) and Change (±4) levels are at the edge of forest areas (Figure 4B), which are primarily at the interface between agricultural and forest areas (Figure 4C) and are susceptible to anthropogenic activities. The rise or fall in NDVI is most likely due to changes in crop growth. The areas with NDVI changes at the Change (−1) and Change (−2) levels were mainly within the forest. Combined with ground surveys, we found that the leading reason for NDVI decline in Yunnan pine forests during the rainy season was pest damage, with Tomicus spp. causing the most damage to Yunnan pine (Figure 5B). When using Landsat images for pest analysis, the focus should be on changes within the forest area. In contrast, changes at the edges of the forest area should be judged in conjunction with higher-resolution images to exclude the effects of other factors.

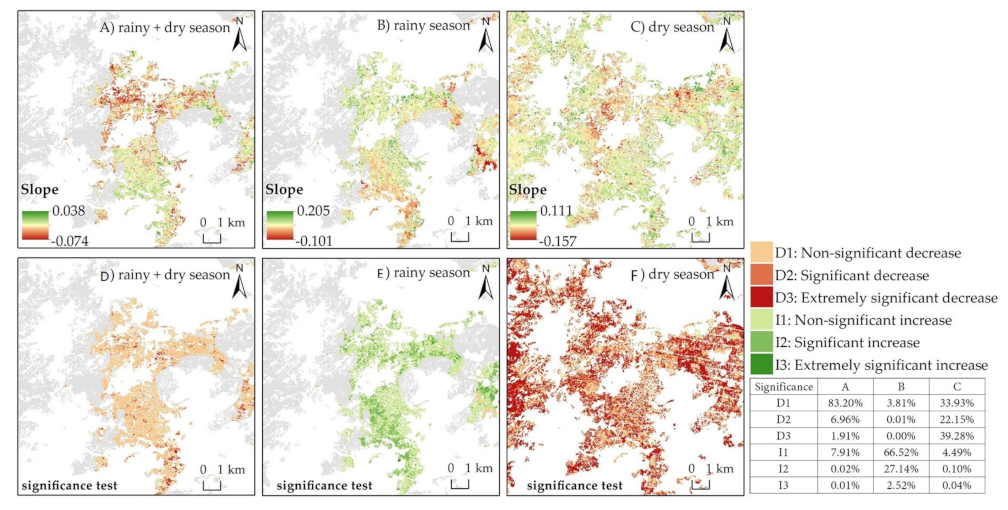
3.1.3. Slope Analysis of Yunnan Pine Forests in the Rainy Season + Dry Season, Rainy Season, and Dry Season

The slope of inter-monthly NDVI variation was calculated for the rainy, dry, and whole year, respectively.
The slope of NDVI changes in the Yunnan pine forest region from May 2019 to April 2020 ranged from −0.074 to 0.038, with a mean value of −0.010 (Figure 5A), showing a general decay trend. The proportion of NDVI increase in area was 7.93%, of which 0.00%, 0.02%, and 7.91% were extremely significant, significant, and non-significant increases, respectively. The proportion of NDVI decrease was 92.07%, with extremely significant, significant, and non-significant decreases of 1.91%, 6.96%, and 83.20%, respectively.
(1)
Rainy season
The slope of NDVI change in Yunnan pine stands during the rainy season ranged from −0.101 to 0.205, with a mean value of 0.050 (Figure 5B). A total of 96.18% of the stands showed an increase in NDVI, of which 2.52%, 27.14%, and 66.52% were extremely significant, significant, and non-significant increases, respectively. On the other hand, 3.82% of the stands showed a decrease in NDVI, of which 0.00%, 0.01%, and 3.81% were extremely significant, significant, and non-significant decreases, respectively.
(2)
Dry season
The slope of NDVI change in Yunnan pine stands during the dry season ranged from −0.157 to 0.111, with a mean value of −0.030 (Figure 5C). The proportion of NDVI increase was 4.64%, of which 0.04%, 0.10%, and 4.49% were extremely significant, significant, and non-significant increases, respectively. The decrease in NDVI accounted for 95.36% of the forest area, of which 39.28%, 22.15%, and 33.93% were extremely significant, significant, and non-significant decreases, respectively.

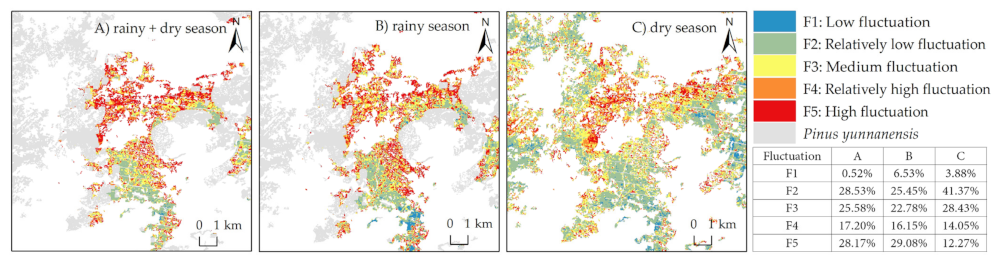
3.1.4. The Volatility of the Yunnan Pine Forest Coverage

Figure 6 shows the spatial distribution of inter-monthly CV of NDVI in Yunnan pine forests during the rainy + dry, rainy, and dry seasons. It could be observed that 70.92% of Yunnan pine forests had CV values less than 0.2 in the rainy season, 87.73% in the dry season, and 71.83% in the rainy + dry season. This means that the coverage of Yunnan pine forests is stable, either during the rainy season, the dry season, or throughout the rainy + dry season. Analyzing the NDVI fluctuations in Yunnan pine forests in three situations, we found that the fluctuations were more dramatic in most forest areas located at the edges and a few in the central part of the forest.

3.2. Inter-Annual Variation in NDVI (2009–2020)

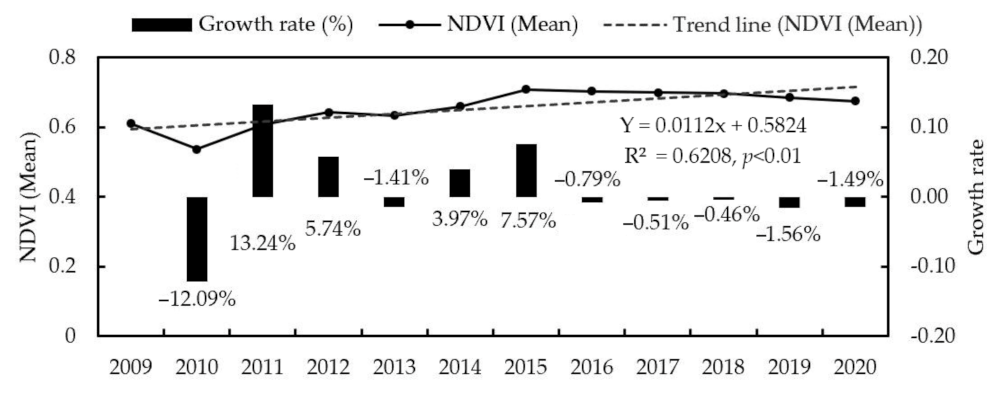
3.2.1. Characteristics of NDVI Variation

The maximum NDVI rasters synthesized for November of each year in the study area from 2009 to 2020 were classified, and their mean values were calculated, as shown in Figure 7. The NDVI values fluctuated within the range of 0.54–0.79 from 2009 to 2020, showing two increases and three decreases, with an overall increasing trend (p < 0.01).

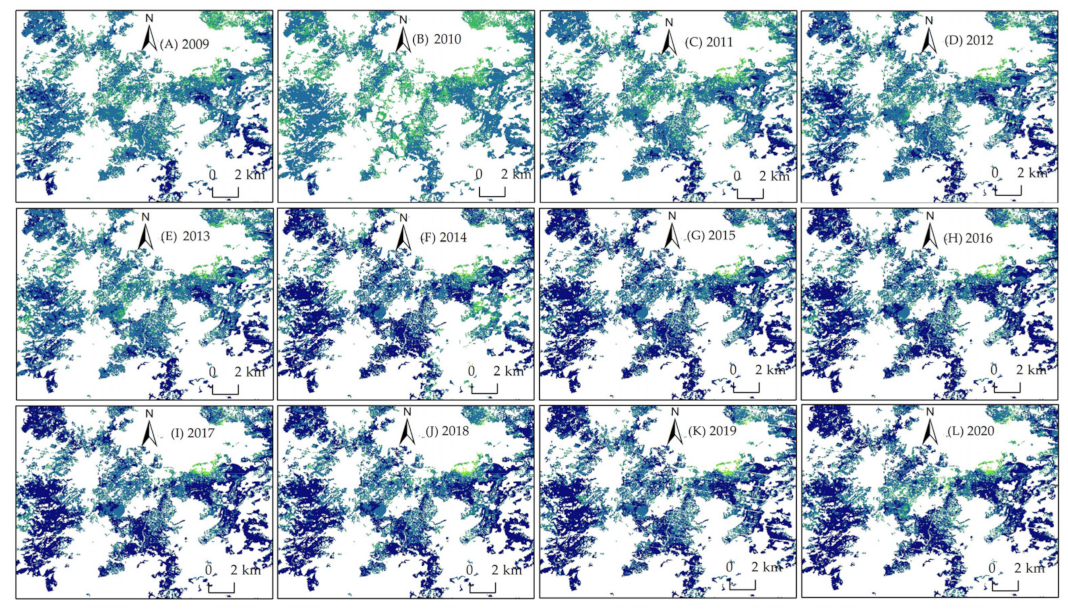
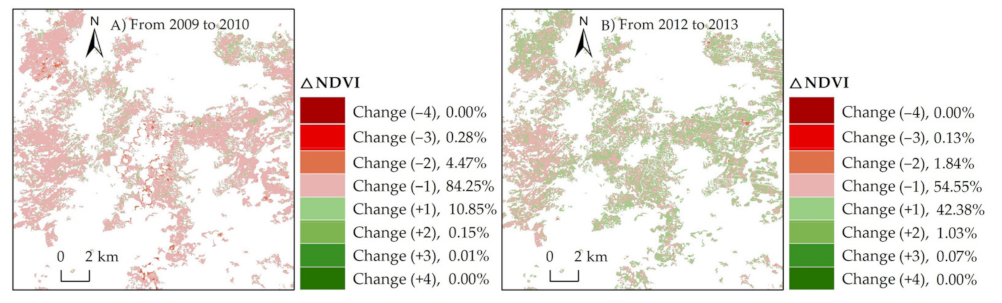
3.2.2. Spatial Variation Characteristics of NDVI

On the whole, from 2009 to 2020, the NDVI of Yunnan pine forest showed an increasing trend, and vegetation coverage increased significantly (Figure 8). From 2009 to 2010, the NDVI and vegetation coverage class of pine forests decreased significantly, with 89% of Yunnan pine showing a decrease in NDVI and severe damage to pine forests (Figure 9A). From 2012 to 2013, more than 50% of the pine forests showed a decrease in NDVI, a decrease in coverage class, and some pine forests were damaged (Figure 9B). From 2014 to 2020, pine forests’ NDVI and vegetation coverage were high, with no significant decrease or increase.

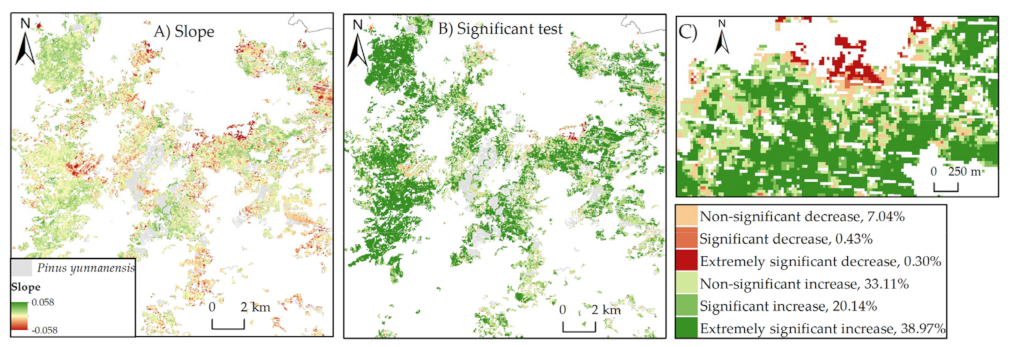
3.2.3. Slope Analysis of Yunnan Pine Forests from 2009 to 2020

The slope of NDVI was calculated for the period from 2009 to 2020. The slope of NDVI in the Yunnan pine forest was −0.058–0.058, with a mean value of 0.012 (Figure 10). NDVI increased in 92.23% of the pine forests, with the proportion of extremely significant, significant, and non-significantly increasing areas being 38.97%, 20.14%, and 33.11%, respectively. NDVI decreased in 7.77% of the pine forests, of which 0.30%, 0.43%, and 7.04% were extremely significant, significant, and non-significant decreases, respectively. Analysis of the areas where the NDVI decreased showed that most of the areas where NDVI decreased significantly were located at the edge of the forest area. Most of the areas with significant and non-significant decreases in NDVI are located within the forest area. According to historical information from the local Forestry and Grassland Bureau, the cause of the decrease in NDVI within the forest area is pest stress.

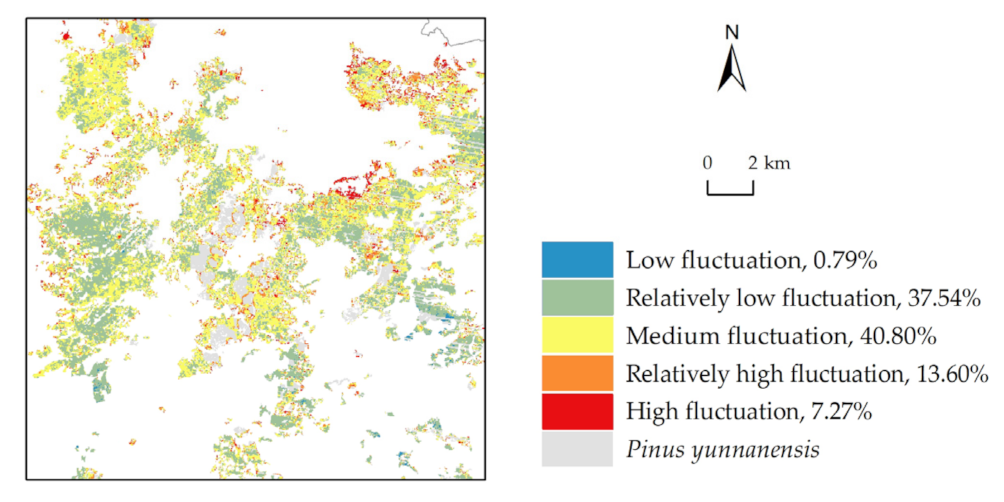
3.2.4. The Volatility of the Yunnan Pine Forest Coverage (2009 to 2020)

Figure 11 shows the spatial distribution of CVNDVI in Yunnan pine forests from 2009 to 2020, with CVNDVI calculated according to Equation (2). It can be found that 92.73% of Yunnan pine forests had CVNDVI values less than 0.2, which means that the vegetation cover of Yunnan pine forests was overwhelmingly stable during these 12 years. In contrast, 7.27% of the pine forests showed high fluctuations in NDVI, and these areas were mainly located at the boundaries of Yunnan pine forests, while very few of them were located in the center of the forest area.

3.2.5. Influence of Temperature and Precipitation on Changes in Pine Forest Coverage

The NDVI changes in Yunnan pine forests showed a positive correlation with precipitation (Pearson’s correlation, R = 0.532, p > 0.5) and a negative correlation with temperature (Pearson’s correlation, R = −0.151, p > 0.5); thus, the effect of precipitation on NDVI is more potent than that of temperature. The previous results also showed a significant increase in the coverage of Yunnan pine forests during the rainy season and a significant decrease during the dry season. Meanwhile, the rainfall from 2009 to 2020 showed (Figure 12b) that the rainfall in 2010 and 2013 both decreased compared to the previous year, and the NDVI (Figure 9) also decreased to varying degrees in both years compared to the previous year. The years 2017 and 2019 both showed an increase in rainfall compared to the previous year, but the NDVI of the pine forests slightly decreased, and the reasons for this decrease need to be further surveyed.

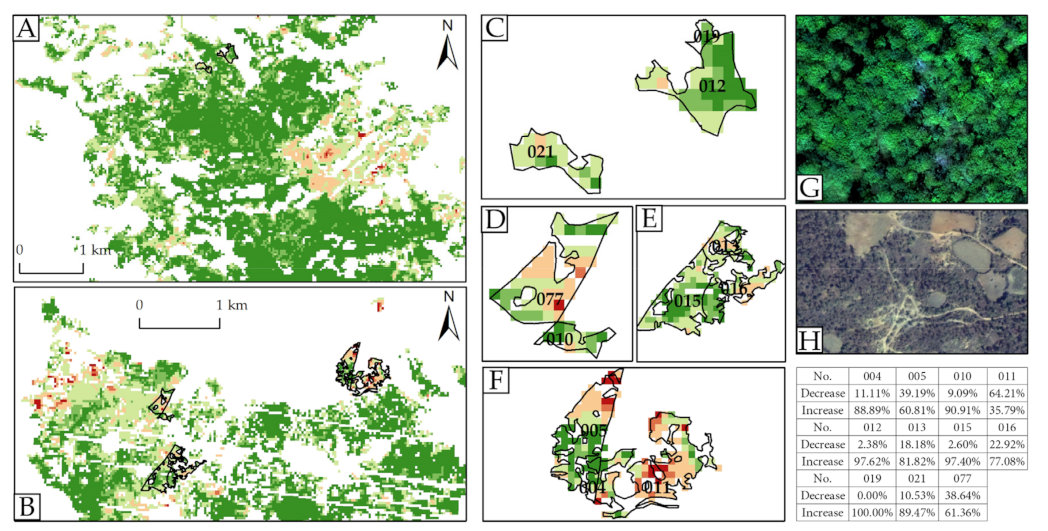
3.2.6. Influence of Pests and Anthropogenic Activity on Changes in Pine Forest Coverage

The pine damage rate and NDVI of the sample plots are shown in Table 5. There was a highly significant correlation between them (Pearson’s correlation, R = −0.826, p < 0.01). This means that the detection of pest stress can be achieved by monitoring changes in the NDVI of the pine forest canopy.
Combined with ground surveys, the NDVI variation in the forest areas of Heilongtan Reservoir and Xijiekou Town was analyzed (Figure 13). We found a low level of NDVI fluctuation in the Heilongtan Reservoir forest area, with an overall upward trend in NDVI from 2009 to 2020 (Figure 13A). Most of the attenuation areas and sharp fluctuations are located at the edge of the forest area (Figure 13G). NDVI increased in sub-compartment 019, decreased in sub-compartment 012 by only one pixel cell, and decreased in sub-compartment 021 by two pixel cells (Figure 13C). The fluctuation of NDVI in the forest area of Xijiekou Town was complex and showed high fluctuation levels. The NDVI also showed an increasing trend (Figure 12b), but the variations were relatively complex (Figure 13H). In addition to the decreasing NDVI at the forest area’s edge, the NDVI also decreased in the interior. The NDVI decline in sub-compartment 011 exceeded 50%, while it was nearly 40% in sub-compartments 005 and 077, around 20% in sub-compartments 013 and 016, and around 10% in sub-compartments 004, 010, and 015. (Figure 13D–F). Combining the pine damage rate (Table 5), we found that when the damage rate of pine forests due to pests is higher, the area of decline in NDVI is larger, i.e., there is a greater decline in the area of pine forest coverage. This is because xylophagous insects such as Tomicus spp. prefer to feed on the branches in the middle and upper part of the canopy, leading to a decrease in the NDVI of the canopy. Therefore, NDVI images from Landsat allow for the detection of pest stress at the stand scale.
The forest area in Xijiekou Town is more complex in terms of variation and more substantial fluctuations in NDVI than the Heilongtan forest area. During the ground survey, we found that the forest area of the Heilongtan reservoir is better protected, with regular patrols and pest checks by relevant personnel and controls on people entering and leaving the forested area. In contrast, the forest area in Xijiekou Town seriously lacks quarantine facilities and personnel protection, and the infested wood moves freely, enabling the spread of the pests. Moreover, most forest areas are adjacent to agricultural lands, with complex NDVI variations at the boundary. During our literature review, we found relevant studies showing that timber transport can lead to the spread of Tomicus spp. damage [35]. In conjunction with ground surveys, Yunnan pine forests in Xijiekou Town mostly bordered on agricultural land, with traces of the felling of infested pine trees at the borders. Moreover, there were shacks built from pine trees near some agricultural lands, and some of the trunks had wormholes infested with Tomicus spp. Therefore, we speculate that one of the reasons for the NDVI decline of the Yunnan pine forests in Xijiekou Town is anthropogenic activity. Artificial transport of infested wood has led to the expansion of Tomicus spp. infestation. In the future, control and protection of forest areas in Xijiekou Town should be strengthened to prevent the occurrence of pests.

4. Discussion

Yunnan pine, an important tree species for reforestation, has crucial economic value and is one of the primary forest types in Yunnan Province. At the same time, Yunnan pine is an essential target for forest conservation [36]. For example, since the first outbreak of the Yunnan pine bollworm in Yunnan, hundreds of square kilometers of Yunnan pine forests have died, causing substantial economic losses [37,38,39]. In recent years, Yunnan Province has strengthened the protection of forest resources and the management and control of forest pests and diseases. Therefore, it is also essential to monitor the coverage of Yunnan pine forests to help the health management of pine forests. This study analyzed the trends in coverage of Yunnan pine forests under pest stress during the rainy and dry seasons, and the coverage variation from 2009 to 2020. In this study, the inter-monthly and inter-annual NDVI variability of Yunnan pine forests was analyzed to investigate the variation of pine forest coverage during the rainy and dry seasons and the trend of coverage variation from 2009 to 2020. We also explored the reasons for pine forest coverage change and analyzed variation in pine forests due to pests and anthropogenic activities.

4.1. Influence of Climate on the Change of Pine Forest Coverage

Precipitation and temperature are the main drivers of variation in vegetation dynamics [1,35,40]. There was a positive correlation between the change in pine forest coverage and precipitation in our study, consistent with the study by Meng et al. [8]. Meanwhile, the effect of precipitation on pine forest coverage was higher than that of temperature in our study, and temperature showed a negative correlation with pine forest coverage. However, Zhang et al. found that vegetation coverage change showed a positive correlation with both temperature and precipitation in arid regions, and the effect of temperature was higher than that of precipitation [1]. The main reason for this is the large variation in the study area, and secondly, the variation in sample size may also be a contributing factor. In a further study, the ground survey needs to be expanded to thoroughly verify the relationship between precipitation and temperature with changes in pine forest coverage.

4.2. Influence of Pests on Changes in Pine Forest Coverage

In some studies of pests in Yunnan pine, a clear link between climate change and pest outbreaks has also been found. In poor rainfall years (especially early spring droughts), reduced precipitation is the main external cause of pest outbreaks [41]. According to meteorological data, Yunnan was hit by a major drought from 2009 to 2013 and experienced severe water shortages. An outbreak of Tomicus spp. was recorded in 2013 in the town of Pupeng, Dali, Yunnan, resulting in a large number of pine trees being damaged. Drought can lead not only to a direct reduction in pine forest coverage but also to an increase in pest stress, resulting in a decrease in pine forest coverage [17]. On this basis, we can speculate that in the study area, the causes of the decline in Yunnan pine forest coverage in 2010 and 2013 were drought and pests. At the same time, the drought has aggravated the pest situation and increased the level of NDVI decline in some areas. The increased precipitation resulted in good stand growth and pest resistance. The abundant precipitation also allows the adult pests such as Tomicus spp. and Monochamus alternatus to be flooded and less likely to damage the branches or trunks of trees. Their populations are kept to a tolerable level in the stand, keeping stand damage to an acceptable level.

4.3. Influence of Anthropogenic Activities on Coverage of Pine Forest

In addition to climate and pests, the change of vegetation coverage is related to anthropogenic activities [42]. We found that the NDVI of Yunnan pine at the edge of the forest area fluctuated considerably. Most of the forest edges are bordered by agricultural land. In the forestry resource survey, some of the forest areas mapped were slightly larger and included some agricultural land (Figure 14A). Some forest areas are also adjacent to buildings (Figure 14B) and are similarly subject to anthropogenic impact. The lack of quarantine facilities and staff teams in the early days and the random movement of infested wood also accelerated the pests’ spread, leading to a decrease in NDVI in pine forests.

5. Conclusions

Landsat time-series data provide a wealth of information that can be used for forest change monitoring, which enables better detection of forest disturbance. Through this study, we found that:
  • The NDVI of Yunnan pine shows a clear upward trend in the rainy season and a clear downward trend in the dry season. The areas where the NDVI of pine forests declined during the rainy season are mainly located at the edges of the forest area, with sporadic distribution within the forest area. Combined with ground surveys, the main cause of NDVI decline within the forest area is pests, while the main causes of NDVI decline at the edges are anthropogenic activities and pests. During the dry season, the coverage of pine forests is influenced by the growth habits of the pine trees, and large decreases in pine forest coverage occur. This disturbing factor cannot be excluded if the pest stress test is carried out during the dry season.
  • From 2009 to 2020, the spatial and temporal variation in Yunnan pine forests in Shilin was complex, with an increasing trend in general. Most forest areas show an increasing trend in NDVI, while a small proportion of the forest areas show a decreasing trend.
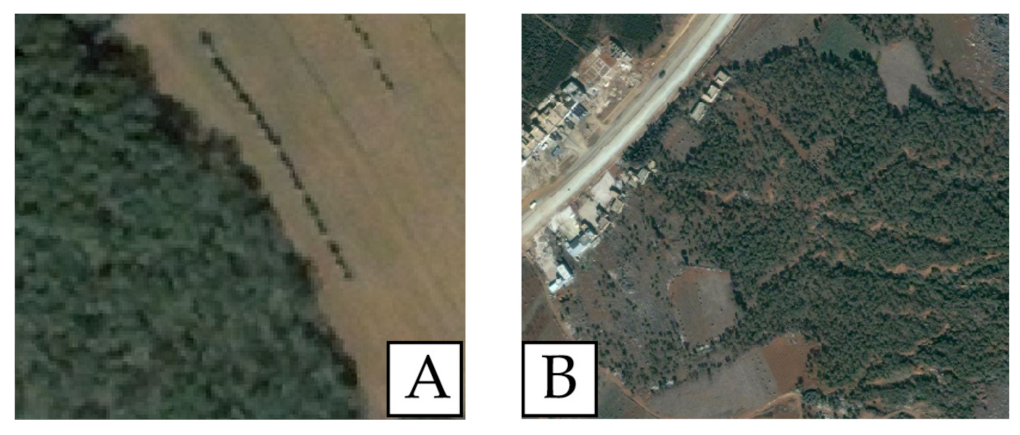
  • Variation in NDVI is influenced by climate, pests, and anthropogenic activities. Because of the influence of anthropogenic activities, the NDVI at the edge of the forest area changes dramatically. In contrast, most of the changes within the forest area are caused by pests. Drought caused a significant decrease in the forest area’s NDVI in 2010 and 2013.
  • In the forest area of Heilongtan Reservoir, the rise of NDVI in the pine forest is promoted by forest protection measures. In contrast, in the forest area of Xijiekou Town, anthropogenic activities have inhibited the rise of NDVI in the pine forest, and the pest situation is serious.
These results have important implications for forest protection and forestry production, providing a reference for pest outbreak studies and forest protection.

Author Contributions

Conceptualization, M.L. (Mengying Liu) and L.S.; Data Curation, M.L. (Mengying Liu); Formal Analysis, M.L. (Mengying Liu); Funding Acquisition, L.S.; Investigation, M.L. (Mengying Liu), Z.Z. and X.L.; Project Administration, L.S.; Resources, L.S.; Writing—Original Draft, M.L. (Mengying Liu); Writing—Review and Editing, M.L. (Mengying Liu) and M.L. (Mengxue Li). All authors have read and agreed to the published version of the manuscript.

Funding

This study was supported by the Revitalize Yunnan Talent Support Program of Yunnan Province (Certificate number: YNWR-CYJS-2020-008).

Institutional Review Board Statement

Not applicable.

Informed Consent Statement

Not applicable.

Data Availability Statement

Not applicable.

Conflicts of Interest

The authors declare no conflict of interest.

References

  1. Zhang, H.; An, H.M. Analysis of NDVI variation characteristics and trend of Minqin Oasis from 1987 to 2019 based on GEE. J. Desert Res. 2021, 41, 28–36. [Google Scholar] [CrossRef]
  2. Zhou, W.; Gang, C.C.; Li, J.L.; Zhang, C.B.; Mu, S.J.; Sun, Z.G. Spatial-temporal dynamics of grassland coverage and its re-sponse to climate in China during 1982-2010. Acta Geogr. Sin. 2014, 69, 15–30. [Google Scholar] [CrossRef]
  3. Mondal, I.; Thakur, S.; Juliev, M.; De, T.K. Comparative analysis of forest canopy mapping methods for the Sundarban biosphere reserve, West Bengal, India. Environ. Dev. Sustain. 2021, 23, 15157–15182. [Google Scholar] [CrossRef]
  4. Baret, F.; Guyot, G. Potentials and limits of vegetation indices for LAI and APAR assessment. Remote Sens. Environ. 1991, 35, 161–173. [Google Scholar] [CrossRef]
  5. Jiang, W.; Yuan, L.; Wang, W.; Cao, R.; Zhang, Y.; Shen, W. Spatio-temporal analysis of vegetation variation in the Yellow River Basin. Ecol. Indic. 2015, 51, 117–126. [Google Scholar] [CrossRef]
  6. Fensholt, R.; Rasmussen, K.; Nielsen, T.T.; Mbow, C. Evaluation of earth observation based long term vegetation trends—Intercomparing NDVI time series trend analysis consistency of Sahel from AVHRR GIMMS, Terra MODIS and SPOT VGT data. Remote Sens. Environ. 2009, 113, 1886–1898. [Google Scholar] [CrossRef]
  7. Dai, Z.J.; Zhao, X.; Li, G.W.; Wang, X.C.; Pang, L.H. Spatial-temporal variations in NDVI in vegetation-growing season in Qinghai based on GIMMS NDVI 3g.v1 in past 34 years. Pratac. Sci. 2018, 12, 713–725. [Google Scholar] [CrossRef]
  8. Meng, X.; Gao, X.; Belikovich, M.; Lei, J. Spatial and Temporal Characteristics of Vegetation NDVI Changes and the Driving Forces in Mongolia during 1982–2015. Remote Sens. 2020, 12, 603. [Google Scholar] [CrossRef] [Green Version]
  9. Liu, Z.; Wang, H.; Li, N.; Zhu, J.; Pan, Z.; Qin, F. Spatial and Temporal Characteristics and Driving Forces of Vegetation Changes in the Huaihe River Basin from 2003 to 2018. Sustainability 2020, 12, 2198. [Google Scholar] [CrossRef] [Green Version]
  10. Thakur, S.; Mondal, I.; Bar, S.; Nandi, S.; Ghosh, P.; Das, P.; De, T. Shoreline changes and its impact on the mangrove ecosystems of some islands of Indian Sundarbans, North-East coast of India. J. Clean. Prod. 2021, 284, 124764. [Google Scholar] [CrossRef]
  11. Li, S.S.; Yan, J.P.; Wan, J. The Spatial-temporal Changes of Vegetation Restoration on Loess Plateau in Shaanxi-Gansu-Ningxia Region. Acta Geogr. Sin. 2012, 67, 960–970. [Google Scholar] [CrossRef]
  12. Spruce, J.P.; Hicke, J.A.; Hargrove, W.W.; Grulke, N.E.; Meddens, A.J.H. Use of MODIS NDVI Products to Map Tree Mortality Levels in Forests Affected by Mountain Pine Beetle Outbreaks. Forests 2019, 10, 811. [Google Scholar] [CrossRef] [Green Version]
  13. Meigs, G.W.; Kennedy, R.E.; Cohen, W.B. A Landsat time series approach to characterize bark beetle and defoliator impacts on tree mortality and surface fuels in conifer forests. Remote Sens. Environ. 2011, 115, 3707–3718. [Google Scholar] [CrossRef]
  14. Bright, B.C.; Hudak, A.T.; Kennedy, R.E.; Meddens, A.J.H. Landsat Time Series and Lidar as Predictors of Live and Dead Basal Area Across Five Bark Beetle-Affected Forests. IEEE J. Sel. Top. Appl. Earth Obs. Remote Sens. 2014, 7, 3440–3452. [Google Scholar] [CrossRef]
  15. Hais, M.; Jonášová, M.; Langhammer, J.; Kucera, T. Comparison of two types of forest disturbance using multitemporal Landsat TM/ETM+ imagery and field vegetation data. Remote Sens. Environ. 2009, 113, 835–845. [Google Scholar] [CrossRef]
  16. Leila, G.; Pir, B.M.; Jamil, A.; Hamed, G. Monitoring infestations of oak forests by Tortrix viridana (Lepidoptera: Tortricidae) using remote sensing. Plant Prot. Sci. 2016, 52, 270–276. [Google Scholar] [CrossRef] [Green Version]
  17. Yu, L.; Huang, J.; Zong, S.; Huang, H.; Luo, Y. Detecting Shoot Beetle Damage on Yunnan Pine Using Landsat Time-Series Data. Forests 2018, 9, 39. [Google Scholar] [CrossRef] [Green Version]
  18. Deng, J. Research on Remote Sensing Monitoring of Pinus yunnanensis Damaged by Tomicus in Shilin Based on TVDI. Master’s Thesis, Beijing Forestry University, Beijing, China, 2016. [Google Scholar]
  19. Kennedy, R.E.; Andréfouët, S.; Cohen, W.B.; Gómez, C.; Griffiths, P.; Hais, M.; Healey, S.P.; Helmer, E.H.; Hostert, P.; Lyons, M.B.; et al. Bringing an ecological view of change to Landsat-based remote sensing. Front. Ecol. Environ. 2014, 12, 339–346. [Google Scholar] [CrossRef]
  20. Chen, B.; Xiao, X.; Li, X.; Pan, L.; Doughty, R.; Ma, J.; Dong, J.; Qin, Y.; Zhao, B.; Wu, Z.; et al. A mangrove forest map of China in 2015: Analysis of time series Landsat 7/8 and Sentinel-1A imagery in Google Earth Engine cloud computing platform. ISPRS J. Photogramm. Remote Sens. 2017, 131, 104–120. [Google Scholar] [CrossRef]
  21. Lobell, D.B.; Thau, D.; Seifert, C.; Engle, E.; Little, B. A scalable satellite-based crop yield mapper. Remote Sens. Environ. 2015, 164, 324–333. [Google Scholar] [CrossRef]
  22. Yin, Q.D.; Liu, C.X.; Tian, Y. Detecting dynamics of vegetation disturbance in forest natural reserve using Landsat imagery and LandTrendr algorithm: The case of Chaisong and Taibaishan Natural Reserves in Shaanxi, China. Acta Ecol. Sin. 2020, 40, 7343–7352. [Google Scholar] [CrossRef]
  23. Huang, H.B.; Chen, Y.L.; Clinton, N.; Wang, J.; Wang, X.Y.; Liu, C.X.; Gong, P.; Yang, J.; Bai, Y.Q.; Zheng, Y.M.; et al. Mapping major land cover dynamics in Beijing using all Landsat images in Google Earth Engine. Remote Sens. Environ. 2017, 202, 166–176. [Google Scholar] [CrossRef]
  24. Zhao, Y.; Feng, D.; Yu, L.; Cheng, Y.; Zhang, M.; Liu, X.; Xu, Y.; Fang, L.; Zhu, Z.; Gong, P. Long-Term Land Cover Dynamics (1986–2016) of Northeast China Derived from a Multi-Temporal Landsat Archive. Remote Sens. 2019, 11, 599. [Google Scholar] [CrossRef] [Green Version]
  25. Chen, J.; Yang, W.Z.; Zhang, S.S.; Wang, Y.B.; Wang, L.; Zheng, W.; Wang, S.; Li, J.W. Geographical Distribution Patterns of Pinus yunnanensis in Yunnan Province Based on Critical Indicators of the Forest Stand. J. West China For. Sci. 2021, 50, 19–26. [Google Scholar]
  26. Chander, G.; Markham, B.L.; Helder, D.L. Summary of current radiometric calibration coefficients for Landsat MSS, TM, ETM+, and EO-1 ALI sensors. Remote Sens. Environ. 2009, 113, 893–903. [Google Scholar] [CrossRef]
  27. Li, W.X.; Xu, J.; Yao, Y.Q.; Zhang, Z.C. Temporal and spatial change characteristics of vegetation cover (NDVI) in the Three-River Headwater Region on Tibetan Plateau under global warming. Mount. Res. 2021, 39, 473–482. [Google Scholar] [CrossRef]
  28. Luan, J.K.; Liu, D.F.; Huang, Q.; Feng, J.L.; Lin, M.; Li, G.B. Analysis of the spatial-temporal change and impact factors of the vegetation index in Yulin, Shaanxi Province, in the last 17 years. Acta Ecol. Sin. 2018, 38, 2780–2790. [Google Scholar] [CrossRef]
  29. Stow, D.; Daeschner, S.; Hope, A.; Douglas, D.; Petersen, A.; Myneni, R.; Zhou, L.; Oechel, W. Variability of the Seasonally Integrated Normalized Difference Vegetation Index Across the North Slope of Alaska in the 1990s. Int. J. Remote Sens. 2003, 24, 1111–1117. [Google Scholar] [CrossRef]
  30. Ma, M.G.; Wang, J.; Wang, X.M. Advance in the Inter-annual Variability of Vegetation and Its Relation to Climate Based on Remote Sensing. J. Remote Sens. 2006, 10, 421–431. [Google Scholar]
  31. Yan, E.P.; Lin, H.; Dang, Y.F.; Xia, C.Z. The spatiotemporal changes of vegetation cover in Beijing-Tianjin sandstorm source control region during 2000–2012. Acta Ecol. Sin. 2014, 34, 5007–5020. [Google Scholar] [CrossRef] [Green Version]
  32. Fang, J.M.; Ma, G.Q.; Yu, X.X.; Jia, G.D.; Wu, X.Q. Spatiotemporal Variation of NDVI in Qinghai Lake Basin and Its Relationship with Climatic Factors. J. Soil Water Conserv. 2020, 34, 105–112. [Google Scholar] [CrossRef]
  33. Tucker, C.J.; Newcomb, W.W.; Los, S.; Prince, S.D. Mean and inter-year variation of growing-season normalized difference vegetation index for the Sahel 1981-1989. Int. J. Remote Sens. 1991, 12, 1133–1135. [Google Scholar] [CrossRef]
  34. Li, J.; Zhang, J.; Liu, C.L.; Yang, X.C. Spatiotemporal Variation of Vegetation Coverage in Recent 16 Years in the Border Region of China, Laos, and Myanmar Based on MODIS-NDVI. Sci. Silv. Sin. 2019, 55, 9–18. [Google Scholar] [CrossRef]
  35. Li, Y. Causes of Tomicus Piniperda L. Disaster in Yuxi of Yunnan Province and Countermeasures of Prevention and Control. For. Resour. Manag. 2013, 40–42. [Google Scholar] [CrossRef]
  36. Deng, X.Q.; Huang, B.L.; Wen, Q.Z.; Hua, C.L.; Tao, J. A research on the distribution of Pinus yunnanensis forest in Yunnan Province. J. Yunnan Univ. (Nat. Sci. Ed.) 2013, 35, 843–848. [Google Scholar] [CrossRef]
  37. Ye, H.; Dang, C.L. Study on the harmful behavior of Tomicus Piniperda on Pinus yunnanensis. J. Yunnan Univ. (Nat. Sci. Ed.) 1986, 8, 218–222. [Google Scholar]
  38. Ye, H. Occurrence, distribution and damages of Tomicus piniperda in Yunnan, southwestern China. J. Yunnan Univ. (Nat. Sci. Ed.) 1998, 20, 361–363. [Google Scholar]
  39. Duan, Z.Y.; Yang, Z.Y.; Wang, J.M.; He, Y.H. Artificial Rearing and Living Habits Observation in the Latent Phase of Pine Shoot Beetle, Tomicus yunnanensis. For. Res. 2013, 26, 389–392. [Google Scholar] [CrossRef]
  40. Sun, H.; Wang, C.; Niu, Z. Analysis of the vegetation cover change and the relationship between NDVI and environmental factors by using NOAA time series data. J. Remote Sens. 1998, 2, 210–216. [Google Scholar] [CrossRef]
  41. Du, J.; Quan, Z.; Fang, S.; Liu, C.; Wu, J.; Fu, Q. Spatiotemporal changes in vegetation coverage and its causes in China since the Chinese economic reform. Environ. Sci. Pollut. Res. 2019, 27, 1144–1159. [Google Scholar] [CrossRef]
  42. Jin, K.; Wang, F.; Han, J.Q.; Shi, S.Y.; Ding, W.B. Contribution of climatic change and human activities to vegetation NDVI change over China during 1982-2015. Acta Geogr. Sin. 2020, 75, 961–974. [Google Scholar] [CrossRef]
Figure 1. Diagram of the study area. (A) Shilin in China; (B) Pinus yunnanensis forests in Shilin; (C) Landsat image with the study area; (DG) Ground survey areas; (H) Yunnan pine forest (partial). Victimization rate = (The number of infested trees/Total number of trees) × 100%.
Forests 13 00412 g001
Figure 2. Variation in monthly NDVI averages from May 2019 to April 2020.
Forests 13 00412 g002
Figure 3. Variation of Yunnan pine forest coverage and NDVI in May, October, and November 2019 and April 2020. (AD) are maps of pine forest coverage; (EH) are ΔNDVI.
Forests 13 00412 g003
Figure 4. NDVI changes from May to August 2019. (A) ΔNDVI for May versus August 2019. (B) Location of Change (+3) and Change (−1). (C) The interface between agricultural land and woodland.
Forests 13 00412 g004
Figure 5. Slope and significance test results for rainy+dry season, rainy season, and dry season.
Forests 13 00412 g005
Figure 6. Spatial distribution of inter-monthly NDVI coefficients in Yunnan pine forests during the rainy season, dry season, and rainy + dry season.
Forests 13 00412 g006
Figure 7. Variation in mean NDVI values in the study area from 2009 to 2020.
Forests 13 00412 g007
Figure 8. Pine forest coverage from 2009 to 2020, the darker the color, the higher the coverage level. (A) Pine forest coverage in 2009; (B) Pine forest coverage in 2010; (C) Pine forest coverage in 2011; (D) Pine forest coverage in 2012; (E) Pine forest coverage in 2013; (F) Pine forest coverage in 2014; (G) Pine forest coverage in 2015; (H) Pine forest coverage in 2016; (I) Pine forest coverage in 2017; (J) Pine forest coverage in 2018; (K) Pine forest coverage in 2019; (L) Pine forest coverage in 2020.
Forests 13 00412 g008
Figure 9. ΔNDVI for 2009 vs. 2010 and 2012 vs. 2013. (A) NDVI difference (ΔNDVI) between 2010 and 2009 in pine forests; (B) NDVI difference (ΔNDVI) between 2013 and 2012 in pine forests.
Forests 13 00412 g009
Figure 10. Slope and significance tests (2009 to 2020). (A) Slope; (B) Significant test results; (C) Local significance test results.
Forests 13 00412 g010
Figure 11. Spatial distribution of CVNDVI in Yunnan pine forests from 2009 to 2020.
Forests 13 00412 g011
Figure 12. NDVI versus temperature and precipitation for 2009 to 2020. (a) Correlation of NDVI with temperature and precipitation; (b) Precipitation vs. NDVI.
Forests 13 00412 g012
Figure 13. Slope significance test results for NDVI of pine forests in Heilongtan Reservoir and Xijiekou Town (2009–2020). (A) Forest area of Heilongtan Reservoir; (B) Forest area of Xijiekou Town; (C) Ground survey area of Heilongtan Reservoir forest; (DF) Ground survey area of Xijiekou Town forest; (G) The image of Heilongtan Reservoir forest; (H) The image of Xijiekou Town forest.
Forests 13 00412 g013
Figure 14. Diagram of forest areas bordering agricultural land and buildings. (A) Forest areas bordering agricultural land; (B) Forest areas bordering buildings.
Forests 13 00412 g014
Table 1. Landsat data (Path:129, Row:43) used in this study a.
DateImageYearImage
May 2019Landsat 7 and Landsat 82009–2012Landsat 5 and Landsat 7
June 2019Landsat 7 and Landsat 8Landsat 5 and Landsat 7
August 2019Landsat 7 and Landsat 8Landsat 5 and Landsat 7
September 2019Landsat 7 and Landsat 8Landsat 5 and Landsat 7
October 2019Landsat 7 and Landsat 82013–2020Landsat 7 and Landsat 8
November 2019Landsat 7 and Landsat 8Landsat 7 and Landsat 8
December 2019Landsat 7 and Landsat 8Landsat 7 and Landsat 8
January 2020Landsat 7 and Landsat 8Landsat 7 and Landsat 8
February 2020Landsat 7 and Landsat 8Landsat 7 and Landsat 8
March 2020Landsat 7 and Landsat 8Landsat 7 and Landsat 8
April 2020Landsat 7 and Landsat 8Landsat 7 and Landsat 8
a The Landsat images for July 2019 are not used as they do not meet the Tier 1 level criteria.
Table 2. ΔNDVI levels and thresholds.
Coverage Level (C)Threshold (ΔNDVI a)ΔNDVI Level
Bare land (C1): NDVI < 0.1ΔNDVI > 0.6Change (+4)
ΔNDVI < −0.6Change (−4)
Low coverage (C2): NDVI < 0.30.4 < ΔNDVI ≤ 0.6Change (+3)
−0.6 ≤ ΔNDVI < −0.4Change (−3)
Medium coverage (C3): NDVI < 0.50.2 < ΔNDVI ≤ 0.4Change (+2)
−0.4 ≤ ΔNDVI < −0.2Change (−2)
Medium-high coverage (C4): NDVI < 0.70 < ΔNDVI ≤ 0.2Change (+1)
−0.2 ≤ ΔNDVI < 0Change (−1)
High coverage (C5): NDVI ≥ 0.7ΔNDVI = 0No Change
a ΔNDVI = NDVIiNDVIj, i and j represent different months (years), respectively.
Table 3. Slope and significance levels.
SlopepLevelDescription
θSlope < 0p ≥ 0.05D1Non-significant decrease
0.01 ≤ p < 0.05D2Significant decrease
p < 0.01D3Extremely significant decrease
θSlope > 0p ≥ 0.05I1Non-significant increase
0.01 ≤ p < 0.05I2Significant increase
p < 0.01I3Extremely significant increase
Table 4. Yunnan Pine forest coverage and ΔNDVI ratios in May, October, and November 2019 and in April 2020.
DateC1C2C3C4C5ΔNDVI
NDVIi − NDVIjChange (+)Change (−)
May 20190.05%7.01%24.53%44.95%23.46%NDVIOct. 2019 − NDVIMay 201994.80%5.20%
October 20190.07%0.90%7.38%36.97%54.68%NDVINov. 2019 − NDVIOct. 201922.17%77.83%
November 20190.11%6.41%26.69%53.24%13.56%NDVIApr. 2020 − NDVINov. 20197.48%92.52%
April 20200.03%0.65%4.68%23.97%70.67%NDVIApr. 2020 − NDVIMay 201933.59%66.41%
Table 5. The pine victimization rates and NDVI of the sample plots.
Survey AreaNo. 1NDVI 2Pine Damage Rate 3Survey AreaNo.NDVIPine Damage Rate
Heilongtan Reservoir0120.6633 ± 0.07478.04%Xijiekou
Town
0110.2311 ± 0.174380.32%
0190.6942 ± 0.00336.70%0130.4991 ± 0.084622.50%
0210.6010 ± 0.047720.17%0150.5866 ± 0.05999.74%
Xijiekou Town0040.5210 ± 0.05545.30%0160.4666 ± 0.122025.46%
0050.3956 ± 0.162333.56%0770.4957 ± 0.100658.33%
0100.5390 ± 0.077919.21%
1 No. represents the number of the sub-compartment, which is also the sub-compartment (No.) in Figure 1. 2 The NDVI data are presented as the mean ± standard error. 3 Pine damage rate is the victimization rate in Figure 1.
Publisher’s Note: MDPI stays neutral with regard to jurisdictional claims in published maps and institutional affiliations.

