
Genomics-Enabled Management of Genetic Resources in Radiata Pine

 ,
,
Abstract
:1. Introduction
2. Materials and Methods
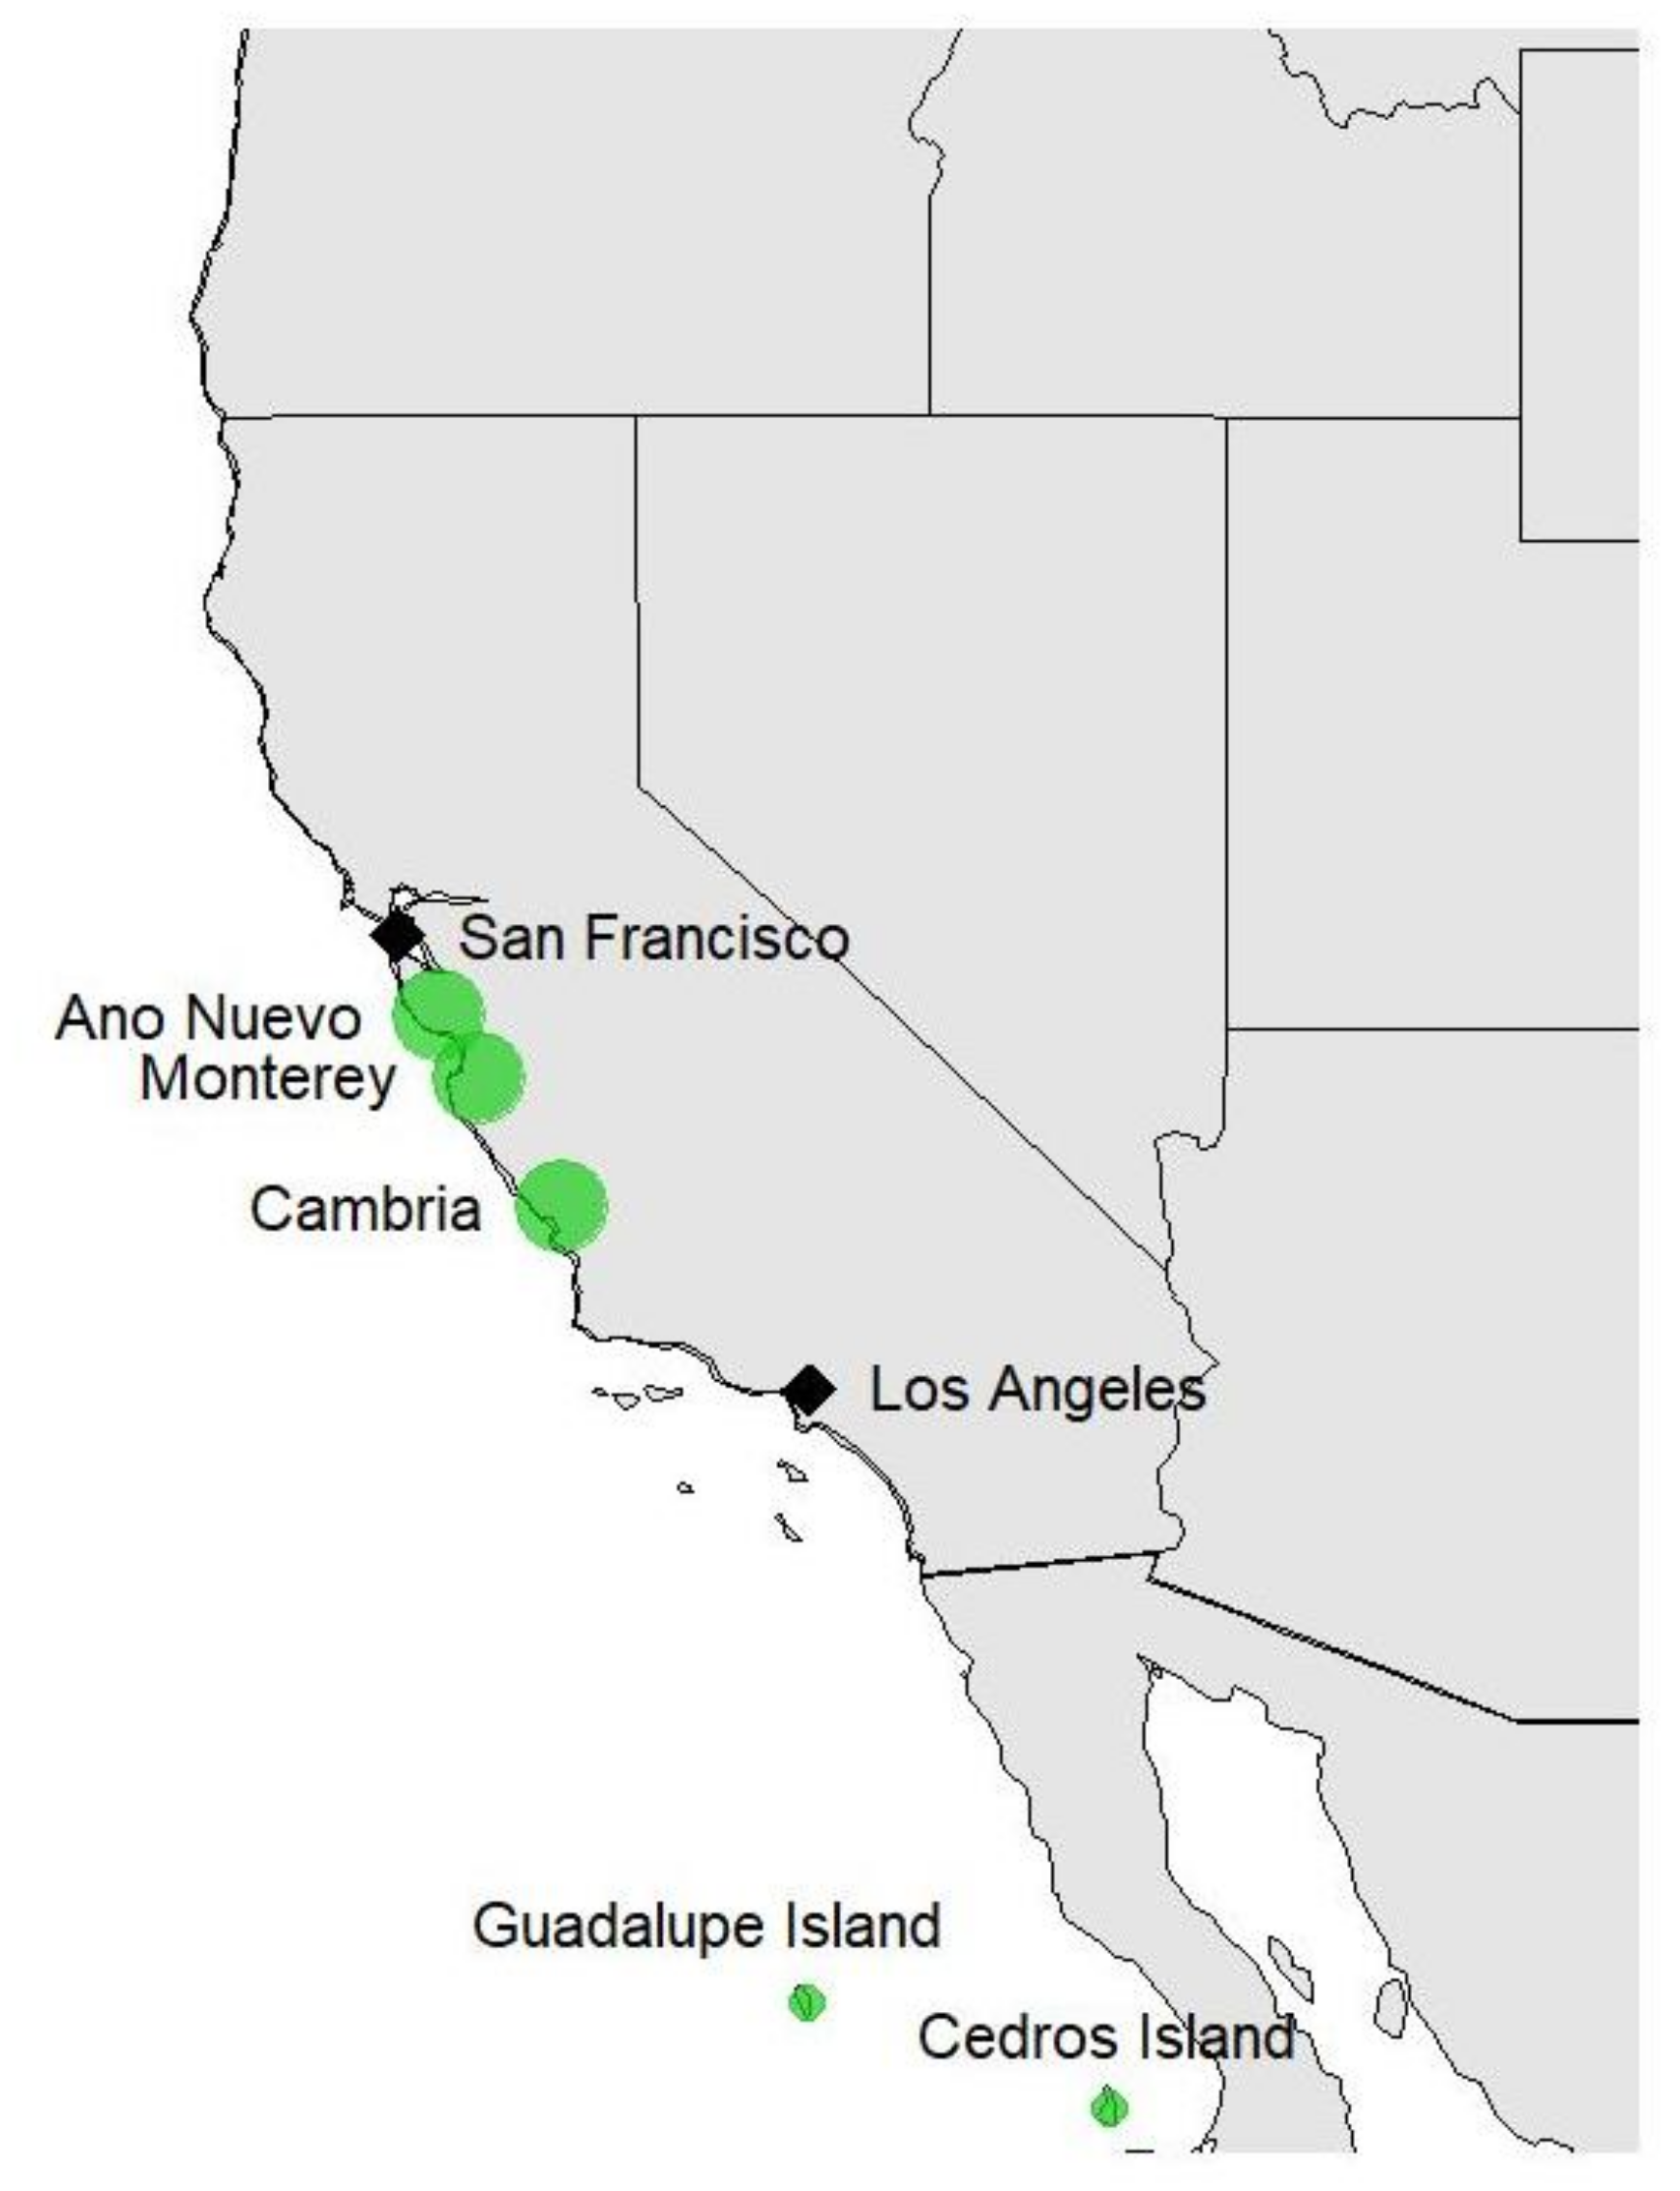
2.1. Plant Materials and Phenotypic Data
2.2. Genomic Data
2.3. Data Analysis
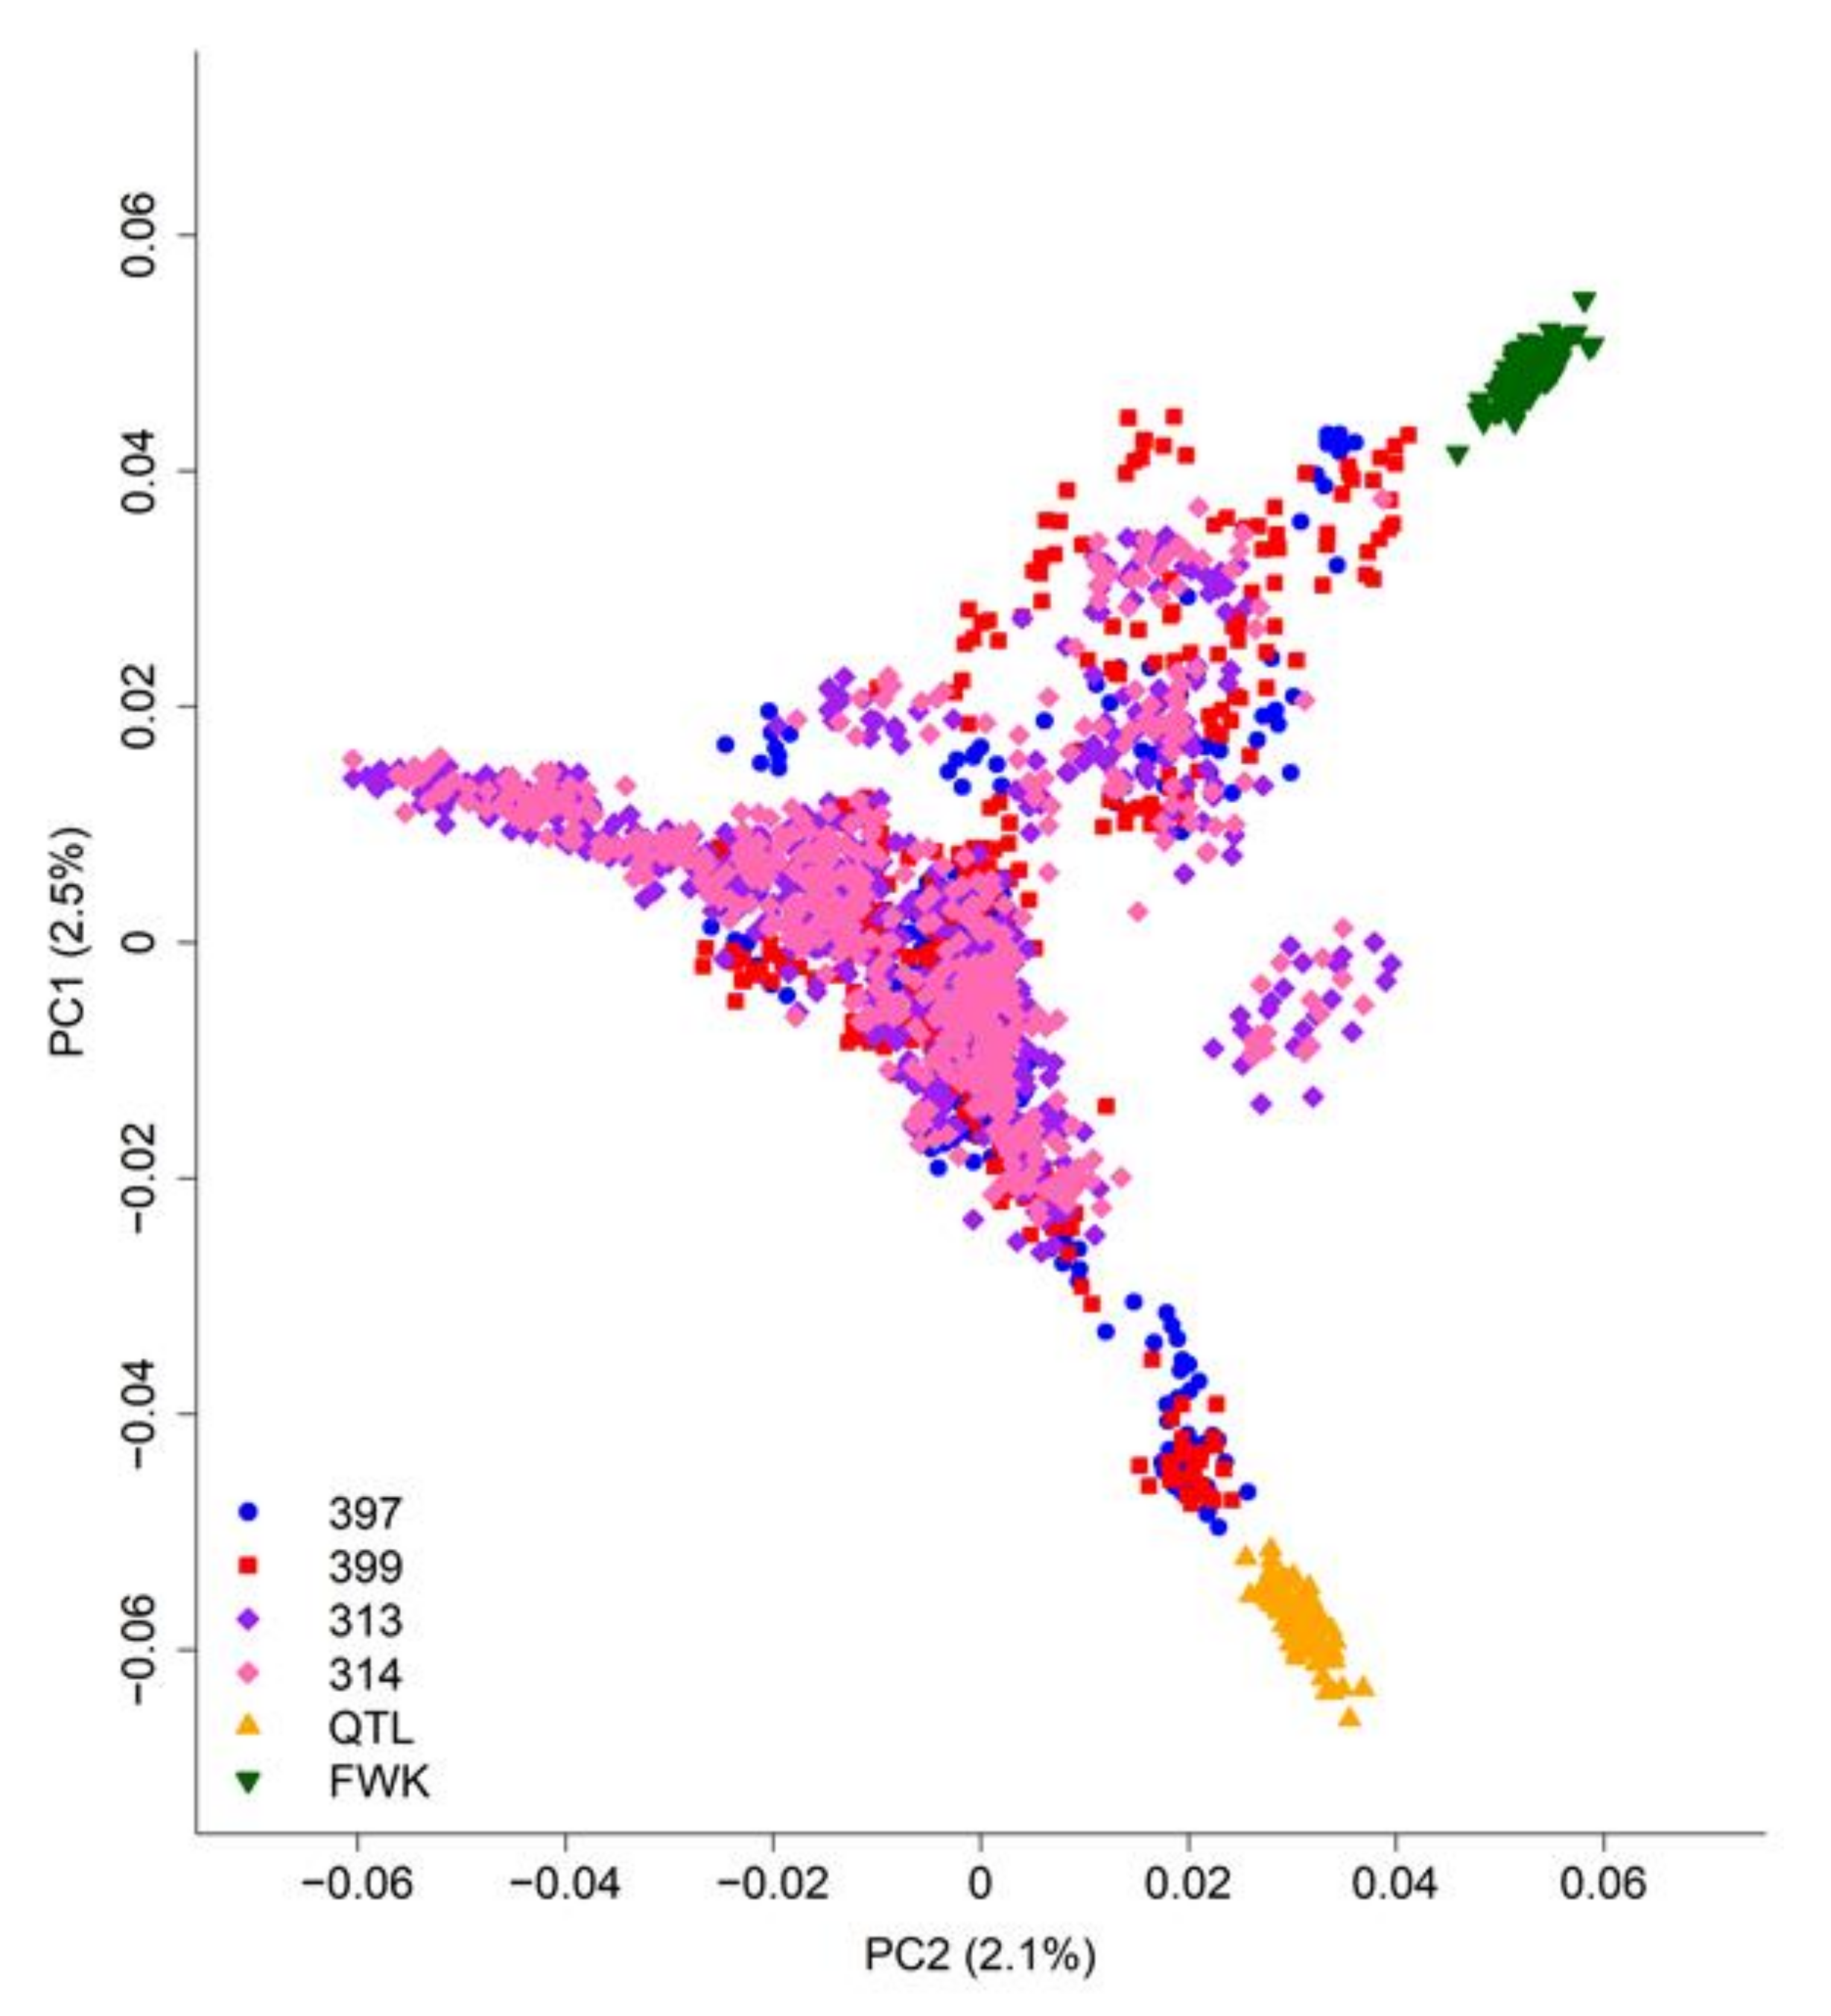
2.3.1. Population Structure
2.3.2. Pedigree Reconstruction
2.3.3. Genomic Prediction (GBLUP)
2.3.4. Pedigree-Based and Single-Step Blended Prediction (ABLUP and HBLUP)
3. Results
3.1. Population Structure
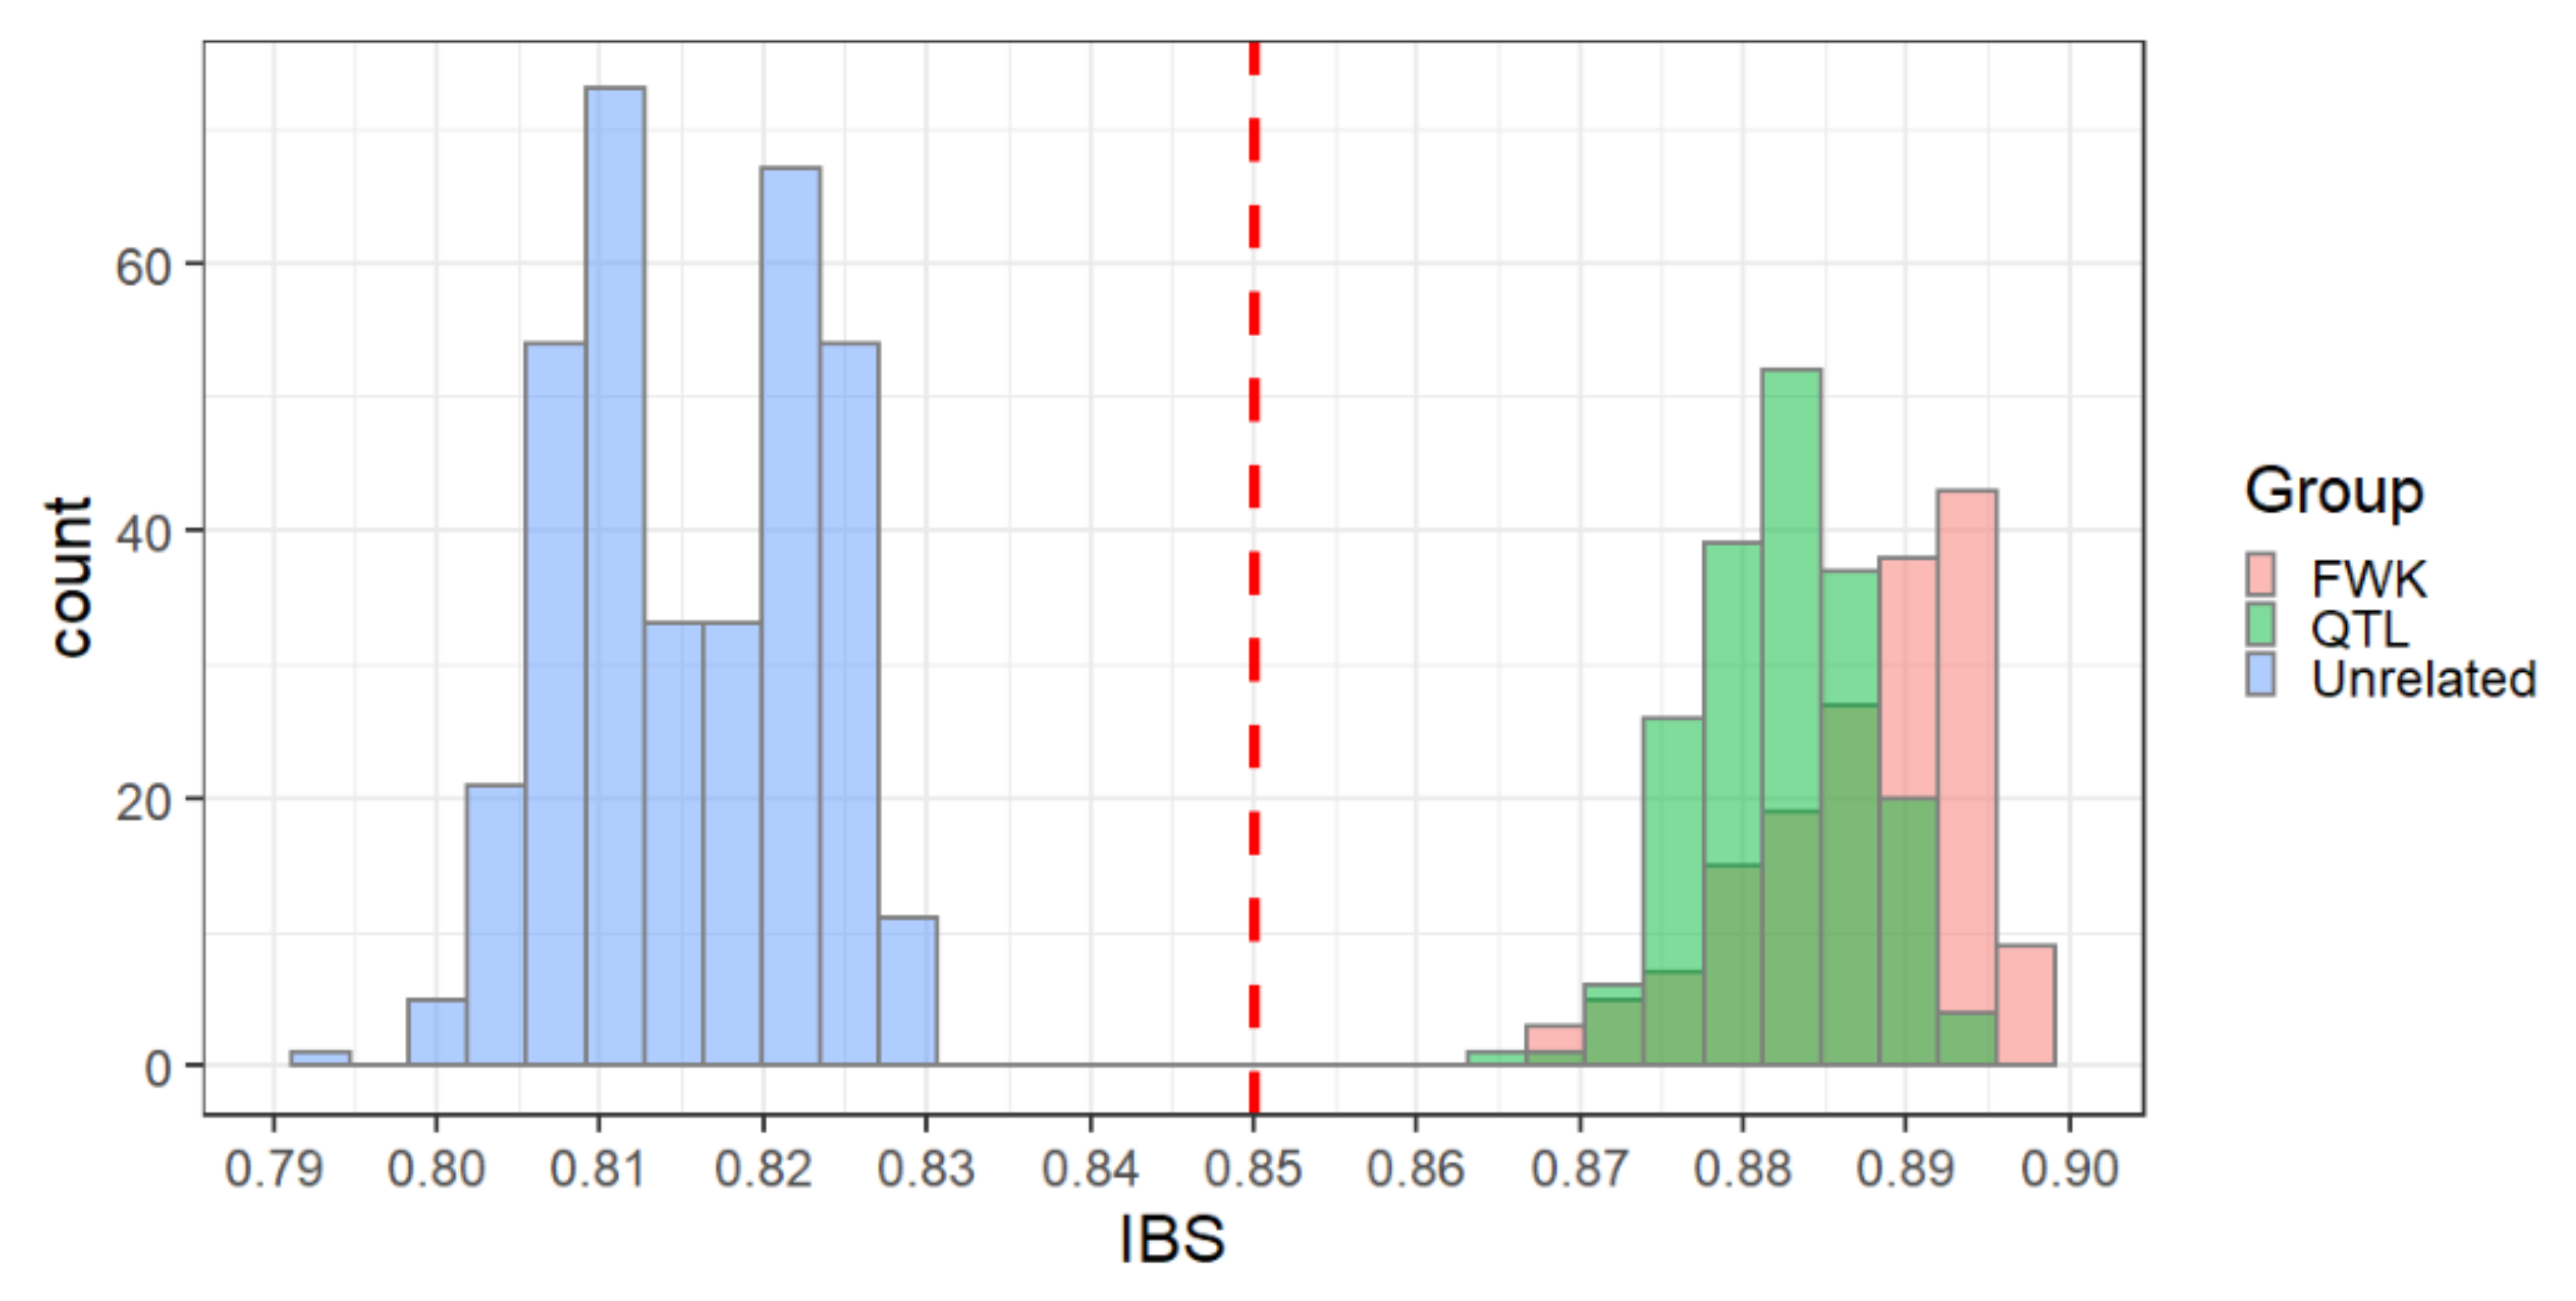
3.2. Pedigree Reconstruction
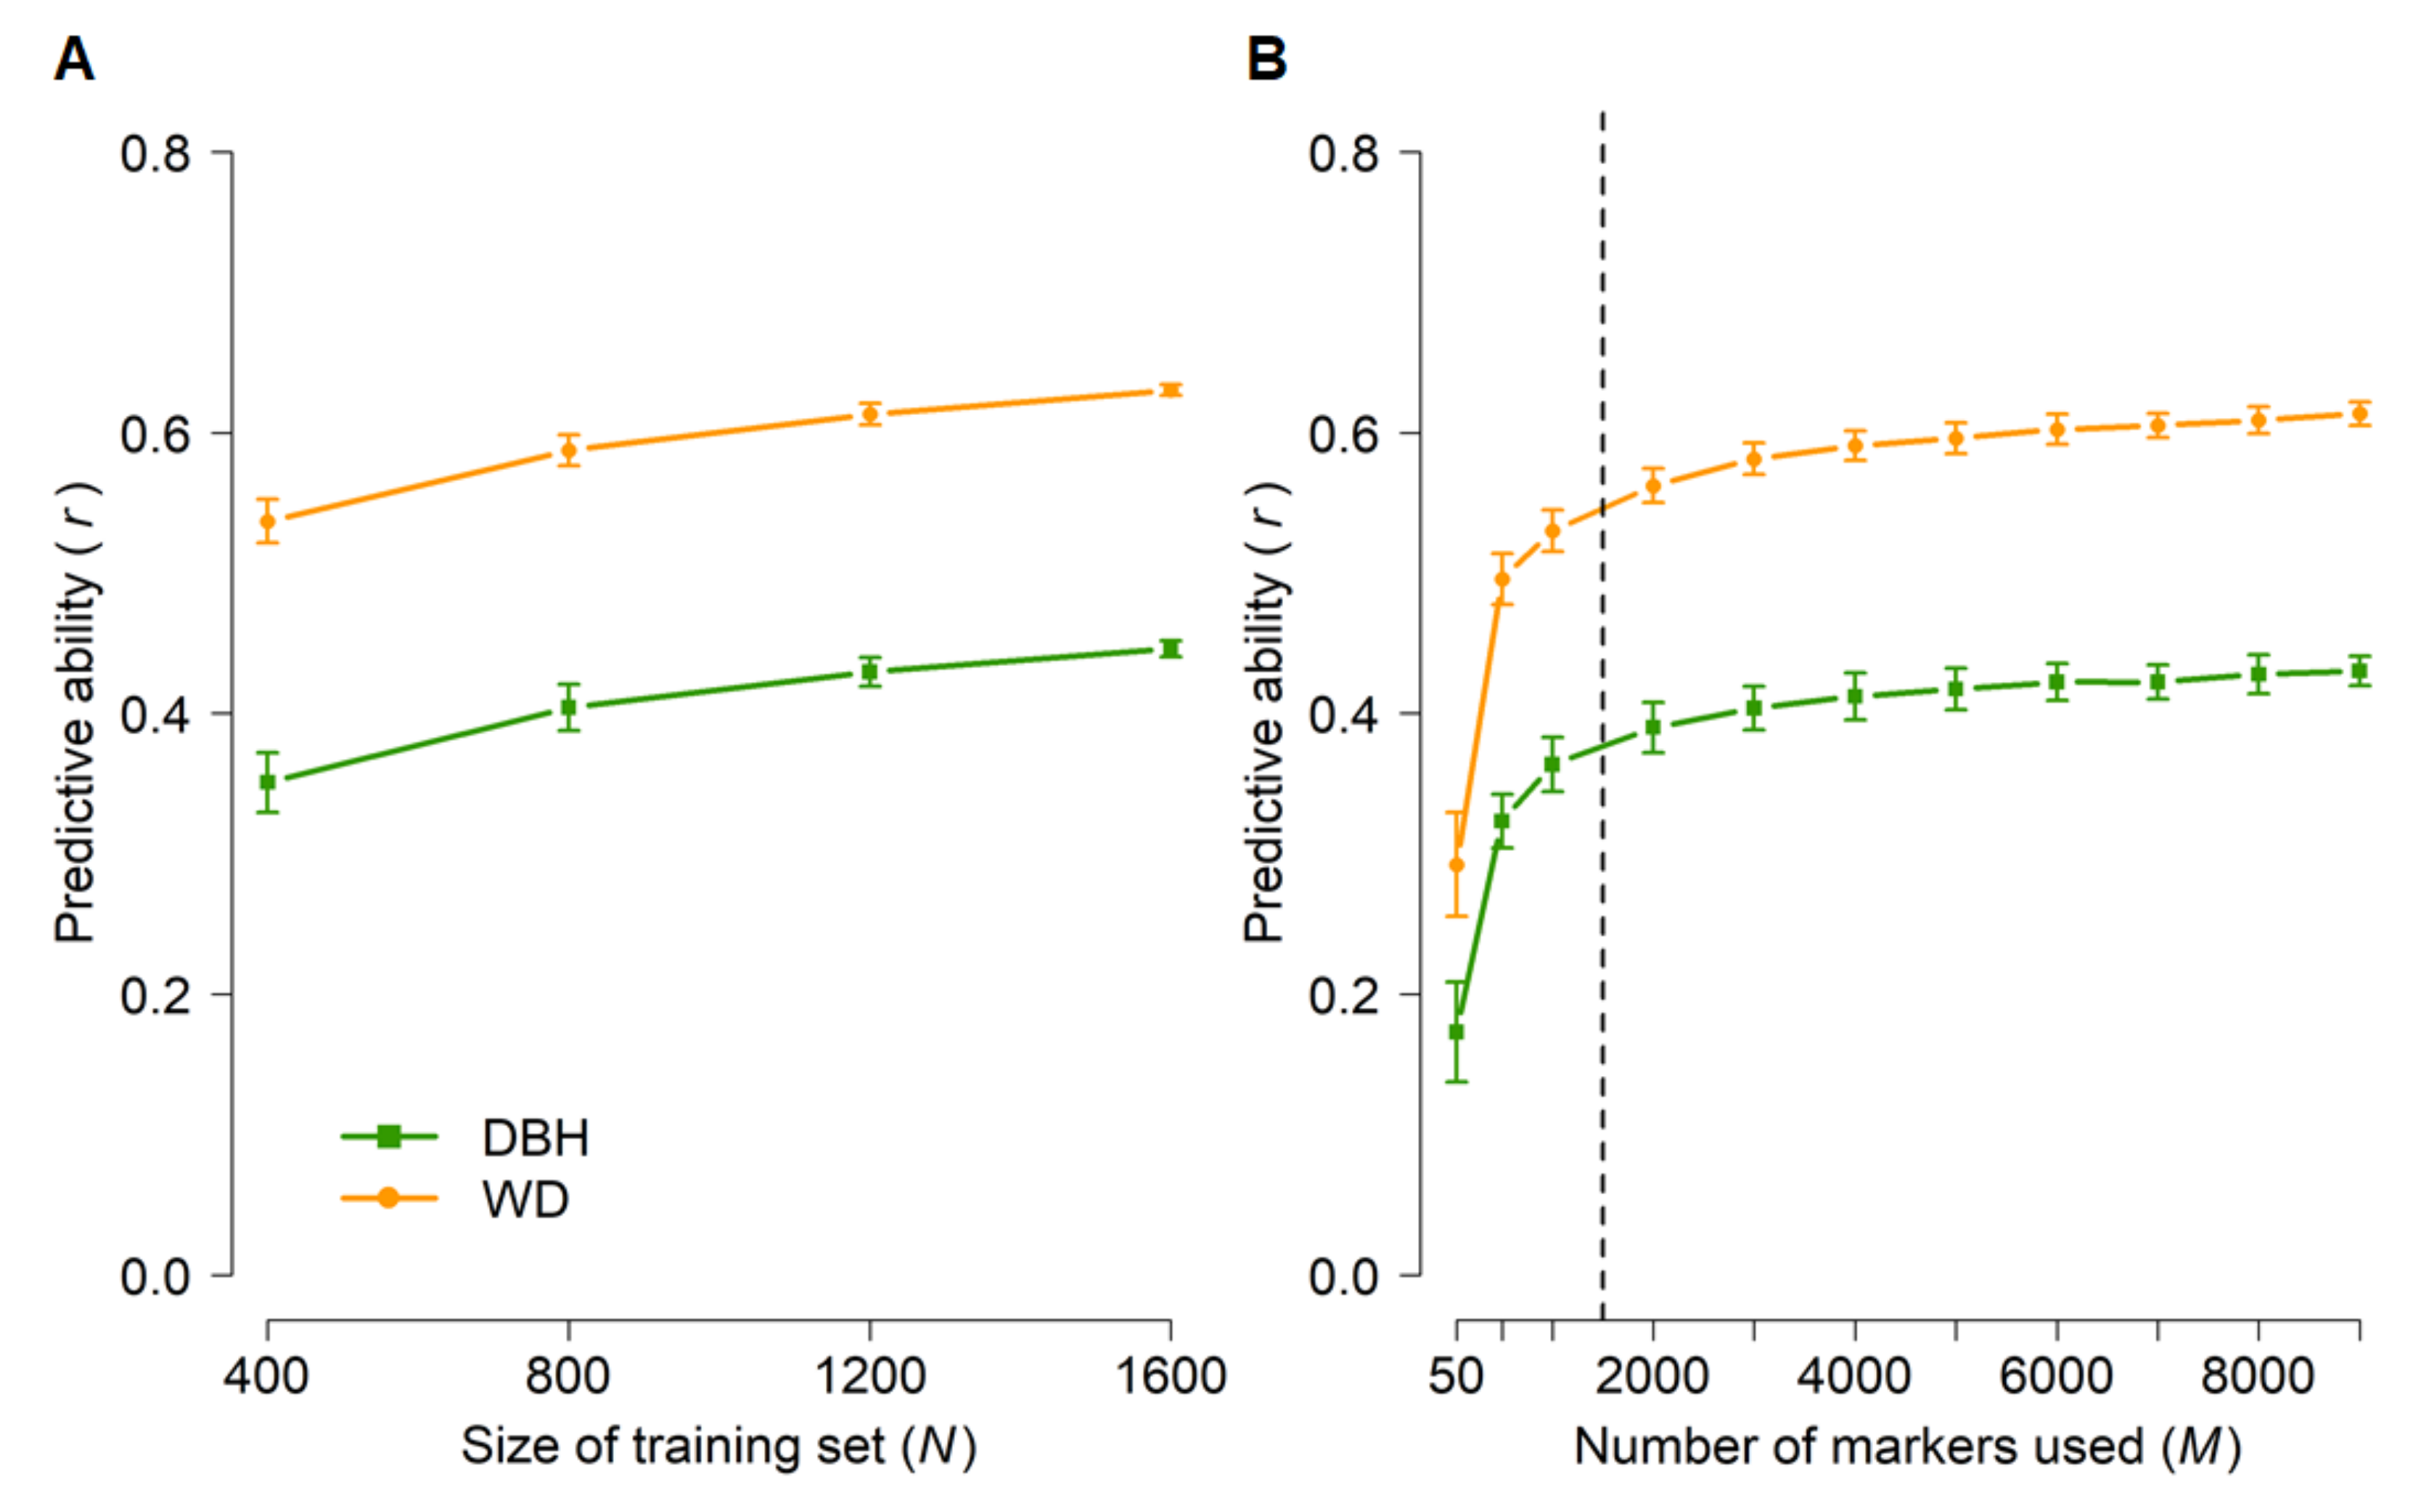
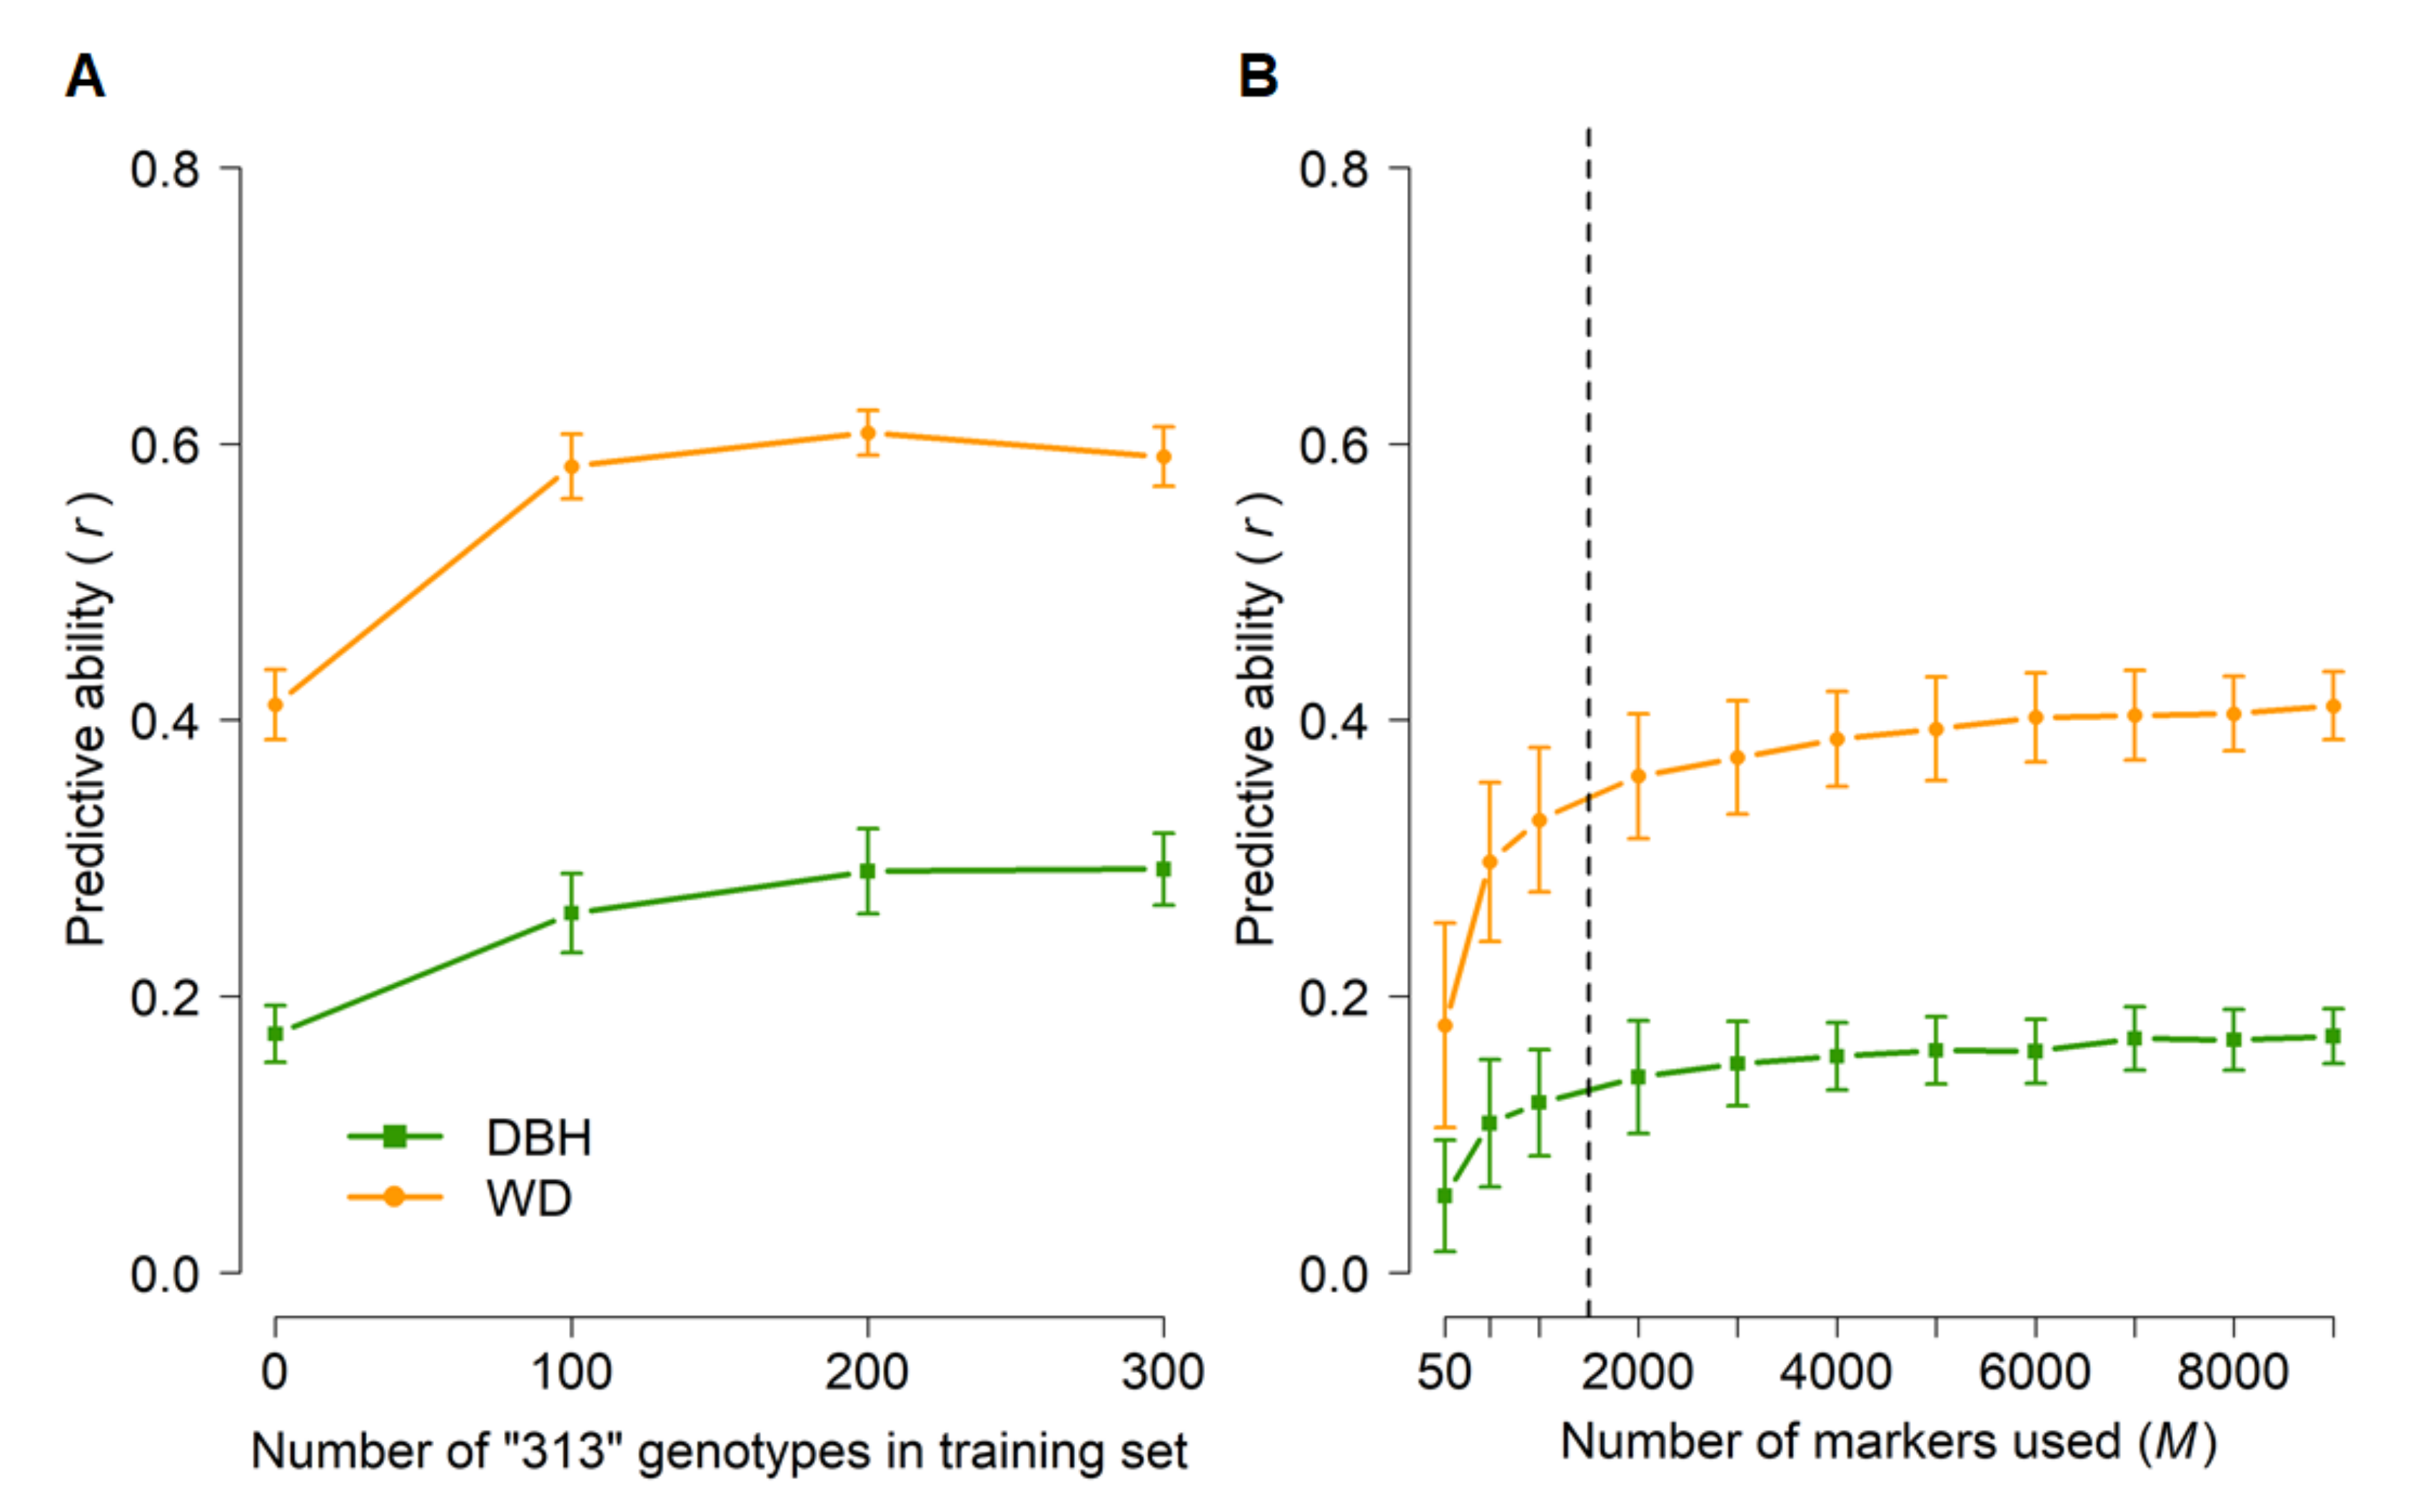
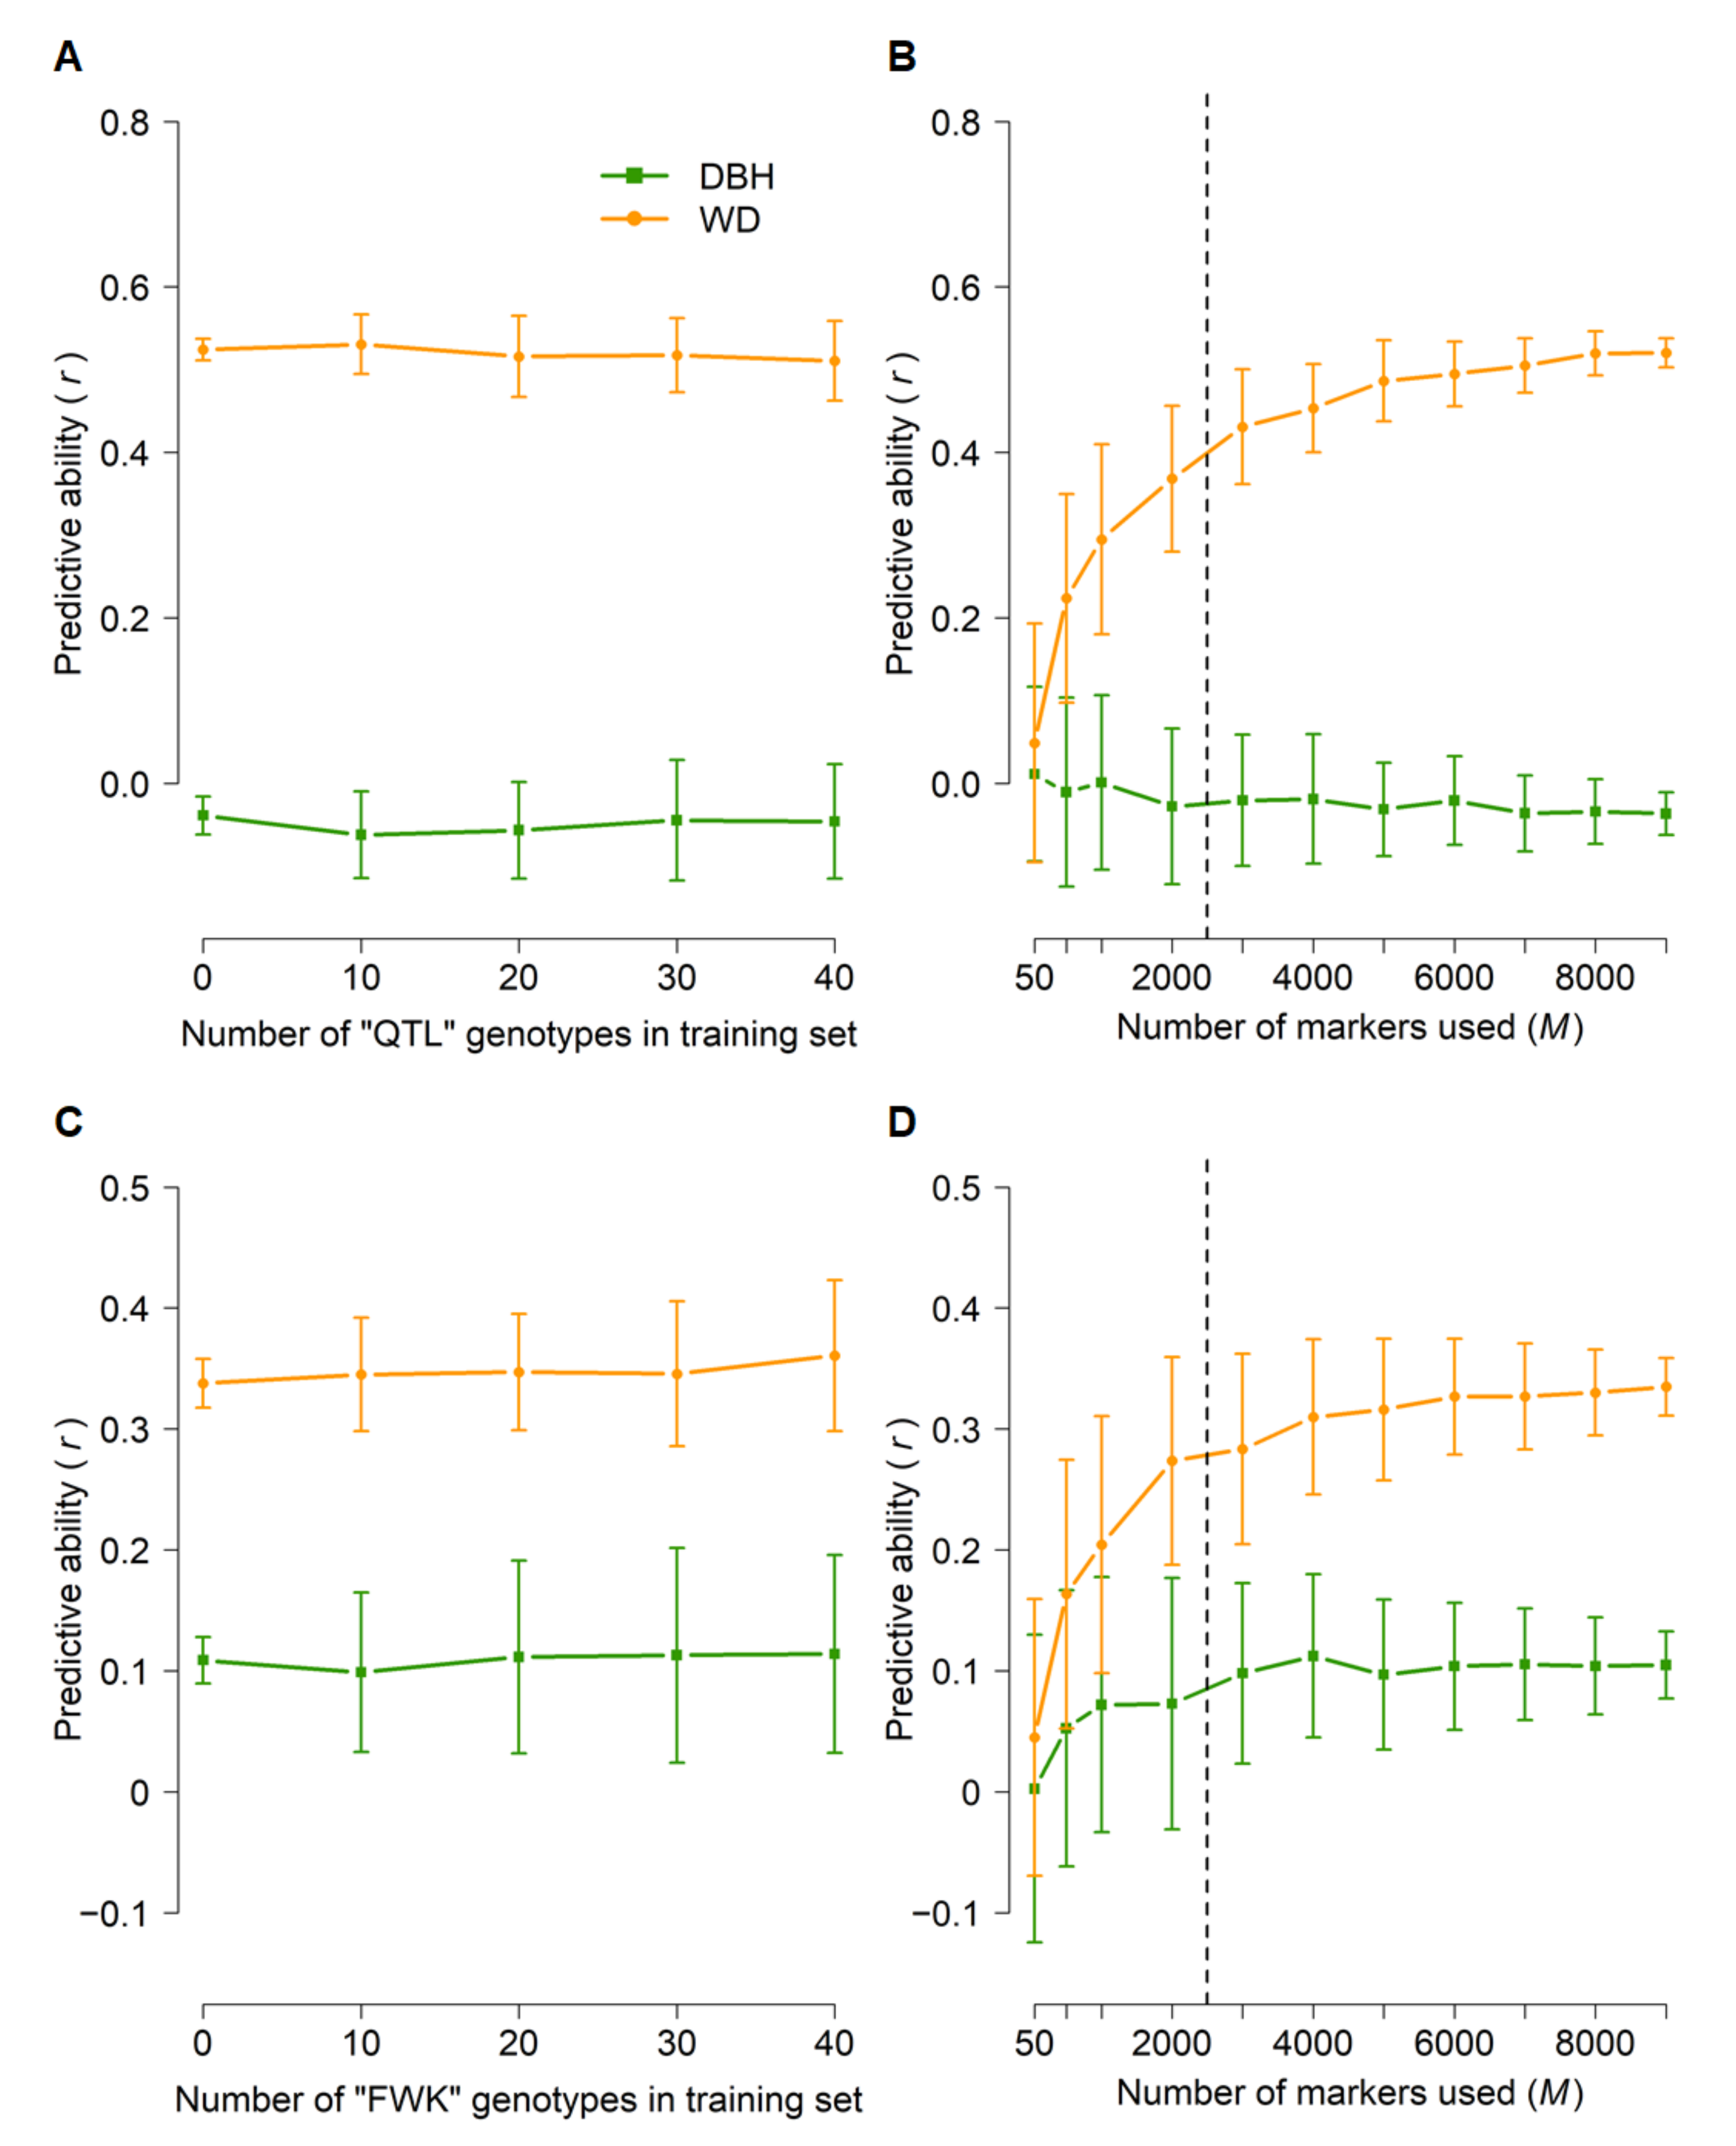
3.3. Genomic Prediction (GBLUP)
3.4. Pedigree-Based and Single-Step Blended Prediction (ABLUP and HBLUP)
4. Discussion
4.1. Population Structure, Pedigree Reconstruction, and Control of Inbreeding
4.2. Genomic Prediction (GBLUP)
4.3. Single-Step Blended Prediction (HBLUP)
5. Conclusions
Supplementary Materials
Author Contributions
Funding
Data Availability Statement
Acknowledgments
Conflicts of Interest
References
- Crowther, T.W.; Glick, H.B.; Covey, K.R.; Bettigole, C.; Maynard, D.S.; Thomas, S.M.; Smith, J.R.; Hintler, G.; Duguid, M.C.; Amatulli, G.; et al. Mapping tree density at a global scale. Nature 2015, 525, 201–205. [Google Scholar] [CrossRef]
- Curtis, P.G.; Slay, C.M.; Harris, N.L.; Tyukavina, A.; Hansen, M.C. Classifying drivers of global forest loss. Science 2018, 361, 1108. [Google Scholar] [CrossRef] [PubMed]
- Klein, T.; Hartmann, H. Climate change drives tree mortality. Science 2018, 362, 758. [Google Scholar] [CrossRef]
- Brooks, D.J. The outlook for demand and supply of wood: Implications for policy and sustainable management. Commonw. For. Rev. 1997, 76, 31–36. [Google Scholar]
- D’Amato, D.; Veijonaho, S.; Toppinen, A. Towards sustainability? Forest-based circular bioeconomy business models in Finnish SMEs. For. Policy Econ. 2020, 110, 101848. [Google Scholar] [CrossRef]
- FAO. The State of the World’s Forests 2018—Forest Pathways to Sustainable Development; FAO: Rome, Italy, 2018. [Google Scholar]
- Namkoong, G. Introduction to Quantitative Genetics in Forestry; USDA: Washington, DC, USA, 1979.
- White, T.L.; Adams, W.T.; Neale, D.B. Forest Genetics; CAB International: Wallingford, UK, 2007. [Google Scholar]
- Gray, L.K.; Gylander, T.; Mbogga, M.S.; Chen, P.Y.; Hamann, A. Assisted migration to address climate change: Recommendations for aspen reforestation in western Canada. Ecol. Appl. 2011, 21, 1591–1603. [Google Scholar] [CrossRef] [PubMed]
- Aitken, S.N.; Bemmels, J.B. Time to get moving: Assisted gene flow of forest trees. Evol. Appl. 2016, 9, 271–290. [Google Scholar] [CrossRef] [PubMed]
- O’Neill, G.; Wang, T.; Ukrainetz, N.; Charleson, L.; McAuley, L.; Yanchuk, A.; Zedel, S. A Proposed Climate-Based Seed Transfer System for British Columbia; Technical Report; Ministry of Forests, Lands and Natural Resource Operations: Victoria, BC, Canada, 2017.
- Sáenz-Romero, C.; O’Neill, G.; Aitken, S.N.; Lindig-Cisneros, R. Assisted Migration Field Tests in Canada, and Mexico: Lessons, Limitations, and Challenges. Forests 2021, 12, 9. [Google Scholar] [CrossRef]
- Savolainen, O.; Pyhäjärvi, T. Genomic diversity in forest trees. Curr. Opin. Plant Biol. 2007, 10, 162–167. [Google Scholar] [CrossRef] [PubMed]
- Meuwissen, T.H.; Sonesson, A.K.; Gebregiwergis, G.; Woolliams, J.A. Management of Genetic Diversity in the Era of Genomics. Front. Genet. 2020, 11, 880. [Google Scholar] [CrossRef]
- Wang, J. Pedigrees, or markers: Which are better in estimating relatedness and inbreeding coefficient? Theor. Popul. Biol. 2016, 107, 4–13. [Google Scholar] [CrossRef] [PubMed]
- Evans, L.M.; Slavov, G.T.; Rodgers-Melnick, E.; Martin, J.; Ranjan, P.; Muchero, W.; Brunner, A.M.; Schackwitz, W.; Gunter, L.; Chen, J.G.; et al. Population genomics of Populus trichocarpa identifies signatures of selection and adaptive trait associations. Nat. Genet. 2014, 46, 1089. [Google Scholar] [CrossRef] [PubMed] [Green Version]
- McKown, A.D.; Klápště, J.; Guy, R.D.; Geraldes, A.; Porth, I.; Hannemann, J.; Friedmann, M.; Muchero, W.; Tuskan, G.A.; Ehlting, J.; et al. Genome-wide association implicates numerous genes underlying ecological trait variation in natural populations of Populus trichocarpa. New Phytol. 2014, 203, 535–553. [Google Scholar] [CrossRef] [PubMed]
- Müller, B.S.; Neves, L.G.; de Almeida Filho, J.E.; Resende, M.F.; Muñoz, P.R.; Dos Santos, P.E.; Paludzyszyn Filho, E.; Kirst, M.; Grattapaglia, D. Genomic prediction in contrast to a genome-wide association study in explaining heritable variation of complex growth traits in breeding populations of Eucalyptus. BMC Genom. 2017, 18, 524. [Google Scholar] [CrossRef] [Green Version]
- McKown, A.D.; Klápště, J.; Guy, R.D.; El-Kassaby, Y.A.; Mansfield, S.D. Ecological genomics of variation in bud-break phenology and mechanisms of response to climate warming in Populus trichocarpa. New Phytol. 2018, 220, 300–316. [Google Scholar] [CrossRef] [Green Version]
- El-Dien, O.G.; Ratcliffe, B.; Klápště, J.; Chen, C.; Porth, I.; El-Kassaby, Y.A. Prediction accuracies for growth and wood attributes of interior spruce in space using genotyping-by-sequencing. BMC Genom. 2015, 16, 370. [Google Scholar] [CrossRef] [Green Version]
- Ratcliffe, B.; El-Dien, O.G.; Klápště, J.; Porth, I.; Chen, C.; Jaquish, B.; El-Kassaby, Y. A comparison of genomic selection models across time in interior spruce (Picea engelmannii × glauca) using unordered SNP imputation methods. Heredity 2015, 115, 547–555. [Google Scholar] [CrossRef] [Green Version]
- Thistlethwaite, F.R.; Ratcliffe, B.; Klápště, J.; Porth, I.; Chen, C.; Stoehr, M.U.; El-Kassaby, Y.A. Genomic selection of juvenile height across a single-generational gap in Douglas-fir. Heredity 2019, 122, 848–863. [Google Scholar] [CrossRef] [Green Version]
- Grattapaglia, D.; Silva-Junior, O.B.; Resende, R.T.; Cappa, E.P.; Müller, B.S.; Tan, B.; Isik, F.; Ratcliffe, B.; El-Kassaby, Y.A. Quantitative genetics and genomics converge to accelerate forest tree breeding. Front. Plant Sci. 2018, 9, 1693. [Google Scholar] [CrossRef]
- Ratcliffe, B.; El-Dien, O.G.; Cappa, E.P.; Porth, I.; Klápště, J.; Chen, C.; El-Kassaby, Y.A. Single-step BLUP with varying genotyping effort in open-pollinated Picea glauca. G3 Genes Genomes Genet. 2017, 7, 935–942. [Google Scholar] [CrossRef] [Green Version]
- Misztal, I.; Legarra, A.; Aguilar, I. Computing procedures for genetic evaluation including phenotypic, full pedigree, and genomic information. J. Dairy Sci. 2009, 92, 4648–4655. [Google Scholar] [CrossRef] [PubMed] [Green Version]
- Legarra, A.; Aguilar, I.; Misztal, I. A relationship matrix including full pedigree and genomic information. J. Dairy Sci. 2009, 92, 4656–4663. [Google Scholar] [CrossRef] [PubMed] [Green Version]
- Dungey, H.; Brawner, J.T.; Burger, F.; Carson, M.; Henson, M.; Jefferson, P.; Matheson, A. A new breeding strategy for Pinus radiata in New Zealand and New South Wales. Silvae Genet. 2009, 58, 28–38. [Google Scholar] [CrossRef] [Green Version]
- Smith, D.M. Maximum Moisture Content Method for Determining Specific Gravity of Small Wood Samples; USDA: Madison, WI, USA, 1954.
- Neves, L.G.; Davis, J.M.; Barbazuk, W.B.; Kirst, M. Whole-exome targeted sequencing of the uncharacterized pine genome. Plant J. 2013, 75, 146–156. [Google Scholar] [CrossRef] [PubMed]
- Telfer, E.; Graham, N.; Macdonald, L.; Sturrock, S.; Wilcox, P.; Stanbra, L. Approaches to variant discovery for conifer transcriptome sequencing. PLoS ONE 2018, 13, e0205835. [Google Scholar] [CrossRef] [PubMed] [Green Version]
- Telfer, E.; Graham, N.; Macdonald, L.; Li, Y.; Klápště, J.; Resende, M., Jr.; Neves, L.G.; Dungey, H.; Wilcox, P. A high-density exome capture genotype-by-sequencing panel for forestry breeding in Pinus radiata. PLoS ONE 2019, 14, e0222640. [Google Scholar] [CrossRef] [Green Version]
- Graham, N.; Telfer, E.; Frickey, T.; Slavov, G.; Ismael, A.; Klápště, J.; Dungey, H. Development and Validation of a 36K SNP Array for radiata pine (Pinus radiata D. Don). Forests 2022, 13, 176. [Google Scholar] [CrossRef]
- Patterson, N.; Price, A.L.; Reich, D. Population structure and eigenanalysis. PLoS Genet. 2006, 2, e190. [Google Scholar] [CrossRef]
- Coster, A.; Coster, M.A. Package ‘Pedigree’. R Package Version 2010, 1. Available online: http://cran.r-project.org/web/packages/pedigree/pedigree.pdf (accessed on 12 December 2021).
- Purcell, S.; Neale, B.; Todd-Brown, K.; Thomas, L.; Ferreira, M.A.; Bender, D.; Maller, J.; Sklar, P.; De Bakker, P.I.; Daly, M.J. PLINK: A tool set for whole-genome association and population-based linkage analyses. Am. J. Hum. Genet. 2007, 81, 559–575. [Google Scholar] [CrossRef] [Green Version]
- Chang, C.C.; Chow, C.C.; Tellier, L.C.; Vattikuti, S.; Purcell, S.M.; Lee, J.J. Second-generation PLINK: Rising to the challenge of larger and richer datasets. Gigascience 2015, 4, 7. [Google Scholar] [CrossRef]
- Gao, X.; Martin, E.R. Using allele sharing distance for detecting human population stratification. Hum. Hered. 2009, 68, 182–191. [Google Scholar] [CrossRef] [PubMed] [Green Version]
- Fradgley, N.; Gardner, K.A.; Cockram, J.; Elderfield, J.; Hickey, J.M.; Howell, P.; Jackson, R.; Mackay, I.J. A large-scale pedigree resource of wheat reveals evidence for adaptation and selection by breeders. PLoS Biol. 2019, 17, e3000071. [Google Scholar] [CrossRef] [PubMed] [Green Version]
- Kumar, S.; Spelman, R.; Garrick, D.; Richardson, T.; Lausberg, M.; Wilcox, P. Multiple-marker mapping of wood density loci in an outbred pedigree of radiata pine. Theor. Appl. Genet. 2000, 100, 926–933. [Google Scholar] [CrossRef]
- Melo, A.T.; Hale, I. ‘Apparent’: A simple and flexible R package for accurate SNP-based parentage analysis in the absence of guiding information. BMC Bioinform. 2019, 20, 108. [Google Scholar] [CrossRef] [PubMed] [Green Version]
- Meuwissen, T.H.; Hayes, B.J.; Goddard, M.E. Prediction of total genetic value using genome-wide dense marker maps. Genetics 2001, 157, 1819–1829. [Google Scholar] [CrossRef]
- de Los Campos, G.; Hickey, J.M.; Pong-Wong, R.; Daetwyler, H.D.; Calus, M.P. Whole-genome regression and prediction methods applied to plant and animal breeding. Genetics 2013, 193, 327–345. [Google Scholar] [CrossRef] [Green Version]
- Endelman, J.B. Ridge regression and other kernels for genomic selection with R package rrBLUP. Plant Genome 2011, 4, 250–255. [Google Scholar] [CrossRef] [Green Version]
- Bates, D.; Maechler, M.; Bolker, B. lme4: Linear Mixed-Effects Models Using S4 Classes; R Package Version 0.999375-42. 2011. Available online: https://cran.r-project.org/package=lme4 (accessed on 12 December 2021).
- Bates, D.; Mächler, M.; Bolker, B.; Walker, S. Fitting linear mixed-effects models using lme4. J. Stat. Softw. 2015, 67, 1–48. [Google Scholar] [CrossRef]
- VanRaden, P.M. Efficient methods to compute genomic predictions. J. Dairy Sci. 2008, 91, 4414–4423. [Google Scholar] [CrossRef] [Green Version]
- Slavov, G.T.; Nipper, R.; Robson, P.; Farrar, K.; Allison, G.G.; Bosch, M.; Clifton-Brown, J.C.; Donnison, I.S.; Jensen, E. Genomewide association studies and prediction of 17 traits related to phenology, biomass and cell wall composition in the energy grass Miscanthus Sinensis. New Phytol. 2014, 201, 1227–1239. [Google Scholar] [CrossRef] [Green Version]
- Munoz, F.; Rodriguez, L.S. Breedr: Statistical Methods for Forest Genetic Resources Analysts. Trees for the Future: Plant Material in a Changing Climate. In Proceedings of the 3rd Annual Meeting for Forest Genetic Resources Analysis, Tulln, Austria, 17–21 November 2015; p. 13. [Google Scholar]
- Wright, S. Coefficient of inbreeding and relatedness. Am. Nat. 1922, 56, 330–338. [Google Scholar] [CrossRef] [Green Version]
- Powell, J.E.; Visscher, P.M.; Goddard, M.E. Reconciling the analysis of IBD and IBS in complex trait studies. Nat. Rev. Genet. 2010, 11, 800–805. [Google Scholar] [CrossRef] [PubMed]
- Vitezica, Z.G.; Aguilar, I.; Misztal, I.; Legarra, A. Bias in genomic predictions for populations under selection. Genet. Res. 2011, 93, 357–366. [Google Scholar] [CrossRef] [PubMed]
- Gao, H.; Christensen, O.F.; Madsen, P.; Nielsen, U.S.; Zhang, Y.; Lund, M.S.; Su, G. Comparison on genomic predictions using three GBLUP methods and two single step blending methods in the Nordic Holstein population. Genet. Sel. Evol. 2012, 44, 8. [Google Scholar] [CrossRef] [Green Version]
- Davey, J.W.; Hohenlohe, P.A.; Etter, P.D.; Boone, J.Q.; Catchen, J.M.; Blaxter, M.L. Genome-wide genetic marker discovery and genotyping using next-generation sequencing. Nat. Rev. Genet. 2011, 12, 499–510. [Google Scholar] [CrossRef]
- Ma, Y.; Wang, J.; Hu, Q.; Li, J.; Sun, Y.; Zhang, L.; Abbott, R.J.; Liu, J.; Mao, K. Ancient introgression drives adaptation to cooler and drier mountain habitats in a cypress species complex. Commun. Biol. 2019, 2, 213. [Google Scholar] [CrossRef]
- Capblancq, T.; Butnor, J.R.; Deyoung, S.; Thibault, E.; Munson, H.; Nelson, D.M.; Fitzpatrick, M.C.; Keller, S.R. Whole-exome sequencing reveals a long-term decline in effective population size of red spruce (Picea rubens). Evol. Appl. 2020, 13, 2190–2205. [Google Scholar] [CrossRef]
- Evans, L.M.; Allan, G.J.; DiFazio, S.P.; Slavov, G.T.; Wilder, J.A.; Floate, K.D.; Rood, S.B.; Whitham, T.G. Geographical barriers and climate influence demographic history in narrowleaf cottonwoods. Heredity 2015, 114, 387–396. [Google Scholar] [CrossRef] [Green Version]
- Doerksen, T.K.; Herbinger, C.M. Impact of reconstructed pedigrees on progeny-test breeding values in red spruce. Tree Genet. Genomes 2010, 6, 591–600. [Google Scholar] [CrossRef]
- Lenz, P.R.; Beaulieu, J.; Mansfield, S.D.; Clément, S.; Desponts, M.; Bousquet, J. Factors affecting the accuracy of genomic selection for growth and wood quality traits in an advanced-breeding population of black spruce (Picea mariana). BMC Genom. 2017, 18, 1–17. [Google Scholar] [CrossRef]
- Visscher, P.M.; Brown, M.A.; McCarthy, M.I.; Yang, J. Five years of GWAS discovery. Am. J. Hum. Genet. 2012, 90, 7–24. [Google Scholar] [CrossRef] [PubMed] [Green Version]
- Hall, D.; Hallingbäck, H.R.; Wu, H.X. Estimation of number and size of QTL effects in forest tree traits. Tree Genet. Genomes 2016, 12, 110. [Google Scholar] [CrossRef] [Green Version]
- Visscher, P.M.; Wray, N.R.; Zhang, Q.; Sklar, P.; McCarthy, M.I.; Brown, M.A.; Yang, J. 10 years of GWAS discovery: Biology, function, and translation. Am. J. Hum. Genet. 2017, 101, 5–22. [Google Scholar] [CrossRef] [Green Version]
- Zobel, B.; Talbert, J. Applied Forest Tree Improvement; John Wiley & Sons: Hoboken, NJ, USA, 1984. [Google Scholar]
- Namkoong, G.; Kang, H.C.; Brouard, J.S. Tree Breeding: Principles and Strategies; Springer: Berlin/Heidelberg, Germany, 1988. [Google Scholar]
- Lambeth, C.; Lee, B.C.; O’Malley, D.; Wheeler, N. Polymix breeding with parental analysis of progeny: An alternative to full-sib breeding and testing. Theor. Appl. Genet. 2001, 103, 930–943. [Google Scholar] [CrossRef]
- de Cara, M.Á.R.; Villanueva, B.; Toro, M.Á.; Fernández, J. Using genomic tools to maintain diversity and fitness in conservation programmes. Mol. Ecol. 2013, 22, 6091–6099. [Google Scholar] [CrossRef]
- El-Kassaby, Y.A.; Cappa, E.P.; Liewlaksaneeyanawin, C.; Klápště, J.; Lstibůrek, M. Breeding without breeding: Is a complete pedigree necessary for efficient breeding? PLoS ONE 2011, 6, e25737. [Google Scholar] [CrossRef] [Green Version]
- Vidal, M.; Plomion, C.; Raffin, A.; Harvengt, L.; Bouffier, L. Forward selection in a maritime pine polycross progeny trial using pedigree reconstruction. Ann. For. Sci. 2017, 74, 21. [Google Scholar] [CrossRef] [Green Version]
- Burdon, R.D.; Wilcox, P.L. Population management: Potential impacts of advances in genomics. New For. 2007, 34, 187–206. [Google Scholar] [CrossRef]
- Bouffier, L.; Klápště, J.; Suontama, M.; Dungey, H.S.; Mullin, T.J. Evaluation of forest tree breeding strategies based on partial pedigree reconstruction through simulations: Pinus pinaster and Eucalyptus nitens as case studies. Can. J. For. Res. 2019, 49, 1504–1515. [Google Scholar] [CrossRef]
- Klápště, J.; Suontama, M.; Telfer, E.; Graham, N.; Low, C.; Stovold, T.; McKinley, R.; Dungey, H. Exploration of genetic architecture through sib-ship reconstruction in advanced breeding population of Eucalyptus nitens. PLoS ONE 2017, 12, e0185137. [Google Scholar] [CrossRef] [PubMed] [Green Version]
- Chen, Z.Q.; Baison, J.; Pan, J.; Karlsson, B.; Andersson, B.; Westin, J.; García-Gil, M.R.; Wu, H.X. Accuracy of genomic selection for growth and wood quality traits in two control-pollinated progeny trials using exome capture as the genotyping platform in Norway spruce. BMC Genom. 2018, 19, 946. [Google Scholar] [CrossRef] [Green Version]
- Geraldes, A.; DiFazio, S.; Slavov, G.; Ranjan, P.; Muchero, W.; Hannemann, J.; Gunter, L.; Wymore, A.; Grassa, C.; Farzaneh, N.; et al. A 34K SNP genotyping array for Populus trichocarpa: Design, application to the study of natural populations and transferability to other Populus species. Mol. Ecol. Resour. 2013, 13, 306–323. [Google Scholar] [CrossRef] [PubMed]
- Silva-Junior, O.B.; Faria, D.A.; Grattapaglia, D. A flexible multi-species genome-wide 60K SNP chip developed from pooled resequencing of 240 Eucalyptus tree genomes across 12 species. New Phytol. 2015, 206, 1527–1540. [Google Scholar] [CrossRef] [PubMed] [Green Version]
- Visscher, P.M.; Medland, S.E.; Ferreira, M.A.; Morley, K.I.; Zhu, G.; Cornes, B.K.; Montgomery, G.W.; Martin, N.G. Assumption-free estimation of heritability from genome-wide identity-by-descent sharing between full siblings. PLoS Genet. 2006, 2, e41. [Google Scholar] [CrossRef] [PubMed]
- Habier, D.; Fernando, R.L.; Garrick, D.J. Genomic BLUP decoded: A look into the black box of genomic prediction. Genetics 2013, 194, 597–607. [Google Scholar] [CrossRef] [PubMed] [Green Version]
- Grattapaglia, D.; Resende, M.D. Genomic selection in forest tree breeding. Tree Genet. Genomes 2011, 7, 241–255. [Google Scholar] [CrossRef]
- Suontama, M.; Klápště, J.; Telfer, E.; Graham, N.; Stovold, T.; Low, C.; McKinley, R.; Dungey, H. Efficiency of genomic prediction across two Eucalyptus nitens seed orchards with different selection histories. Heredity 2019, 122, 370–379. [Google Scholar] [CrossRef] [PubMed] [Green Version]
- Ukrainetz, N.K.; Mansfield, S.D. Assessing the sensitivities of genomic selection for growth and wood quality traits in lodgepole pine using Bayesian models. Tree Genet. Genomes 2020, 16, 14. [Google Scholar] [CrossRef]
- Scutari, M.; Mackay, I.; Balding, D. Using genetic distance to infer the accuracy of genomic prediction. PLoS Genet. 2016, 12, e1006288. [Google Scholar] [CrossRef] [PubMed]
- Solberg, T.R.; Sonesson, A.K.; Woolliams, J.A.; Ødegard, J.; Meuwissen, T.H. Persistence of accuracy of genome-wide breeding values over generations when including a polygenic effect. Genet. Sel. Evol. 2009, 41, 53. [Google Scholar] [CrossRef] [Green Version]
- Jonas, E.; de Koning, D.J. Does genomic selection have a future in plant breeding? Trends Biotechnol. 2013, 31, 497–504. [Google Scholar] [CrossRef] [PubMed]
- Bartholomé, J.; Van Heerwaarden, J.; Isik, F.; Boury, C.; Vidal, M.; Plomion, C.; Bouffier, L. Performance of genomic prediction within and across generations in maritime pine. BMC Genom. 2016, 17, 604. [Google Scholar] [CrossRef]
- Makowsky, R.; Pajewski, N.M.; Klimentidis, Y.C.; Vazquez, A.I.; Duarte, C.W.; Allison, D.B.; de Los Campos, G. Beyond missing heritability: Prediction of complex traits. PLoS Genet. 2011, 7, e1002051. [Google Scholar] [CrossRef] [PubMed] [Green Version]
- Lello, L.; Avery, S.G.; Tellier, L.; Vazquez, A.I.; de Los Campos, G.; Hsu, S.D. Accurate genomic prediction of human height. Genetics 2018, 210, 477–497. [Google Scholar] [CrossRef] [PubMed] [Green Version]
- Klápště, J.; Suontama, M.; Dungey, H.S.; Telfer, E.J.; Graham, N.J.; Low, C.B.; Stovold, G.T. Effect of hidden relatedness on single-step genetic evaluation in an advanced open-pollinated breeding program. J. Hered. 2018, 109, 802–810. [Google Scholar] [CrossRef] [PubMed] [Green Version]
- Klápště, J.; Dungey, H.S.; Graham, N.J.; Telfer, E.J. Effect of trait’s expression level on single-step genomic evaluation of resistance to Dothistroma needle blight. BMC Plant Biol. 2020, 20, 205. [Google Scholar] [CrossRef] [PubMed]
- Berro, I.; Lado, B.; Nalin, R.S.; Quincke, M.; Gutiérrez, L. Training population optimization for genomic selection. Plant Genome 2019, 12, 190028. [Google Scholar] [CrossRef] [PubMed] [Green Version]
- Olatoye, M.O.; Clark, L.V.; Labonte, N.R.; Dong, H.; Dwiyanti, M.S.; Anzoua, K.G.; Brummer, J.E.; Ghimire, B.K.; Dzyubenko, E.; Dzyubenko, N.; et al. Training Population Optimization for Genomic Selection in Miscanthus. G3 Genes Genomes Genet. 2020, 10, 2465–2476. [Google Scholar] [CrossRef] [PubMed]


| Population | Description | Analysis | Number of Parents (Families) | Number of Genotyped Individuals | Number of Genotypes Used in GBLUP |
|---|---|---|---|---|---|
| 260 | Progeny test | ABLUP, HBLUP | 47 (26) | 0 | 0 |
| 313 | Cloned Elites | ABLUP, GBLUP, HBLUP | 55 (74) | 695 | 681 |
| 314 | Cloned Elites | ABLUP, HBLUP | 55 (75) | 609 | 0 |
| 397 | Older Clonal Tests | ABLUP, GBLUP, HBLUP | 64 (50) | 464 | 444 |
| 399 | Older Clonal Tests | ABLUP, GBLUP, HBLUP | 24 (42) | 522 | 469 |
| QTL | Mapping family (268,405 × 268,345) | GBLUP | 2 (1) | 93 | 86 |
| FWK | Mapping family (850,055 × 850,096) | GBLUP | 2 (1) | 83 | 81 |
| Total | 2466 | 1761 |
| Model | Pedigree | Unresolved Parentage | DBH | WD |
|---|---|---|---|---|
| ABLUP | Originally recorded | Originally recorded | 0.248 (0.009) | 0.409 (0.011) |
| ABLUP | Corrected | Originally recorded | 0.245 (0.009) | 0.488 (0.011) |
| ABLUP | Corrected | Unknown | 0.234 (0.009) | 0.467 (0.011) |
| HBLUP | Originally recorded | Originally recorded | 0.186 (0.001) | 0.436 (0.011) |
| HBLUP | Corrected | Originally recorded | 0.213 (0.009) | 0.435 (0.011) |
| HBLUP | Corrected | Unknown | 0.212 (0.009) | 0.434 (0.011) |
| Pedigree Option | Trial Series | ABLUP | HBLUP—Weight on Pedigree Information | |||||
|---|---|---|---|---|---|---|---|---|
| 0.05 | 0.1 | 0.2 | 0.3 | 0.4 | 0.5 | |||
| Originally recorded | FR260 | 0.227 | 0.221 | 0.221 | 0.221 | 0.223 | 0.224 | 0.224 |
| FR305GF | 0.441 | 0.382 | 0.391 | 0.404 | 0.414 | 0.421 | 0.428 | |
| FR305HD | 0.459 | 0.497 | 0.498 | 0.499 | 0.499 | 0.498 | 0.497 | |
| FR353 | 0.241 | 0.334 | 0.329 | 0.320 | 0.312 | 0.304 | 0.297 | |
| Cloned Elites | 0.121 | 0.200 | 0.199 | 0.199 | 0.198 | 0.196 | 0.193 | |
| Corrected, unresolved relationships as originally recorded | FR260 | 0.221 | 0.215 | 0.216 | 0.217 | 0.218 | 0.218 | 0.219 |
| FR305GF | 0.402 | 0.373 | 0.381 | 0.391 | 0.399 | 0.404 | 0.409 | |
| FR305HD | 0.460 | 0.497 | 0.497 | 0.498 | 0.498 | 0.497 | 0.496 | |
| FR353 | 0.241 | 0.333 | 0.330 | 0.324 | 0.319 | 0.313 | 0.306 | |
| Cloned Elites | 0.151 | 0.208 | 0.210 | 0.212 | 0.213 | 0.212 | 0.210 | |
| Corrected, unresolved relationships set as “unknown” | FR260 | 0.227 | 0.214 | 0.216 | 0.217 | 0.218 | 0.220 | 0.221 |
| FR305GF | 0.382 | 0.367 | 0.372 | 0.379 | 0.384 | 0.389 | 0.393 | |
| FR305HD | 0.462 | 0.496 | 0.498 | 0.499 | 0.500 | 0.500 | 0.498 | |
| FR353 | 0.274 | 0.332 | 0.331 | 0.328 | 0.326 | 0.323 | 0.320 | |
| Cloned Elites | 0.195 | 0.209 | 0.213 | 0.219 | 0.223 | 0.226 | 0.227 | |
| Pedigree Option | Trial Series | ABLUP | HBLUP—Weight on Pedigree Information | |||||
|---|---|---|---|---|---|---|---|---|
| 0.05 | 0.1 | 0.2 | 0.3 | 0.4 | 0.5 | |||
| Originally recorded | FR260 | 0.232 | 0.294 | 0.291 | 0.287 | 0.283 | 0.280 | 0.276 |
| FR305GF | 0.413 | 0.390 | 0.400 | 0.412 | 0.419 | 0.426 | 0.431 | |
| FR305HD | 0.396 | 0.411 | 0.415 | 0.419 | 0.421 | 0.421 | 0.421 | |
| FR353 | 0.318 | 0.431 | 0.435 | 0.438 | 0.437 | 0.435 | 0.430 | |
| Cloned Elites | 0.371 | 0.402 | 0.409 | 0.420 | 0.430 | 0.438 | 0.444 | |
| Corrected, unresolved relationships as originally recorded | FR260 | 0.316 | 0.304 | 0.305 | 0.306 | 0.306 | 0.306 | 0.307 |
| FR305GF | 0.412 | 0.389 | 0.400 | 0.413 | 0.420 | 0.425 | 0.428 | |
| FR305HD | 0.365 | 0.413 | 0.414 | 0.413 | 0.412 | 0.409 | 0.406 | |
| FR353 | 0.331 | 0.441 | 0.445 | 0.449 | 0.449 | 0.447 | 0.442 | |
| Cloned Elites | 0.392 | 0.403 | 0.409 | 0.418 | 0.426 | 0.432 | 0.438 | |
| Corrected, unresolved relationships set as “unknown” | FR260 | 0.334 | 0.327 | 0.328 | 0.329 | 0.329 | 0.330 | 0.330 |
| FR305GF | 0.415 | 0.369 | 0.380 | 0.393 | 0.402 | 0.408 | 0.412 | |
| FR305HD | 0.367 | 0.411 | 0.411 | 0.410 | 0.409 | 0.407 | 0.405 | |
| FR353 | 0.362 | 0.438 | 0.442 | 0.446 | 0.447 | 0.445 | 0.442 | |
| Cloned Elites | 0.427 | 0.400 | 0.406 | 0.416 | 0.425 | 0.433 | 0.440 | |
Publisher’s Note: MDPI stays neutral with regard to jurisdictional claims in published maps and institutional affiliations. |
© 2022 by the authors. Licensee MDPI, Basel, Switzerland. This article is an open access article distributed under the terms and conditions of the Creative Commons Attribution (CC BY) license (https://creativecommons.org/licenses/by/4.0/).
Share and Cite
Klápště, J.; Ismael, A.; Paget, M.; Graham, N.J.; Stovold, G.T.; Dungey, H.S.; Slavov, G.T. Genomics-Enabled Management of Genetic Resources in Radiata Pine. Forests 2022, 13, 282. https://doi.org/10.3390/f13020282
Klápště J, Ismael A, Paget M, Graham NJ, Stovold GT, Dungey HS, Slavov GT. Genomics-Enabled Management of Genetic Resources in Radiata Pine. Forests. 2022; 13(2):282. https://doi.org/10.3390/f13020282
Chicago/Turabian StyleKlápště, Jaroslav, Ahmed Ismael, Mark Paget, Natalie J. Graham, Grahame T. Stovold, Heidi S. Dungey, and Gancho T. Slavov. 2022. "Genomics-Enabled Management of Genetic Resources in Radiata Pine" Forests 13, no. 2: 282. https://doi.org/10.3390/f13020282