Article

495-Year Wood Anatomical Record of Siberian Stone Pine (Pinus sibirica Du Tour) as Climatic Proxy on the Timberline

by
Dina F. Zhirnova
1,*,
Liliana V. Belokopytova
1,
Keshav K. Upadhyay
2,
Shri K. Tripathi
2,
Elena A. Babushkina
1 and
Eugene A. Vaganov
3,4
1
Khakass Technical Institute, Siberian Federal University, 655017 Abakan, Russia
2
Department of Forestry, Mizoram University, Aizwal 796004, India
3
Institute of Ecology and Geography, Siberian Federal University, 660041 Krasnoyarsk, Russia
4
Department of Dendroecology, V.N. Sukachev Institute of Forest, Siberian Branch of the Russian Academy of Science, 660036 Krasnoyarsk, Russia
*
Author to whom correspondence should be addressed.
Forests 2022, 13(2), 247; https://doi.org/10.3390/f13020247
Submission received: 12 January 2022 / Revised: 2 February 2022 / Accepted: 4 February 2022 / Published: 6 February 2022

Abstract

:
The application of quantitative wood anatomy (QWA) in dendroclimatic analysis offers deep insight into the climatic effect on tree-ring formation, which is crucial in understanding the forests’ response to climate change. However, interrelations between tree-ring traits should be accounted to separate climatic signals recorded during subsequent stages of cell differentiation. The study was conducted in the South Siberian alpine timberline on Pinus sibirica Du Tour, a species considered unpromising in dendroclimatology. Relationships between tree-ring width, cell number N, mean and maximum values of radial diameter D, and cell wall thickness (CWT) were quantified to obtain indexed anatomical chronologies. Exponential functions with saturation D(N) and CWT(N) were proposed, which explained 14–69% and 3–61% of their variability, respectively. Indexation unabated significance of the climatic signals but separated them within a season. Analysis of pointer years and climatic extremes revealed predominantly long-term climatogenic changes of P. sibirica radial growth and QWA and allowed to obtain QWA-based 11-year filtered reconstructions of vegetative season climatic characteristics (R2adj = 0.32–0.66). The revealed prevalence of low-frequency climatic reactions is probably explained by a strategy of slow accumulation and utilization of resources implemented by P. sibirica. It makes this species’ QWA a promising proxy for decadal climatic variations in various intra-seasonal timeframes.

1. Introduction

In past decades, noticeable changes in the global climate marked by rising temperature and altering precipitation patterns have been crucial in affecting the ecosystems’ structure and functioning (i.e., the spatial distribution of species and their phenological patterns) and their abilities to provide goods and services to mankind [1,2,3,4,5,6,7]. Such climatic changes are important to dramatically affect the ecosystems in the areas where either of these factors are limiting the growth of trees, e.g., the temperature in the timberline. However, our abilities to detect such changes on a long-term basis are limited by the length of instrumental climatic records. Tree rings have been reported as one of the promising indicators for ecological and environmental changes due to their sensitivity to climate, annual resolution, and large spatial coverage [8,9,10]. Mountain conifer forests found at timberlines are expected to experience the impact of climate change at an early stage and are considered harbingers of future ecosystem shifts [11]. Therefore, studying the response of such forests to climate change will be of great practical significance, as they are growing under severe environmental stress conditions and often experiencing the border limit of physiological endurance [12]. However, the scope of dendrochronological analysis even under such conditions depends on the degree of sensitivity of tree-ring chronologies to dynamic environmental factors and the content of a common external signal [13]. This has led to consider many tree species as unpromising from a dendrochronological point of view and kept them outside the scope of scientific interest [8,14,15,16,17,18].
Due to the species-specific characteristics of needles, sensitivity to moisture deficit, etc., the response of Siberian stone pine (Pinus sibirica Du Tour) to warming phenomena is inconsistent and complex [17]. Therefore, this species is relatively lesser studied in comparison to other, more drought-resistant, and light-demanding fellow conifers like Scots pine and Siberian larch. A similar issue of climatic response has been recorded in other related species like P. cembra growing in Western Europe and P. koraiensis in the far east of Russia, northern China, and Korea [19,20,21]. In dendroclimatological analysis, chronologies with sensitivity (year-to-year variability) of 30% and more are considered sensitive to climatic fluctuations, whereas the radial growth of these Strobus pines is highly stable in the high-frequency domain with sensitivity rarely exceeding 10% [9]. However, other species which often share habitat with Siberian stone pine (e.g., Siberian larch) can exhibit a sensitivity of 50% and higher under extreme conditions [22,23]. In addition, tree rings of these pines make a smaller proportion of latewood as compared to other conifers, and their latewood only slightly differs from earlywood due to the very mild thickening of the tracheid cell walls [24]. As a result, the earlywood and latewood width or densitometric traits for these species are also difficult to analyze. Nevertheless, P. sibirica has been reported to have great significance to forestry, economy, and ecology over vast territories from the Urals to Eastern Siberia [25,26,27,28].
Mountain populations in southern Siberia are of particular interest in analyzing the climatic reactions of forest ecosystems. In these areas, heterogeneity and pronounced mosaics of terrain significantly influence the microclimate even at short distances, and largely affect the growth and development of vegetation [12,29,30,31]. The Western Sayan is a convenient testing polygon to address this issue due to rapid rates of regional temperature increase significantly exceeding global trends, which are being further multiplied locally near the massive Sayano-Shushenskoe Reservoir [32,33].
The weak and unstable response of radial growth of P. sibirica to climatic variables under traditional dendrochronology even at the upper timberline [15,16,32] has led to considering other possible approaches for recovering detailed climate information from tree rings [34]. Long-term chronologies of wood anatomical parameters are particularly one of the new methods in this area [35]. The environmental signals encoded in individual cells reflect changes in external factors that occurred over a short interval and therefore differ from the integral signal of tree-ring width at both intensity and seasonality [18,24,36]. Hence, long-term chronologies of wood anatomical parameters in comparison with radial growth can provide a more detailed and equally reliable pattern of climatic factors which are affecting tree growth [36,37,38]. Although the key to the success of this approach has already been developed, the dendroclimatic reconstructions based on the conifer wood anatomical parameters are still of limited length (for example, P longaeva [39], P. cembra [18], and Pseudotsuga menziesii [40]). Due to the observed predominance of low-frequency fluctuations in the growth of Siberian stone pine [15], it will be promising to identify the effect of decadal climatic changes on its wood structure as well. Dendroclimatic analysis of anatomical parameters can also help in studying the tree response to short-term extreme events impacting many forest ecosystems [41,42]. This study will provide ample opportunities for assessing the responses of these forest ecosystems with management implications over a vast territory at present and in the future.
Dendroclimatic analysis based on long-term wood anatomical chronology should be performed considering relationships between various anatomical parameters. Cell production in the season can affect the morphometric tracheid parameters that characterize the subsequent stages of cell differentiation, i.e., growth by expansion and secondary wall deposition (cell radial size and wall thickness, respectively [43,44]). This study hypothesizes that the removal of this influence will allow obtaining indexed chronologies of anatomical parameters containing a “separate” climatic signal perceived by the developing tracheids during specific stages of their differentiation. We assumed that the anatomical chronologies and cell production of P. sibirica indexed in this way will have independent responses to annual and/or long-term climatic fluctuations (dendroclimatic correlations) and extreme events (analysis of pointer years).

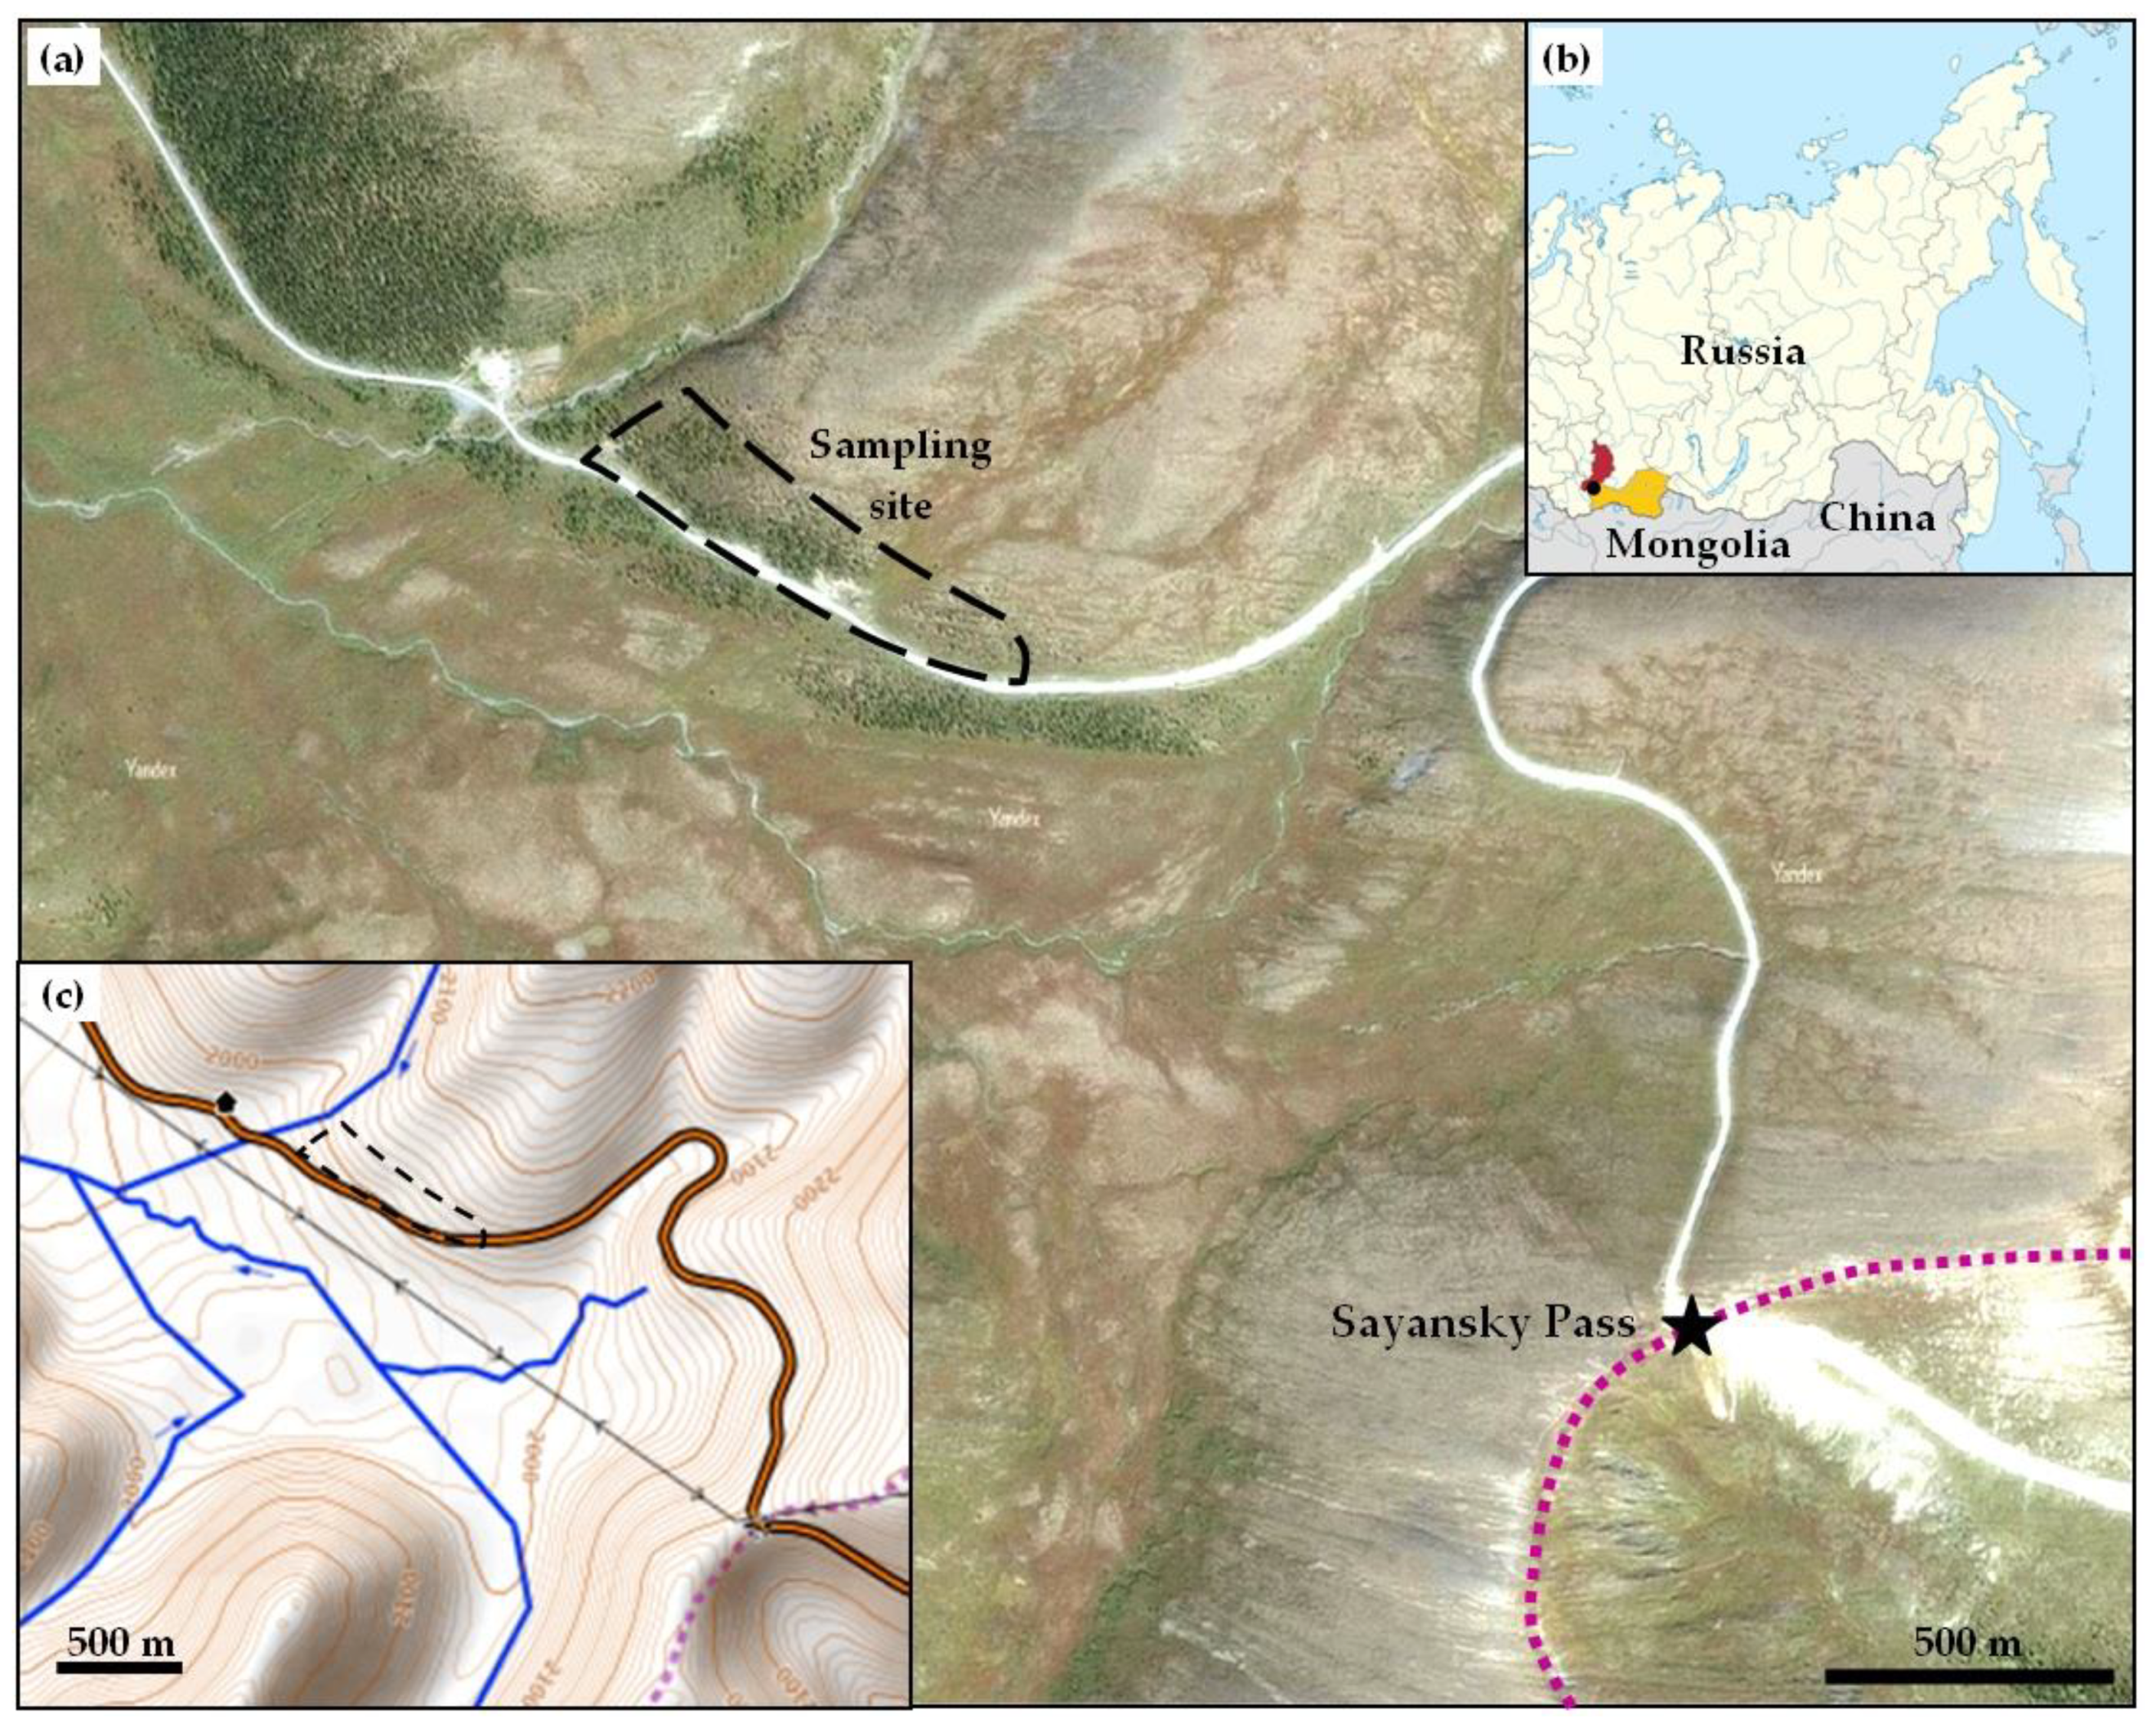
2. Materials and Methods

The study was carried out on the Khem-Taiga Ridge (up to 2715 m a.s.l.) of Western Sayan Mountains in Southern Siberia, near the border of the Republic of Khakassia and the Republic of Tyva (Figure 1). The regional landscape encompasses wide variations in natural conditions, where steppes are found in foothills (~400 m a.s.l.), mixed and conifer taiga forests in mountains (up to 1800–2100 m a.s.l.), and tundra vegetation or bare rocks on mountaintops.
In the absence of a state meteorological station within 100 km periphery of the sampling site, the dendroclimatic analysis has been performed using spatially distributed daily series of precipitation (P) and temperature (T) obtained from the ERA-20C climate reanalysis database (1900–2010, [45]) from KNMI Climate Explorer service (http://climexp.knmi.nl/selectdailyfield2.cgi; accessed on 2 February 2022). The re-analysis data obtained for the region 49.7–52.5° N 89.3–90.7° E exhibit characteristics of continental climate with average annual temperatures of −2.2 °C and total annual precipitation of 710 mm (Supplementary materials, Figure S1). The maximum and minimum monthly values of T and P have been observed in July (14.0 °C and 157 mm) and January (−19.5 °C and 13 mm), respectively. About 74% of the total annual precipitation has been received during the warmer months from May to September. However, as per available literature records, a drop in air temperature (0.4–0.65 °C) and rise in annual precipitation (100–200 mm) per 100 m increase in elevation are typical for the Western Sayan Mountains, depending upon the season (stronger in summer than in winter) and local orographic conditions [46,47]. This can be observed from a comparison between average annual climatic characteristics of two weather stations of different elevations located within the Western Sayan Mountains (52.8–52.9° N latitude): Cheryomushki at 330 m a.s.l. (+3.3 °C; 530 mm) and Olenya Rechka at 1400 m a.s.l. (−2.7 °C; 1250 mm). Therefore, a colder and wetter climate is expected in high-mountain conditions at the upper timberline as compared to the averaged regional characteristics.
In the present study, wood samples (5 mm diameter cores) from 54 dominant mature trees (~10–12 m height) of P. sibirica have been collected in 2018 alongside the Abakan–Ak-Dovurak highway road, about 2.8 km (1.5 km in a straight line) away from the Sayansky Pass located on the border of the two regions (Figure 1). The stand is represented by P. sibirica with an admixture of Larix sibirica Ledeb. Continuous moss cover is comprised of species of Hylocomium, Pleurozium, Plytrichum, and Cladonia. Undergrowth is formed by an abundant growth of species like Vaccinium vitis-idaea L., Bergenia crassifolia (L.) Fritsch, Betula rotundifolia Spach, and Salix sp. The age of trees gradually decreases with the elevation and only sparse saplings (mainly larch) are found above 2050 m a.s.l. The sampling site with old pine trees is located on a gentle slope (10–15°) facing southwestern direction (51°42.8′ N 89°51.9′ E, 1970–2020 m a.s.l.).
Tree cores were sampled using increment borer at chest height (~1.3 m) in the direction perpendicular to slope aspect, i.e., parallel to elevation isolines. The standard protocols have been followed in the transportation of cores, their processing, measurement of tree-ring width (TRW), cross-dating, and in obtaining chronologies for dendrochronological research [9] using a LINTAB 5 measuring device with an accuracy of 0.01 mm, and computer software platforms TSAPwin, COFECHA and ARSTAN [48,49,50]. During TRW standardization, the age-related trends of individual series have been removed using cubic smoothing splines with a 50% frequency response at 67% of the series length, and normalized local standard chronology (i.e., TRW_std) was obtained as bi-weighted average. A total of seven old trees with tree-ring series lengths of 234–495 years (extending from 1524–1785) were selected for the measurement of parameters related to wood anatomical structure (Table 1). The actual cambial age of these trees considerably exceeds the given values, as most of the old pine trees have a rotten trunk with hollow inside due to prevailing conditions in the study area, and thus, their cores did not reach the pith. Before sectioning, cores were cut into pieces of 3–3.5 cm length (diagonally to ensure overlap of tree rings between pieces and cross-dating without gaps), softened by soaking in the warm water for a day, and then mounted in the specialized sample holder for the microtome. Cross-sections of ~14 μm thickness were obtained from the sampled cores using a rotary microtome (HM 340E, Microm GmbH). Each cross-section was stained with safranin, dehydrated with alcohols of increasing concentration, embedded between the glass slide and cover glass in Canada balsam and dried, then photographed at ×400 magnification with a digital camera (ProgRes Gryphax Subra, Jenoptik GmbH) mounted on a biological microscope (BX43, Olympus).
These microphotographs were analyzed using the Lineyka program [51]. This program helped in taking consecutive radial measurements of lumen diameter and thickness of double cell walls in five radial rows of tracheids in each tree ring [52] and automatically transforming the measurements into the cell radial diameter D and the cell wall thickness CWT. The averaged tracheidograms were calculated from individual intra-seasonal series of D and CWT measurements (tracheidograms) normalized by enlarging/shrinking the cell numbers per radial row (N) to the N averaged over all five measured rows in each tree ring [53]. In two trees, areas of reactive wood were identified and excluded from the analysis due to abnormal CWT values. A total of 2374 tree rings (234 to 491 per tree) were measured covering the period 1524–2018, lasting 495 calendar years.
The maximum and arithmetic mean values Dmax, Dmean, CWTmax, and CWTmean were calculated for each ring according to the averaged tracheidograms (Supplementary materials, Figure S2), as well as the tree-ring width TRW = ΣD, which was used to cross-date the anatomical measurements across LINTAB-measured TRW series. Further analysis was carried out for N, TRW, and the aforesaid maximum and average values of D and CWT.
The relationships between the tree-ring characteristics were modeled by linear or exponential functions:
Y(X) = a1·X + a0,
Y(X) = Ymin + (Yas − Ymin)·eaX,
where a0, a1, a are numerical coefficients; X is an independent variable; Y is the dependent variable (i.e., modeled characteristic TRW, Dmax, Dmean, CWTmax, or CWTmean); Ymin is the minimum initial value of the modeled characteristic in exponential models of anatomical features; Yas is the asymptotic value of the characteristic. Minimum initial values were empirically chosen as average diameter or cell wall thickness of the cambial cell: Dmin = 7 μm, CWTmin = 1 μm. Asymptotic values of the characteristics were calculated as an average value for rings with N > 20 for each tree, i.e., optimal for the favorable season under the conditions of the study area. The 20 cells criterion for computing the optimum was adopted empirically as a compromise between the presence of rings meeting the criterion in each tree and the stable actual values of the modeled cell characteristic. In this study, model calculations were performed for the individual trees, for the entire sample of the site as a whole, and for local mean chronologies.
Indexing of anatomical characteristics was carried out by dividing their initial values by the values of the developed models of their dependences on the cell number calculated for each tree. Simultaneously, the similarity of the statistical distributions of measured and indexed characteristics with the normal distribution was tested by considering the histograms of distributions, their statistical characteristics (median and mean, skewness, kurtosis), and quantile-quantile plots [54]. Local indexed chronologies of anatomical characteristics were developed by averaging indexed series of individual trees.
Dendroclimatic analysis was performed by calculating pairwise correlations of local chronologies of tree-ring characteristics with a 21-day moving series of temperature and precipitation calculated from daily data. In addition, the climatic characteristics of the total vegetative season were calculated considering its duration estimated from the dates of the stable temperature transition through a certain threshold Tthr in spring and autumn (via agroclimatic method used in Russia [55,56]). These characteristics are the calendar dates (day of year, DOY) of the beginning (Dbeg) and ending (Dend) of the vegetative season, its duration (Dur), the sums of active daily temperatures (GDD = Σ(T − Tthr) for days of T > Tthr) and of precipitation (Pveg) during the vegetative season. The critical threshold value Tthr for growth and wood structure of Siberian stone pine was determined by examining a range of values from +7 to +11.5 °C with a step of 0.5 °C and by selecting the value at which the characteristics of the current and previous vegetative season have the strongest pairwise correlations with tree-ring chronologies. We also calculated precipitation sum for the period T < 0 °C (winter before the current vegetative season), and pair correlations of this series with tree-ring chronologies were used to indirectly assess the effect of snow cover depth on the formation of pine tree rings. This study used a regional estimate of temperature averaged over a large territory with a wide elevational range, and therefore, the local temperature near mountaintops is lower than the average for the region. This means that the Tthr estimation based on the ERA-20C series is higher than the actual threshold temperatures at the sampling site.
The pointer years in tree-ring chronologies were determined by choosing the 5% highest and 5% lowest values of each chronology [57] for the cover period of climatic series 1900–2010. The intra-seasonal dynamics of temperature in these years were compared with the long-term average. Pointer years’ history was also compared with that of extreme years defined for climatic characteristics of the vegetative season as their departure from the mean value by more than 1.5 standard deviations [57].
The low-frequency component (decadal and longer variation) of the climatic series and tree-ring chronologies was estimated with simple smoothing using an 11-year moving average. The tree-ring-based reconstruction models of the smoothed vegetative characteristics were obtained using the best-fit (determined by comparison of explained variance, i.e., adjusted coefficient of determination R2adj) two-factor linear regressions [54].

3. Results

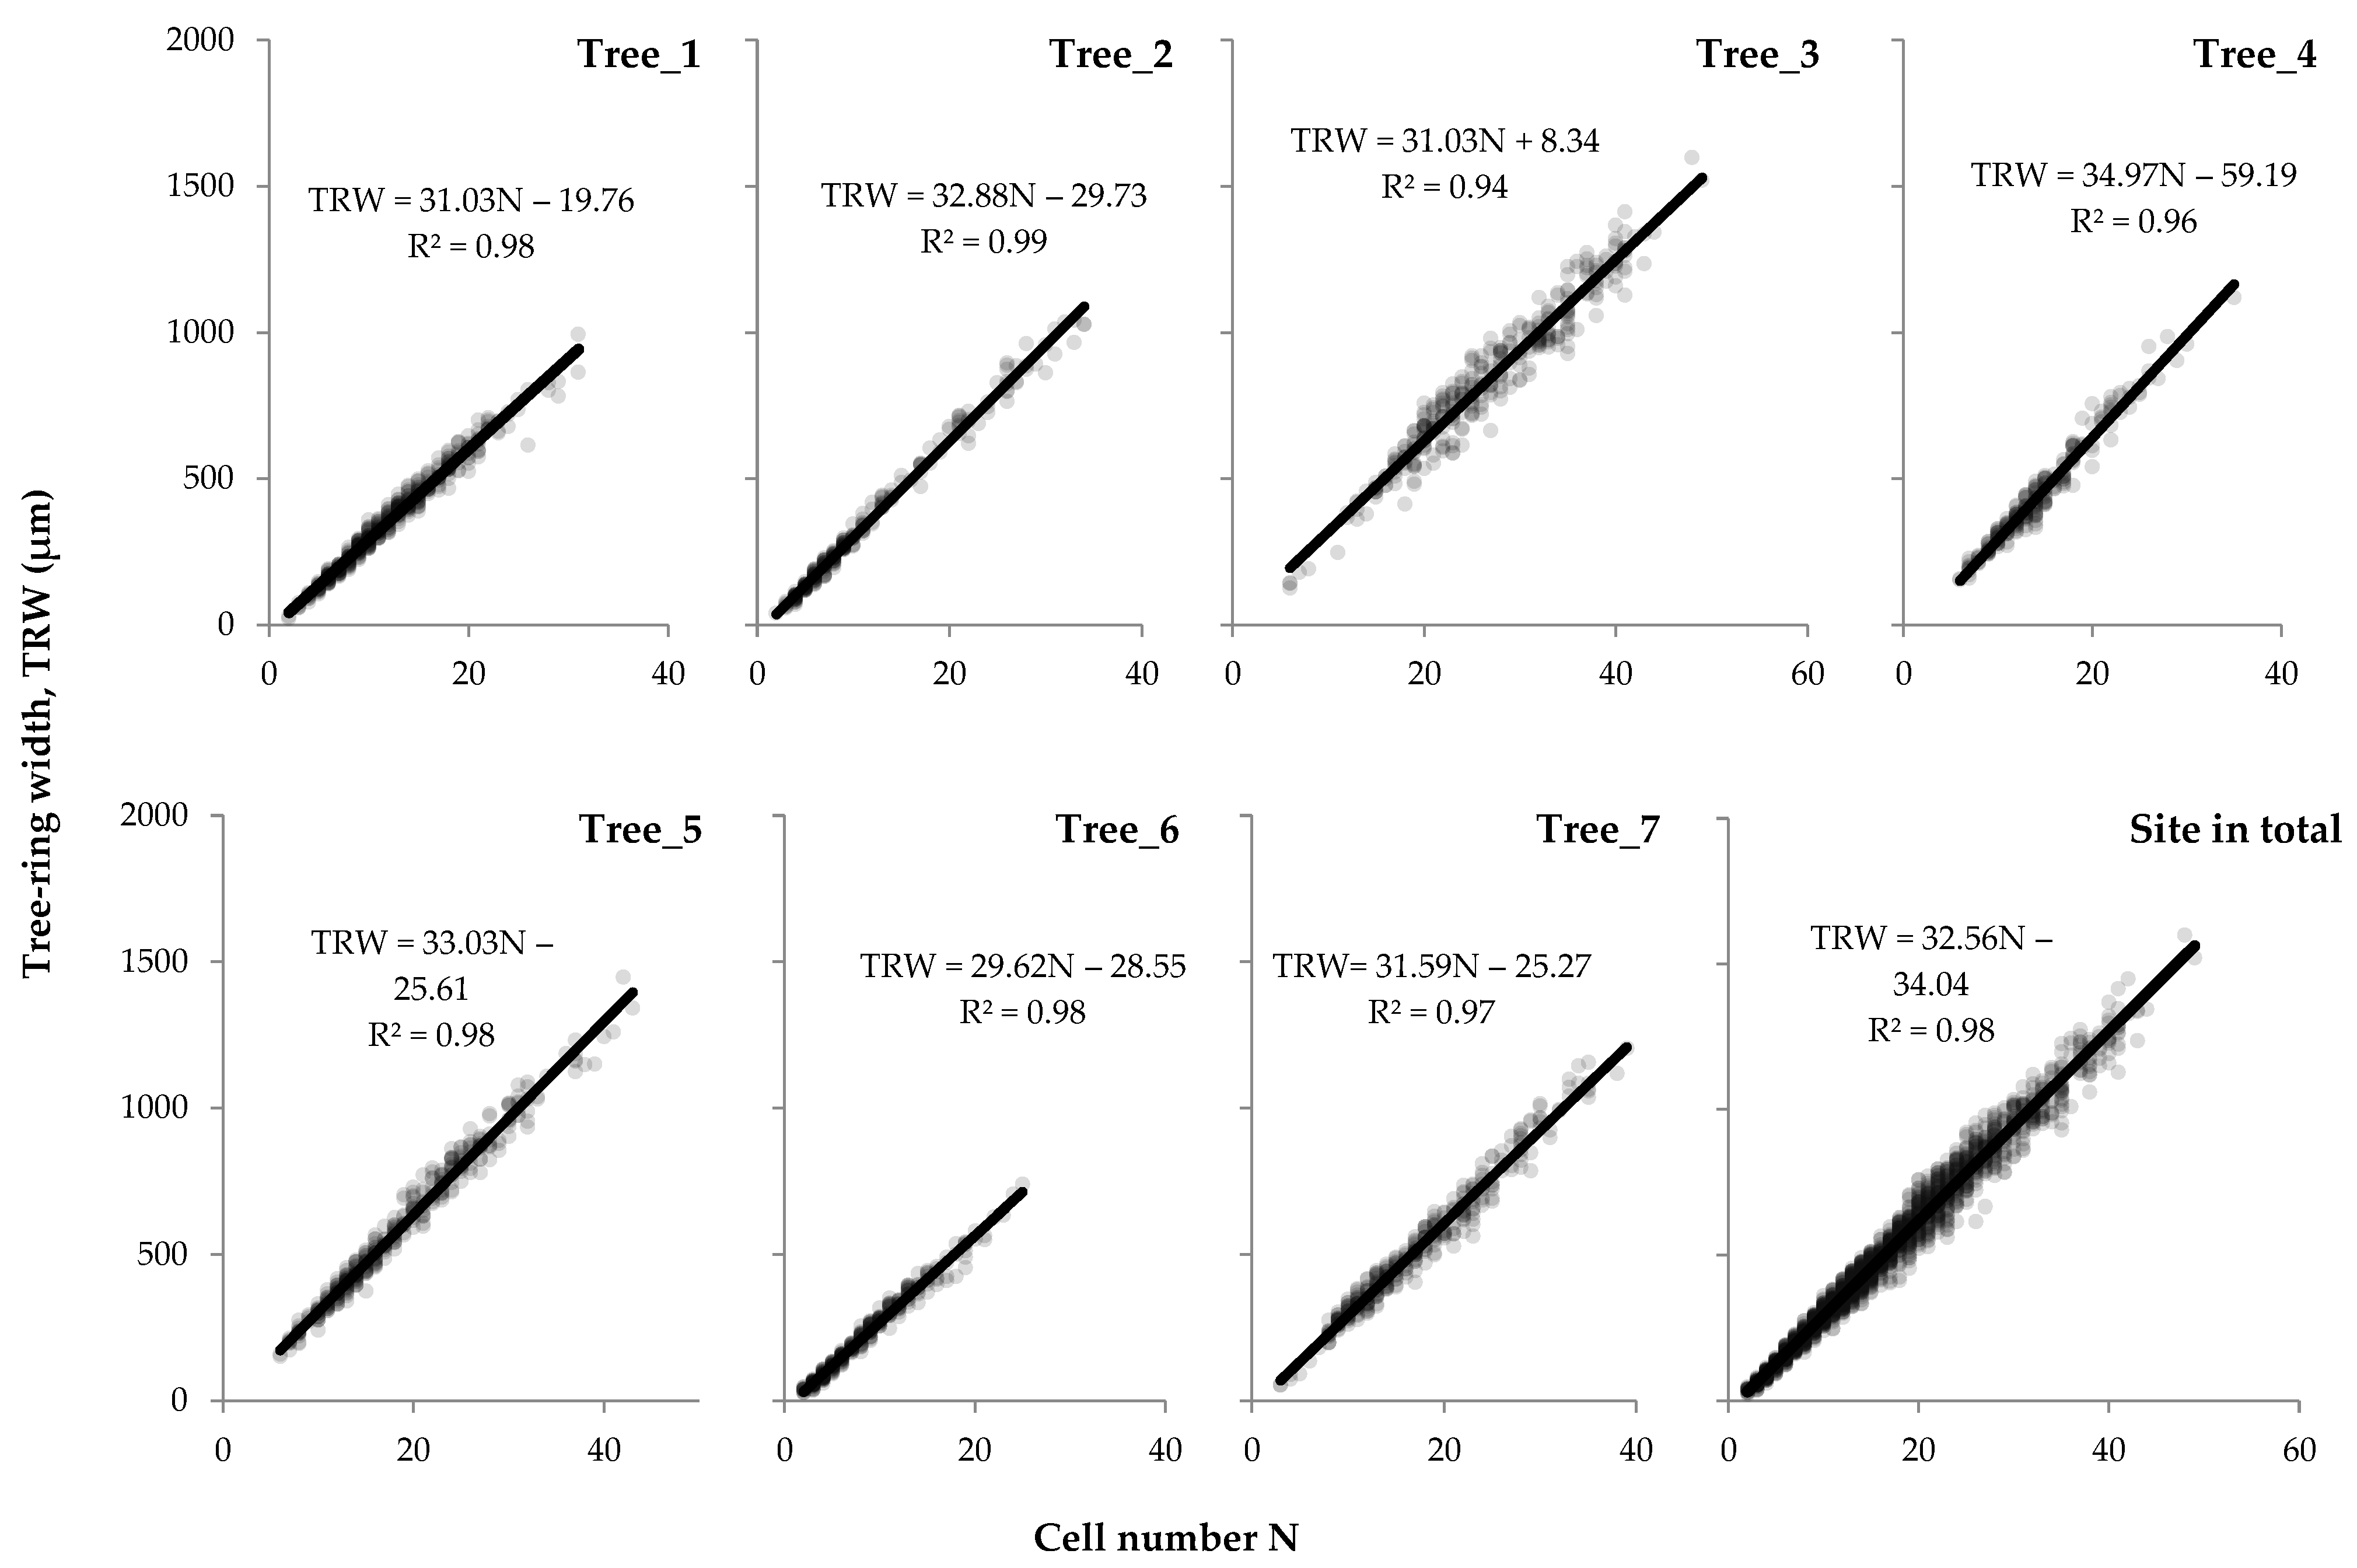
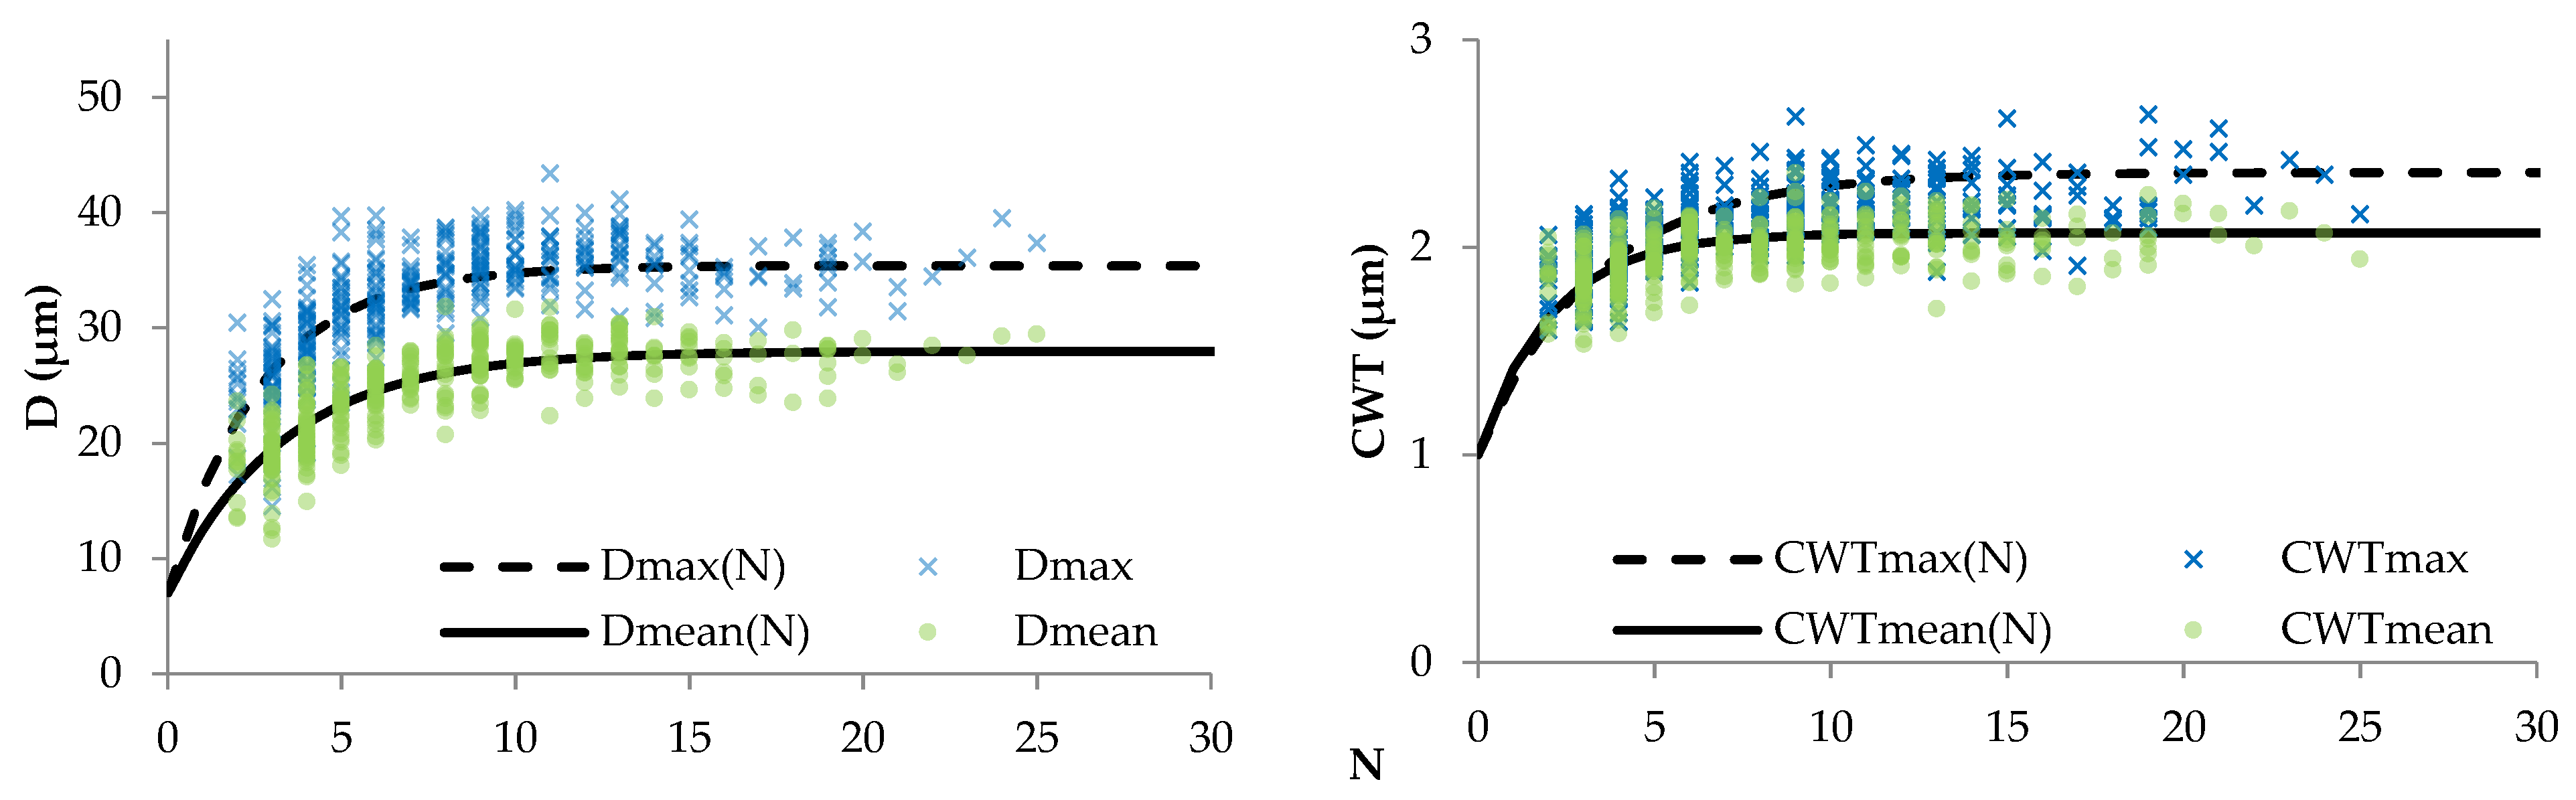
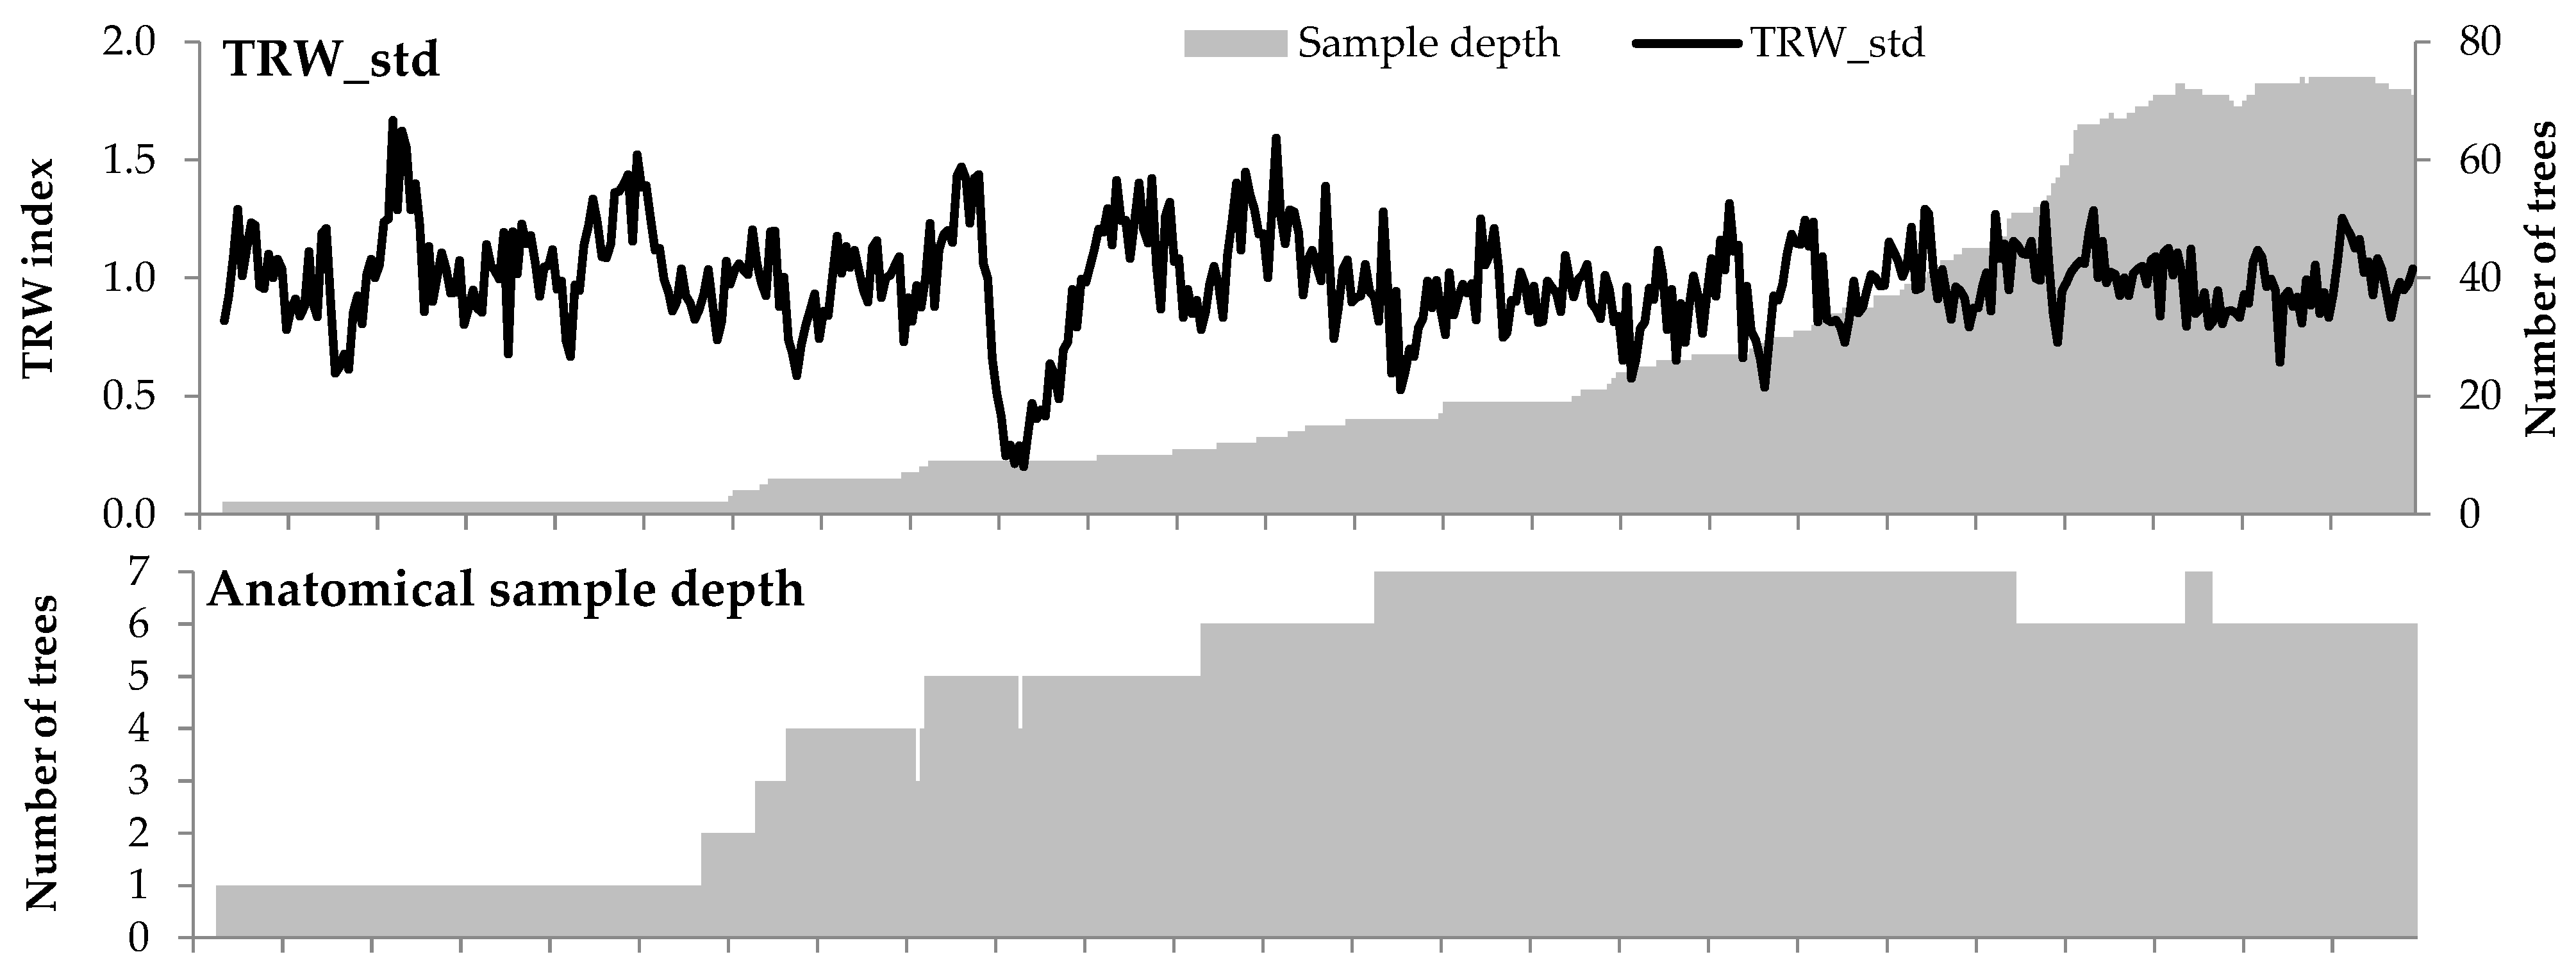
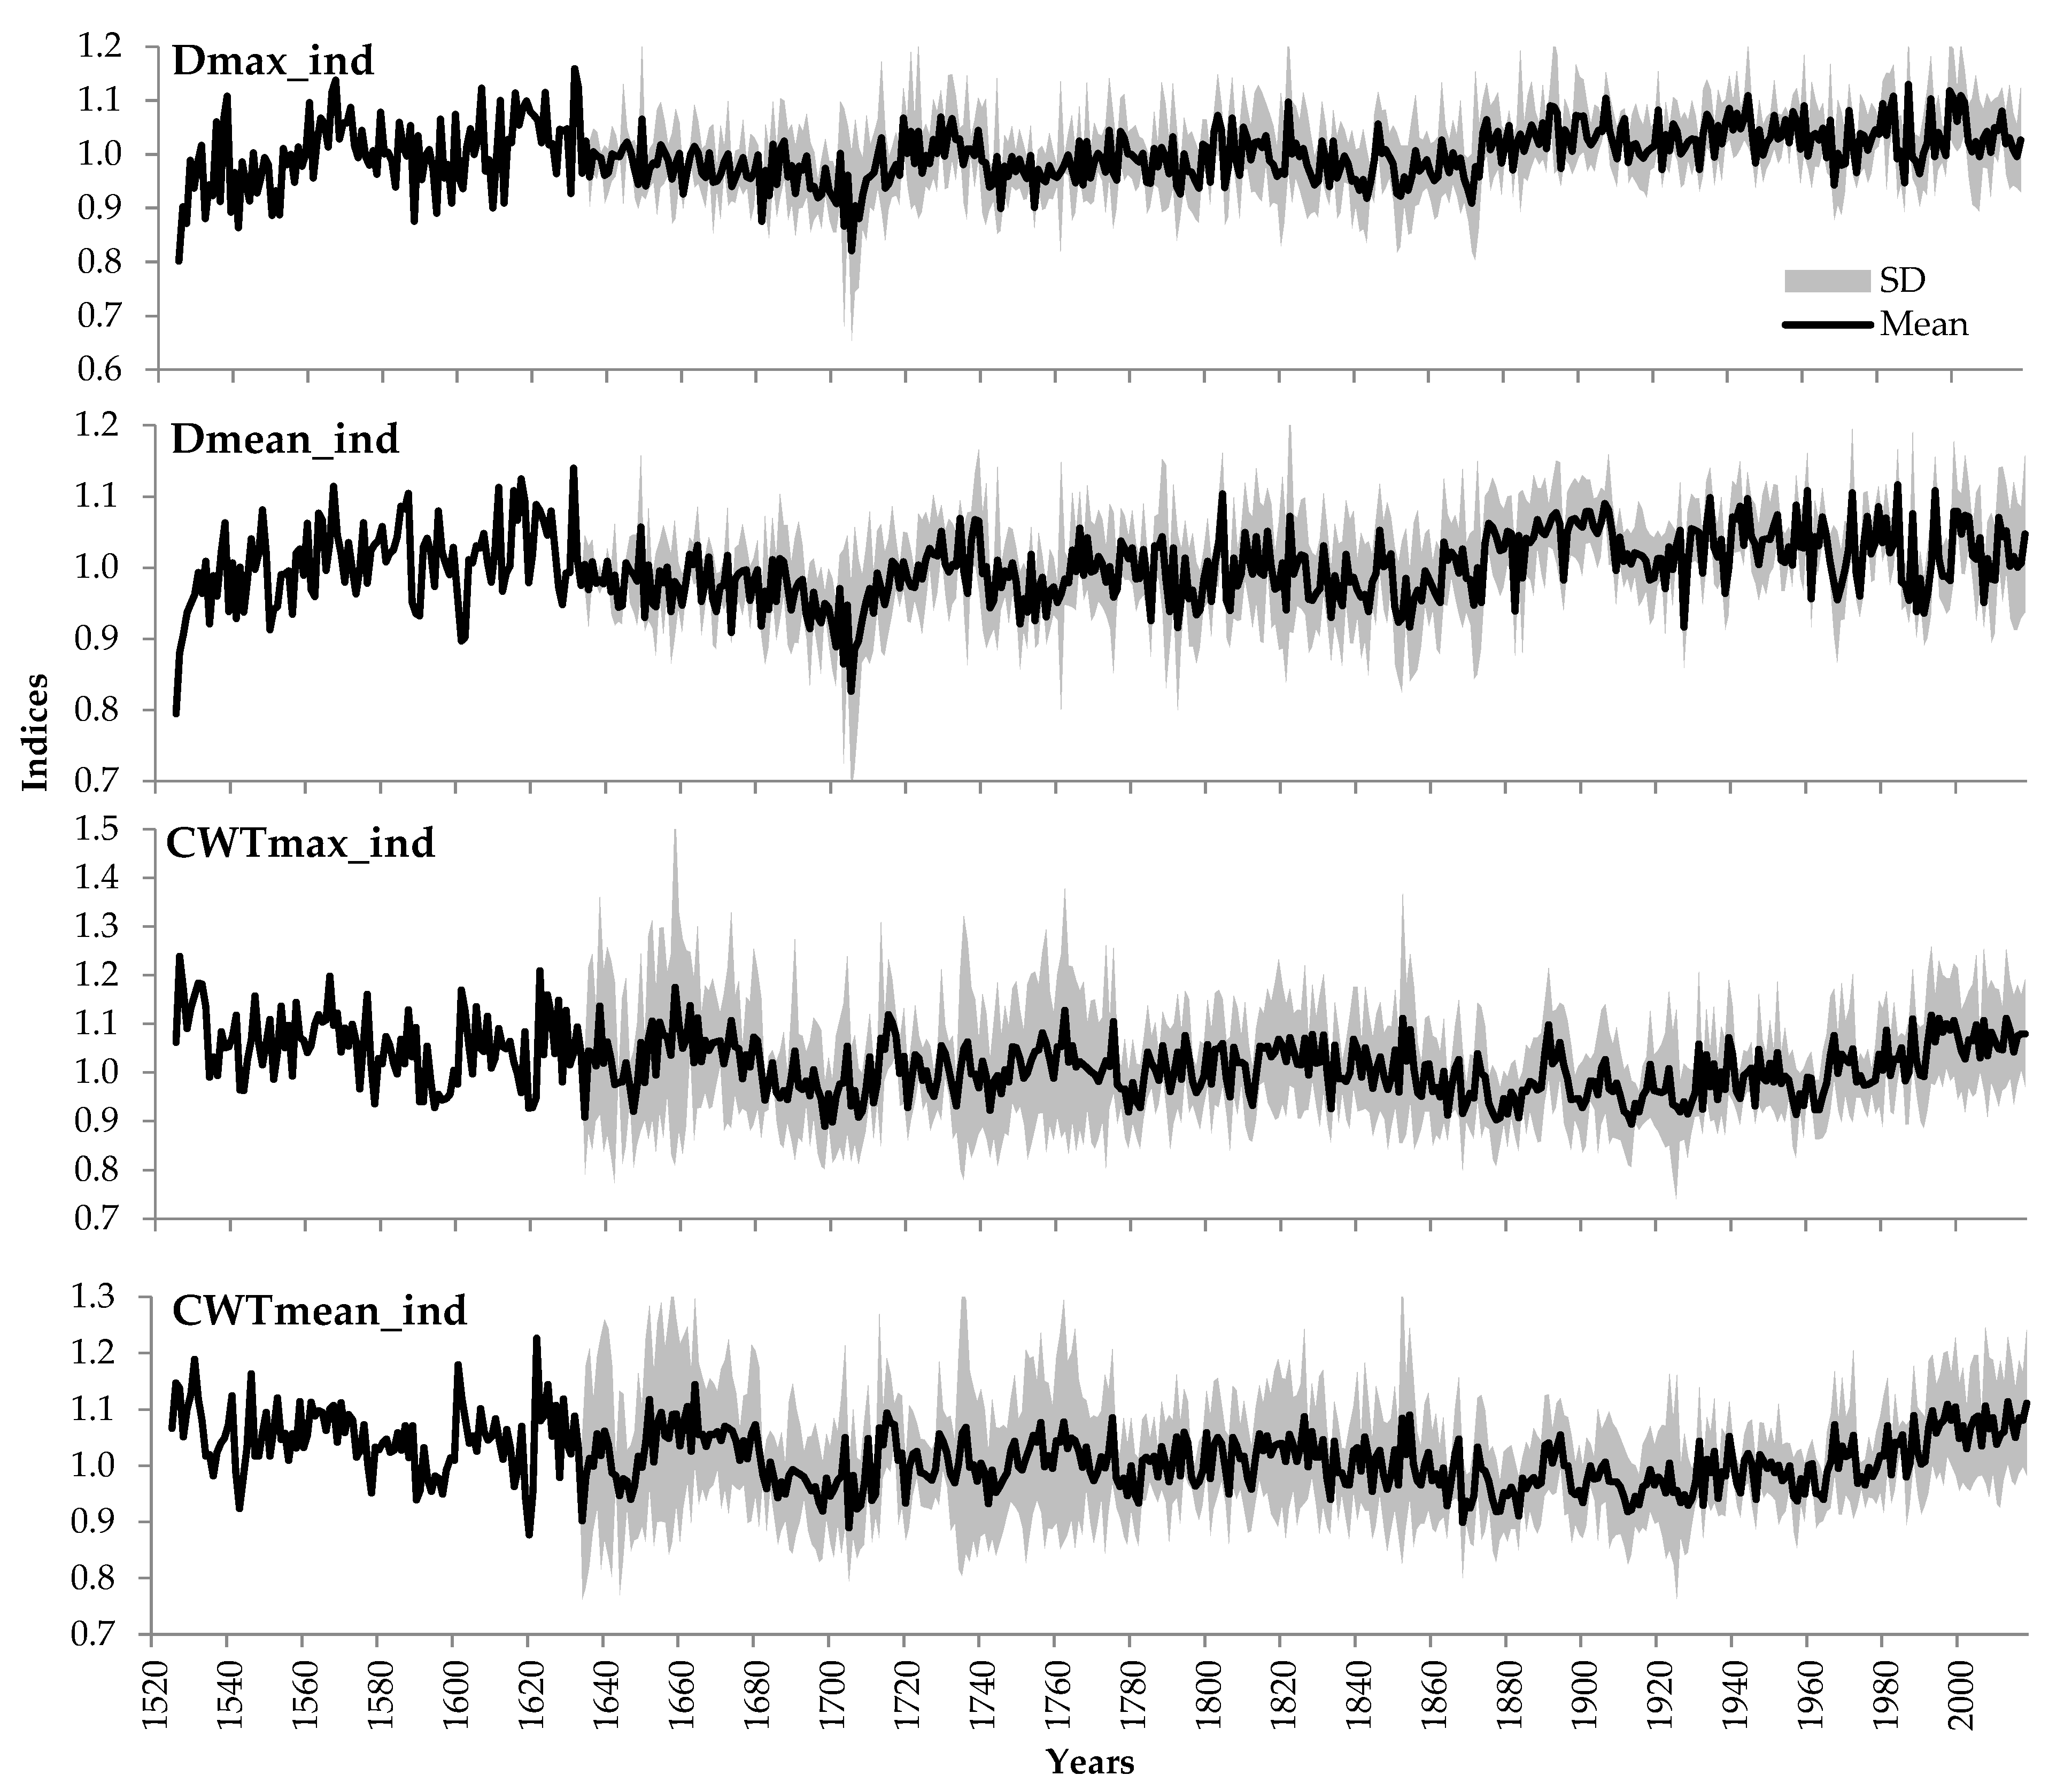
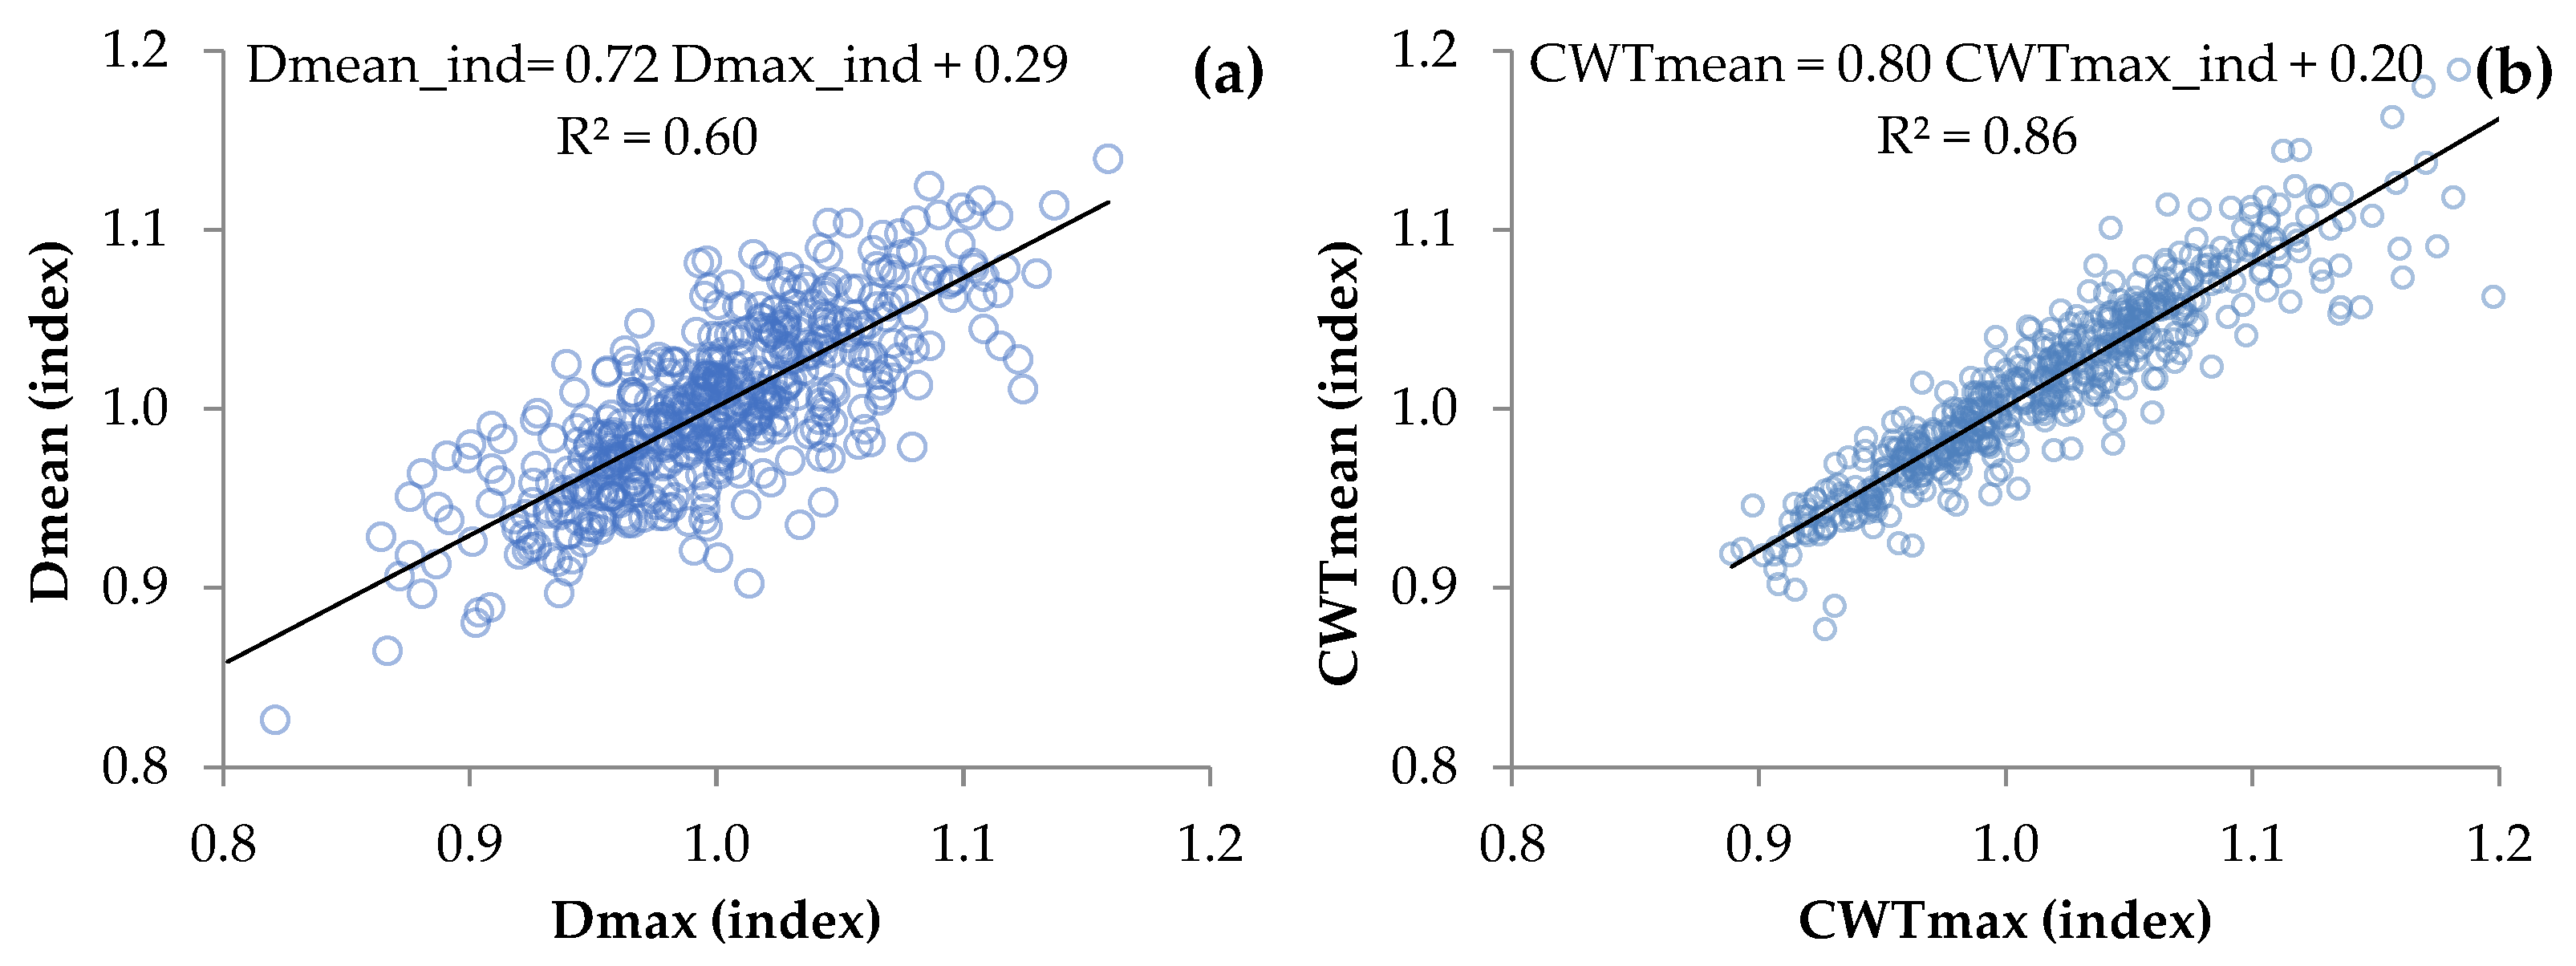
3.1. Relationships between Tree-Ring Traits

Tree-ring width was naturally related to their number as it is the sum of the radial diameters of all cells along the radial row. This relationship is very close to linear for both individual trees and the sampling site scale (Figure 2). The linear regression models TRW(N) obtained at the individual tree scale exhibited the coefficient of independent variable N in the range of 29.6–35.0 μm. The constant term for obtained models varied from –60 to +8 µm, but with a difference from zero insignificant at the level of p < 0.05. The coefficient of determination was very high, 0.94–0.99 for all obtained models. The habitat-scale model has also displayed the agreement with aforesaid ranges. No statistically significant relationship has been found between differences in individual tree models and tree characteristics associated with age, mean or maximum TRW (Table 1).
The morphometric characteristics of tracheids have a non-linear dependence on cell production (Figure 3). For narrow rings, the cell size and cell wall thickness changed synchronously with the cell number in the ring, whereas the anatomical structure of wide rings (more than 20–25 cells) did not depend on N. This allowed considering curves with saturation for a mathematical description of D(N) and CWT(N) dependences, particularly a negative exponential function. The asymptotic (optimal) values to which the maximum and mean values of D and CWT inclined, and the numerical coefficient a regulating the curvature of the transition from a positive connection to stable values were estimated separately for each tree and for the total site sample (Table 2). The optimal values of the morphometric parameters varied between 28–33 and 35–43 μm for the average and maximum radial cell size, and 2.0–3.0 and 2.2–3.6 μm for the average and maximum cell wall thickness, respectively. Models for the total dataset had numerical terms within the same ranges. Numerical coefficients a were more variable for CWT (0.09–0.49) than D (0.19–0.38). Models were closer-fitted and more uniform for Dmax (R2 = 0.14–0.65 for individual trees and 0.76 for total site sample) and Dmean (0.21–0.69 and 0.79), than for CWTmax (0.04–0.61 and 0.37) and CWTmean (0.03–0.49 and 0.26).
The obtained analytical functions of dependences were used to index the anatomical parameters by dividing the actual value with the value of the model curve for a given number of cells in the ring. The statistical distributions of anatomical characteristics became closer to a normal distribution both for individual trees and for the entire sample after indexing. This has been indicated by statistical characteristics, like a decrease in the distance between the median and the mean and a drop in the values of skewness and kurtosis (Table 3). A closer fit to the normal distribution can also be observed from more symmetrical shapes of the distribution density histograms and almost linear form of their Q-Q plots except for a small number of outliers (Supplementary materials, Figures S3 and S4).
After indexing, the averaged local chronologies were obtained (Figure 4). Contrary to TRW, the common external signal had noticeably decreased in the indexed anatomical chronologies compared to the raw measurements. This is evident from the decreased inter-series correlations of the individual tree series and their correlations with the local chronology (Table 4).
Both before and after indexing, the maximum and mean values of the same anatomical characteristics were closely related to each other and did not exhibit any significant nonlinearity in their relationships. For individual trees, correlations between the raw measurements of Dmax & Dmean and CWTmax & CWTmean were in the range of 0.60–0.90 and 0.84–0.98, respectively. After indexing, the correlation coefficients slightly decreased for both Dmax and Dmean (0.54–0.78), and CWTmax and CWTmean (0.81–0.97). In averaged local chronologies, these correlations had the same patterns before (D, 0.82; CWT, 0.93) and after (D, 0.74; CWT, 0.96) indexing. The linear regressions for indexed local chronologies were used to ensure the separation of the external signal recorded in the interconnected characteristics (Figure 5). The corrections to the Dmean and CWTmean chronologies were made by subtracting the regression model to obtain their residual chronologies having zero correlation with Dmax and CWTmax, respectively. These residual chronologies contained independent information on the fluctuations of environmental conditions. A similar approach has been used earlier to separate the external signal in the early- and latewood width [58].

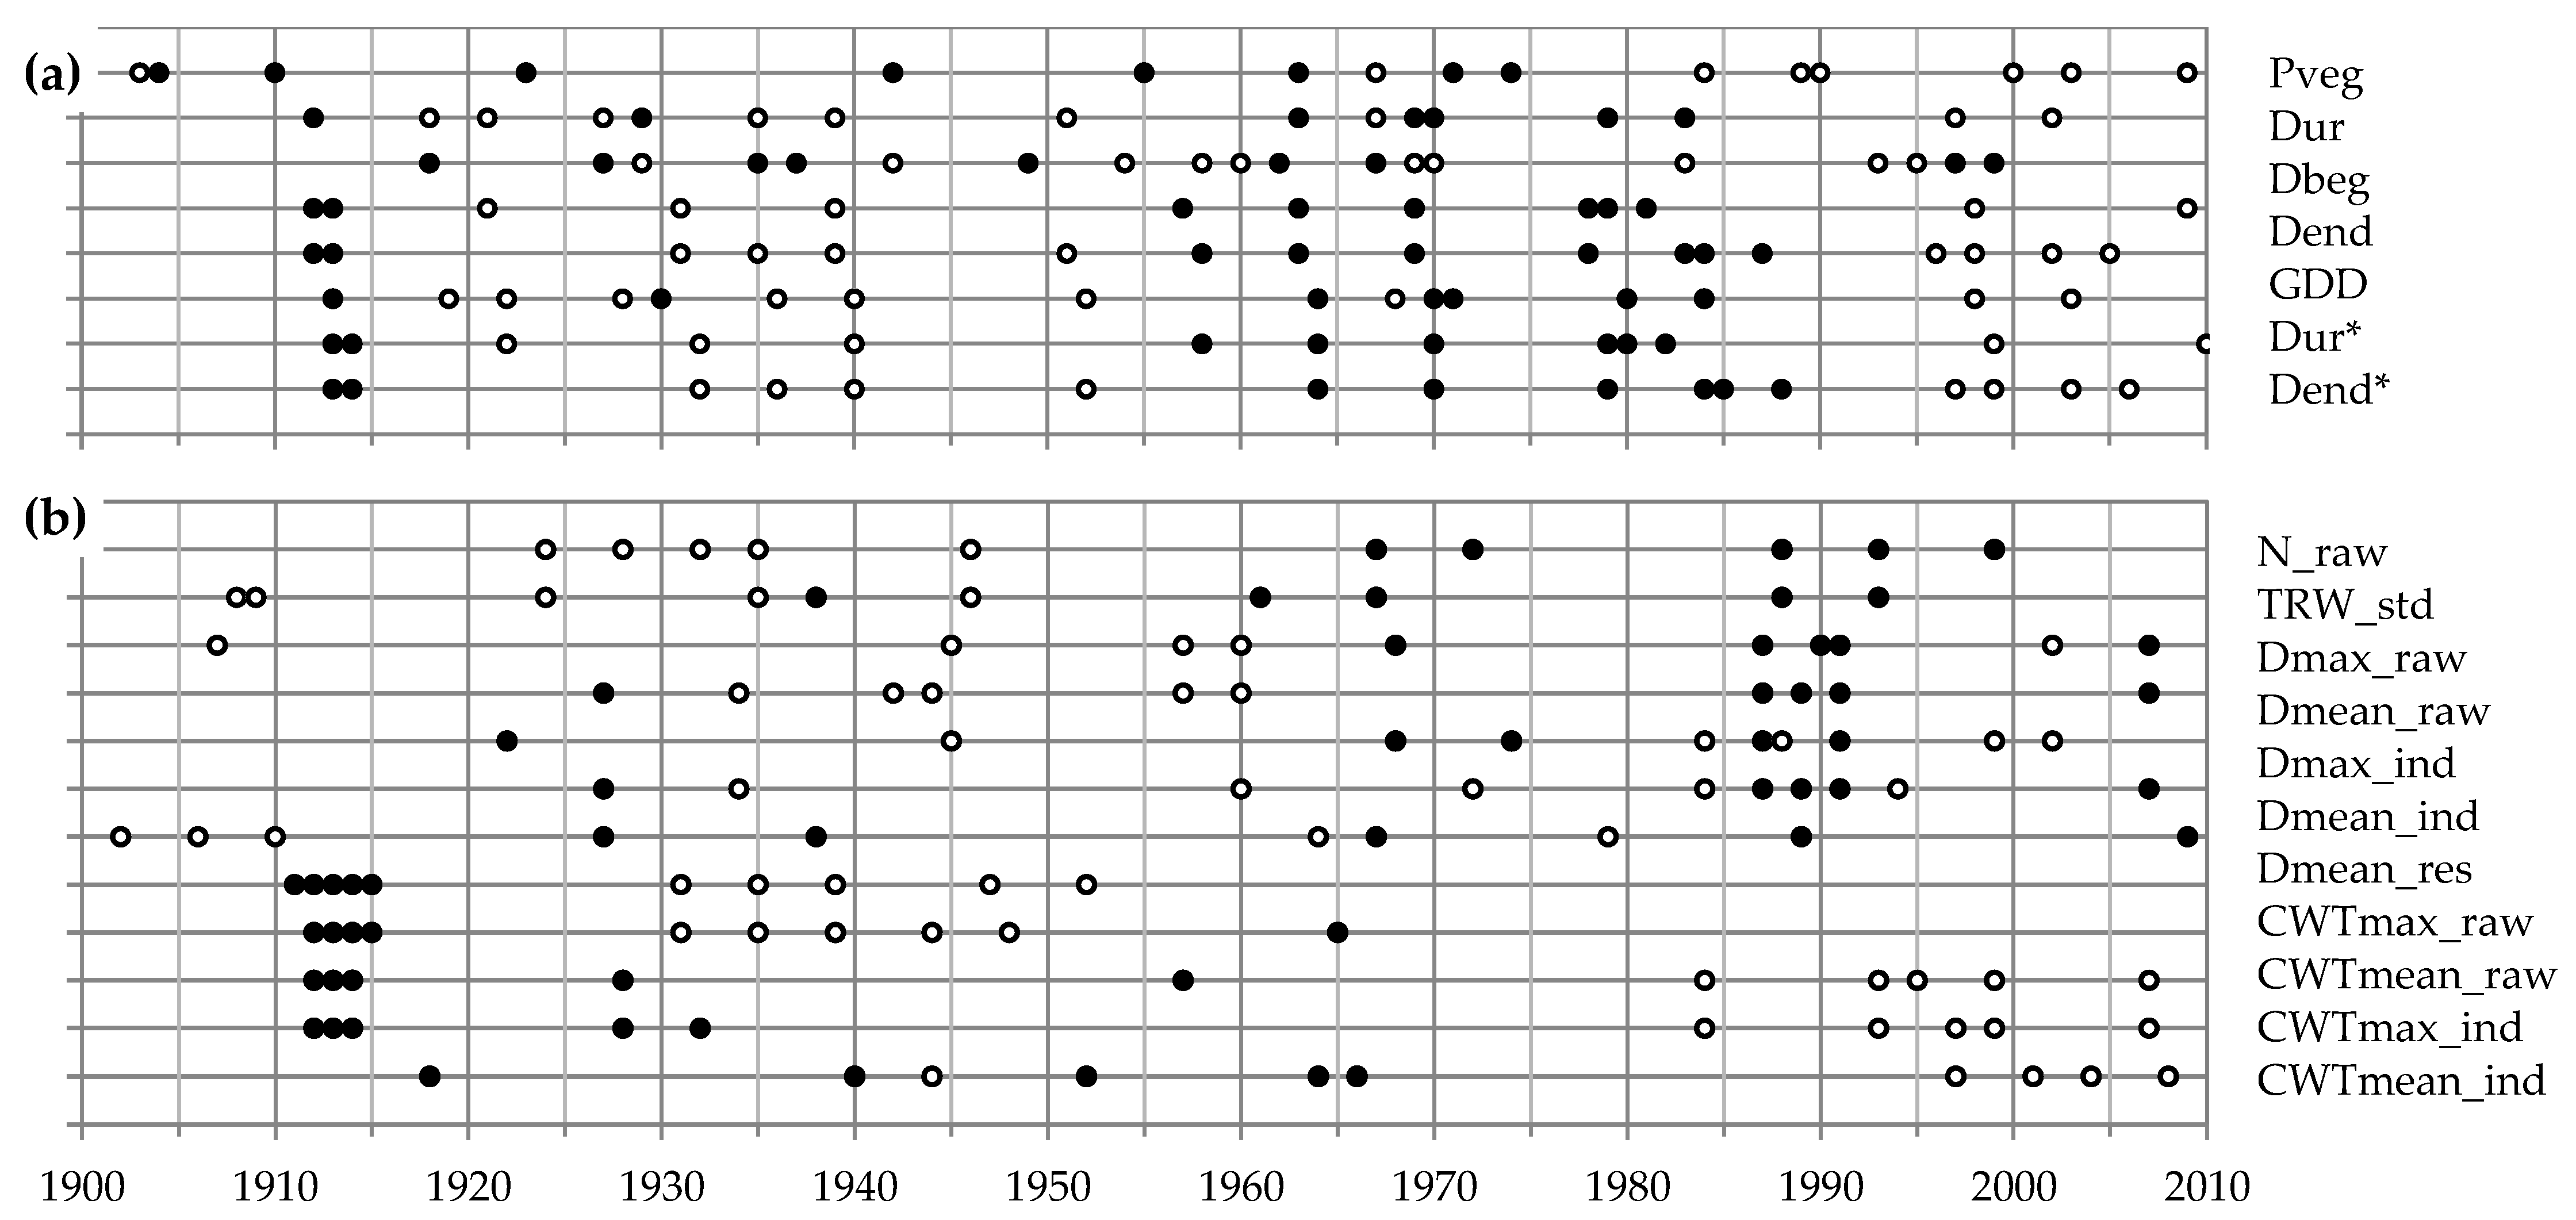
3.2. Climatic Response of Tree Ring Traits

The correlation coefficients of tree-ring chronologies with 21-day moving climatic series from previous July to the current September (Supplementary materials, Figure S5) have revealed weak responses of both radial growth and anatomical traits of Siberian stone pine with precipitation (r = −0.38 ⋯ +0.27) and temperature (r = −0.38 ⋯ +0.42). A negative reaction was noticed to precipitation of the current (May–August) and previous (July–September) warm seasons for the radial growth and cell production. However, opposite (positive) reactions have been recorded to the temperature of these months. Further, a negative response to temperature was observed before the beginning of the vegetative season, particularly in April (stronger for TRW) and November–February (stronger for N).
For anatomical parameters, indexing strengthened some and weakened other dendroclimatic correlations. For instance, after indexing, Dmax revealed a positive reaction to precipitation in late May–early July and increased positive response to temperature in May–June, whereas the negative effect of winter temperatures and precipitation of the previous season was weakened. For the Dmean chronology, indexing weakened the negative influence of summer precipitation but fully preserved the contrasting positive effect of temperature in June and the negative effect of the first two decades of July. The subsequent removal of common signal with Dmax from this chronology emphasized negative responses to precipitation in June and temperature in May, but completely suppressed the positive response to the temperature of the previous August–September. In the case of CWTmax, indexing has led to the appearance of a positive response to precipitation from mid-June to early August and a negative response to the temperature of the previous September. The positive response to temperature persisted during the first two decades of July but weakened from the end of July to August. The indexing caused similar changes in climatic responses of the CWTmean, where the transformation of series by removing the relationship with CWTmax resulted in significant positive responses to temperatures, which persisted from the end of the previous year August to the first half of September, current year January–February, and May, but were suppressed for other time intervals.
The climatic characteristics of the vegetative season were determined through the dates of steady transition of regional temperature through a certain threshold value Tthr in spring and autumn. They correlate well with some of the chronologies of tree-ring traits (Supplementary materials, Table S1). This response differs depending on the considered trait and the method of its mathematical processing. Their intensity and significance vary for the considered range of Tthr = 7…11.5 °C, in most cases reaching a maximum at a threshold value of ca. 9 °C (Table 5). Radial growth and cell number have shown significant positive responses to the characteristics of the previous vegetative season like Dur and Dend, while a response of lesser extent was recorded to GDD.
The initial raw chronologies of cell diameter did not show any response to indicators of the vegetative season, but a positive response of Dmean was recorded with Dbeg of the current vegetative season after indexing (ind), albeit it is weak and unstable (Supplementary materials, Table S1). The residual chronology (res) of mean cell diameter showed more consistent positive dependence on the current Dbeg and a negative reliance on Dur of both current and previous seasons. The raw chronologies of cell wall thickness were positively related to Dur, Dend, and particularly the GDD of both current and previous seasons. After indexing, a significant positive response persisted only for GDD and Dur of the current season. The Dbeg had a weak negative correlation to the measured and indexed CWT chronologies, significant only for high values of regional threshold temperatures Tthr. The residual chronology of CWTmean has revealed a weak opposite response to the characteristics of the current season compared with the residual chronology of Dmean. The precipitation of the vegetative season negatively influenced the cell production, raw and residual chronologies of Dmean, and positively affected indexed chronologies of CWTmax and CWTmean (Table 5). We also assessed the impact of the amount of precipitation over winter preceding tree-ring formation (period of regional temperatures T < 0 °C), but the correlations of this factor with all tree-ring chronologies were insignificant (from −0.15 to 0.19).
Interestingly, in the study area, some of the considered climatic characteristics of the vegetative season were significantly correlated with each other. For instance, the series of duration, Dend, and GDD had close positive correlations (r = 0.76–0.79 at Tthr = 9 °C) with each other. The beginning date of the vegetative season was negatively correlated with Dur (r = −0.68), GDD (r = −0.33), and Dend (r = −0.24). The amount of precipitation had moderate positive correlation with Dur (r = 0.41) and Dend (r = 0.24) and negative association with Dbeg (r = −0.41), but it did not show a significant correlation with GDD (r = 0.09).
The dynamics of years with large deviations in the characteristics of the vegetative season (Figure 6a) during 1900–2010 displayed a semi-cyclical interchange of long-term periods with frequent negative climatic extremes, which has been observed as cold and short vegetative seasons (early 1900s, 1955–1990), and periods with more frequent long and warm vegetative seasons (1915–1955, 1990–2010). For each tree-ring chronology, the five highest and five lowest values were identified within this duration of the instrumental climatic series (Figure 6b). The general pattern showed that a lower amount of radial growth and cell production, and the formation of small and thin-walled tracheids were typically linked with periods of a large number of negative heat supply extremes. Chronological coincidences of the maximum deviations in the tree-ring chronologies have also been observed with climatic extremes of the current and previous vegetative season. For example, short and cold growing seasons during 1912–1914 have led to the formation of rings with extremely thin-walled cells (light rings), and an opposite reaction was observed for the years 1931, 1935, and 1939, where 1935 also showed a large radial growth. In 1987, the impact of low heat supply over the vegetative season has been reflected from the cell sizes of the current year ring and cell production in the following year. The temperature dynamics from July of the previous year to September of the current year (smoothed by the 21-day moving average) differs significantly for pointer years of different signs (Supplementary materials, Figure S6). The suppression in cell production and TRW has been associated with the colder August of the previous season and June-July of the current season and prolonged severe winter frosts, but with a warm March–April. Maximum cell production and radial growth were achieved with a warm September of the previous year, stable temperatures during the winter, and a warm June-July. Similar patterns have been observed in the chronologies of Dmean except for winter temperatures. However, Dmax expressed a positive effect of the current season temperatures only during May to the first half of June. CWTmax and CWTmean suffered during the years with low temperatures throughout the summer, but the influence of severe winter frosts was observed before the formation of rings with thick-walled cells, which effects were more pronounced after indexing. The contribution of temperatures after the summer solstice became noticeable in the extremes of the residual Dmean chronology. Whereas the formation of thick walls after the warm end-of-winter period and spring were demonstrated in CWTmean_res chronology.
Smoothing the time series by the 11-year moving average (filtering low-frequency variations) has helped in obtaining higher dendroclimatic correlations reaching 0.5–0.8 for some tree-ring chronologies and climatic variables of the vegetative season (Table 5). As a result of linear regression analysis, two-factor reconstruction models have been selected based on anatomical chronologies (both initial and processed) which explain 32% of the variation in long-term fluctuations for Dbeg and above 61% of the variation in long-term fluctuations for the other considered climatic variables (Table 6). Comparison of the plots of reconstruction models and instrumental series (Figure 7) demonstrated that the obtained models capture the frequency as well as the curve shapes of long-term climatic fluctuations (e.g., more abrupt or more gradual changes). The patterns of reconstructed long-term fluctuations have also been confirmed by the comparison between the GDD reconstruction model and the reconstructed June-July temperature TJJ obtained for western Mongolia (49.95° N 91.28° E, ~220 km southeast of the study area) based on the blue intensity chronology of Siberian larch, which was developed by Davi et al. [59]. A weak positive correlation (r = 0.20, p < 0.05) has been found between these two reconstructed smoothed series of the summer climate characteristics. However, these reconstructions were carried out for different, albeit related variables (e.g., the actual GDD series has a correlation r = 0.38 with the TJJ model per se and r = 0.40 when comparing smoothed series). It has been worth noting that the general patterns of long-term fluctuation of the reconstructed GDD and Mongolian TJJ were still observed during 1524–1648 when the sample depth for wood anatomical chronologies of Siberian stone pine was less than three trees.

4. Discussion

4.1. Quantitative Description of Relationships within Tree-Ring Structure

The tree-ring width as a sum of cell radial diameters is the outcome of cell division in the cambial zone and their subsequent growth by expansion during the season. This indicated an extremely close linear relationship TRW(N) because of a much more severe limitation of D variability compared to cell production. The unabated significance and fitness of linear regression function during upscaling from an individual tree to a habitat scale indicated the main dependence of these D restrictions (range of variance) on the habitat conditions, i.e., soil, landscape, range of climatic fluctuations, and on the common population/provenance [60,61]. The presence of small variability of numerical coefficient for the independent variable N can possibly be explained by differences between allometry of trees [62,63], micro-conditions [64], as well as different proportions of narrow rings, where a significant dependence D(N) leads to a deviation of TRW(N) from the purely linear function. Apparently, in wide rings, the average and maximum values of investigated cellular parameters D and CWT fluctuate around values reflecting the optimal functionality of the xylem for each tree due to the above factors. Stress conditions lead to the inhibition of all growth processes and result in the formation of a few small and thin-walled cells [44], which was indirectly supported by positive correlations between anatomical parameters [65]. An increase of interrelations in the narrow rings led to exponential patterns of D(N) and CWT(N). The uniform shape of the curves for the mean and maximum values of D and CWT presumably indicated this pattern to be a common rule for considering individual zones (earlywood, transition wood, latewood) or even narrower sectors of the tree ring as well as for other morphometric parameters of tracheids, which are functionally related to cell size and wall thickness. This assumption is supported by the exponential dependence of the maximum wood density on TRW as demonstrated by Kirdyanov et al. [66] as wood density is determined mainly by the cell morphometric parameters [67,68]. We assume that the principle of this relationship does not depend at all on the tree species and the nature of stress factor, as entirely the same function curves were obtained for Scots pine wood under the semiarid conditions of the forest-steppe with drought as the main stressor [69]. Different from this previous study, the numerical terms of the exponential models have been selected here with utmost care: Das and CWTas values were calculated mathematically according to their interpretation as optimal values (average for the widest rings).
Indexing of TRW chronologies removes or suppresses long-term trends associated with the dynamics of tree age, size, and intensity of competition. These trends largely vary between trees [9], therefore, the common external signal in the TRW series naturally increases after indexing. Simultaneously, in the proposed indexing of cell anatomical characteristics the suppressed component enclosed the information on the intensity of xylem cell production, which is partially common to all trees, and records environmental conditions before and during the period of cambial activity. Since the nonlinear model has a high dependence on the narrowest rings, the removal of this component suppressed the response to the extremes most crucial for cambial activity. As a result, the indexed anatomical chronologies have mostly preserved the climatic signal recorded during the further stages of xylem cell differentiation, which was just part of the common signal present in the raw series. This has led to a decrease in inter-series correlations after indexing. Remarkably, despite this decrease, the intensity of the climatic signal in anatomical chronologies has been unabated after the indexation. Since the annual variation of climatic factors, as a rule, has a distribution of values close to normal, near-normal distribution of indexed anatomical traits also contributes to the preservation of the significance of the Pearson correlations and the adequacy of their use as an estimate of the climatic response.
The P. sibrica wood has difficulty in separation of early- and latewood zones using any unequivocal quantitative anatomical criterion (for example, Mork’s criterion [70,71]) because of the low ratio of latewood, a relatively small morphometric difference between earlywood and latewood cells, and frequent occurrence of light rings (absence of CWT increment in latewood) due to cold conditions. Therefore, the anatomical characteristics of these zones were assessed in this study indirectly using Dmax and CWTmean_res for earlywood and CWTmax and Dmean_res for latewood.

4.2. Climatic Response Patterns and Separation

There has been a widespread idea that spring-summer temperatures closely regulate the tree growth in the upper boundaries of the growth range, which is a simplistic statement as it does not consider the possibility of a significant influence of other climatic factors and events [12,72,73,74]. However, a deficit in heat supply was the prevailing stressor under the cold-humid conditions of the timberline [74,75], and most of the observed climatic responses from this study during the vegetative season should be interpreted with this viewpoint. Positive correlations of tree-ring parameters with temperatures during the corresponding stage of cell differentiation are provided by a direct effect, namely thermal regulation of the rates of biochemical reactions and increasing the duration of cambial activity by the early start of the vegetative season [44,76,77,78]. Therefore, the sum of active temperatures also turns out to be a very significant factor for tree growth in this ecotone [79,80]. At the end of the season, heat supply affects both the CWT of the latewood cells of the current ring and the synthesis of nonstructural nutrients stored for the next season [81,82]. Therefore N, TRW, and D reflect the climate at the end of the previous vegetative season. Precipitation indirectly serves as a cooling factor, is associated with lesser insolation through cloudiness, and also causes a reduction in soil oxygen concentration and the root activity through waterlogging [83,84]. The positive correlation between the amount of precipitation over the vegetative season and the cell wall thickness, in our opinion, can be an artifact from the positive correlation of this variable with the duration and end date of the season. Temperature fluctuations during the cold season are an additional stress factor that damages tree tissues, which decreases the availability of the resources for secondary growth later [85,86]. Before the beginning of the vegetative season, a combination of positive air temperatures with frozen soil under snow cover leads to physiological drought, which damages the tissues too ([87], see also study of Zhirnova et al. [32] and the effects of winter thawing [88]). The predominantly coinciding directions of pointer years with years of climatic extremes (except for the beginning date of the vegetative season, where the picture is opposite) also indicate a positive effect of high heat supply and the longer duration of the season over cell production, their size, and wall thickness.
The maximum values of cell measurements naturally refer to particular tracheids, located in the first half of earlywood for Dmax and in the middle of latewood for CWTmax. However, these maximum values should generally correspond to larger durations of the respective cell differentiation stage compared to cells of different tree-ring zone, e.g., for conifers in boreal and alpine forests, the literature suggests an estimated time of ~20 days (more than half of the month) for earlywood cell expansion and >30 days for latewood cell wall deposition [89,90,91]. Additionally, there are variations associated with (1) location of the largest (most thick-walled) cell within earlywood (latewood), and (2) year-to-year phenological shifts of the onset and cessation of xylogenesis (observed, e.g., in [77]). This introduces temporal uncertainty about the calendar intervals in the development of Dmax and CWTmax and expands the intra-seasonal window of actual climatic records in their long-term chronologies. Thus, significant dendroclimatic correlations are expected on a monthly scale if actual climate–growth relationships exist for these anatomical parameters.
After separating the climatic signal by indexing the anatomical chronologies, the obtained signal was accentuated during the parts of the season corresponding with the seasonality of the processes of cell expansion (D) and the deposition of the secondary cell wall (CWT) and commonly weakened for a period of cambial activity (N). It means that in a dendroclimatic analysis (including reconstructions) of quantitative wood anatomical traits, the intra-seasonal framework of the modeled climatic proxy can be adjusted not only by choosing certain zones of the tree ring and particular anatomical parameters but also by choice of raw and/or indexed anatomical chronologies.

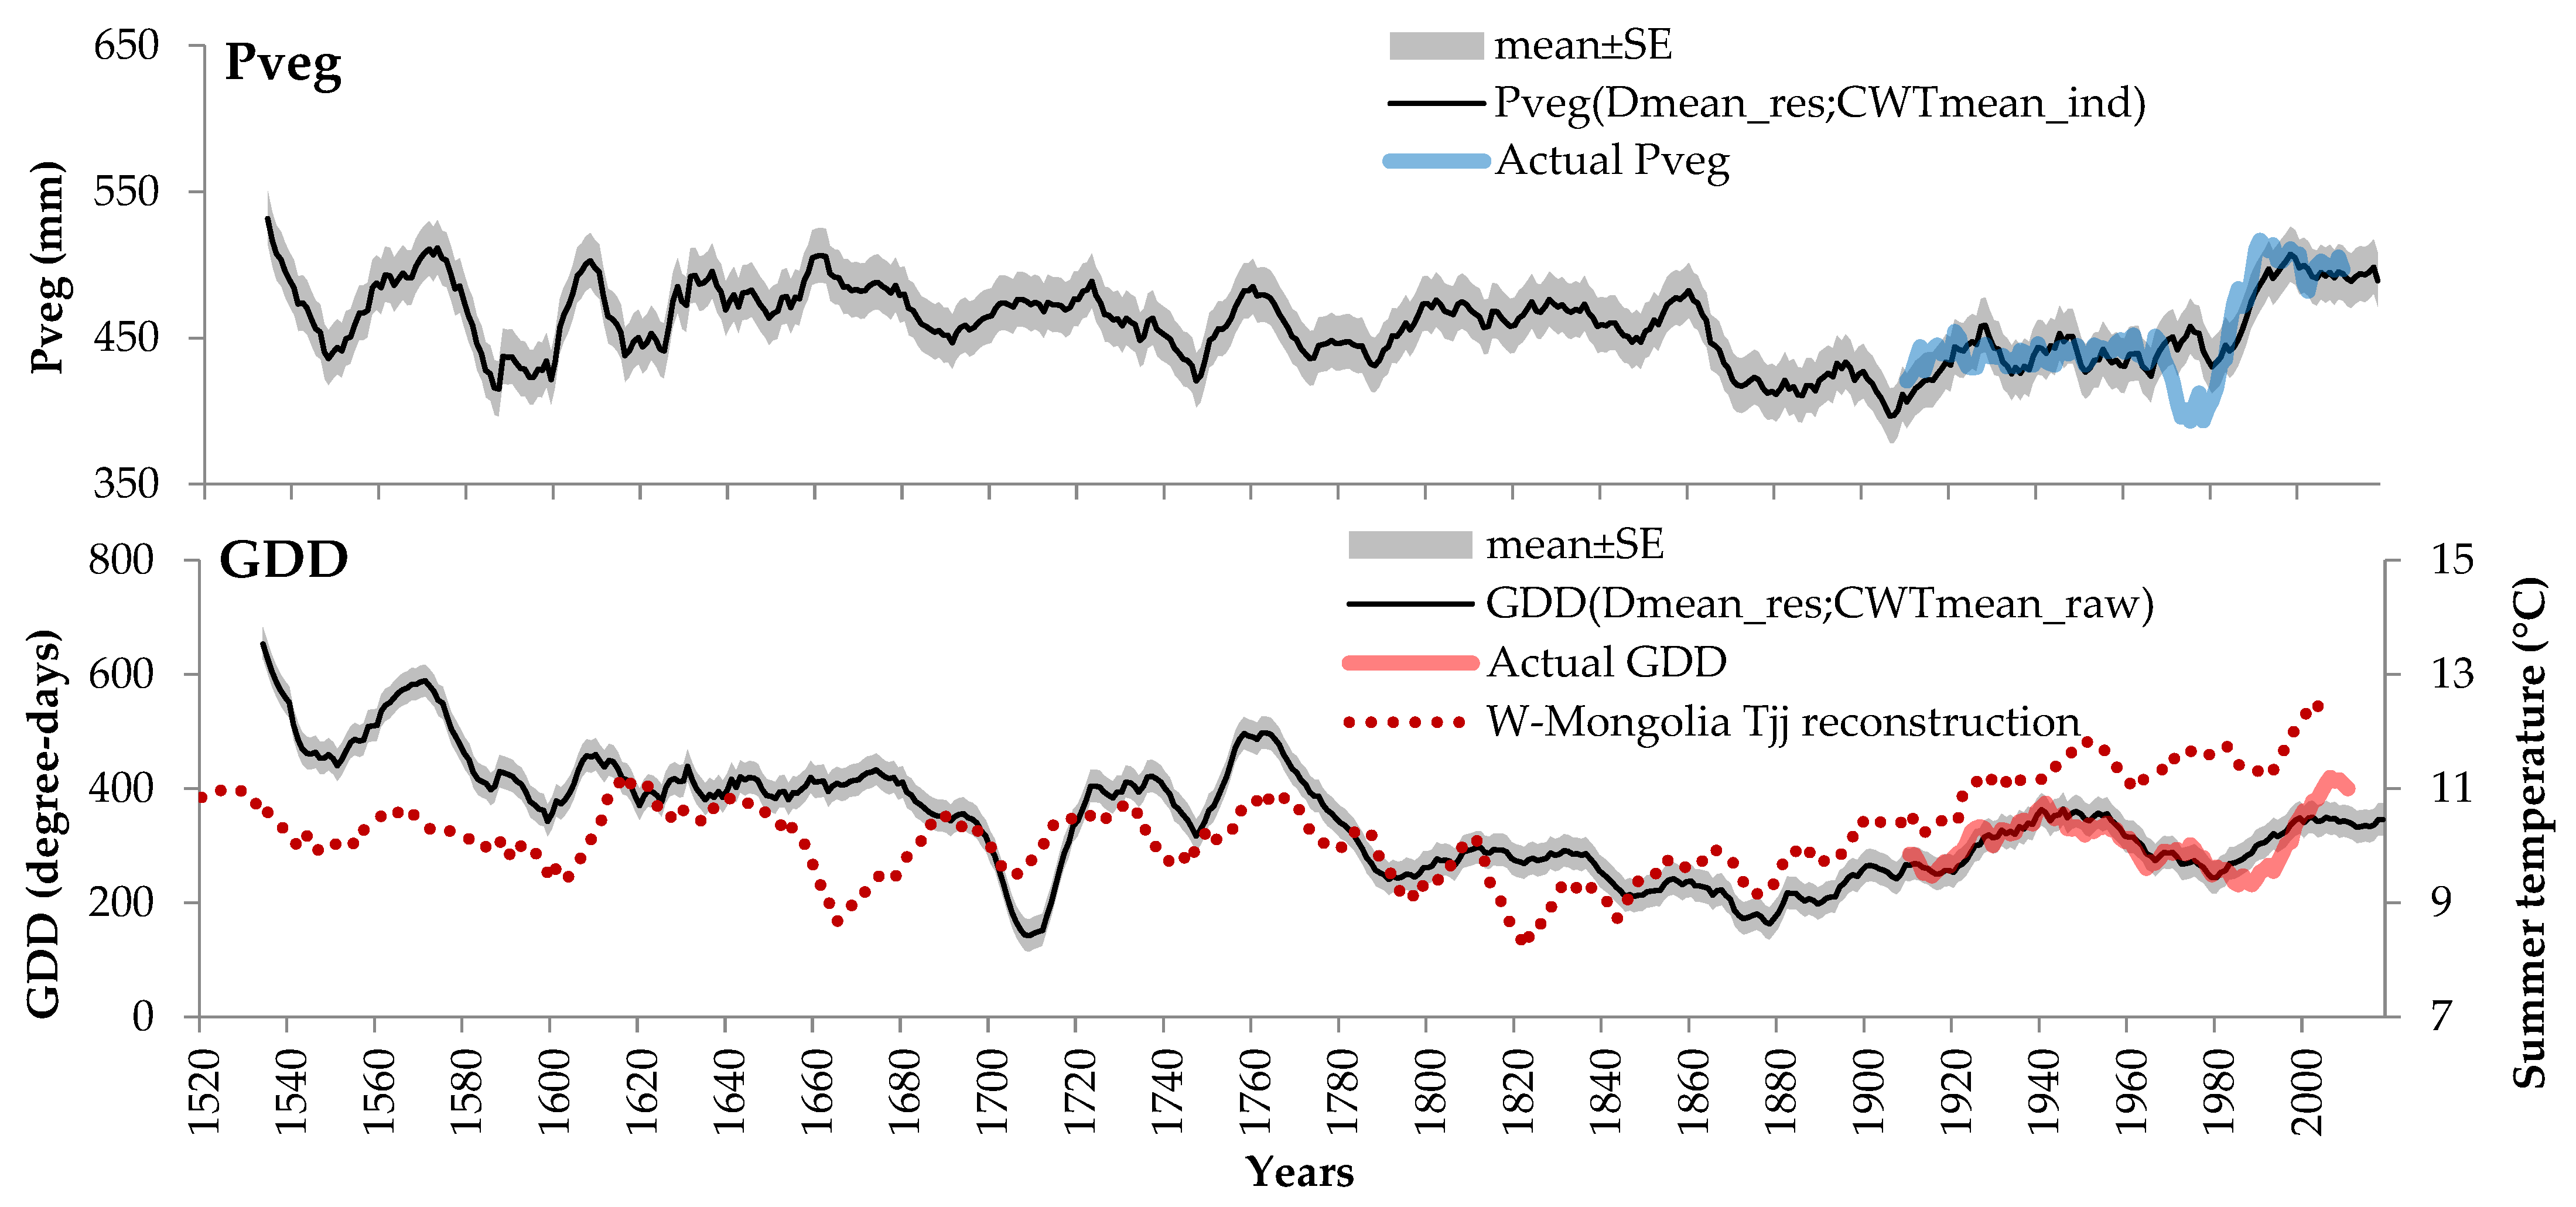
4.3. Reconstruction of the Climatic Characteristics of the Vegetative Season

The reconstruction models obtained under this study used quite integral climatic variables. It has led to the inclusion of non-indexed anatomical chronologies in the models, which to a certain extent integrates the climatic response from the previous stages of tracheid differentiation in addition to their own. Interestingly, both radial growth and anatomical chronologies have a pronounced similarity in the dynamics and pointer years not only with the high-frequency climatic fluctuations but to a much greater extent with the low-frequency changes in the characteristics of the vegetative season. The observation of Kharuk et al. [30] indirectly supported the reaction of P. sibirica with long-term climatic fluctuations rather than year-to-year climatic variations. according to that study, the correlations of its TRW were significant during the period of rapid warming (and were even more definite than for larch, a species known for its climate sensitivity), but were absent for the period of stable temperatures before it. However, our observations show that morphometric traits of P. sibirica tracheids have even more pronounced climatogenic long-term fluctuations as compared to cell production and TRW.
As shown in the study of Nikolaeva et al. [17], the radial growth of Siberian stone pine in high mountains is characterized by significant long-term changes caused by geomorphological processes and stand dynamics. As obvious, such impacts, especially related to changes in stand density, can vary for individual trees depending on their spatial location and competitive position in the stand. For example, the death of a large dominant tree can sharply intensify the growth of the surrounding oppressed trees due to an increase in available resources and living space [92,93], which can significantly distort the picture of long-term climatogenic fluctuations in radial growth [94]. On the other hand, the hydraulic architecture and thus the anatomical structure of the xylem have functional limitations within one population and habitat tightly linked to the environmental temperature and moisture availability [95,96], and therefore to climatic conditions. In addition, we can assume that water supply through a high percentage of sapwood area (i.e., a lesser pronounced lumen limitation in latewood) and a high proportion of sapwood within trunk cross-section (e.g., ~55% in [97]) caused long-term autocorrelation in the water supply capacity of stem xylem of Siberian stone pine. The colder areas like the upper timberline typically witness slow growth of trees [98] and therefore observed lesser changes in tree water demands except in cases of partial die-off. This effect was enhanced by the fact that stone pines implement a common strategy of slow accumulation and utilization of resources [99], which has been demonstrated by Ning et al. [100] in a comparative study of P. coraensis and larch. Further, stone pines of the study area are reaching a massive size (in diameter, height, and area of the photosynthetic apparatus) in their long lifespan, which indicates their relatively large capacity of accumulating non-structural assimilates in storage tissues. We believe that all of the aforementioned factors caused the synchronicity of long-term climatic fluctuations with corresponding, albeit more subtle, slow changes in the wood anatomical structure of P. sibirica. Thus, this same combination of the ecophysiological features might have been the reason behind its well-known low sensitivity of radial growth to high-frequency climatic fluctuations due to which this species and its closest relatives are still being underestimated by dendrochronologists.
Comparison between the obtained model of the vegetative season GDD and one of the nearest territorially reconstructions of summer temperatures [59] exhibited similar fluctuation in heat supply even in the period of insufficient sample depth, which has supported the revealed dendroclimatic relationships. However, in addition to the obvious stochastic uncertainties, the differences observed in the models might be related to several reasons. Firstly, the reconstruction models are of two different climatic variables, albeit related to each other, but differing in seasonality and calculation method. Secondly, the desynchronization could be provided by a distance of above 200 km between the respective study areas and their location on different macro-slopes of the large mountain system. Thirdly, the contribution of different intensity and seasonality of the temperature response of the used proxies is possible (differences between stone pine and larch species and the use of different tree-ring parameters). A discrepancy in the longest centennial fluctuations is also possible, which has been recorded for long-term temperature reconstructions even on the global scale [101]. These considerations require further analysis and continued research into the possibilities of obtaining long-term climatic reconstructions based on anatomical chronologies.

5. Conclusions

This study demonstrates quantitative wood anatomy as the best alternative measure of traditional dendroclimatology of P. sibirica for climatic fluctuations which cannot be detected in TRW. Additionally, the morphometric parameters free from the influence of cell production offers better climatic signal recorded at corresponding stages of cell differentiation. Further, the dendroclimatic analysis revealed the prevailing growth dependence of P. sibirica tree on heat supply due to cold-humid conditions of timberline in the study area. Climatic signal in anatomical chronologies was separated from the signal in cell production after their indexation. This indicates that the intra-seasonal framework of dendroclimatic reconstructions based on quantitative wood anatomical traits can be adjusted through selecting specific zones/traits of the tree rings and including raw and/or indexed chronologies. The radial and especially anatomical chronologies of P. sibirica revealed pronounced similarities in the dynamics and pointer years to a greater extent with low-frequency climatic fluctuations. The synchronicity of long-term climatic fluctuations with corresponding, albeit more subtle, changes in the wood anatomical structure, is thought to be part of the physiological adaptation strategy of P. sibirica. Comparison between the obtained model of the vegetative season GDD and one of the nearest territorially reconstructions of summer temperatures from Mongolia exhibited similar fluctuation in heat supply even in the period of insufficient sample depth, which has supported the revealed dendroclimatic relationships.

Supplementary Materials

The following supporting information can be downloaded at: https://www.mdpi.com/article/10.3390/f13020247/s1, Figure S1: Average monthly climatic diagram of the study region; Figure S2: Calculation of tree-ring characteristics from tracheidograms of cell radial diameter D and cell wall thickness CWT; Figure S3: Distribution density of measured (a) and indexed (b) tree-ring anatomical characteristics for seven individual trees and total sample; Figure S4: Quantile-quantile plots of measured (a) and indexed (b) tree-ring anatomical characteristics standardized to z-scores (mean 0, standard deviation 1) against standard normal distribution; Figure S5: local chronologies of tree-ring traits and moving average series of precipitation and temperature; Figure S6: Temperature anomalies smoothed by 21-day moving average for positive and negative pointer years in chronologies of tree-ring parameters; Table S1: Correlation coefficients between tree-ring chronologies and temperature-related characteristics of vegetative season defined through threshold value Tthr in regional temperature series.

Author Contributions

Conceptualization, D.F.Z. and L.V.B.; methodology, E.A.V.; validation, S.K.T. and E.A.B.; formal analysis, L.V.B.; investigation, D.F.Z. and L.V.B.; resources, D.F.Z.; data curation, L.V.B.; writing—original draft preparation, D.F.Z., L.V.B. and K.K.U.; writing—review and editing, all authors; visualization, L.V.B.; supervision, E.A.B.; project administration, D.F.Z.; funding acquisition, E.A.V. All authors have read and agreed to the published version of the manuscript.

Funding

This research was funded by the Russian Federation represented by the Ministry of Science and Higher Education of Russia in the framework of a large-scale research project «Socio-Economic Development of Asian Russia on the Basis of Synergy of Transport Accessibility, System Knowledge of the Natural Resource Potential, Expanding Space of Inter-Regional Interactions», Agreement no. 075-15-2020-804 dated 02 October 2020 [grant No. 13.1902.21.0016].

Data Availability Statement

The data presented in this study are available on request from the corresponding author.

Conflicts of Interest

The authors declare no conflict of interest. The funder had no role in the design of the study; in the collection, analyses, or interpretation of data; in the writing of the manuscript, or in the decision to publish the results.

References

  1. White, A.; Cannell, M.G.; Friend, A.D. CO2 stabilization, climate change and the terrestrial carbon sink. Glob. Chang. Biol. 2000, 6, 817–833. [Google Scholar] [CrossRef]
  2. Parks, C.G.; Bernier, P. Adaptation of forests and forest management to changing climate with emphasis on forest health: A review of science, policies and practices. For. Ecol. Manag. 2010, 259, 657–659. [Google Scholar] [CrossRef]
  3. Pugh, T.A.; Lindeskog, M.; Smith, B.; Poulter, B.; Arneth, A.; Haverd, V.; Calle, L. Role of forest regrowth in global carbon sink dynamics. Proc. Natl. Acad. Sci. USA 2019, 116, 4382–4387. [Google Scholar] [CrossRef] [PubMed] [Green Version]
  4. Mérian, P.; Bontemps, J.D.; Bergés, L.; Lebourgeois, F. Spatial variation and temporal instability in climate-growth relationships of sessile oak (Quercus petraea [Matt.] Liebl.) under temperate conditions. Plant Ecol. 2011, 212, 1855–1871. [Google Scholar] [CrossRef]
  5. Crimmins, S.M.; Dobrowski, S.Z.; Greenberg, J.A.; Abatzoglou, J.T.; Mynsberge, A.R. Changes in climatic water balance drive downhill shifts in plant species’ optimum elevations. Science 2011, 331, 324–327. [Google Scholar] [CrossRef] [PubMed]
  6. Piao, S.; Liu, Q.; Chen, A.; Janssens, I.A.; Fu, Y.; Dai, J.; Liu, L.; Lian, X.U.; Shen, M.; Zhu, X. Plant phenology and global climate change: Current progresses and challenges. Glob. Chang. Biol. 2019, 25, 1922–1940. [Google Scholar] [CrossRef]
  7. Tripathi, S.K. The need for establishing long-term ecological research stations network in India. Curr. Sci. 2010, 98, 21–22. [Google Scholar]
  8. Shiyatov, S.G. Dendrochronology, its principles and methods. In Problems of Botany in the Urals. Notes of the Soviet Union Botanical Society; Ural Scientific Center of the USSR Academy of Sciences: Sverdlovsk, Russia, 1973; Volume 6, pp. 53–81. (In Russian) [Google Scholar]
  9. Upadhyay, K.K.; Shah, S.K.; Roy, A.; Tripathi, S.K. Dendroclimatology of teak indicates prevailing climatic conditions of tropical moist forests in India. Ecol. Indic. 2021, 129, 107888:1–107888:11. [Google Scholar] [CrossRef]
  10. Cook, E.R.; Kairiukstis, L.A. Methods of Dendrochronology: Applications in the Environmental Sciences; Kluwer Academic Publishers: Dordrecht, The Netherlands, 1990. [Google Scholar]
  11. Brodersen, C.R.; Germino, M.J.; Johnson, D.M.; Reinhardt, K.; Smith, W.K.; Resler, L.M.; Bader, M.Y.; Sala, A.; Kueppers, L.M.; Broll, G.; et al. Seedling survival at timberline is critical to conifer mountain forest elevation and extent. Front. For. Glob. Chang. 2019, 2, 9. [Google Scholar] [CrossRef]
  12. Körner, C. Alpine Plant Life: Functional Plant Ecology of High Mountain Ecosystems; Springer: Berlin, Germany, 2003. [Google Scholar] [CrossRef]
  13. Grissino-Mayer, H.D. An updated list of species used in tree-ring research. Tree-Ring Bull. 1993, 53, 17–43. [Google Scholar]
  14. Vaganov, E.A.; Shiyatov, S.G.; Mazepa, V.S. Dendroclimatic Research in the Ural-Siberian Subarctic; Nauka: Novosibirsk, Russia, 1996. (In Russian) [Google Scholar]
  15. D’Arrigo, R.; Frank, D.; Pederson, N.; Cook, E.; Buckley, B.; Nachin, B.; Mijiddorj, R.; Dugarjav, C. 1738 years of Mongolian temperature variability inferred from a tree-ring width chronology of Siberian pine. Geophys. Res. Lett. 2001, 28, 543–546. [Google Scholar] [CrossRef] [Green Version]
  16. Gerasimova, O.V.; Zharnikov, Z.Y.; Knorre, A.A.; Myglan, V.S. Climaticaly induced dynamic of radial growth of Siberian stone pine and Siberian fir in the mountaintaiga belt in “Ergaki” National Park. J. Sib. Fed. Univ. Biol. 2010, 3, 18–29. (In Russian) [Google Scholar]
  17. Nikolaeva, S.A.; Savchuk, D.A.; Bocharov, A.Y. Influence of Different Factors on Tree Growth of Pinus sibirica in the Highlands of the Central Altai Mountains. J. Sib. Fed. Univ. Biol. 2015, 8, 299–318. (In Russian) [Google Scholar] [CrossRef]
  18. Carrer, M.; Unterholzner, L.; Castagneri, D. Wood anatomical traits highlight complex temperature influence on Pinus cembra at high elevation in the Eastern Alps. Int. J. Biometeorol. 2018, 62, 1745–1753. [Google Scholar] [CrossRef]
  19. Wang, H.; Shao, X.M.; Jiang, Y.; Fang, X.Q.; Wu, S.H. The impacts of climate change on the radial growth of Pinus koraiensis along elevations of Changbai Mountain in northeastern China. For. Ecol. Manag. 2013, 289, 333–340. [Google Scholar] [CrossRef]
  20. Yu, D.; Liu, J.; Lewis, B.J.; Li, Z.; Wangming, Z.; Xiangmin, F.; Yawei, W.; Shengwei, J.; Limin, D. Spatial variation and temporal instability in the climate–growth relationship of Korean pine in the Changbai Mountain region of Northeast China. For. Ecol. Manag. 2013, 300, 96–105. [Google Scholar] [CrossRef]
  21. Cerrato, R.; Salvatore, M.C.; Gunnarson, B.E.; Linderholm, H.W.; Carturan, L.; Brunetti, M.; De Blasi, F.; Baroni, C. A Pinus cembra L. tree-ring record for late spring to late summer temperature in the Rhaetian Alps, Italy. Dendrochronologia 2019, 53, 22–31. [Google Scholar] [CrossRef]
  22. Hantemirov, R.M.; Shiyatov, S.G. A continuous multimillennial ring-width chronology in Yamal, northwestern Siberia. Holocene 2002, 12, 717–726. [Google Scholar] [CrossRef]
  23. Khansaritoreh, E.; Dulamsuren, C.; Klinge, M.; Ariunbaatar, T.; Bat-Enerel, B.; Batsaikhan, G.; Ganbaatar, K.; Saindovdon, D.; Yeruult, Y.; Tsogtbaatar, J.; et al. Higher climate warming sensitivity of Siberian larch in small than large forest islands in the fragmented Mongolian forest steppe. Glob. Chang. Biol. 2017, 23, 3675–3689. [Google Scholar] [CrossRef]
  24. Zhirnova, D.F.; Belokopytova, L.V.; Babushkina, E.A.; Crivellaro, A.; Vaganov, E.A. Earlywood structure of evergreen conifers near forest line is habitat driven but latewood depends on species and seasons. Trees 2021, 35, 479–492. [Google Scholar] [CrossRef]
  25. Polikarpov, N.P.; Chebakova, N.M.; Nazimova, D.I. Climate and Mountain Forests of Southern Siberia; Nauka: Novosibirsk, Russia, 1986. (In Russian) [Google Scholar]
  26. Chytrý, M.; Danihelka, J.; Kubešová, S.; Lustyk, P.; Ermakov, N.; Hájek, M.; Hájková, P.; Kočí, M.; Otýpková, Z.; Roleček, J.; et al. Diversity of forest vegetation across a strong gradient of climatic continentality: Western Sayan Mountains, southern Siberia. Plant Ecol. 2008, 196, 61–83. [Google Scholar] [CrossRef]
  27. Timoshok, E.E.; Skorokhodov, S.N.; Timoshok, E.N. Ecological and coenotic description of Siberian stone pine (Pinus sibirica Du Tour) at the highest line of its distribution in the Central Altai. Tomsk State Univ. J. Biol. 2012, 4, 171–184. (In Russian) [Google Scholar] [CrossRef]
  28. Petrova, E.A.; Goroshkevich, S.N.; Belokon, M.M.; Belokon, Y.S.; Politov, D.V. Distribution of the genetic diversity of the Siberian stone pine, Pinus sibirica Du Tour, along the latitudinal and longitudinal profiles. Russ. J. Genet. 2014, 50, 467–482. [Google Scholar] [CrossRef]
  29. Kulagin, A.Y.; Davydychev, A.N.; Zaitsev, G.A. Specific features of the growth of Siberian spruce (Picea obovata Ledeb.) at early stages of ontogeny in broadleaf-conifer forests of the Ufa plateau. Russ. J. Ecol. 2006, 37, 66–69. [Google Scholar] [CrossRef]
  30. Kharuk, V.I.; Ranson, K.J.; Im, S.T.; Dvinskaya, M.L. Response of Pinus sibirica and Larix sibirica to climate change in southern Siberian alpine forest–tundra ecotone. Scand. J. For. Res. 2009, 24, 130–139. [Google Scholar] [CrossRef]
  31. Monnier, Y.; Prévosto, B.; Ripert, C.; Corbani, A.C.; Fernandez, C. Forest microhabitats differentially influence seedling phenology of two co-existing Mediterranean oak species. J. Veg. Sci. 2012, 23, 260–270. [Google Scholar] [CrossRef]
  32. Zhirnova, D.F.; Babushkina, E.A.; Belokopytova, L.V.; Yurin, D.O.; Vaganov, E.A. Sunshine as culprit: It induces early spring physiological drought in dark coniferous (Pinus sibirica and Abies sibirica) alpine forest. For. Ecol. Manag. 2019, 449, 117458. [Google Scholar] [CrossRef] [Green Version]
  33. Zhirnova, D.F.; Belokopytova, L.V.; Meko, D.M.; Babushkina, E.A.; Vaganov, E.A. Climate change and tree growth in the Khakass-Minusinsk Depression (South Siberia) impacted by large water reservoirs. Sci. Rep. 2021, 11, 14266. [Google Scholar] [CrossRef]
  34. Büntgen, U. Re-thinking the boundaries of dendrochronology. Dendrochronologia 2019, 53, 1–4. [Google Scholar] [CrossRef]
  35. Wang, H.; Shao, X.; Fang, X.; Jiang, Y.; Liu, C.; Qiao, Q. Relationships between tree-ring cell features of Pinus koraiensis and climate factors in the Changbai Mountains, Northeastern China. J. For. Res. 2017, 28, 105–114. [Google Scholar] [CrossRef]
  36. Fonti, P.; von Arx, G.; García-González, I.; Eilmann, B.; Sass-Klaassen, U.; Gärtner, H.; Eckstein, D. Studying global change through investigation of the plastic responses of xylem anatomy in tree rings. New Phytol. 2010, 185, 42–53. [Google Scholar] [CrossRef] [PubMed]
  37. Panyushkina, I.P.; Hughes, M.K.; Vanganov, E.A.; Munro, M.A.R. Summer temperature in northeastern Siberia since 1642 reconstructed from tracheid dimensions and cell numbers of Larix cajanderi. Can. J. For. Res. 2003, 33, 1905–1914. [Google Scholar] [CrossRef]
  38. Wang, H.; Shao, X.M.; Fang, X.Q.; Yin, Z.Y.; Chen, L.; Zhao, D.S.; Wu, S.H. Responses of Pinus koraiensis tree ring cell scale parameters to climate elements in the Changbai Mountains. China J. Plant. Ecol. 2011, 22, 2643–2652. [Google Scholar]
  39. Ziaco, E.; Biondi, F.; Heinrich, I. Wood cellular dendroclimatology: Testing new proxies in Great Basin bristlecone pine. Front. Plant Sci. 2016, 7, 1602. [Google Scholar] [CrossRef] [Green Version]
  40. Balanzategui, D.; Nordhauß, H.; Heinrich, I.; Biondi, F.; Miley, N.; Hurley, A.G.; Ziaco, E. Wood Anatomy of Douglas-Fir in Eastern Arizona and Its Relationship with Pacific Basin Climate. Front. Plant Sci. 2021, 12, 702442:1–702442:14. [Google Scholar] [CrossRef]
  41. Frank, D.A.; Reichstein, M.; Bahn, M.; Thonicke, K.; Frank, D.; Mahecha, M.D.; Smith, P.; van der Velde, M.; Vicca, S.; Babst, F.; et al. Effects of climate extremes on the terrestrial carbon cycle: Concepts, processes and potential future impacts. Glob. Chang. Biol. 2015, 21, 2861–2880. [Google Scholar] [CrossRef] [Green Version]
  42. Reichstein, M.; Bahn, M.; Ciais, P.; Frank, D.; Mahecha, M.D.; Seneviratne, S.I.; Zscheischler, J.; Beer, C.; Buchmann, N.; Frank, D.C.; et al. Climate extremes and the carbon cycle. Nature 2013, 500, 287–295. [Google Scholar] [CrossRef]
  43. Larson, P.R. The Vascular Cambium. Development and Structure; Springer: Berlin/Heidelberg, Germany, 1994. [Google Scholar]
  44. Vaganov, E.A.; Hughes, M.K.; Shashkin, A.V. Growth Dynamics of Conifer Tree Rings: Images of Past and Future Environments; Springer: Dordrecht, Germany, 2006. [Google Scholar]
  45. Compo, G.P.; Whitaker, J.S.; Sardeshmukh, P.D.; Matsui, N.; Allan, R.J.; Yin, X.; Gleason, B.E.; Vose, R.S.; Rutledge, G.; Bessemoulin, P.; et al. The Twentieth Century Reanalysis Project. Q. J. Roy. Meteorol. Soc. 2011, 137, 1–28. [Google Scholar] [CrossRef]
  46. Polikarpov, N.P.; Nazimova, D.I. The dark coniferous forests of the northern part of the west Siberian mountains. In Forestry Research in the Forests of Siberia; Institute for Forests and Wood: Krasnoyarsk, Russia, 1963; pp. 103–147. (In Russian) [Google Scholar]
  47. Monserud, R.A.; Tchebakova, N.M. A vegetation model for the Sayan Mountains, southern Siberia. Can. J. For. Res. 1996, 26, 1055–1068. [Google Scholar] [CrossRef]
  48. Holmes, R.L. Computer-assisted quality control in tree-ring dating and measurement. Tree-Ring Bull. 1983, 43, 68–78. [Google Scholar]
  49. Rinn, F. TSAP-Win: Time Series Analysis and Presentation for Dendrochronology and Related Applications: User Reference; RINNTECH: Heidelberg, Germany, 2003. [Google Scholar]
  50. Cook, E.R.; Krusic, P.J. Program ARSTAN: A Tree-Ring Standardization Program Based on Detrending and Autoregressive Time Series Modeling, with Interactive Graphics; Lamont-Doherty Earth Observatory, Columbia University: Palisades, NY, USA, 2005. [Google Scholar]
  51. Silkin, P.P. Methods of Multiparameter Analysis of Conifers Tree-Rings Structure; Siberian Federal University: Krasnoyarsk, Russia, 2010. (In Russian) [Google Scholar]
  52. Seo, J.W.; Smiljanić, M.; Wilmking, M. Optimizing cell-anatomical chronologies of Scots pine by stepwise increasing the number of radial tracheid rows included—Case study based on three Scandinavian sites. Dendrochronologia 2014, 32, 205–209. [Google Scholar] [CrossRef]
  53. Vaganov, E.A. The tracheidogram method in tree-ring analysis and its application. In Methods of Dendrochronology. Application in Environmental Sciences; Cook, E.R., Kairiukstis, L.A., Eds.; Kluwer Academic Publishers: Dordrecht, Germany, 1990; pp. 63–75. [Google Scholar]
  54. Wilks, D.S. Statistical Methods in the Atmospheric Sciences; Elsevier: Cambridge, UK, 2019. [Google Scholar]
  55. Methodological Guidelines for Compiling an Agrometeorological Yearbook for the Agricultural Zone of the Russian Federation; Guiding Document 52.33.725-2010.; Roshydromet: Obninsk, Russia, 2010. (In Russian)
  56. Sadokov, V.P.; Kozeltseva, V.F.; Kuznetsova, N.N. Determination of spring dates for a stable transition of the average daily air temperature through 0, +5 °C, their forecast and assessment. Proc. Hydrometeorol. Res. Cent. Russ. Fed. 2012, 348, 162–172. (In Russian) [Google Scholar]
  57. Schweingruber, F.H.; Eckstein, D.; Serre-Bachet, F.; Braker, O.U. Identification, presentation and interpretation of event years and pointer years in dendrochronology. Dendrochronologia 1990, 8, 9–38. [Google Scholar]
  58. Meko, D.M.; Baisan, C.H. Pilot study of latewood width of conifers as an indicator of variability of summer rainfall in the North American monsoon region. Int. J. Climatol. J. R. Meteorol. Soc. 2001, 21, 697–708. [Google Scholar] [CrossRef]
  59. Davi, N.K.; Rao, M.P.; Wilson, R.; Andreu-Hayles, L.; Oelkers, R.; D’Arrigo, R.; Nachin, B.; Buckley, B.; Pederson, N.; Leland, C.; et al. Accelerated recent warming and temperature variability over the past eight centuries in the Central Asian Altai from blue intensity in tree rings. Geophys. Res. Lett. 2021, 48, e2021GL092933. [Google Scholar] [CrossRef]
  60. Darikova, Y.A.; Vaganov, E.A.; Kuznetsova, G.V.; Grachev, A.M. Changes in the anatomical structure of tree rings of the rootstock and scion in the heterografts of Siberian pine. Trees 2013, 27, 1621–1631. [Google Scholar] [CrossRef]
  61. Matisons, R.; Krišāns, O.; Kārkliņa, A.; Adamovičs, A.; Jansons, Ā.; Gärtner, H. Plasticity and climatic sensitivity of wood anatomy contribute to performance of eastern Baltic provenances of Scots pine. For. Ecol. Manag. 2019, 452, 117568. [Google Scholar] [CrossRef]
  62. Mencuccini, M.; Grace, J.; Fioravanti, M. Biomechanical and hydraulic determinants of tree structure in Scots pine: Anatomical characteristics. Tree Physiol. 1997, 17, 105–113. [Google Scholar] [CrossRef]
  63. Kašpar, J.; Anfodillo, T.; Treml, V. Tree size mostly drives the variation of xylem traits at the treeline ecotone. Trees 2019, 33, 1657–1665. [Google Scholar] [CrossRef]
  64. Van Do, T.; Sato, T.; Saito, S.; Kozan, O.; Yamagawa, H.; Nagamatsu, D.; Nishimura, N.; Manabe, T. Effects of micro-topographies on stand structure and tree species diversity in an old-growth evergreen broad-leaved forest, southwestern Japan. Glob. Ecol. Conserv. 2015, 4, 185–196. [Google Scholar] [CrossRef] [Green Version]
  65. Pritzkow, C.; Heinrich, I.; Grudd, H.; Helle, G. Relationship between wood anatomy, tree-ring widths and wood density of Pinus sylvestris L. and climate at high latitudes in northern Sweden. Dendrochronologia 2014, 32, 295–302. [Google Scholar] [CrossRef]
  66. Kirdyanov, A.V.; Vaganov, E.A.; Hughes, M.K. Separating the climatic signal from tree-ring width and maximum latewood density records. Trees 2007, 21, 37–44. [Google Scholar] [CrossRef]
  67. Björklund, J.; Seftigen, K.; Schweingruber, F.; Fonti, P.; von Arx, G.; Bryukhanova, M.V.; Cuny, H.E.; Carrer, M.; Castagneri, D.; Frank, D.C. Cell size and wall dimensions drive distinct variability of earlywood and latewood density in Northern Hemisphere conifers. New Phytol. 2017, 216, 728–740. [Google Scholar] [CrossRef] [PubMed] [Green Version]
  68. Rathgeber, C.B. Conifer tree-ring density interannual variability–anatomical, physiological and environmental determinants. New Phytol. 2017, 216, 621–625. [Google Scholar] [CrossRef] [Green Version]
  69. Babushkina, E.A.; Dergunov, D.R.; Belokopytova, L.V.; Zhirnova, D.F.; Upadhyay, K.K.; Tripathi, S.K.; Zharkov, M.S.; Vaganov, E.A. Non-linear response to cell number revealed and eliminated from long-term tracheid measurements of Scots pine in Southern Siberia. Front. Plant Sci. 2021, 12, 719796. [Google Scholar] [CrossRef]
  70. Mork, E. Die Qualitat des Fichtenhozes unter besonder Rucksichtnahme auf Schleif und Papierholz. Der Pap. Fabr. 1928, 26, 741–747. (In German) [Google Scholar]
  71. Denne, M. Definition of latewood according to Mork. IAWA Bull. 1989, 10, 59–62. [Google Scholar] [CrossRef]
  72. Naurzbaev, M.M.; Vaganov, E.A. Variation of early summer and annual temperature in east Taymir and Putoran (Siberia) over the last two millennia inferred from tree rings. J. Geophys. Res. Atmos. 2000, 105, 7317–7326. [Google Scholar] [CrossRef]
  73. Oberhuber, W.; Kofler, W.; Pfeifer, K.; Seeber, A.; Gruber, A.; Wieser, G. Long-term changes in tree-ring–climate relationships at Mt. Patscherkofel (Tyrol, Austria) since the mid-1980s. Trees 2008, 22, 31–40. [Google Scholar] [CrossRef] [Green Version]
  74. Jochner, M.; Bugmann, H.; Nötzli, M.; Bigler, C. Tree growth responses to changing temperatures across space and time: A fine-scale analysis at the treeline in the Swiss Alps. Trees 2018, 32, 645–660. [Google Scholar] [CrossRef]
  75. King, G.; Fonti, P.; Nievergelt, D.; Büntgen, U.; Frank, D. Climatic drivers of hourly to yearly tree radius variations along a 6 degrees C natural warming gradient. Agric. For. Meteorol. 2013, 168, 36–46. [Google Scholar] [CrossRef]
  76. Gindl, W.; Grabner, M.; Wimmer, R. Effects of altitude on tracheid differentiation and lignification of Norway spruce. Can. J. Bot. 2001, 79, 815–821. [Google Scholar] [CrossRef]
  77. Rossi, S.; Anfodillo, T.; Čufar, K.; Cuny, H.E.; Deslauriers, A.; Fonti, P.; Frank, D.; Gričar, J.; Gruber, A.; King, G.M.; et al. A meta-analysis of cambium phenology and growth: Linear and non-linear patterns in conifers of the northern hemisphere. Ann. Bot. 2013, 112, 1911–1920. [Google Scholar] [CrossRef]
  78. Begum, S.; Nakaba, S.; Yamagishi, Y.; Oribe, Y.; Funada, R. Regulation of cambial activity in relation to environmental conditions: Understanding the role of temperature in wood formation of trees. Physiol. Plant. 2013, 147, 46–54. [Google Scholar] [CrossRef] [PubMed]
  79. Moreau, G.; Chagnon, C.; Auty, D.; Caspersen, J.; Achim, A. Impacts of climatic variation on the growth of black spruce across the forest-tundra ecotone: Positive effects of warm growing seasons and heat waves are offset by late spring frosts. Front. For. Glob. Chang. 2020, 3, 145. [Google Scholar] [CrossRef]
  80. Searls, T.; Zhu, X.; McKenney, D.W.; Mazumder, R.; Steenberg, J.; Yan, G.; Meng, F.R. Assessing the influence of climate on the growth rate of boreal tree species in northeastern Canada through long-term permanent sample plot data sets. Can. J. For. Res. 2021, 51, 1039–1049. [Google Scholar] [CrossRef]
  81. Kozlowski, T.T. Carbohydrate sources and sinks in woody plants. Bot. Rev. 1992, 58, 107–222. [Google Scholar] [CrossRef]
  82. Pallardy, S.G. Physiology of Woody Plant, 3rd ed.; Academic Press: San Diego, CA, USA, 2010. [Google Scholar]
  83. Bazzoffi, P.; Nieddu, S. Effects of water logging on the soil structure of some Italian soils in relation to the GAEC cross-compliance standard maintenance of farm channel networks and field convexity. Ital. J. Agron. 2011, 6 (Suppl. S1), 63. [Google Scholar] [CrossRef] [Green Version]
  84. Yin, D.; Xu, D.; Tian, K.; Xiao, D.; Zhang, W.; Sun, D.; Sun, H.; Zhang, Y. Radial growth response of Abies georgei to climate at the upper timberlines in central Hengduan Mountains, Southwestern China. Forests 2018, 9, 606. [Google Scholar] [CrossRef] [Green Version]
  85. Mayr, S.; Wolfschwenger, M.; Bauer, H. Winter-drought induced embolism in Norway spruce (Picea abies) at the Alpine timberline. Physiol. Plant. 2002, 115, 74–80. [Google Scholar] [CrossRef] [Green Version]
  86. Mayr, S.; Schmid, P.; Rosner, S. Winter embolism and recovery in the conifer shrub Pinus mugo L. Forests 2019, 10, 941. [Google Scholar] [CrossRef] [Green Version]
  87. D’Arrigo, R.D.; Jacoby, G.C.; Free, R.M. Tree-ring width and maximum latewood density at the North American tree line: Parameters of climatic change. Can. J. For. Res. 1992, 22, 1290–1296. [Google Scholar] [CrossRef]
  88. Zheng, L.; Gaire, N.P.; Shi, P. High-altitude tree growth responses to climate change across the Hindu Kush Himalaya. J. Plant Ecol. 2021, 14, 829–842. [Google Scholar] [CrossRef]
  89. Cuny, H.E.; Rathgeber, C.B.; Frank, D.; Fonti, P.; Fournier, M. Kinetics of tracheid development explain conifer tree-ring structure. New Phytol. 2014, 203, 1231–1241. [Google Scholar] [CrossRef] [PubMed]
  90. Cuny, H.E.; Rathgeber, C.B.; Frank, D.; Fonti, P.; Mäkinen, H.; Prislan, P.; Rossi, S.; del Castillo, E.M.; Campelo, F.; Vavrčík, H.; et al. Woody biomass production lags stem-girth increase by over one month in coniferous forests. Nat. Plants 2015, 1, 15160:1–15160:6. [Google Scholar] [CrossRef] [PubMed]
  91. Rathgeber, C.B.; Cuny, H.E.; Fonti, P. Biological basis of tree-ring formation: A crash course. Front. Plant Sci. 2016, 7, 734:1–734:7. [Google Scholar] [CrossRef] [Green Version]
  92. Blasing, T.J.; Duvick, D.N.; Cook, E.R. Filtering the effect of competition from ring-width series. Tree-Ring Bull. 1983, 43, 19–30. [Google Scholar]
  93. Camarero, J.J.; Colangelo, M.; Gazol, A.; Pizarro, M.; Valeriano, C.; Igual, J.M. Effects of windthrows on forest cover, tree growth and soil characteristics in drought-prone pine plantations. Forests 2021, 12, 817. [Google Scholar] [CrossRef]
  94. Yuan, N.; Xiong, F.; Xoplaki, E.; He, W.; Luterbacher, J. A new approach to correct the overestimated persistence in tree-ring width based precipitation reconstructions. Clim. Dyn. 2021, 1–12. [Google Scholar] [CrossRef]
  95. García-Cervigón, A.I.; Mercado, L.N.; Mendivelso, H.A.; Toledo, M.; Camarero, J.J. Adjusting xylem anatomy and growth to inter-annual climate variability in two Fabaceae species (Centrolobium microchaete, Cenostigma pluviosum) from Bolivian dry tropical forests. Dendrochronologia 2021, 67, 125840. [Google Scholar] [CrossRef]
  96. Pandey, S. Climatic influence on tree wood anatomy: A review. J. Wood. Sci. 2021, 67, 24. [Google Scholar] [CrossRef]
  97. Obeltsev, S.V.; Gustova, A.I.; Terekhina, D.K. Hydro- and thermophysical characteristics of wood of the main and shrub species of protective forest plantations of the steppe zone. Bull. Nizhnevolzhsky Agro-Univ. Complex Sci. High. Prof. Educ. 2011, 4, 91–97. (In Russian) [Google Scholar]
  98. Körner, C. Plant adaptation to cold climates. F1000Research 2016, 5 (F1000 Faculty Rev), 2769:1–2769:5. [Google Scholar] [CrossRef] [PubMed]
  99. Reich, P.B. The world-wide ‘fast–slow’plant economics spectrum: A traits manifesto. J. Ecol. 2014, 102, 275–301. [Google Scholar] [CrossRef]
  100. Ning, Q.R.; Gong, X.W.; Li, M.Y.; Hao, G.Y. Differences in growth pattern and response to climate warming between Larix olgensis and Pinus koraiensis in Northeast China are related to their distinctions in xylem hydraulics. Agric. For. Meteorol. 2022, 312, 108724. [Google Scholar] [CrossRef]
  101. Neukom, R.; Barboza, L.A.; Erb, M.P.; Shi, F.; Emile-Geay, J.; Evans, M.N.; Franke, J.; Kaufman, D.S.; Lücke, L.; Rehfeld, K.; et al. Consistent multi-decadal variability in global temperature reconstructions and simulations over the Common Era. Nat. Geosci. 2019, 12, 643–649. [Google Scholar] [CrossRef] [Green Version]
Figure 1. The location map of the study area: (a) satellite imagery of the area; (b) location of the study area (dot), Khakassia (red area), and Tyva (orange area) within the Asian part of Russia; (c) topographic map of the study area. Marked objects are the boundary between Khakassia and Tyva along the ridge crest (dotted line), the Sayansky Pass (asterisk), and the sampling site along the road (dashed line).
Forests 13 00247 g001
Figure 2. Dependences of tree-ring width on cell number, TRW(N), for individual trees and for the total dataset of the sampling site. Dots represent actual data (tree rings), lines represent linear models TRW(N). Model equations and determination coefficients R2 are presented at each plot.
Forests 13 00247 g002
Figure 3. Actual values of anatomical characteristics (mean radial diameter Dmean, maximal radial diameter Dmax, mean cell wall thickness CWTmean, maximal cell wall thickness CWTmax) and exponential functions of their dependences on cell number N, presented on example of Tree_6.
Forests 13 00247 g003
Figure 4. Sample depth (number of measured trees for each year) and indexed chronologies of P. sibirica tree-ring parameters. On the chronology plots, lines and shaded areas represent the mean site chronology and standard deviation (SD) of individual tree series for each year, respectively.
Forests 13 00247 g004aForests 13 00247 g004b
Figure 5. Linear dependencies between indexed site chronologies of tree-ring anatomical characteristics: (a) function of mean cell radial diameter from maximal radial diameter, Dmean(Dmax); (b) function of mean cell wall thickness from maximal cell wall thickness, CWTmean(CWTmax). Equations and coefficients of determinations are also presented.
Forests 13 00247 g005
Figure 6. Extreme and pointer years: (a) departures up (○) and down (●) beyond the range of (mean ± 1.5 SD) for climatic characteristics of a vegetative season defined through the threshold value Tthr = 9 °C in regional temperature series: sum of precipitation (Pveg), duration of season in current (Dur) and previous year (Dur*), its beginning date (Dbeg), its ending date in current (Dend) and previous year (Dend*), sum of temperatures T > Tthr in current (GDD) and previous year (GDD*); (b) 5% of the highest (○) and the lowest (●) values for each tree-ring chronology over 1900–2010 (period of climatic series).
Forests 13 00247 g006
Figure 7. Actual series and reconstruction models of the long-term variation (11-year smoothed) components of vegetative period climatic variables: precipitation sum (Pveg) and sum of temperatures above threshold (GDD). Black lines represent reconstructed time series, shades represent range ± standard error of estimation (SE), and thick colored lines represent actual data. On the GDD plot, dotted line represents a reconstruction of June-July temperature in Western Mongolia (49.95° N 91.28° E) based on larch blue intensity chronology [59], also smoothed by an 11-year moving average. Mongolia TJJ reconstruction series were obtained from ITRDB (https://www.ncei.noaa.gov/access/paleo-search/study/33614; accessed on 2 February 2022).
Forests 13 00247 g007
Table 1. Growth characteristics of sampled trees. Max, maximum value; mean, arithmetic mean; SD, standard deviation.
TreeDiameter
(cm)
Core Cover Period (Years)Cell Number, NTRW (mm)
LengthCalendar YearsMaxMean ± 1SDMaxMean ± 1SD
Tree_1464931525–20183112.0 ± 5.20.990.35 ± 0.16
Tree_2392731746–20183410.8 ± 7.51.040.33 ± 0.25
Tree_3613271646–19724926.8 ± 8.21.600.84 ± 0.26
Tree_4422341785–20183514.3 ± 5.01.120.44 ± 0.18
Tree_5473871634–20184318.5 ± 7.51.450.58 ± 0.25
Tree_6373661653–2018258.1 ± 4.70.740.21 ± 0.14
Tree_7383361683–20183917.2 ± 7.11.200.52 ± 0.23
Table 2. Numerical terms of exponential functions D(N) = Dmin + (Das − Dmin)·eaN, CWT(N) = CWTmin + (CWTas − CWTmin)·eaN fitted for relationships of mean and maximal tracheid dimensions with cell number.
TreeDmaxDmeanCWTmaxCWTmean
Das
(μm)
aDas
(μm)
aCWTas
(μm)
aCWTas
(μm)
a
Tree_139.30.3429.80.342.790.132.480.14
Tree_241.80.3431.70.293.550.092.920.11
Tree_340.70.2331.90.212.830.092.410.09
Tree_442.50.2033.00.192.240.332.000.44
Tree_541.00.2432.20.242.840.202.500.24
Tree_635.40.3828.00.302.360.302.070.49
Tree_739.60.2830.40.292.760.152.410.16
Total sample40.00.3031.00.262.770.142.400.18
Table 3. Statistics of anatomical characteristics data before and after indexation: ranges from minimal to maximal values of each statistic for individual trees (indiv.), statistics of averaged site chronology (chron.), and statistics for total site sample of 2374 tree rings (total). Min, minimal value; Max, maximal value; SD, standard deviation.
StatisticsDmaxDmeanCWTmaxCWTmean
Indiv.Chron.TotalIndiv.Chron.TotalIndiv.Chron.TotalIndiv.Chron.Total
Measurements
Min (μm)11.3–29.727.411.310.8–24.021.510.81.51–1.901.901.510.49–1.761.761.45
Max (μm)43.4–52.044.652.031.8–37.933.637.92.64–4.453.284.451.24–3.652.923.65
Median (μm)33.5–40.538.338.525.6–31.829.529.82.11–2.732.482.371.00–2.252.242.15
Mean (μm)32.4–40.538.238.024.5–31.729.329.22.11–2.732.502.441.00–2.272.252.20
SD (μm)3.1–4.92.54.62.1–4.01.93.70.18–0.570.230.420.07–0.300.180.30
Skewness−1.12–0.24−0.53−0.97−1.30–−0.04−0.63−1.12−0.08–1.700.511.00−0.27–0.750.440.75
Kurtosis−0.44–5.531.222.23−0.24–5.051.181.99−0.48–2.550.461.690.23–2.890.420.94
Indices
Min (μm)0.49–0.820.800.490.59–0.790.790.590.72–0.810.890.720.71–0.820.880.71
Max (μm)1.24–1.371.161.371.20–1.441.141.441.27–1.671.241.671.23–1.671.231.67
Median (μm)0.99–1.011.001.001.00–1.011.001.000.98–1.021.021.000.99–1.011.011.00
Mean (μm)1.00–1.011.001.001.00–1.011.001.000.99–1.031.021.010.99–1.021.011.01
SD (μm)0.07–0.100.050.080.06–0.100.050.080.08–0.160.060.110.06–0.140.050.10
Skewness−0.59–0.35−0.06−0.10−0.36–0.02−0.11−0.250.19–0.780.440.68−0.02–0.620.380.60
Kurtosis0.21–2.890.461.760.10–2.250.501.78−0.01–0.890.051.290.06–1.100.201.78
Table 4. Inter-series correlations of tree-ring characteristics before and after indexation: numerators are a range of minimal and maximal values, and denominators are mean values. Correlations for each pair of series were calculated over full overlap periods.
CorrelationsDmaxDmeanCWTmaxCWTmeanNTRW *
Measurements
between trees−0.08–0.62
0.31
−0.07–0.66
0.35
−0.26–0.53
0.13
−0.27–0.49
0.11
−0.41–0.70
0.32
−0.33–0.76
0.30
with site chronology0.36–0.83
0.64
0.31–0.83
0.67
0.25–0.78
0.52
0.23–0.75
0.52
0.39–0.86
0.68
−0.05–0.76
0.41
Indices
between trees0.00–0.29
0.19
0.05–0.39
0.23
−0.19–0.36
0.07
−0.20–0.38
0.06
0.20–0.58
0.42
with site chronology0.48–0.72
0.57
0.49–0.73
0.60
0.23–0.68
0.47
0.23–0.69
0.47
0.55–0.75
0.65
* For TRW, individual series were represented only by seven trees selected for anatomical measurements, but the mean series was represented by standard site TRW chronology developed from the total sample of 54 trees (Figure 4).
Table 5. Correlation coefficients between tree-ring chronologies and temperature-related climatic variables of a vegetative season defined through dates of temperature stably increasing above and decreasing below threshold value Tthr = 9 °C in regional temperature series (data for other values Tthr = 7…11.5 °C are presented in Supplementary materials, Table S1). Pveg, sum of precipitation over vegetative season; Dur, duration of vegetative season (days); Dbeg, beginning date of vegetative season (DOY); Dend, ending date of vegetative season (DOY); GDD, sum of T > Tthr during vegetative season. Bold correlation coefficients are significant at p < 0.05.
Climatic
Variable
Tree-Ring Chronology
N_rawTRW_stdDmax_rawDmean_rawCWTmax_rawCWTmean_rawDmax_indDmean_indCWTmax_indCWTmean_indDmean_resCWTmean_res
Time series per se
Pveg−0.23−0.16−0.12−0.32−0.06−0.030.08−0.180.250.27−0.350.13
Dur0.060.050.04−0.120.250.300.04−0.140.170.21−0.250.18
Dbeg−0.050.00−0.020.13−0.09−0.14−0.040.14−0.08−0.130.24−0.19
Dend0.040.070.03−0.060.270.300.03−0.080.170.18−0.150.08
GDD0.120.190.04−0.040.410.420.03−0.070.290.29−0.130.09
Dur *0.210.210.00−0.070.210.18−0.05−0.150.070.05−0.17−0.05
Dend *0.210.230.03−0.050.210.20−0.03−0.140.070.06−0.17−0.01
GDD *0.170.210.02−0.090.320.29−0.01−0.150.220.20−0.21−0.01
Time series smoothed by 11-year moving average
Pveg−0.44−0.08−0.37−0.570.030.190.32−0.220.670.71−0.690.62
Dur0.300.440.230.040.650.710.400.050.320.33−0.330.16
Dbeg0.01−0.200.010.17−0.37−0.44−0.340.02−0.40−0.410.36−0.31
Dend0.450.530.340.170.730.780.380.080.220.23−0.250.03
GDD0.300.430.230.080.690.740.390.090.410.41−0.240.10
Dur *0.500.600.410.250.750.790.410.140.170.18−0.200.00
Dend *0.350.520.300.110.680.730.440.100.280.30−0.290.13
GDD *0.350.480.300.160.710.750.430.170.370.37−0.170.03
* Climatic variables of previous vegetative season.
Table 6. Wood-anatomy based linear regression reconstruction models for temperature-related climatic variables of a vegetative season defined through dates of temperature crossing threshold Tthr = 9 °C in regional temperature series. Pveg, sum of precipitation over vegetative season; Dur, duration of vegetative season (days); Dbeg, beginning date of vegetative season (DOY); Dend, ending date of vegetative season (DOY); GDD, sum of T > Tthr during vegetative season.
Dependent
Climatic Variable
Explanatory
Anatomical Variables
RR2R2adjF(2.98)pSE
PvegDmean_res, CWTmean_ind0.8060.6500.64391.1<0.000118.9
DbegDmean_res, CWTmean_raw0.5790.3350.32124.7<0.00012.15
DurDmean_res, CWTmean_raw0.7940.6310.62383.8<0.00013.69
DendDmean_res, CWTmax_raw0.8130.6620.65595.8<0.00012.38
GDDDmean_res, CWTmean_raw0.7900.6250.61781.5<0.000128.6
Publisher’s Note: MDPI stays neutral with regard to jurisdictional claims in published maps and institutional affiliations.

