
cpSSR and High-Resolution Melting Analysis (HRM) for Pinus pseudostrobus Lindl. Variety Genotyping and Discrimination

 , and
, and
Abstract
:1. Introduction
2. Materials and Methods
2.1. Plant Material
2.2. DNA Extraction
2.3. Primer Design and Selection
2.4. Real-Time PCR and HRM Analysis
3. Results
4. Discussion
5. Conclusions
Supplementary Materials
Author Contributions
Funding
Institutional Review Board Statement
Informed Consent Statement
Data Availability Statement
Acknowledgments
Conflicts of Interest
References
- Farjon, A.; Styles, B.T. Flora Neotropica. Pinus (Pinaceae); New York Botanical Garden: New York, NY, USA, 1997. [Google Scholar]
- Stead, J.W. A study of variation and taxonomy of the Pinus pseudostrobus complex. Commonw. For. Rev. 1983, 32, 101–112. [Google Scholar]
- Stead, J.W.; Styles, B.T. Studies of Central American Pines: A revision of the ‘pseudostrobus’ Group (Pinaceae). Bot. J. Linn. Soc. 1984, 89, 249–275. [Google Scholar] [CrossRef]
- Viveros-Viveros, H.; Sáenz-Romero, C.; López-Upton, J.; Vargas-Hernández, J.J. Variación genética altitudinal en el crecimiento de plantas de Pinus pseudostrobus Lindl. en campo. Agrociencia 2005, 39, 575–587. [Google Scholar]
- Viveros-Viveros, H.; Saenz-Romero, C.; Jesus Vargas-Hernandez, J.; Lopez-Upton, J. Variacion entre procedencias de Pinus pseudostrobus establecidas en dos sitios en Michoacan, Mexico. Rev. Fitotec. Mex. 2006, 29, 121–126. [Google Scholar]
- Perry, J.P., Jr. The Pines of Mexico and Central America; Timber Press: Portland, OR, USA, 1991; p. 231. [Google Scholar]
- Delgado, P.; Salas-Lizana, R.; Vázquez-Lobo, A.; Wegier, A.; Anzidei, M.; Alvarez-Buylla, E.R.; Vendramin, G.G.; Piñero, D. Introgressive Hybridization in Pinus montezumae Lamb and Pinus pseudostrobus Lindl. (Pinaceae): Morphological and molecular (CpSSR) evidence. Int. J. Plant Sci. 2007, 168, 861–875. [Google Scholar] [CrossRef]
- López-Reyes, A.; de la Rosa, J.P.; Ortiz, E.; Gernandt, D.S. Morphological, molecular, and ecological divergence in Pinus douglasiana and P. maximinoi. Syst. Bot. 2015, 40, 658–670. [Google Scholar] [CrossRef] [Green Version]
- Mártínez, M. Los Pinos Mexicanos, 2nd ed.; Ediciones Botas: Distrito Federal, México, 1948; p. 361. [Google Scholar]
- Perez de la Rosa, J.; Harris, S.A.; Farjon, A. Noncoding chloroplast DNA variation in Mexican Pines. Theor. Appl. Genet. 1995, 91, 1101–1106. [Google Scholar] [CrossRef]
- Gernandt, D.S.; Hernández-León, S.; Salgado-Hernández, E.; Pérez de la Rosa, J.A. Phylogenetic relationships of Pinus Subsection Ponderosae inferred from rapidly evolving cpDNA regions. Syst. Bot. 2009, 34, 481–491. [Google Scholar] [CrossRef]
- Wofford, A.M.; Finch, K.; Bigott, A.; Willyard, A. A set of plastid loci for use in multiplex fragment length genotyping for intraspecific variation in Pinus (Pinaceae). Appl. Plant Sci. 2014, 2, 140002. [Google Scholar] [CrossRef]
- Wang, X.R.; Tsumura, Y.; Yoshimaru, H.; Nagasaka, K.; Szmidt, A.E. Phylogenetic Relationships of Eurasian Pines (Pinus, pinaceae) Based on chloroplast Rbcl, MatK, Rpl20-Rps18 spacer, and TrnV intron sequences. Am. J. Bot. 1999, 66, 12131–12140. [Google Scholar] [CrossRef]
- Bilgen, B.B.; Kaya, N. Chloroplast DNA variation and pollen contamination in a Pinus brutia Ten. clonal seed orchard: Implication for progeny performance in plantations. Turk. J. Agric. For. 2014, 38, 540–549. [Google Scholar] [CrossRef]
- Um, Y.; Park, W.-K.; Jo, N.-S.; Han, S.-H.; Lee, Y. Phylogenetic analysis of pines based on chloroplast TrnT-TrnL intergenic spacer DNA sequences. J. For. Environ. Sci. 2014, 30, 307–313. [Google Scholar] [CrossRef] [Green Version]
- Powell, W.; Morgante, M.; McDevitt, R.; Vendramin, G.G.; Rafalski, J.A. Polymorphic simple sequence repeat regions in chloroplast genomes: Applications to the population genetics of Pines. Proc. Natl. Acad. Sci. USA 1995, 92, 7759–7763. [Google Scholar] [CrossRef] [PubMed] [Green Version]
- Semerikov, V.L.; Semerikova, S.A.; Dymshakova, O.S.; Zatsepina, K.G.; Tarakanov, V.V.; Tikhonova, I.V.; Ekart, A.K.; Vidyakin, A.I.; Jamiyansuren, S.; Rogovtsev, R.V.; et al. Microsatellite loci polymorphism of chloroplast DNA of Scots Pine (Pinus sylvestris L.) in Asia and Eastern Europe. Russ. J. Genet. 2014, 50, 577–585. [Google Scholar] [CrossRef]
- Xie, Q.; Liu, Z.H.; Li, Z.Q. Taxonomic Status of Pinus henryi Using Multiplexed microsatellite markers. Genet. Mol. Res. 2015, 14, 4549. [Google Scholar] [CrossRef] [PubMed]
- Ni, Z.; Zhou, P.; Xu, M.; Xu, L.A. Development and characterization of chloroplast microsatellite markers for Pinus massoniana and their application in Pinus (Pinaceae) Species. J. Genet. 2018, 97, 53–59. [Google Scholar] [CrossRef]
- Hernández-León, S.; Gernandt, D.S.; Pérez de la Rosa, J.A.; Jardón-Barbolla, L. Phylogenetic relationships and species delimitation in Pinus Section Trifoliae inferred from Plastid DNA. PLoS ONE 2013, 8, e70501. [Google Scholar] [CrossRef] [PubMed]
- Reed, G.H.; Wittwer, C.T. Sensitivity and specificity of single-nucleotide polymorphism scanning by High-Resolution Melting Analysis. Clin. Chem. 2004, 50, 1748–1754. [Google Scholar] [CrossRef] [Green Version]
- Wittwer, C.T. High-Resolution DNA Melting Analysis: Advancements and limitations. Hum. Mutat. 2009, 30, 857–859. [Google Scholar] [CrossRef]
- Hewson, K.; Noormohammadi, A.H.; Devlin, J.M.; Mardani, K.; Ignjatovic, J. Rapid detection and non-subjective characterisation of infectious bronchitis virus isolates using High-Resolution Melt Curve Analysis and a mathematical model. Arch. Virol. 2009, 154, 649–660. [Google Scholar] [CrossRef]
- Li, W.; Matsuoka, M.; Kai, M.; Thapa, P.; Khadge, S.; Hagge, D.A.; Brennan, P.J.; Vissa, V. Real-Time PCR and High-Resolution Melt Analysis for rapid detection of Mycobacterium leprae drug resistance mutations and strain types. J. Clin. Microbiol. 2012, 50, 742–753. [Google Scholar] [CrossRef] [PubMed] [Green Version]
- Bosmali, I.; Ganopoulos, I.; Madesis, P.; Tsaftaris, A. Microsatellite and DNA-Barcode regions typing combined with High Resolution Melting (HRM) analysis for food forensic uses: A case study on lentils (Lens culinaris). Food Res. Int. 2012, 46, 141–147. [Google Scholar] [CrossRef]
- Ganopoulos, I.; Argiriou, A.; Tsaftaris, A. Microsatellite High Resolution Melting (SSR-HRM) analysis for authenticity testing of protected designation of origin (PDO) Sweet Cherry products. Food Control 2011, 22, 532–541. [Google Scholar] [CrossRef]
- Xanthopoulou, A.; Ganopoulos, I.; Koubouris, G.; Tsaftaris, A.; Sergendani, C.; Kalivas, A.; Madesis, P. Microsatellite High-Resolution Melting (SSR-HRM) Analysis for genotyping and molecular characterization of an Olea europaea germplasm collection. Plant Genet. Resour. Charact. Util. 2014, 12, 273–277. [Google Scholar] [CrossRef]
- Solano, J.; Anabalón, L.; Encina, F. Identification case of evidence in timber tracing of Pinus radiata, using High-Resolution Melting (HRM) Analysis. Forensic Sci. Int. Genet. 2016, 21, e6–e9. [Google Scholar] [CrossRef] [PubMed]
- Smith, B.L.; Lu, C.P.; Alvarado Bremer, J.R. High-Resolution Melting Analysis (HRMA): A highly sensitive inexpensive genotyping alternative for population studies. Mol. Ecol. Resour. 2010, 10, 193–196. [Google Scholar] [CrossRef]
- Granados-Cifuentes, C.; Rodriguez-Lanetty, M. The Use of High-Resolution Melting Analysis for genotyping Symbiodinium strains: A sensitive and fast approach. Mol. Ecol. Resour. 2011, 11, 394–399. [Google Scholar] [CrossRef]
- Henri, H.; Mouton, L. High-Resolution Melting Technology: A new tool for studying the Wolbachia endosymbiont diversity in the field. Mol. Ecol. Resour. 2012, 12, 75–81. [Google Scholar] [CrossRef]
- Dang, X.D.; Kelleher, C.T.; Howard-Williams, E.; Meade, C.V. Rapid identification of chloroplast haplotypes using High Resolution Melting Analysis. Mol. Ecol. Resour. 2012, 12, 894–908. [Google Scholar] [CrossRef] [Green Version]
- Ganopoulos, I.; Aravanopoulos, F.; Madesis, P.; Pasentsis, K.; Bosmali, I.; Ouzounis, C.; Tsaftaris, A. Taxonomic identification of mediterranean pines and their hybrids based on the High Resolution Melting (HRM) and TrnL approaches: From cytoplasmic inheritance to timber tracing. PLoS ONE 2013, 8, e60945. [Google Scholar] [CrossRef] [Green Version]
- Galuszynski, N.C.; Potts, A.J. Application of High Resolution Melt Analysis (HRM) for screening haplotype variation in a non-model plant genus: Cyclopia (Honeybush). PeerJ 2020, 8, e9187. [Google Scholar] [CrossRef] [PubMed]
- Doyle, J.; Doyle, J. A rapid isolation procedure for small amounts of leaf tissue. Phytochem. Bull. 1987, 19, 11–15. [Google Scholar]
- Thompson, J.D.; Higgins, D.G.; Gibson, T.J. CLUSTAL W: Improving the sensitivity of progressive multiple sequence alignment through sequence weighting, position-specific gap penalties and weight matrix choice. Nucleic Acids Res. 1994, 22, 4673–4680. [Google Scholar] [CrossRef] [PubMed] [Green Version]
- Provan, J.; Soranzo, N.; Wilson, N.J.; Goldstein, D.B.; Powell, W. A low mutation rate for chloroplast microsatellites. Genetics 1999, 153, 943–947. [Google Scholar] [CrossRef] [PubMed]
- Gouy, M.; Guindon, S.; Gascuel, O. Sea View Version 4: A multiplatform graphical user interface for sequence alignment and phylogenetic tree building. Mol. Biol. Evol. 2010, 27, 221–224. [Google Scholar] [CrossRef] [Green Version]
- Edgar, R.C. MUSCLE: Multiple Sequence Alignment with high accuracy and high throughput. Nucleic Acids Res. 2004, 32, 1792–1797. [Google Scholar] [CrossRef] [Green Version]
- Aragón-Peralta, R.D.; Rodríguez-Ortiz, G.; Vargas-Hernández, J.J.; Enríquez-del Valle, J.R.; Hernández-Hernández, A.; Campos-Angeles, G.V. Selección fenotípica y características reproductivas de Pinus pseudostrobus var. oaxacana (Mirov) S.G.Harrison. Rev. Mex. Cienc. For. 2020, 11, 118–140. [Google Scholar] [CrossRef]
- Hollingsworth, P.M.; Forrest, L.L.; Spouge, J.L.; Hajibabaei, M.; Ratnasingham, S.; van der Bank, M.; Chase, M.W.; Cowan, R.S.; Erickson, D.L.; Fazekas, A.J.; et al. A DNA barcode for land plants. Proc. Natl. Acad. Sci. USA 2009, 106, 12794–12797. [Google Scholar] [CrossRef] [Green Version]
- Dong, W.; Xu, C.; Li, C.; Sun, J.; Zuo, Y.; Shi, S.; Cheng, T.; Guo, J.; Zhou, S. Ycf1, the most promising plastid DNA barcode of land plants. Sci. Rep. 2015, 5, 8348. [Google Scholar] [CrossRef] [Green Version]
- Willyard, A.; Cronn, R.; Liston, A. Reticulate evolution and incomplete lineage sorting among the Ponderosa Pines. Mol. Phylogenet. Evol. 2009, 52, 498–511. [Google Scholar] [CrossRef]
- Vendramin, G.G.; Lelli, L.; Rossi, P.; Morgante, M. A set of primers for the amplification of 20 chloroplast microsatellites in Pinaceae. Mol. Ecol. 1996, 5, 595–598. [Google Scholar] [CrossRef] [PubMed]
- Dong, W.; Liu, J.; Yu, J.; Wang, L.; Zhou, S. Highly variable chloroplast markers for evaluating plant phylogeny at low taxonomic levels and for DNA barcoding. PLoS ONE 2012, 7, e35071. [Google Scholar] [CrossRef] [PubMed]
- Parks, M.; Cronn, R.; Liston, A. Increasing phylogenetic resolution at low taxonomic levels using massively parallel sequencing of chloroplast genomes. BMC Biol. 2009, 7, 84. [Google Scholar] [CrossRef] [PubMed] [Green Version]
- Celiński, K.; Kijak, H.; Wojnicka-Półtorak, A.; Buczkowska-Chmielewska, K.; Sokołowska, J.; Chudzińska, E. Effectiveness of the DNA barcoding approach for closely related conifers discrimination: A case study of the Pinus mugo complex. C. R. Biol. 2017, 340, 339–348. [Google Scholar] [CrossRef] [PubMed]
- Ran, J.H.; Wang, P.P.; Zhao, H.J.; Wang, X.Q. A Test of seven candidate barcode regions from the plastome in Picea (Pinaceae). J. Integr. Plant Biol. 2010, 52, 1109–1126. [Google Scholar] [CrossRef]
- Ledig, F.T.; Hodgskiss, P.D.; Krutovskii, K.V.; Neale, D.B.; Eguiluz-Piedra, T. Relationships among the spruces (Picea, Pinaceae) of Southwestern North America. Syst. Bot. 2004, 29, 275–295. [Google Scholar] [CrossRef] [Green Version]
- Asaf, S.; Khan, A.L.; Khan, M.A.; Shahzad, R.; Lubna; Kang, S.M.; Al-Harrasi, A.; Al-Rawahi, A.; Lee, I.J. Complete chloroplast genome sequence and comparative analysis of Loblolly Pine (Pinus taeda L.) with related species. PLoS ONE 2018, 13, e0192966. [Google Scholar] [CrossRef] [Green Version]
- Asaf, S.; Waqas, M.; Khan, A.L.; Khan, M.A.; Kang, S.M.; Imran, Q.M.; Shahzad, R.; Bilal, S.; Yun, B.W.; Lee, I.J. The complete chloroplast genome of wild rice (Oryza minuta) and its comparison to related species. Front. Plant Sci. 2017, 8, 304. [Google Scholar] [CrossRef] [Green Version]


| Locus | Polymorphism | Forward Primer (5′-3′) | Reverse Primer (5′-3′) |
|---|---|---|---|
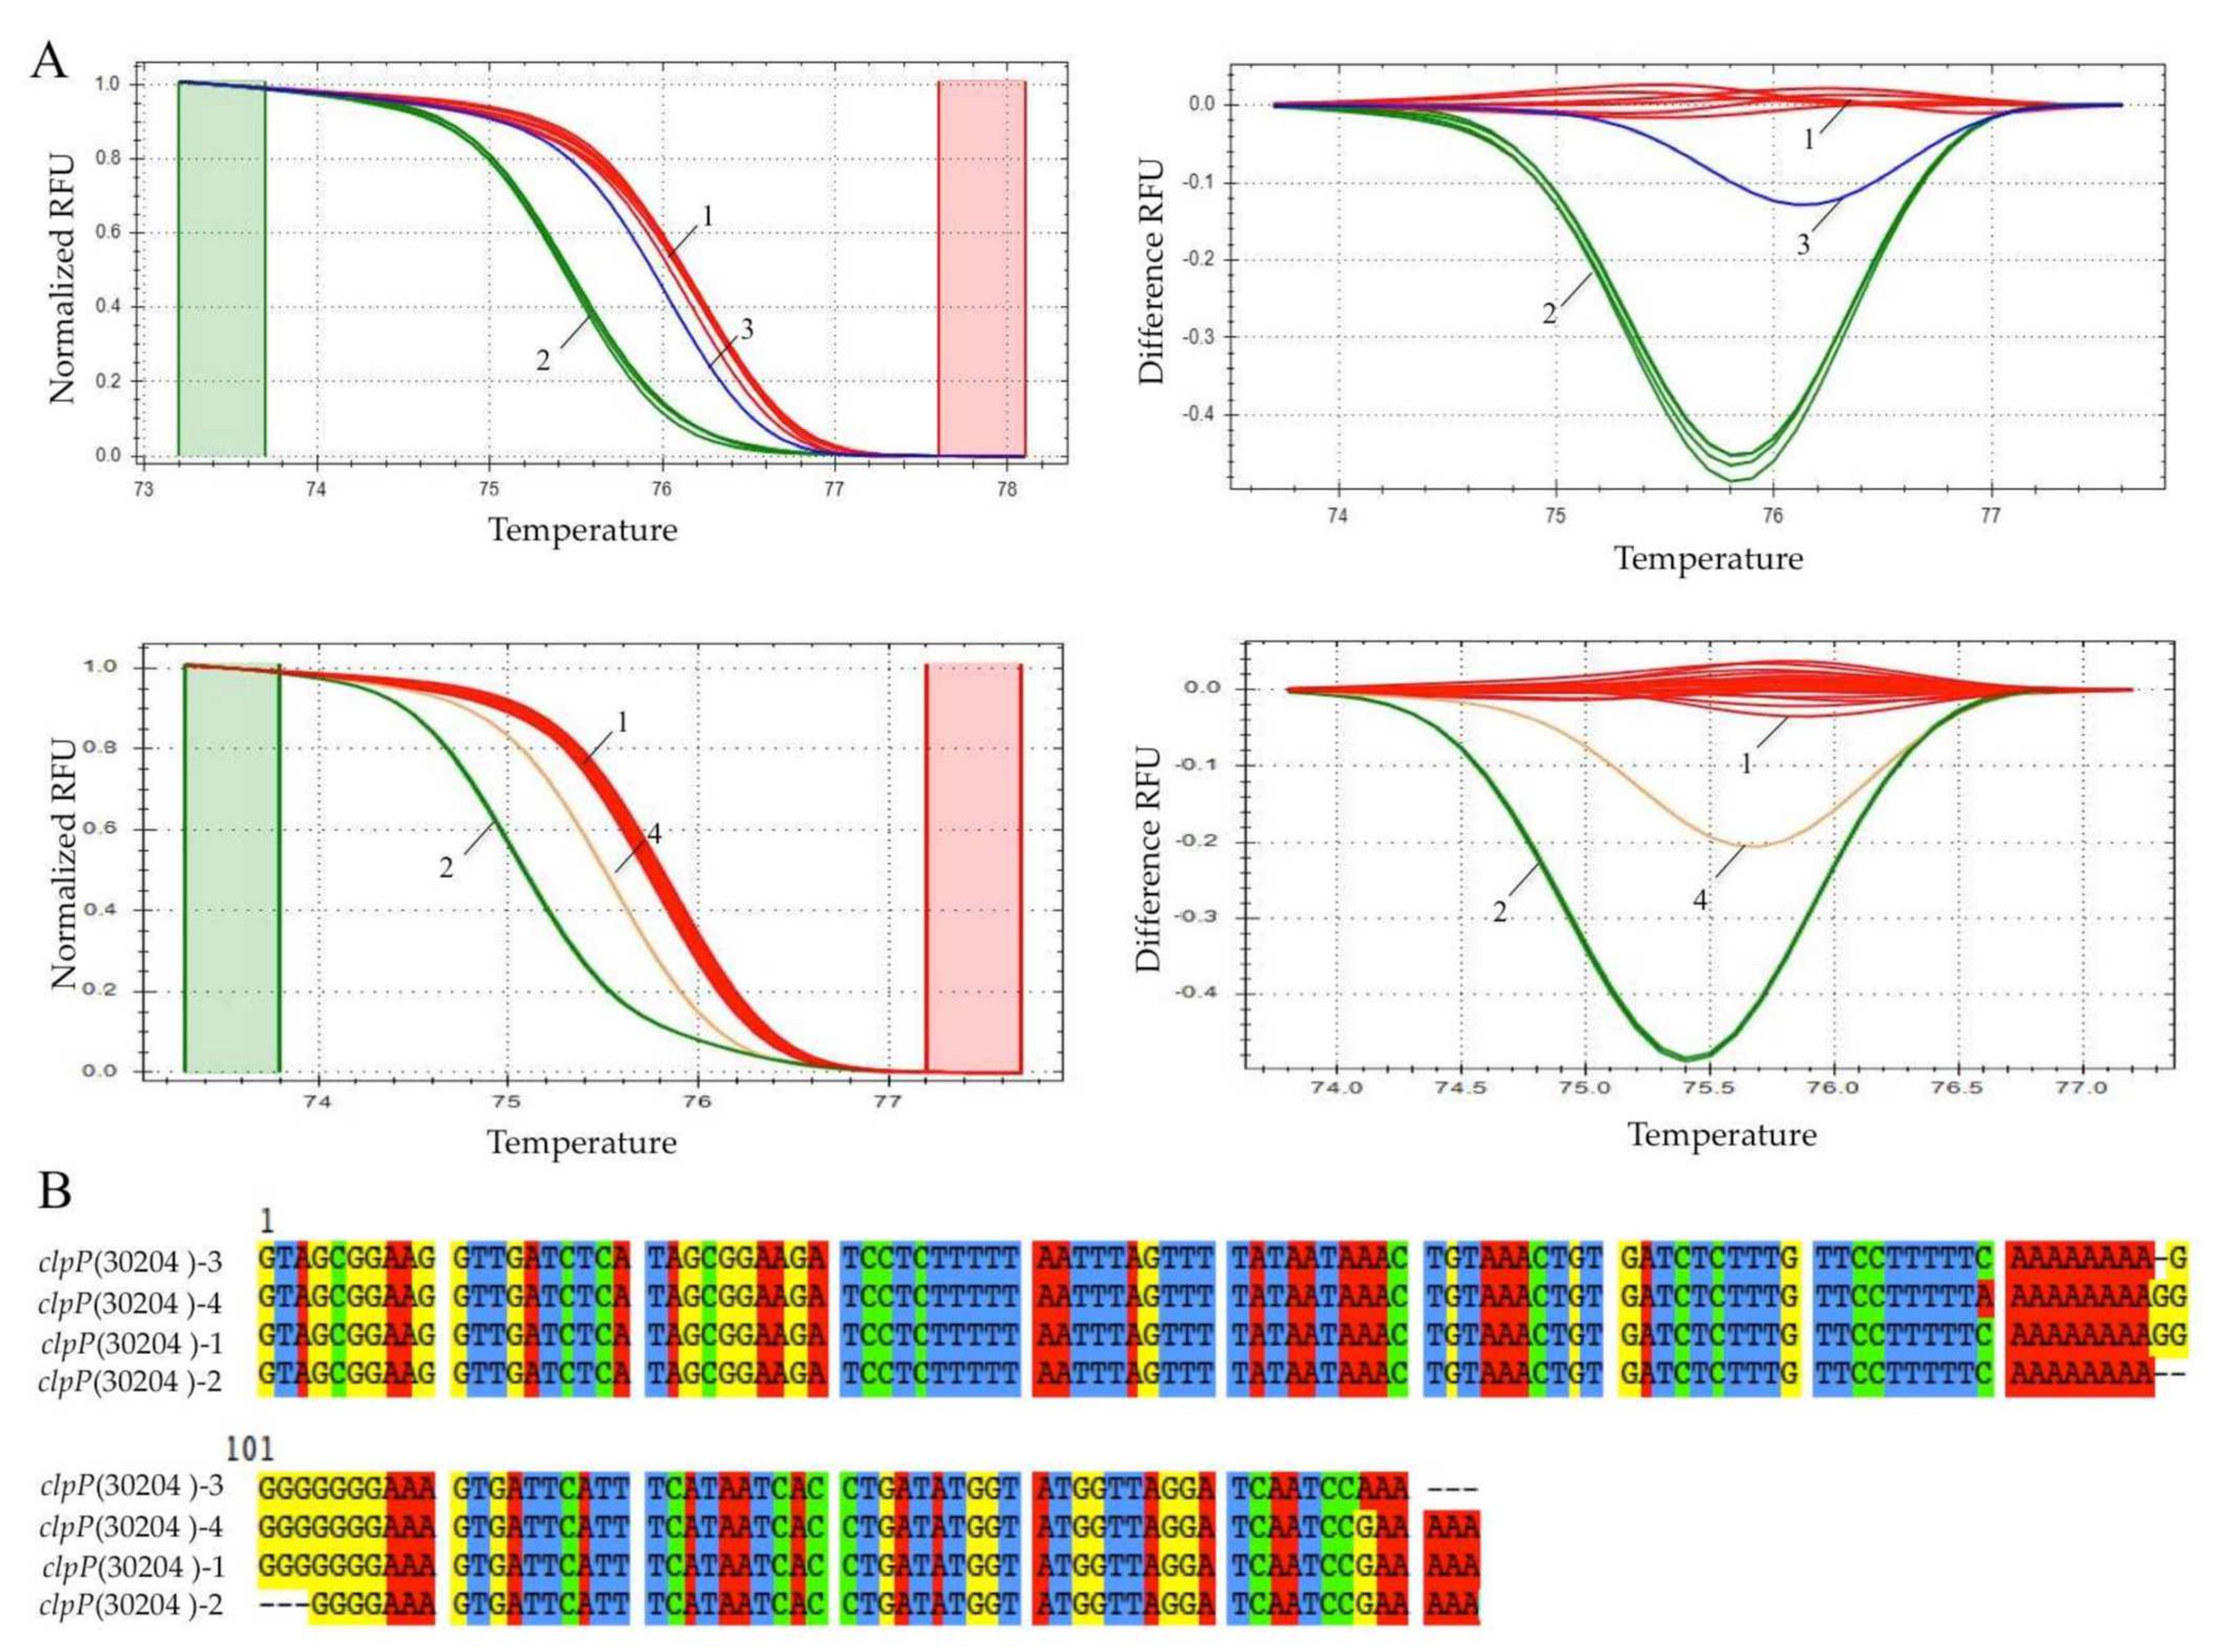
| clpP (30204) Wofford et al. (2014) | Indel 4G | CGTAGCGGAAGGTTGATCTCAT | TTCGGATTGATCCTAACCATACCA |
| trnS–trnG IGS Dong et al. (2012) | G–T; T–G | TTGTCTTCTTCGGACTCCTACCCA | GAAGGGTTCTCTATCTATTTAGGGT |
| cpDNA5 * | indel TACAG | ACCCGCAACTTCCGTCTTGA | CCTATCTAGCGCCTATCATGGA |
| cpDNA6 * | indel AAATTAT; G–T | CCACATTAACATATTGACCCATACCT | AGATCTTTCAATTGCAGAACAGATAGG |
| cpDNA7 * | A–G; indel CGAAT | CCAGAGCTTTGGCTCCCATT | GATCGGATCCAAGTATCTTCCCA |
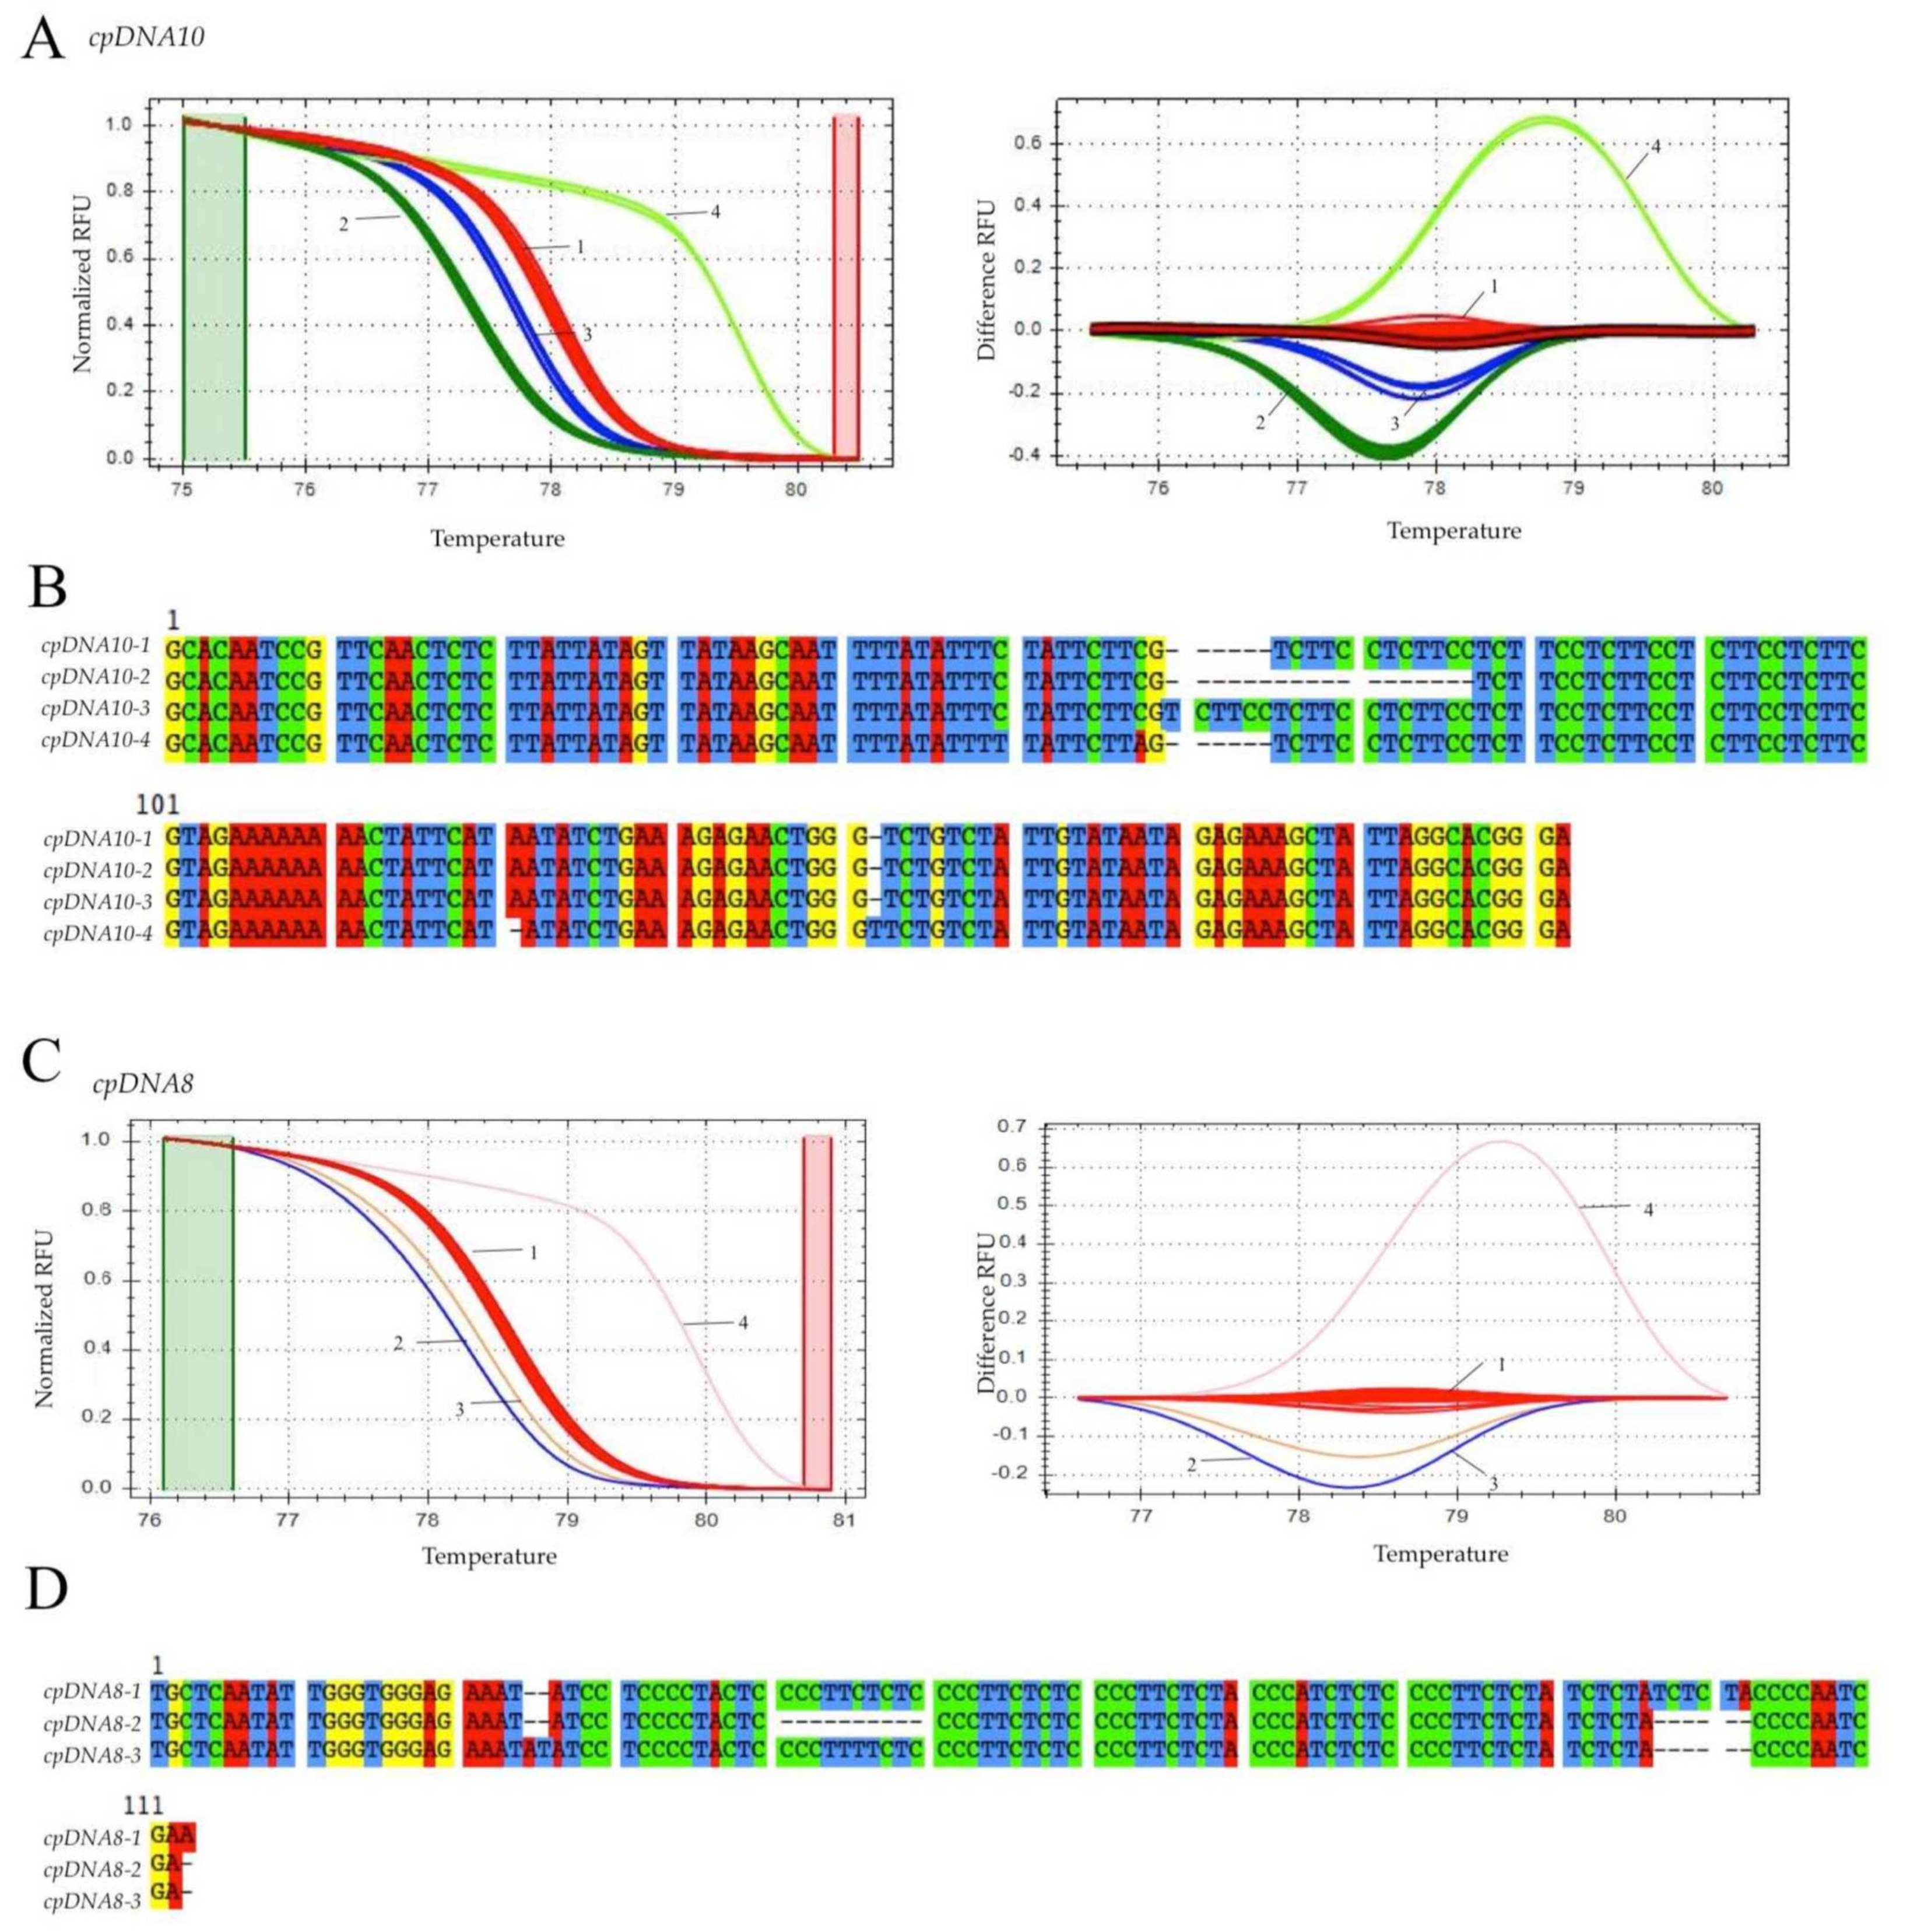
| cpDNA8 * | indel TCCCCTTCT | TGCTCAATATTGGGTGGGAGAAA | TCGATTGGGGTAGAGATAGAGAAGG |
| cpDNA9 * | indel GG | TCCTATGCGGGAACTGGAAT | TACTCGCAGTGTATTGTGGC |
| cpDNA10 * | indel (CTT)4 | GCACAATCCGTTCAACTCTCTT | TCCCGTGCCTAATAGCTTTCTC |
Publisher’s Note: MDPI stays neutral with regard to jurisdictional claims in published maps and institutional affiliations. |
© 2022 by the authors. Licensee MDPI, Basel, Switzerland. This article is an open access article distributed under the terms and conditions of the Creative Commons Attribution (CC BY) license (https://creativecommons.org/licenses/by/4.0/).
Share and Cite
García-Valencia, L.E.; Pérez-García, J.; Vallejo-Reyna, M.Á.; Reynoso-Santos, R.; Vargas-Hernández, J.; García-Campusano, F. cpSSR and High-Resolution Melting Analysis (HRM) for Pinus pseudostrobus Lindl. Variety Genotyping and Discrimination. Forests 2022, 13, 200. https://doi.org/10.3390/f13020200
García-Valencia LE, Pérez-García J, Vallejo-Reyna MÁ, Reynoso-Santos R, Vargas-Hernández J, García-Campusano F. cpSSR and High-Resolution Melting Analysis (HRM) for Pinus pseudostrobus Lindl. Variety Genotyping and Discrimination. Forests. 2022; 13(2):200. https://doi.org/10.3390/f13020200
Chicago/Turabian StyleGarcía-Valencia, Liliana E., Jocelyn Pérez-García, Miguel Ángel Vallejo-Reyna, Roberto Reynoso-Santos, Jesús Vargas-Hernández, and Florencia García-Campusano. 2022. "cpSSR and High-Resolution Melting Analysis (HRM) for Pinus pseudostrobus Lindl. Variety Genotyping and Discrimination" Forests 13, no. 2: 200. https://doi.org/10.3390/f13020200