Article

Generalization of U-Net Semantic Segmentation for Forest Change Detection in South Korea Using Airborne Imagery

1
Department of Environmental Engineering, Pusan National University, Busan 46241, Republic of Korea
2
Center for Environmental Data Strategy, Korea Environment Institute, Sejong 30147, Republic of Korea
*
Author to whom correspondence should be addressed.
Forests 2022, 13(12), 2170; https://doi.org/10.3390/f13122170
Submission received: 1 November 2022 / Revised: 6 December 2022 / Accepted: 15 December 2022 / Published: 17 December 2022

Abstract

:
Forest change detection is essential to prevent the secondary damage occurring by landslides causing profound results to the environment, ecosystem, and human society. The remote sensing technique is a solid candidate for identifying the spatial distribution of the forest. Even though the acquiring and processing of remote sensing images are costly and time- and labor-consuming, the development of open source data platforms relieved these burdens by providing free imagery. The open source images also accelerate the generation of algorithms with large datasets. Thus, this study evaluated the generalizability of forest change detection by using open source airborne images and the U-Net model. U-Net model is convolutional deep learning architecture to effectively extract the image features for semantic segmentation tasks. The airborne and tree annotation images of the capital area in South Korea were processed for building U-Net input, while the pre-trained U-Net structure was adopted and fine-tuned for model training. The U-Net model provided robust results of the segmentation that classified forest and non-forest regions, having pixel accuracies, F1 score, and intersection of union (IoU) of 0.99, 0.97, and 0.95, respectively. The optimal epoch and excluded ambiguous label contributed to maintaining virtuous segmentation of the forest region. In addition, this model could correct the false label images because of showing exact classification results when the training labels were incorrect. After that, by using the open map service, the well-trained U-Net model classified forest change regions of Chungcheong from 2009 to 2016, Gangwon from 2010 to 2019, Jeolla from 2008 to 2013, Gyeongsang from 2017 to 2019, and Jeju Island from 2008 to 2013. That is, the U-Net was capable of forest change detection in various regions of South Korea at different times, despite the training on the model with only the images of the capital area. Overall, this study demonstrated the generalizability of a deep learning model for accurate forest change detection.

1. Introduction

Forest change has occurred through natural disasters or anthropogenic activities. The prolonged deforestation causes serious consequences for the environment, ecosystem, and socio-economic aspects [1,2,3]. In particular, the forest change region coupled with climate change is vulnerable to landslides [4,5,6]; this introduced the critical roles of the forest monitoring that included the improvement in the knowledge for forest function, health, and resilience at various spatial and temporal scales and for practical application for the forest modelling simulation. Therefore, forest monitoring is essential to identify the potential landslide hazard areas for mitigating the additional damage.
Remote sensing is the effective monitoring method for forest mapping, using optical, microwave, and thermal sensors in aerial and satellite platforms [7]. This promising technique provides the detailed spatial and temporal distribution of the forest on a consistent basis. Especially, the use of the optical spectra is a typical way for forest monitoring and management [8]. Onishi and Ise (2021) [9] utilized Red–Green–Blue (RGB) bands of unmanned aerial vehicle images for mapping the trees in order to manage the forest. Mäyrä et al. (2021) [10] applied the RGB images of airborne hyperspectral image to classify tree species in order to implement the forest survey. Adjognon et al. (2019) [11] introduced tree cover mapping using sentinel-2 satellite imagery with RGB bands to monitor the forest. For utilizing the remote sensing imagery to detect the forest change, image processing such as radiometric calibration, atmospheric correction, and geometric correction and image annotation such as labelling tree species are required. These synoptic monitoring and image processing are considered costly, time consuming, and labor intensive processes.
However, the open source data platforms have been developed in order to mitigate this limitation by freely providing the remote sensing images for enhancing derivative research. Vu et al. (2021) [12] emphasized the open-sourced data availability for urban functional land use mapping by only using free medium-resolution satellite images. Long et al. (2021) [13] discussed the significance of the image dataset construction framework for remote sensing image application and interpretation. Open source data platform accelerates the related studies, applications, and generalization by providing robust datasets. In particular, AI-Hub provides high resolution airborne images and the corresponding annotation images for machine learning studies and applications. The numerous airborne data released the expense and monitoring burden. In addition, the pre-preprocessing and labeling procedure by the expert institute guaranteed the quality of both airborne and labeling imagery. The reliability of the retrieved datasets is essential to conduct data-driven studies with significant performance.
Deep learning is a prospective technique that provides robust performance when dealing with complex datasets [14]. Convolutional neural networks (CNNs) have been introduced as representative deep learning models that provide reliable performance for feature extraction from multi-dimensional data [15,16]. In particular, the convolutional layer of CNN is able to directly process 3-dimensional satellite or airborne images without further procedure such as vectorization, which results in high computational burden due to the massive amount of the trainable weights. In addition, the internal kernels of convolutional layer compose the shared weights and slide the image inputs to efficiently extract the spatial and spectral features of multi- and hyper-spectral imagery. Khan et al. (2017) [17] concluded that CNN optimally extracted satellite image features. Sun et al. (2022) [18] showed effective spatial and spectral features, learning of a CNN-based approach by processing aircraft imagery. Based on this rich hierarchical feature extraction framework, the CNN model enables remarkable progress in pixel-wise semantic segmentation. The semantic segmentation is to assign a categorical label to every pixel in an image, which plays an important role in forest image classification. In particular, U-Net was introduced to provide a superb semantic segmentation performance using a fully convolutional network and dense skip architecture. The U-Net model was applied for the segmentation of biomedical images [19,20,21], self-driving images [22,23,24], and remote sensing images [25,26,27]. In relation to the forest environment, Wagner et al. (2019) [28] utilized U-Net segmentation to classify the forest types and tree species of regional scales. In addition, Zhang et al. (2021)[29] performed semantic segmentation of U-Net for forest fire detection. With open science trending globally, Zhong et al. (2020)[30] adopted open source data fusion with high resolution satellite images and Google Earth images in order to conduct semantic object segmentation of urban land use. Chen et al. (2021) [31] also implemented semantic segmentation of urban land use by using open big dataset such as OpenStreetMap and sentinel images. Hermosilla et al. (2022) [32] successfully applied the free Landsat archive to perform land cover mapping of wide range and long term. Moreover, the open source datasets contribute to improving the generalization of the model. Otálora et al. (2019) [33] emphasized the necessity of the large public datasets for evaluating the generalization of the deep learning algorithm. Vetrò et al. (2016) [34] also introduced open government datasets enhancing the long-term generalizability of the results. However, generalization of U-Net forest change detection with open source data has rarely been investigated.
Therefore, motivated by the robust semantic segmentation of U-Net architecture, this study assessed the generalization of forest detection with both the U-Net model and open source image datasets. The specific procedures for accomplishing the object were: (1) to pre-process the open source airborne images and forest label images in the capital area of South Korea; (2) to fine-tune the pre-trained U-Net structure for segmenting forest and non-forest regions; and (3) to test the forest change detection test of the generalization ability of the trained U-Net model basis, using open map service.

2. Materials and Methods

2.1. Overview

The overall research framework of this study is presented in Figure 1. To accomplish the forest change detection, the open source airborne images were collected with RGB format while the corresponding forest label images were acquired by having forest species annotation in each pixel. Both airborne and label images were then segmented to the specific size. In addition, the forest labels were categorized into two classes including forest region and non-forest region. Herein, the label of undistinguished regions was excluded. After that, the pre-processed imagery was fed into the deep learning model that was U-Net architecture for performing semantic segmentation that classifies forest and non-forest regions in each image pixel. This architecture contained a pre-trained module part, while another part was fine-tuned for the successful model training. The training, validation, and test performances of U-Net determined the capability of the forest change detection. The generalizability test images were prepared from the open map service platform and processed by the aforementioned procedure. Thus, this study evaluated the generalization of forest change detection using a deep learning approach with multi-dimensional images from open source data platforms. The following section describes the relevant information for each step in detail.

2.2. Study Area

The capital area of South Korea includes Seoul city, Incheon, and Gyeonggi province. This is one of the highest urbanized areas, where 51% of the entire population lives. Seoul has forest areas of 15,323 ha with a forest rate of 25%. Incheon and Gyeonggi show forest areas of 39,373 and 512,105 ha by having forest ratios of 37% and 50%, respectively. That is, the urbanization development is inevitable for maintaining the sustainability of the capital area. In the meantime, the proportion of forest region can be decreased, which would potentially result in an adverse impact on the wellness of the citizens and urban ecosystem such as heat island [35]. Furthermore, the urbanization of the capital area leads to the increase in the areas that are vulnerable to the natural disasters such as typhoon, intensive rainfall, and abnormal drying due to the global climate change. That is, forest regions can be damaged by landslides and forest fires. In Seoul, the Mt. Umyeon landslide destroyed forest and residential areas [36]. In the Gyeonggi area, an average of 74.4 forest fires occurred during the recent 10 years from 2010 to 2019 [37].

2.3. Airborne and Tree Annotation Data Acquisition

This study utilized the open data source platform for the change detection of forest regions using a deep learning model. AI-Hub (https://www.aihub.or.kr accessed on 4 October 2021) was developed by the National Information Agency (NIA). This platform has provided the datasets for machine learning research, applications, and education in various fields including vision, language, land environment, livestock, fisheries, safety, self-driving, education, and healthcare. The airborne imagery capturing the forest region from 2018 to 2019 can be found in the land environment datasets. The airborne data with the size of 512 × 512 have spatial resolution of 0.25 m and RGB format in the capital area. Moreover, AI-Hub provides the label images the same with the location, resolution, and numbers of the airborne images. The labels contain the forest tree species such as pine tree, larch, conifers, broadleaf trees, and the other conifers. Moreover, non-forest regions and indistinguishable areas are included in the labels. Thus, 1000 images with respect to the airborne and label images were used for the deep learning training, and 100 images of airborne and label were utilized for the validation. The image data quality was managed and controlled by the National Geographic Information Institute (NGII) of South Korea, including radiometric calibration and geometric correction. The labeling image data quality was managed by the Korea Forestry Promotion Institute (KOFPI).

2.4. Image Data Preprocessing

The selected airborne and label images were cropped to the size of 128 × 128 for feeding to the deep learning model, because this study adopted pre-trained deep learning model architecture that allowed for the aforementioned image size in terms of the input. That is, each image of 512 × 512 size produced 16 cropped images. The final numbers of training and validation data were 16,000 and 1600 images, respectively. Moreover, the labels of pine tree, larch, conifers, broadleaf trees, and the other conifers were unified as forest region denoting to 0. On the other hand, the label for non-forest regions was assigned to 1. If the indistinguishable areas were in the label data, both the airborne and label image data were excluded from the training and validation dataset because of avoiding the uncertainty of deep learning model training performance.

2.5. Deep Learning for Change Detection of Forest Region

This study applied a deep learning model for the semantic segmentation of the prepared input images to classify the forest region. The semantic segmentation allocates the certain label in each pixel of the image. Herein, U-Net architecture was adopted to perform the segmentation task classifying forest and non-forest labels in airborne imagery, to allow for the change detection in the woodland.

2.5.1. U-Net

U-Net was originally developed for the segmentation of biomedical images [21]. This model showed robust semantic segmentation performance to classify the human cells. The architecture of U-Net composes contracting and expanding paths. In this study, MobileNetV2 [38] was applied to the encoding path, while pix2pix [39] was used to the decoding path. MobileNetV2 has the strength of feature representation using thin bottleneck residual layers (Figure 2). Pix2pix framework allows learning from input image to output image mapping. These paths extract input features using fully convolutional layers that allow the feeding of arbitrary sizes for input images. In addition, the convolutional feature extraction has the advantage of extracting the contextual information of the input images by using an internal kernel operator with learnable weights and biases (Equation (1)).
pi = fa(Oi-1 × wi + bi)
where pi is the output feature at ith convolutional layer, Oi-1 is output feature at i-1 layer, fa is activation function, wi is learnable weight at ith layer, and bi is bias at ith layer.
The downsampling path learns the contexts of airborne images and the upsampling path then performs localization, which can provide a class label into each pixel. In particular, the skip connection adds the contextual features from each encoding layer to the equivalent decoding layer to mitigate context loss during the localization.
The airborne images and the corresponding label images were fed into the U-Net model for the training with the stochastic gradient decent method [40]. With pixel-wise softmax function, the train loss is calculated by cross entropy function (Equations (2) and (3)).
s i ( x ) = e p i ( x ) j = 1 I e p j ( x )
C = x Ω log ( s k ( x ) ( x ) )
where s i ( x ) is the approximated maximum function, p i ( x ) is nonlinear convolutional features by activation in channel i at the pixel location x, I is number of labels, C is cross entropy at each position of s k ( x ) ( x ) deviation from 1, k is the true class of each pixel (i.e., Ω→{1, …, I}).
This study utilized the pre-trained MobileNetV2 for the contracting path while it fine-tuned the number of kernels in pix2pix layers for the expending path. The transfer learning allows for fast adaptation during new task learning based on starting from pre-assigned initial weight [41]. In addition, the fine-tuning of the baseline model contributes to improving its performance without making a complex internal structure [42,43]. Specifically, the numbers of internal kernels in expanding paths were changed from 512 to 32 at the first convolutional layer of pix2pix, 256 to 16 at the second layer, 128 to 8 at the third layer, and 64 to 4 at the fourth layer, respectively. Moreover, for the other hyperparameter of U-Net training, the momentum constant was 0.9 and the learning rate was assigned as 0.00001. Furthermore, the training batch size and epoch were set as 256 and 2000, respectively.

2.5.2. Forest Change Detection of U-Net

The trained U-Net model was applied to new images for detecting forest land changes in order to evaluate the model generalizability, and this study used spatial information open platforms such as Kakao map (https://map.kakao.com accessed on 4 October 2021). This web service can provide the satellite images of South Korea with various spatial resolutions and different time periods. These images are originally captured, managed, and offered by NGII. The regions containing woodland changes (except the capital area) were selected for testing the U-Net model (Figure 3). In Kakao map we randomly searched specific regions in Chungcheong, Gangwon, Jella, Gyeongsang, and Jeju Island, where the forest changes were observed by time (i.e., the image in 2009 and image in 2016 had different topology for forest and non-forest regions). We prepared these images with spatial resolution of 30 m by zooming in at the website, and then downloaded and cropped the images at 128 × 128 size. The prepared test data applied to the trained U-Net model. The segmented results were recombined to the original size of the image, after which the evaluation of U-Net change detection was conducted by the visual comparison between the segmentation maps and ground truth maps.

2.6. Performance Evaluation

Segmentation performance is evaluated by calculating pixel accuracy, F1 score, and intersection over union (IoU). These accuracy indexes indicate the correspondence between ground truth labels and modeled label for each pixel of the image. Thus, the pixel accuracy, F1 score, and IoU are defined by the equation as follows:
PA = TP n + TN n TP n + TN n + FP n + FN n
F 1   score = TP n TP n + 1 2 ( FP n + FN n )
IoU = TP n TP n + FP n + FN n
where PA indicates pixel accuracy; TP n is the number of true positive that pixels are correctly labelled as forest region; TN n is the number of true negative that pixels are incorrectly labelled as forest; FP n is the number of false positive that pixels are correctly labelled as not forest; and FN n is the number of false negative that pixels are incorrectly labelled as not forest.

3. Results and Discussions

3.1. Open Data Source for the Semantic Segmentation of Forest Region

The acquired images contained the various topological information of the forest region. The tree species in the label data composed of pine tree, larch, broadleaf tree, needleleaf tree, and the other conifers. Among these trees, pine tree is the major tree species in South Korea. However, in Gyeonggi province the dominant tree species is broadleaf tree. This species is a representative tree in the central region of South Korea as natural vegetation [44]. In data processing of the tree label data, all of the tree species were categorized to one class as forest region, while the other areas were assigned to non-forest region. The selected datasets for the forest classification with U-Net showed a higher portion of forest class than the non-forest. Specifically, the training datasets composed of forest region and non-forest region of 88% and 12%, respectively. For the validation data, the ratios of forest area and non-forest area were observed as 89% and 11%. Although these data had relatively large amounts of the information of the forest compared to the trait quantity of the non-forest, the distinctive spectral features between forest and non-forest regions could work as indications of the feature extraction during the deep learning training.

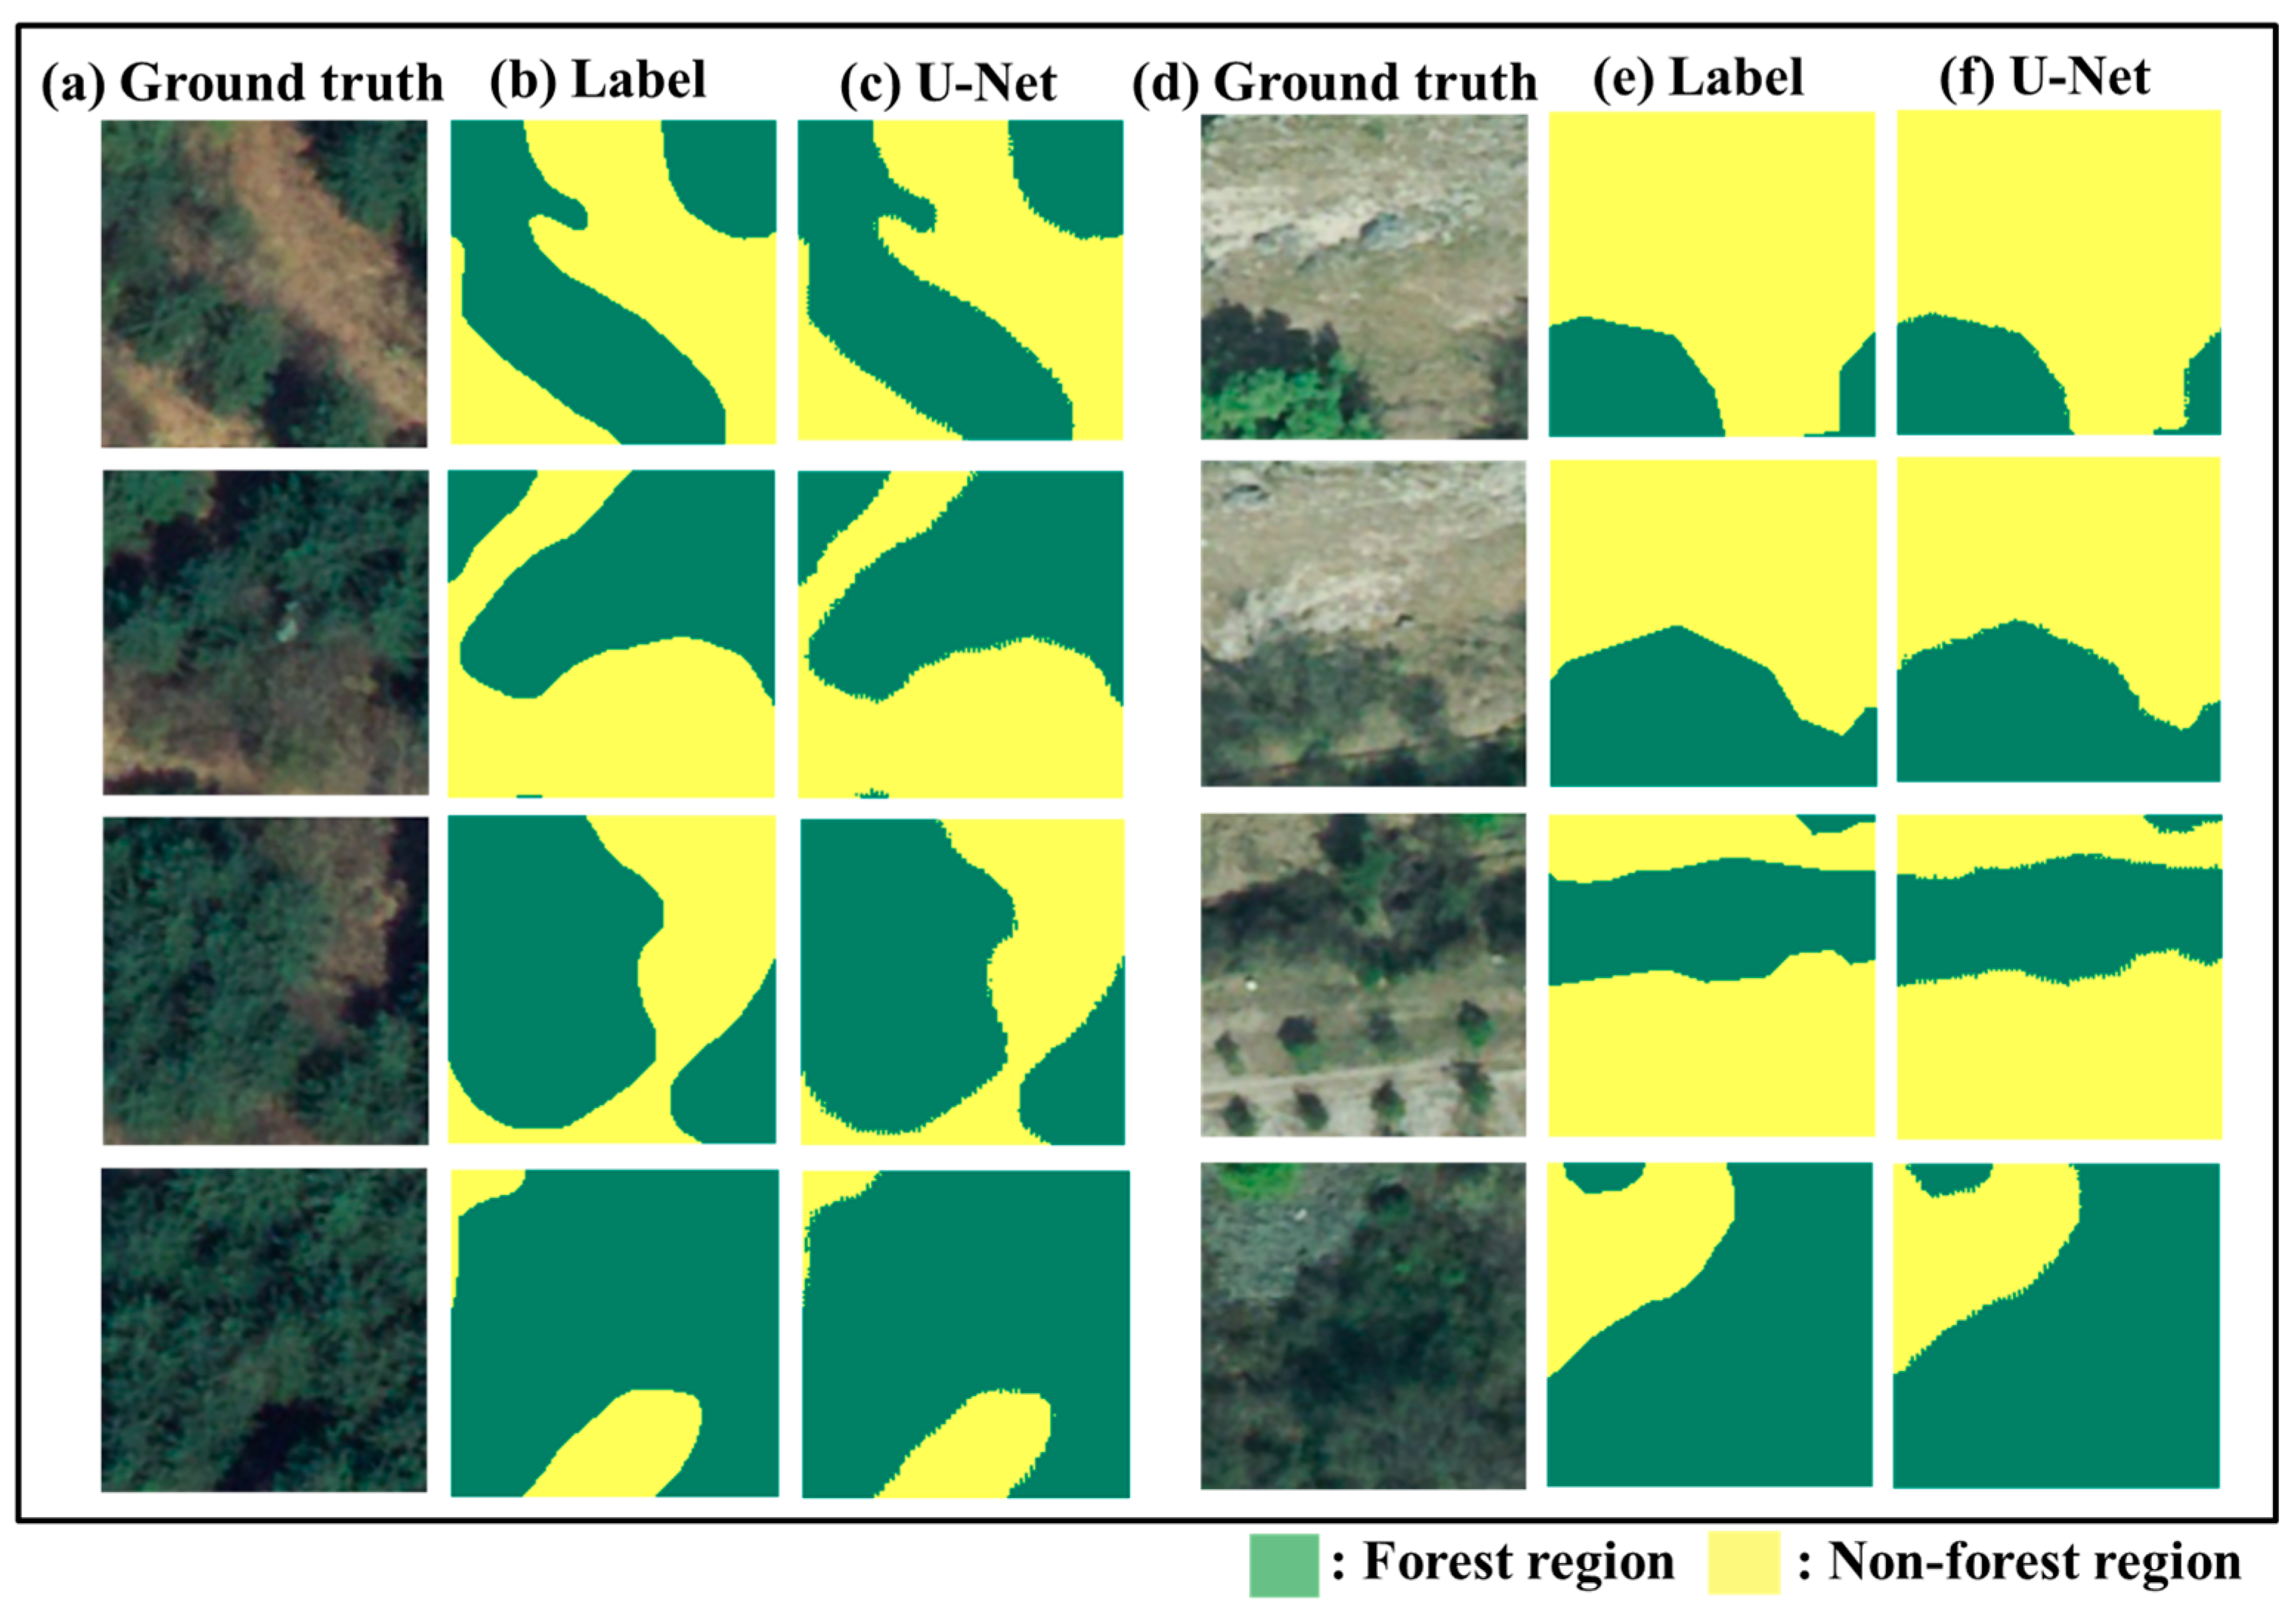
3.2. Forest and Non-Forest Region Segmentation of U-Net

Semantic segmentation of the U-Net model classified the forest and non-forest regions in the capital areas. The training and validation losses were converged to 0.0014 and 0.27, respectively (Figure 4a). In addition, the pixel accuracies of the U-Net training and validation were 0.99 and 0.97 (Figure 4b). Specifically, in the training results, the visual analysis of U-Net segmentation images showed the identical forest and non-forest regions compared to RGB and the label imagery (Figure 5). From the visual comparison of the validation results, the U-Net model followed well the regional trends of the forest and non-forest (Figure 6). Zhang et al. (2021) [29] demonstrated that the U-Net was capable of segmenting wildfire progression using the combination of radar and optical images showing overall accuracy of 0.93. Ahmed et al. (2021) [45] introduced the U-Net accuracy of 0.95 for object segmentation in the drone image scenery. Hacıefendioğlu et al. (2022) [46] also found that the capacity of U-Net application for detecting ice from wind turbine blade images had the accuracy of 0.97. That is, the U-Net segmentation results from these previous studies imply that the U-Net model is an effective candidate for semantic segmentation tasks for various fields [47]. Moreover, the merits of U-Net for segmentation tasks were better per-pixel localization and global representation of the input features, by conducting the expending path, than the fully CNN models [48]. However, for the validation result, shadowing regions were misclassified as forest region. The similar features between the shadow and shadowed tree might make the feature extraction of U-Net confused (Figure 6c,i). When the shadowing effect was dominant, the shadow removal process was needed to improve the performance of semantic segmentation [49]. Moreover, grass areas were improperly classified to the regions of the forest due to the optical traits such as normalized difference in vegetation index (Figure 6f) [50].
This study selected the trained U-Net model at the epoch of 1500, although the loss curve of the validation was not reached at the minimum but kept increasing while the loss of the training was at the minimum. This loss trend was typically called because the training model had undergone to overfitting. Thus, we analyzed the U-Net model performance at the epoch of 500, 1000, 1500, and 2000. The validation pixel accuracies of the selected epoch were 0.96, 0.97, 0.97, and 0.97, respectively (Table 1). The improvement in the validation performance and the visual comparison between the U-Net and label images implied that the results at the epoch of 1500 were solidified, so as not to be under the overfitting (Figure 6c,f,i). Thus, the overall result of the U-Net model at the epoch of 1500 showed robust classification performance of forest and non-forest regions with the pixel accuracy, F1 score, and IoU of 0.99, 0.97, and 0.95, respectively (Table 2). The authors of Dong et al. (2019) [51] presented the entire results of the semantic segmentation with pixel accuracy and F1 score values of 0.89 and 0.89, while Mi et al. (2020) [52] introduced maximum accuracy of the semantic segmentation by having an F1 score of 0.93 and IoU of 0.90.
In some cases we found that the trained U-Net model correctly classified the forest and non-forest regions, but the label data were incorrect (Figure 7). This might contribute to the increase in the validation loss. Li et al. (2018) [53] introduced the increasing trend of validation accuracy, despite reaching the global minima of training loss. Even though the designed deep learning architecture successfully provided the detection performance of glaucomatous optic neuropathy, this previous study suggested the larger datasets for mitigating the conflicting validation tendency. Moreover, when determining the optimal model selection, the overall results with respect to the number of epoch needed to be considered [54]. Lee et al. (2019) [55] adopted the deep learning model architecture that had relatively low training loss, but high validation and test loss compared to the other architecture showing the low validation and test loss.

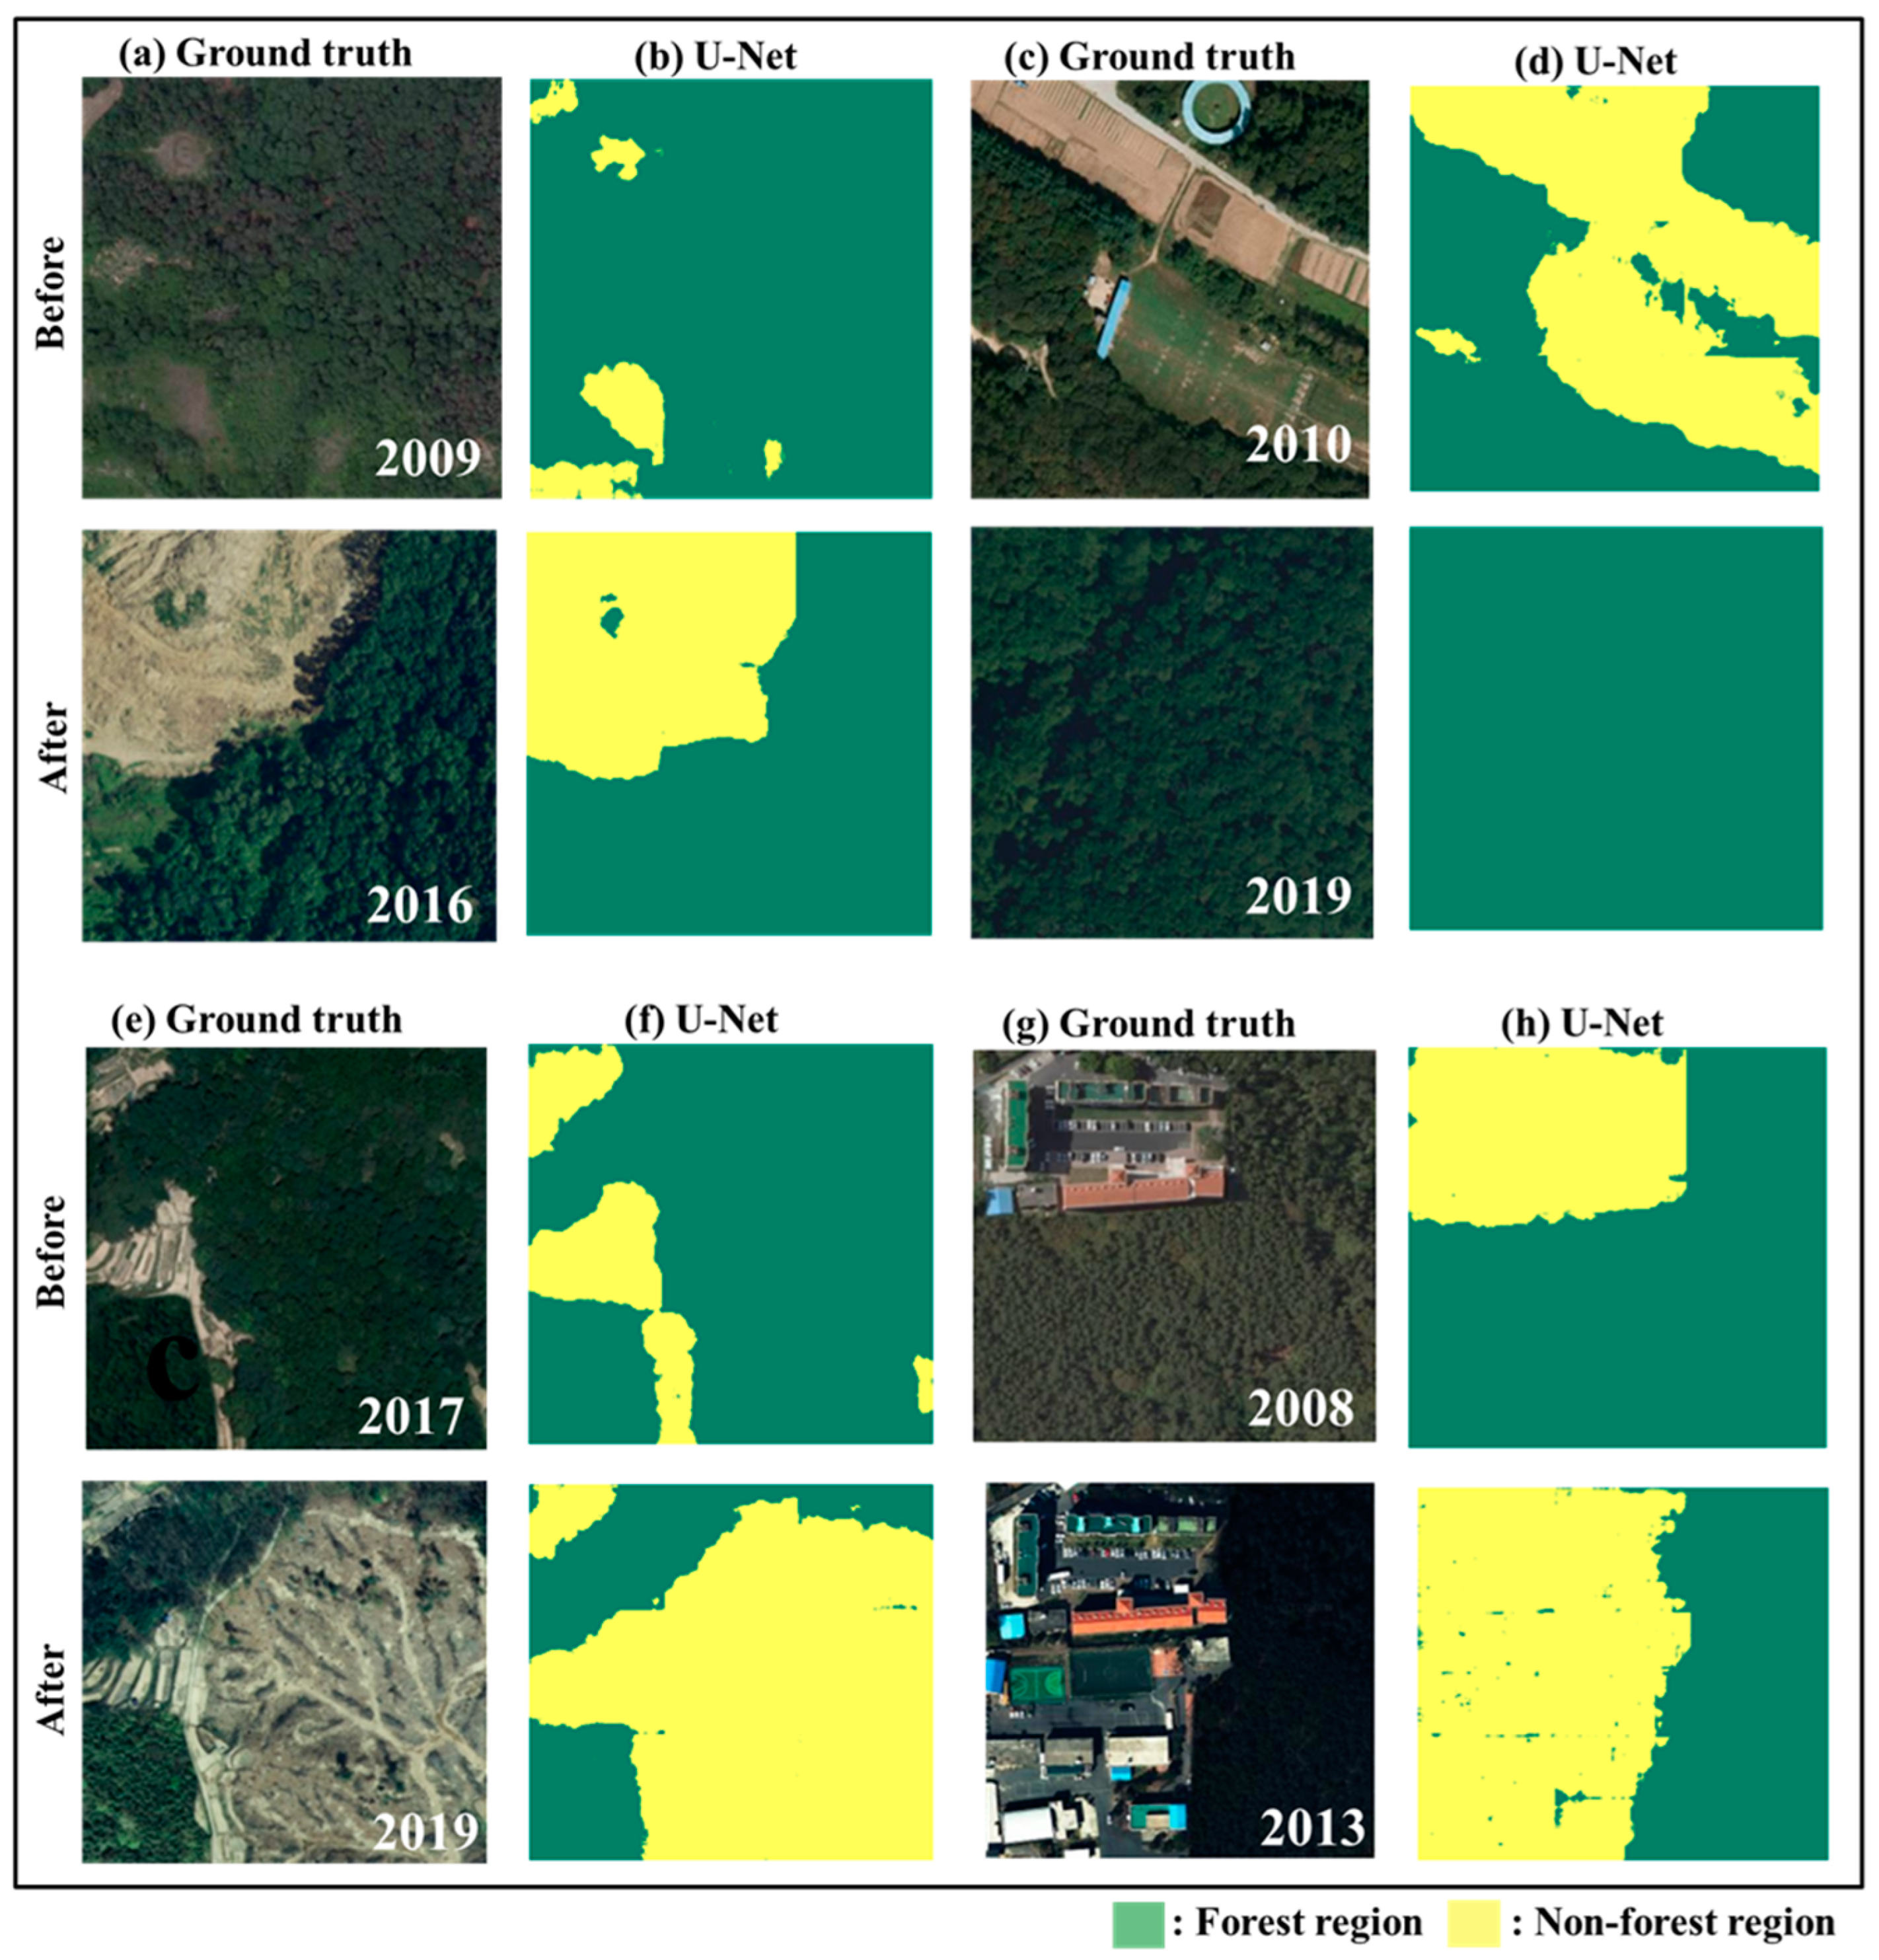
3.3. U-Net Test Performance Evaluation for Forest Change Detection

The trained U-Net model was applied for the change detection of forest areas using open map service. In order to evaluate the model capability, the test areas were selected from the major provinces of South Korea including Chungcheong, Gangwon, Jeolla, and Gyeongsang provinces. The area in Jeju Island was also tested for the change detection. The test performance was evaluated by the visual comparison between the ground truth images (Figure 8a,c,e,g) and the model output images (Figure 8b,d,f,h). The U-Net model was able to detect the forest area change in Chungcheong from 2009 to 2016 that might be due to the urban development (Figure 9a). This model also detected the change in the forest regions in the middle of the mountainous sector in Gangwon from 2010 to 2019 (Figure 9b), Jeolla from 2008 to 2013 (Figure 9c), Gyeongsang provinces from 2017 to 2019 (Figure 9d), and where the decrease in the forest zone might be caused by anthropogenic development or natural disaster. In case of not being mainland, the change area of the forest in Jeju Island from 2008 to 2013 due to the expansion of the residential areas was able to be detected by the segmentation model (Figure 9e). Overall, the U-Net model showed the significant capacity to generally detect forest change regions (Figure 9). That is, the features of tree species in the capital area could cover the features in the other areas in the varied provinces and island. In fact, the tree species of South Korea mainly occupy broadleaf trees and pine trees as 47% and 22%, respectively [56]. Thus, for evaluating the generalizability of the U-Net model, the volunteering geographic information service, including Kakao map and Google map, mitigated further data production [30]. Choi et al. (2020) [57] utilized Kakao map images for training the U-Net resulting in a significant localization performance of urban building areas. Moreover, several previous studies observed satisfactory image segmentation accuracy by coupling Google map images with U-Net architectures [42,58,59]. The test performance was dependent on the training epoch. Even though the high validation loss was observed in the high number of epochs, the performance of the forest change detection was improved until the epoch of 1500 with respect to the test areas (Figure 10d).
Furthermore, the U-Net performance was affected by whether the indistinguishable label was excluded or not. The test performance of the U-Net model with the annotation of indistinguishable region was shown in Figure 11. The training and validation accuracies were 0.90 and 0.59, respectively. The features of the unknown area might confuse the overall feature extraction of the model training, thereby resulting in lower segmentation performance of U-Net than the performance without the unspecified label data. Ishibashi et al. (2021) [60] suggested that vague or superimposition labels should be excluded when building the input datasets in order to improve deep learning model performance. Hang et al. (2021) [61] conducted additional input image processing to rectify the incorrect label to prevent the ambiguous deep learning model training. Thus, the thorough data quality control is the challenge for minimizing the uncertainty of the deep learning model performance because the model is vulnerable to the anonymous label and annotation mistakes [62,63].

3.4. Feasibility Implication of Using Open Source Data and Deep Learning for Change Detection

This study identified the generalization ability of the U-Net model for forest change detection using open source airborne imagery and open map service. The open source datasets are based on the stability in that the data are securely managed [64], the continuity in that the data keep updating, and the reliability in that data quality is controlled [65]. Moreover, the open map service can maximize the accessibility of the data utilization with the varied aspects of space and time [66,67]. Additionally, the granularity of the open image data allowed elucidating the various aspects of the forest change [68]. Large numbers of datasets can amplify the applicability of a data-driven approach for the change detection [69]. These traits of open source data facilitate the generalized deep learning model for the map generalization process [70]. Moreover, change detection mapping based on the open source data provided effective means in terms of the identification of topological transformation in large areas [71]. Thus, the generalization ability of U-Net can be in accordance with reality due to the larger data quantity by covering broader spatial ranges [72].
In case of applying the deep learning model, the use of pre-trained architecture lowers barriers to deep learning application in the ways of lightweight [73,74]. Additionally, its fine-tuning approach enables the ability to improve the robustness of pre-trained deep neural networks [75]. The fine-tuning of the pre-trained model was actively applied to the change detection tasks including vehicle detection [76], damaged building detection [77], and lexical detection [78]. Therefore, open data and deep learning model usage contributed to enhancing the feasibility, not only for the change detection but also the other derivative studies. Furthermore, although this study demonstrated the robust feasibility of open source data and deep learning applications for forest change detection, the lag time of the image acquisition could miss important change circumstances. In this matter, further studies will be needed for the real time change detection of forest areas caused by floods, landslides, and earthquakes with acquiring additional instant image data from aerial platforms such as drones.

4. Conclusions

This study assessed the feasibility of open source airborne images and the U-Net model to examine the forest change detection in the regions of South Korea. The open source data mitigated the physical limitations of acquiring the remote sensing and contributed to improving the generalization of the data-driven approach, while the fine-tuning of the pre-trained U-Net model improved the deep learning model utility. The U-Net model showed good training and validation accuracy for classifying forest and non-forest regions at each image pixel. Herein, the training steps and the excluding ambiguous label were critical to semantic segmentation performance of U-Net in terms of forest regions. Moreover, the generalization of the trained U-Net model followed well the spatial and temporal trends of forest distribution changes in South Korea. This robustness of the U-Net change detection with few data implies that the training data should contain the representative information in terms of various tree species. Therefore, the U-Net feasibility in the open source data basis was proven to have a potential for forest change detection. Future research will be needed to conduct additional filtering of incorrect label data for minimizing the data uncertainty, and also to test extension of the forest change detection through deep learning models by mapping the vulnerable regions of forest change.

Author Contributions

Conceptualization, J.P. and D.J.; methodology, J.P.; software, J.P. and K.-j.H.; data curation, J.P., K.-j.H., Y.C. and D.K.; investigation, K.-j.H., Y.C. and D.K.; resource, Y.C. and D.K.; writing—original draft preparation, J.P.; visualization, J.P.; writing—review and editing, D.J.; project administration, D.J. All authors have read and agreed to the published version of the manuscript.

Funding

This paper was written following the research work “Building an Environmental Monitoring System using AI to Implement the Digital New Deal” (RE2021-09), funded by the Korea Environment Institute (KEI). This work was supported by the National Research Foundation of Korea (NRF) grant funded by the Korea government (MSIT) [No. 2020R1C1C1013582].

Data Availability Statement

The data that support the findings of this study are available from the corresponding author, D. Jin, upon reasonable request.

Conflicts of Interest

The authors declare no conflict of interest.

References

  1. Allen, J.C.; Barnes, D.F. The causes of deforestation in developing countries. Ann. Assoc. Am. Geogr. 1985, 75, 163–184. [Google Scholar] [CrossRef]
  2. Brovelli, M.A.; Sun, Y.; Yordanov, V. Monitoring forest change in the amazon using multi-temporal remote sensing data and machine learning classification on Google Earth Engine. ISPRS Int. J. Geo-Inf. 2020, 9, 580. [Google Scholar] [CrossRef]
  3. Pretzsch, H.; Hilmers, T.; Uhl, E.; Río, M.D.; Avdagić, A.; Bielak, K.; Bončina, A.; Coll, L.; Giammarch, F.; Stimm, K.; et al. Efficacy of trans-geographic observational network design for revelation of growth pattern in mountain forests across Europe. In Climate-Smart Forestry in Mountain Regions; Springer: Cham, Switzerland, 2022; pp. 141–187. [Google Scholar]
  4. Scheidl, C.; Heiser, M.; Kamper, S.; Thaler, T.; Klebinder, K.; Nagl, F.; Lechner, V.; Markart, G.; Rammer, W.; Seidl, R. The influence of climate change and canopy disturbances on landslide susceptibility in headwater catchments. Sci. Total Environ. 2020, 742, 140588. [Google Scholar] [CrossRef] [PubMed]
  5. Sidle, R.C.; Dhakal, A.S. Change on Landslide Hazards in Forest. Environ. Chang. Geomorphic Hazards For. 2002, 9, 123. [Google Scholar]
  6. Pappas, C.; Bélanger, N.; Bergeron, Y.; Blarquez, O.; Chen, H.Y.; Comeau, P.G.; Grandpré, L.D.; Delagrange, S.; DesRochers, A.; Diochon, A.; et al. Smartforests Canada: A Network of Monitoring Plots for Forest Management under Environmental Change. In Climate-Smart Forestry in Mountain Regions; Springer: Cham, Switzerland, 2022; pp. 521–543. [Google Scholar]
  7. Wulder, M.A.; Franklin, S.E. Remote Sensing of Forest Environments: Concepts and Case Studies; Springer Science & Business Media: Berlin/Heidelberg, Germany, 2012. [Google Scholar]
  8. Huete, A.R. Vegetation indices, remote sensing and forest monitoring. Geogr. Compass 2012, 6, 513–532. [Google Scholar] [CrossRef]
  9. Onishi, M.; Ise, T. Explainable identification and mapping of trees using UAV RGB image and deep learning. Sci. Rep. 2021, 11, 903. [Google Scholar] [CrossRef]
  10. Mäyrä, J.; Keski-Saari, S.; Kivinen, S.; Tanhuanpää, T.; Hurskainen, P.; Kullberg, P.; Poikolainen, L.; Viinikka, A.; Tuominen, S.; Kumpula, T.; et al. Tree species classification from airborne hyperspectral and LiDAR data using 3D convolutional neural networks. Remote Sens. Environ. 2021, 256, 112322. [Google Scholar] [CrossRef]
  11. Adjognon, G.S.; Rivera-Ballesteros, A.; van Soest, D. Satellite-based tree cover mapping for forest conservation in the drylands of Sub Saharan Africa (SSA): Application to Burkina Faso gazetted forests. Dev. Eng. 2019, 4, 100039. [Google Scholar] [CrossRef]
  12. Vu, T.T.; Vu, N.V.A.; Phung, H.P.; Nguyen, L.D. Enhanced urban functional land use map with free and open-source data. Int. J. Digit. Earth 2021, 14, 1744–1757. [Google Scholar] [CrossRef]
  13. Long, Y.; Xia, G.S.; Yang, W.; Zhang, L.; Li, D. Toward Dataset Construction for Remote Sensing Image Interpretation. In Proceedings of the 2021 IEEE International Geoscience and Remote Sensing Symposium IGARSS, IEEE, Brussels, Belgium, 11–16 July 2021; pp. 1210–1213. [Google Scholar]
  14. Chen, Y.; Lin, Z.; Zhao, X.; Wang, G.; Gu, Y. Deep learning-based classification of hyperspectral data. IEEE J. Sel. Top. Appl. Earth Obs. Remote Sens. 2014, 7, 2094–2107. [Google Scholar] [CrossRef]
  15. Kalchbrenner, N.; Grefenstette, E.; Blunsom, P. A convolutional neural network for modelling sentences. arXiv 2014, arXiv:1404.2188. [Google Scholar]
  16. Sainath, T.N.; Kingsbury, B.; Sindhwani, V.; Arisoy, E.; Ramabhadran, B. Low-rank matrix factorization for deep neural network training with high-dimensional output targets. In Proceedings of the 2013 IEEE International Conference on Acoustics, Speech and Signal Processing, IEEE, Vancouver, BC, Canada, 26–31 May 2013; pp. 6655–6659. [Google Scholar]
  17. Khan, M.J.; Yousaf, A.; Javed, N.; Nadeem, S.; Khurshid, K. Automatic target detection in satellite images using deep learning. J. Space Technol. 2017, 7, 44–49. [Google Scholar]
  18. Sun, C.; Huang, C.; Zhang, H.; Chen, B.; An, F.; Wang, L.; Yun, T. Individual tree crown segmentation and crown width extraction from a heightmap derived from aerial laser scanning data using a deep learning framework. Front. Plant Sci. 2022, 13. [Google Scholar] [CrossRef] [PubMed]
  19. Nemoto, T.; Futakami, N.; Yagi, M.; Kumabe, A.; Takeda, A.; Kunieda, E.; Shigematsu, N. Efficacy evaluation of 2D, 3D U-Net semantic segmentation and atlas-based segmentation of normal lungs excluding the trachea and main bronchi. J. Radiat. Res. 2020, 61, 257–264. [Google Scholar] [CrossRef] [PubMed] [Green Version]
  20. Ronneberger, O.; Fischer, P.; Brox, T. U-net: Convolutional networks for biomedical image segmentation. In Proceedings of the International Conference on Medical Image Computing and Computer-Assisted Intervention, Munich, Germany, 5–9 October 2015; Springer: Cham, Switzerland, 2015; pp. 234–241. [Google Scholar]
  21. Zhou, X.Y.; Yang, G.Z. Normalization in training U-Net for 2-D biomedical semantic segmentation. IEEE Robot. Autom. Lett. 2019, 4, 1792–1799. [Google Scholar] [CrossRef] [Green Version]
  22. Fan, R.; Wang, H.; Cai, P.; Liu, M. Sne-roadseg: Incorporating surface normal information into semantic segmentation for accurate freespace detection. In Proceedings of the European Conference on Computer Vision, Glasgow, UK, 23–28 August 2020; Springer: Cham, Switzerland, 2020; pp. 340–356. [Google Scholar]
  23. Tran, L.A.; Le, M.H. Robust U-Net-based road lane markings detection for autonomous driving. In Proceedings of the 2019 International Conference on System Science and Engineering (ICSSE), IEEE, Dong Hoi, Vietnam, 20–21 July 2019; pp. 62–66. [Google Scholar]
  24. Zhou, Q.; Wang, Y.; Fan, Y.; Wu, X.; Zhang, S.; Kang, B.; Latecki, L.J. AGLNet: Towards real-time semantic segmentation of self-driving images via attention-guided lightweight network. Appl. Soft Comput. 2020, 96, 106682. [Google Scholar] [CrossRef]
  25. Chen, Z.; Li, D.; Fan, W.; Guan, H.; Wang, C.; Li, J. Self-attention in reconstruction bias U-Net for semantic segmentation of building rooftops in optical remote sensing images. Remote Sens. 2021, 13, 2524. [Google Scholar] [CrossRef]
  26. Yi, Y.; Zhang, Z.; Zhang, W.; Zhang, C.; Li, W.; Zhao, T. Semantic segmentation of urban buildings from VHR remote sensing imagery using a deep convolutional neural network. Remote Sens. 2019, 11, 1774. [Google Scholar] [CrossRef] [Green Version]
  27. Zhang, Z.; Liu, Q.; Wang, Y. Road extraction by deep residual u-net. IEEE Geosci. Remote Sens. Lett. 2018, 15, 749–753. [Google Scholar] [CrossRef] [Green Version]
  28. Wagner, F.H.; Sanchez, A.; Tarabalka, Y.; Lotte, R.G.; Ferreira, M.P.; Aidar, M.P.; Gloor, E.; Phillips, O.L.; Aragao, L.E. Using the U-net convolutional network to map forest types and disturbance in the Atlantic rainforest with very high resolution images. Remote. Sens. Ecol. Conserv. 2019, 5, 360–375. [Google Scholar] [CrossRef] [Green Version]
  29. Zhang, P.; Ban, Y.; Nascetti, A. Learning U-Net without forgetting for near real-time wildfire monitoring by the fusion of SAR and optical time series. Remote Sens. Environ. 2021, 261, 112467. [Google Scholar] [CrossRef]
  30. Zhong, Y.; Su, Y.; Wu, S.; Zheng, Z.; Zhao, J.; Ma, A.; Zhu, Q.; Ye, R.; Li, X.; Pellikka, P.; et al. Open-source data-driven urban land-use mapping integrating point-line-polygon semantic objects: A case study of Chinese cities. Remote Sens. Environ. 2020, 247, 111838. [Google Scholar] [CrossRef]
  31. Chen, B.; Tu, Y.; Song, Y.; Theobald, D.M.; Zhang, T.; Ren, Z.; Li, X.; Yang, J.; Wang, J.; Wang, X.; et al. Mapping essential urban land use categories with open big data: Results for five metropolitan areas in the United States of America. ISPRS J. Photogramm. Remote Sens. 2021, 178, 203–218. [Google Scholar] [CrossRef]
  32. Hermosilla, T.; Wulder, M.A.; White, J.C.; Coops, N.C. Land cover classification in an era of big and open data: Optimizing localized implementation and training data selection to improve mapping outcomes. Remote Sens. Environ. 2022, 268, 112780. [Google Scholar] [CrossRef]
  33. Otálora, S.; Atzori, M.; Andrearczyk, V.; Khan, A.; Müller, H. Staining invariant features for improving generalization of deep convolutional neural networks in computational pathology. Front. Bioeng. Biotechnol. 2019, 7, 198. [Google Scholar] [CrossRef] [PubMed]
  34. Vetrò, A.; Canova, L.; Torchiano, M.; Minotas, C.O.; Iemma, R.; Morando, F. Open data quality measurement framework: Definition and application to Open Government Data. Gov. Inf. Q. 2016, 33, 325–337. [Google Scholar] [CrossRef] [Green Version]
  35. Park, S.; Choi, G. Urban sprawl in the Seoul Metropolitan Region, Korea Since the 1980s observed in satellite imagery. J. Korean Geogr. Soc. 2016, 5, 331–343. [Google Scholar]
  36. Jung, E.; Yoon, H. The impact of landslide disaster on housing prices—A case study of the landslide of mt. Umyeon in Seoul, Korea. J. Korea Plan. Assoc 2017, 52, 153–170. [Google Scholar] [CrossRef]
  37. Kim, D.; Yoo, J.; Son, H.J.; Kim, T.W. Evaluating meteorological and hydrological impacts on forest fire occurrences using partial least squares-structural equation modeling: A case of Gyeonggi-do. J. Korea Water Resour. Assoc. 2021, 54, 145–156. [Google Scholar]
  38. Sandler, M.; Howard, A.; Zhu, M.; Zhmoginov, A.; Chen, L.C. Mobilenetv2: Inverted residuals and linear bottlenecks. In Proceedings of the IEEE Conference on Computer Vision and Pattern Recognition, Salt Lake City, UT, USA, 18–22 June 2018; pp. 4510–4520. [Google Scholar]
  39. Isola, P.; Zhu, J.Y.; Zhou, T.; Efros, A.A. Image-to-image translation with conditional adversarial networks. In Proceedings of the IEEE Conference on Computer Vision and Pattern Recognition, Honolulu, HI, USA, 21–26 July 2017; pp. 1125–1134. [Google Scholar]
  40. Jia, Y.; Shelhamer, E.; Donahue, J.; Karayev, S.; Long, J.; Girshick, R.; Guadarrama, S.; Darrell, T. Caffe: Convolutional architecture for fast feature embedding. In Proceedings of the 22nd ACM International Conference on Multimedia, Orlando, FL, USA, 3–7 November 2014; pp. 675–678. [Google Scholar]
  41. Soh, J.W.; Cho, S.; Cho, N.I. Meta-transfer learning for zero-shot super-resolution. In Proceedings of the IEEE/CVF Conference on Computer Vision and Pattern Recognition, Seattle, WA, USA, 13–19 June 2020; pp. 3516–3525. [Google Scholar]
  42. Fu, M.; Zhu, M.; Yang, Y.; Song, W.; Wang, M. LiDAR-based vehicle localization on the satellite image via a neural network. Robot. Auton. Syst. 2020, 129, 103519. [Google Scholar] [CrossRef]
  43. Pham, T.D. Classification of COVID-19 chest X-rays with deep learning: New models or fine tuning? Health Inf. Sci. Syst. 2021, 9, 2. [Google Scholar] [CrossRef] [PubMed]
  44. Park, Y.D.; Lee, D.K.; Kim, D.Y.; Kim, D.Y. Nutrient dynamics in the throughfall, stemflow, and soil solution of Korean pine, Japanese larch, and hardwood stands at Kwangju-Gun, Kyonggi-Do. J. Korean Soc. For. Sci. 1999, 88, 541–554. [Google Scholar]
  45. Ahmed, I.; Ahmad, M.; Jeon, G. A real-time efficient object segmentation system based on U-Net using aerial drone images. J. Real-Time Image Process. 2021, 18, 1745–1758. [Google Scholar] [CrossRef]
  46. Hacıefendioğlu, K.; Başağa, H.B.; Yavuz, Z.; Karimi, M.T. Intelligent ice detection on wind turbine blades using semantic segmentation and class activation map approaches based on deep learning method. Renew. Energy 2022, 182, 1–16. [Google Scholar] [CrossRef]
  47. Xiao, B.; Xu, B.; Bi, X.; Li, W. Global-feature encoding U-Net (GEU-Net) for multi-focus image fusion. IEEE Trans. Image Process. 2020, 30, 163–175. [Google Scholar] [CrossRef] [PubMed]
  48. Natarajan, V.A.; Kumar, M.S.; Patan, R.; Kallam, S.; Mohamed, M.Y.N. Segmentation of nuclei in histopathology images using fully convolutional deep neural architecture. In Proceedings of the 2020 International Conference on Computing and Information Technology (ICCIT-1441), Tabuk, Saudi Arabia, 9–10 September 2020; pp. 1–7. [Google Scholar]
  49. Tusa, E.; Monnet, J.M.; Barré, J.B.; Dalla Mura, M.; Chanussot, J. Fusion of lidar and hyperspectral data for semantic segmentation of frest tree species. Int. Arch. Photogramm. Remote Sens. Spat. Inf. Sci. 2020, 43, 487–494. [Google Scholar]
  50. Ayhan, B.; Kwan, C. Tree, shrub, and grass classification using only RGB images. Remote Sens. 2020, 12, 1333. [Google Scholar] [CrossRef]
  51. Dong, R.; Pan, X.; Li, F. DenseU-net-based semantic segmentation of small objects in urban remote sensing images. IEEE Access 2019, 7, 65347–65356. [Google Scholar] [CrossRef]
  52. Mi, L.; Chen, Z. Superpixel-enhanced deep neural forest for remote sensing image semantic segmentation. ISPRS J. Photogramm. Remote Sens. 2020, 159, 140–152. [Google Scholar] [CrossRef]
  53. Li, Z.; He, Y.; Keel, S.; Meng, W.; Chang, R.T.; He, M. Efficacy of a deep learning system for detecting glaucomatous optic neuropathy based on color fundus photographs. Ophthalmology 2018, 125, 1199–1206. [Google Scholar] [CrossRef] [Green Version]
  54. Toh, C.; Brody, J.P. Analysis of copy number variation from germline DNA can predict individual cancer risk. bioRxiv 2018, 303339. [Google Scholar]
  55. Lee, M.; Han, K.Y.; Yu, J.; Lee, Y.S. A new lane following method based on deep learning for automated vehicles using surround view images. J. Ambient Intell. Humaniz. Comput. 2019, 1–14. [Google Scholar] [CrossRef]
  56. Choi, K.; Kim, M.; Lee, W.K.; Gang, H.U.; Chung, D.J.; Ko, E.J.; Yun, B.H.; Kim, C.H. Estimating radial growth response of major tree species using climatic and topographic condition in South Korea. J. Clim. Chang. Res. 2014, 5, 127–137. [Google Scholar] [CrossRef]
  57. Choi, J.; Myung, H. BRM Localization: UAV Localization in GNSS-Denied Environments Based on Matching of Numerical Map and UAV Images. In Proceedings of the 2020 IEEE/RSJ International Conference on Intelligent Robots and Systems (IROS), IEEE, Las Vegas, NV, USA, 25–29 October 2020; pp. 4537–4544. [Google Scholar]
  58. Bian, J.-W.; Zhan, H.; Wang, N.; Li, Z.; Zhang, L.; Shen, C.; Cheng, M.-M.; Reid, I. Unsupervised Scale-consistent Depth Learning from Video. Int. J. Comput. Vis. 2021, 129, 2548–2564. [Google Scholar] [CrossRef]
  59. Quoc, T.T.P.; Linh, T.T.; Minh, T.N.T. Comparing U-Net Convolutional Network with Mask R-CNN in Agricultural Area Segmentation on Satellite Images. In Proceedings of the 2020 7th NAFOSTED Conference on Information and Computer Science (NICS), IEEE, Ho Chi Minh City, Vietnam, 26–27 November 2020; pp. 124–129. [Google Scholar]
  60. Ishibashi, K.; Ariji, Y.; Kuwada, C.; Kimura, M.; Hashimoto, K.; Umemura, M.; Nagao, T.; Ariji, E. Efficacy of a deep leaning model created with the transfer learning method in detecting sialoliths of the submandibular gland on panoramic radiography. Oral Surg. Oral Med. Oral Pathol. Oral Radiol. 2021, 133, 238–244. [Google Scholar] [CrossRef] [PubMed]
  61. Zhang, H.; Mo, J.; Jiang, H.; Li, Z.; Hu, W.; Zhang, C.; Wang, Y.; Wang, X.; Liu, C.; Zhao, B.; et al. Deep learning model for the automated detection and histopathological prediction of meningioma. Neuroinformatics 2021, 19, 393–402. [Google Scholar] [CrossRef] [PubMed]
  62. Liu, X.; Faes, L.; Kale, A.U.; Wagner, S.K.; Fu, D.J.; Bruynseels, A.; Mahendiran, T.; Moraes, G.; Shamdas, M.; Kern, C.; et al. A comparison of deep learning performance against health-care professionals in detecting diseases from medical imaging: A systematic review and meta-analysis. Lancet Dig. Health 2019, 1, e271–e297. [Google Scholar] [CrossRef]
  63. Logan, T.M.; Williams, T.G.; Nisbet, A.J.; Liberman, K.D.; Zuo, C.T.; Guikema, S.D. Evaluating urban accessibility: Leveraging open-source data and analytics to overcome existing limitations. Environ. Plan B Urban Anal. City Sci. 2019, 46, 897–913. [Google Scholar] [CrossRef]
  64. Chen, X.; Ye, Y.; Williams, G.; Xu, X. A survey of open source data mining systems. In Proceedings of the Pacific-Asia Conference on Knowledge Discovery and Data Mining, Nanjing, China, 22–25 May 2007; Springer: Berlin/Heidelberg, Germany, 2007; pp. 3–14. [Google Scholar]
  65. Stoch, B.; Basson, I.J.; Miller, J.A. Implicit Geomodelling of the Merensky and UG2 Reefs of the Bushveld Complex from Open-Source Data: Implications for the Complex’s Structural History. Minerals 2020, 10, 975. [Google Scholar] [CrossRef]
  66. Lock, O.; Pinnegar, S.; Leao, S.Z.; Pettit, C. The making of a mega-region: Evaluating and proposing long-term transport planning strategies with open-source data and transport accessibility tools. In Handbook of Planning Support Science; Edward Elgar Publishing: Cheltenham, UK, 2020. [Google Scholar]
  67. Mostafi, S.; Elgazzar, K. An open source tool to extract traffic data from google maps: Limitations and challenges. In Proceedings of the 2021 International Symposium on Networks, Computers and Communications (ISNCC), IEEE, Dubai, United Arab Emirates, 1–3 June 2021; pp. 1–8. [Google Scholar]
  68. Islind, A.S.; Óskarsdóttir, M.; Steingrímsdóttir, H. Changes in mobility patterns in Europe during the COVID-19 pandemic: Novel insights using open source data. arXiv 2020, arXiv:2008.10505. [Google Scholar]
  69. Zhou, Z.; Xu, Z. Detecting the pedestrian shed and walking route environment of urban parks with open-source data: A case study in Nanjing, China. Int. J. Environ. Health Res. 2020, 17, 4826. [Google Scholar] [CrossRef] [PubMed]
  70. Kang, Y.; Rao, J.; Wang, W.; Peng, B.; Gao, S.; Zhang, F. Towards cartographic knowledge encoding with deep learning: A case study of building generalization. In Proceedings of the AutoCarto 2020, 23rd International Research Symposium on Cartography and GIScience, Kansas City, MI, USA, 18 November 2020. [Google Scholar]
  71. Wang, X.; Fan, X.; Xu, Q.; Du, P. Change detection-based co-seismic landslide mapping through extended morphological profiles and ensemble strategy. ISPRS J. Photogramm. Remote Sens. 2022, 187, 225–239. [Google Scholar] [CrossRef]
  72. Li, J.; Huang, X.; Tu, L.; Zhang, T.; Wang, L. A review of building detection from very high resolution optical remote sensing images. GIsci Remote Sens 2022, 59, 1199–1225. [Google Scholar] [CrossRef]
  73. Min, S.; Seo, M.; Hajishirzi, H. Question answering through transfer learning from large fine-grained supervision data. arXiv 2017, arXiv:1702.02171. [Google Scholar]
  74. Raghu, M.; Zhang, C.; Kleinberg, J.; Bengio, S. Transfusion: Understanding transfer learning with applications to medical imaging. arXiv 2019, arXiv:1902.07208. [Google Scholar]
  75. Jeddi, A.; Shafiee, M.J.; Wong, A. A Simple Fine-tuning Is All You Need: Towards Robust Deep Learning Via Adversarial Fine-tuning. arXiv 2020, arXiv:2012.13628. [Google Scholar]
  76. Wu, X.; Li, W.; Hong, D.; Tian, J.; Tao, R.; Du, Q. Vehicle detection of multi-source remote sensing data using active fine-tuning network. ISPRS J. Photogramm. Remote Sens. 2020, 167, 39–53. [Google Scholar] [CrossRef]
  77. Novikov, G.; Trekin, A.; Potapov, G.; Ignatiev, V.; Burnaev, E. Satellite imagery analysis for operational damage assessment in emergency situations. In Proceedings of the International Conference on Business Information Systems, Berlin, Germany, 18–20 July 2018; Springer: Cham, Switzerland, 2018; pp. 347–358. [Google Scholar]
  78. Kaiser, J.; Kurtyigit, S.; Kotchourko, S.; Schlechtweg, D. Effects of Pre-and Post-Processing on type-based Embeddings in Lexical Semantic Change Detection. arXiv 2021, arXiv:2101.09368. [Google Scholar]
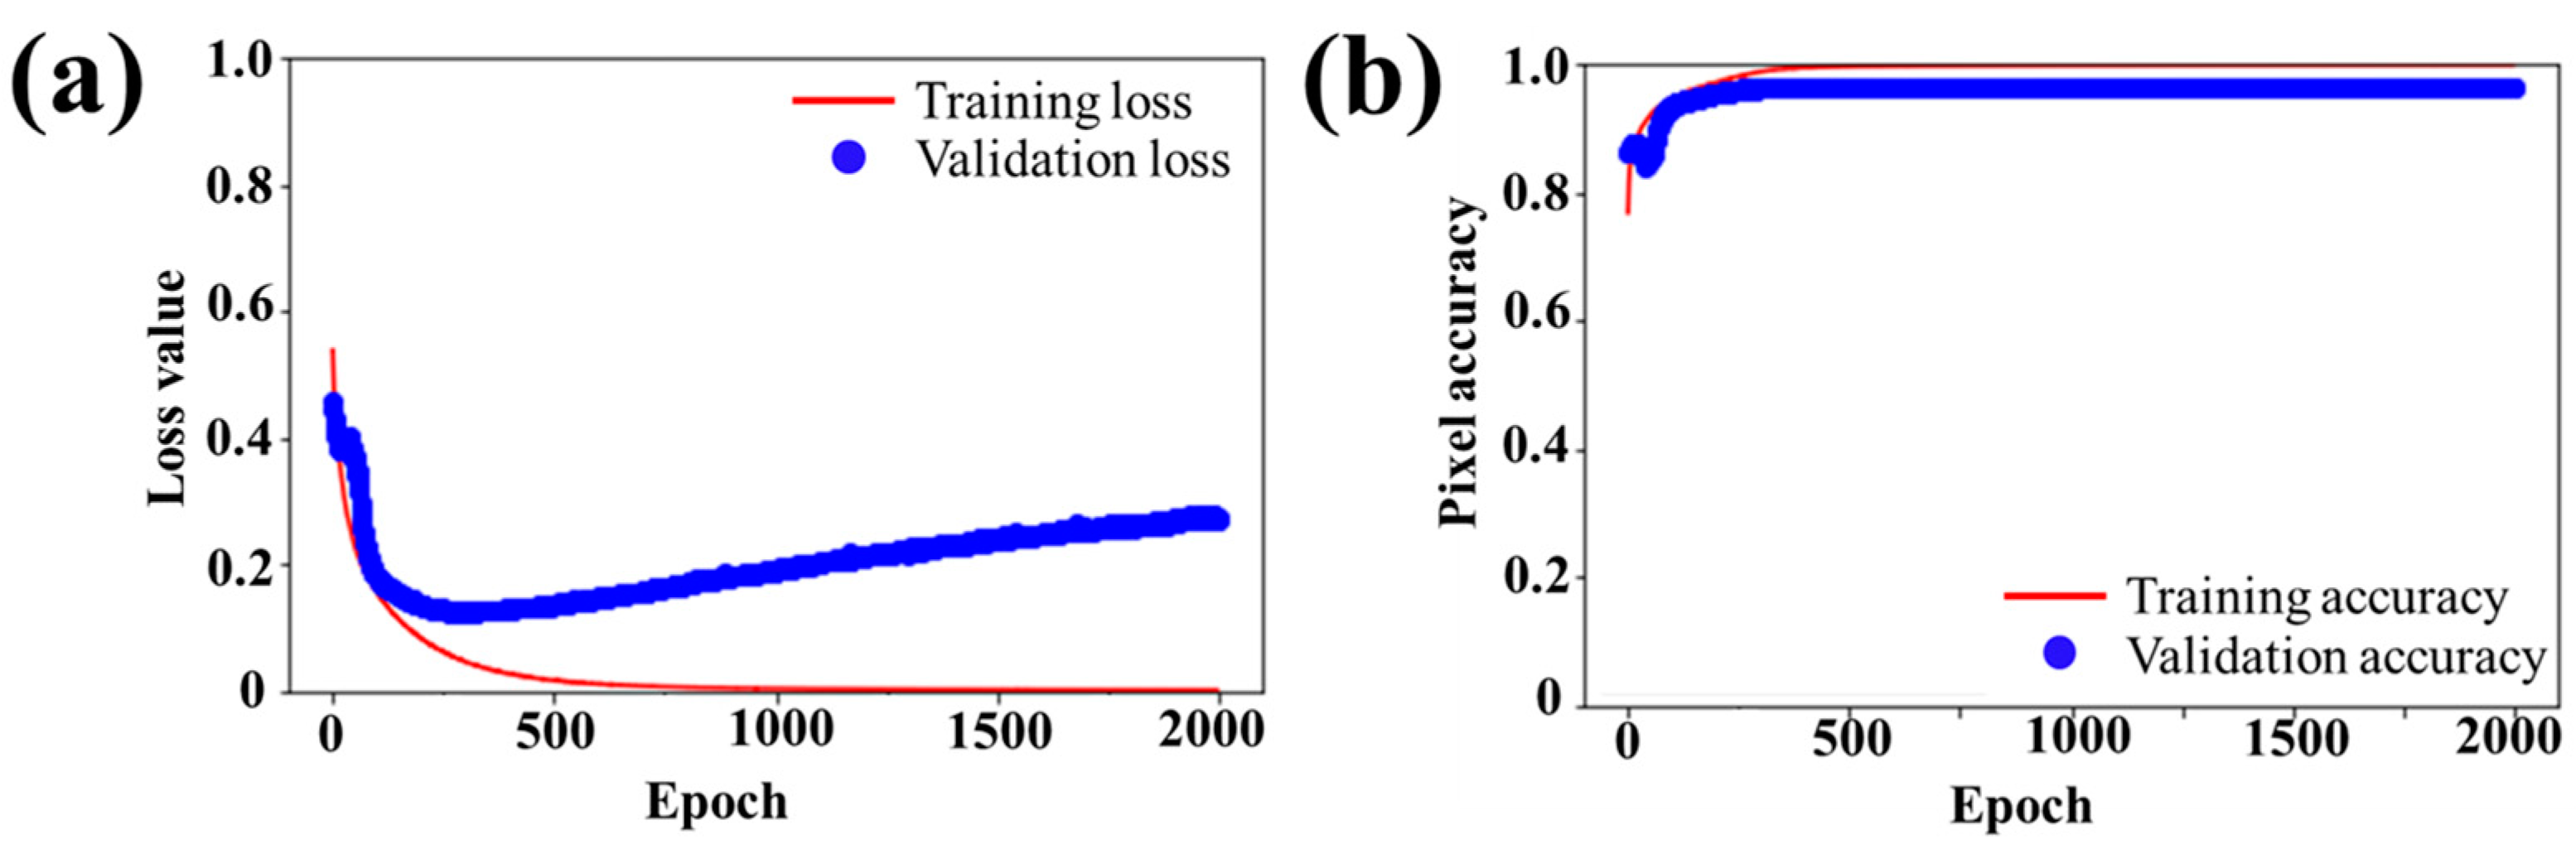
Figure 1. Research overview for evaluating feasibility of forest change detection by using deep learning model training with open source imagery.
Forests 13 02170 g001
Figure 2. U-Net structure for semantic segmentation from the airborne images classifying forest and non-forest regions. Encoding layers were adopted pre-trained structure of MobileNetV2. In addition, decoding layers were pix2pix architecture where the numbers of internal layers were refined.
Forests 13 02170 g002
Figure 3. Study area, capital area of South Korea including Seoul, Incheon, and Gyeonggi province for deep learning model training and the other regions for the model generalization.
Forests 13 02170 g003
Figure 4. Training and validation loss and pixel accuracy values of U-Net classification with respect to forest and non-forest areas. (a) is training and validation loss curve, and (b) is pixel accuracy curve.
Forests 13 02170 g004
Figure 5. U-Net training results classifying forest and non-forest regions at 1500 epoch. (a,d) indicate the RGB images of ground truth in the segmented area, (b,e) present label images of forest and non-forest region denoting to 0 and 1, respectively, and (c,f) are the forest classification results of U-Net in each image pixel. Green color denotes the forest area while yellow indicates non-forest area.
Forests 13 02170 g005
Figure 6. U-Net validation results classifying forest and non-forest regions at 1500 epoch. (a,d,g) indicate the RGB images of ground truth in segmented areas, (b,e,h) present label images of forest and non-forest regions denoting to 0 and 1, respectively, and (c,f,i) are the forest classification results of U-Net in each image pixel. Green color denotes the forest areas while yellow indicates non-forest areas.
Forests 13 02170 g006
Figure 7. U-Net validation results that had incorrect class labels. (a) indicates the RGB images of ground truth in segmented area, (b) presents label images of forest and non-forest regions denoting to 0 and 1, respectively, and (c) is the forest classification results of U-Net in each image pixel. Green color denotes the forest areas while yellow indicates non-forest areas.
Forests 13 02170 g007
Figure 8. U-Net test performance of classifying forest and non-forest regions in different periods from open map service. (a,c,e,g) indicate the RGB images of ground truth in segmented areas and (b,d,f,h) are the forest classification results of U-Net in each image pixel. Green color denotes the forest area while yellow indicates non-forest area denoting to 0 and 1, respectively.
Forests 13 02170 g008
Figure 9. U-Net test performance of classifying forest and non-forest regions in different periods of (a) Chungcheong, (b) Gangwon, (c) Jeolla, (d) Gyeongsang provinces, and (e) Jeju Island images from Kakao map, green color denotes the forest area while yellow indicates non-forest area denoting to 0 and 1, respectively; the dark gray region is the capital area used for training and validation, while the light gray region is the other provinces used for evaluating generalization of the forest change detection of U-Net.
Forests 13 02170 g009
Figure 10. U-Net test performance of classifying forest and non-forest regions in different periods of Gangwon province with respect to: (a) ground truth, (b) 500, (c) 1000, (d) 1500, and (e) 2000 epoch, and green color denotes the forest areas while yellow indicates non-forest areas denoting to 0 and 1, respectively.
Forests 13 02170 g010
Figure 11. Examples of U-Net test results from the model training with undistinguishable label regions in different periods: (a,b) are ground truth and U-Net results of Gyeongsang provinces and (c,d) are ground truth and U-Net results of Jeju Island, and green color denotes the forest area while yellow indicates non-forest area denoting to 0 and 1, respectively.
Forests 13 02170 g011
Table 1. Summary of U-Net performance of each epoch.
TrainingValidation
EpochLoss Value *AccuracyLoss ValueAccuracy
5000.02630.990.130.96
10000.00630.990.180.97
15000.00200.990.240.97
20000.00140.990.270.97
* is unitless.
Table 2. Overall performance evaluation of the selected U-Net model.
AccuracyF1 ScoreIoU
Semantic segmentation of forest and non-forest0.990.970.95
Publisher’s Note: MDPI stays neutral with regard to jurisdictional claims in published maps and institutional affiliations.

