Article

Cutting Force and Surface Roughness during Straight-Tooth Milling of Walnut Wood

1
Co-Innovation Center of Efficient Processing and Utilization of Forest Resources, Nanjing Forestry University, Nanjing 210037, China
2
College of Furnishings and Industrial Design, Nanjing Forestry University, Nanjing 210037, China
3
Wood Science and Engineering, Luleå University of Technology, 931 87 Skellefteå, Sweden
4
Mengtian Home Group Co., Ltd., Jiaxing 314100, China
5
College of Material Science and Engineering, Nanjing Forestry University, Nanjing 210037, China
6
Department of Wood and Forest Sciences, Laval University, Quebec City, QC G1V 0A6, Canada
*
Author to whom correspondence should be addressed.
These authors contributed equally to this work.
Forests 2022, 13(12), 2126; https://doi.org/10.3390/f13122126
Submission received: 26 November 2022 / Revised: 6 December 2022 / Accepted: 8 December 2022 / Published: 11 December 2022
(This article belongs to the Section Wood Science and Forest Products)

Abstract

:
Walnut (Juglans regia L.) is widely used in wood furnishings, and machinability is a key factor for improving product quality and enterprise benefits. This work focused on the influence of the rake angle, depth of cut, and cutting speed on the cutting force and machined surface roughness during the straight-tooth milling of walnut. On the basis of the experimental findings, a mathematical model was created using a response surface methodology to determine the relationship between the cutting force and the cutting conditions, as well as the relationship between the surface roughness and the cutting conditions. Variance analysis was used to study the significant contributions of the interactions of various factors and two-level interactions to the cutting force and surface roughness. The optimized combination of milling conditions, resulting in lowest cutting force and surface roughness, was determined to be a rake angle of 5°, a depth of cut of 0.6 mm, and a cutting speed of 45 m/s.

1. Introduction

Walnut (Juglans regia L.) is a diffuse porous hardwood [1]. Due to its favorable mechanical properties, machinability, and appearance [2,3], walnut has been widely used in furniture such as flooring, cabinets, doors, and windows [4,5,6]. In 2021, the total value of the walnut imported to China reached 259 million USD. With the high demand for machined walnut, improving the efficiency of the machining and the smoothness of the machined surface is key to improving the product quality and enterprise efficiency.
In the manufacturing of wood products, wood logs must undergo multiple machining processes. Material removal is the most commonly used process, e.g., milling, turning, and sawing [7]. Therefore, the material processing field has customarily focused on the machinability of wood, including the cutting force, surface quality, chip formation, power, etc. Lucic et al. [8] explored how the cutting depth and cutting speed impact the particle size distribution of the chips produced during walnut planing. When the feed speed is increased, the percentage of bigger chips produced goes up, while the percentage of smaller chips goes down. Lucic et al. [9] reported the changes in cutting power that occur during walnut planing. The findings indicated that the machining power of the radial planing plates was lower than that of the tangential plates and the semi-radial plates. Doumbia et al. [10] established a numerical model for the laser cutting of walnut veneer. They found that the kerf width decreased significantly with increased cut speed or laser output power. Çakıroğlu et al. [11] developed models using artificial neural networks with the purpose of enhancing the surface quality of walnut. Their research showed that a high spindle speed and low feed speed are conducive to reducing the roughness of the machined surface, and the following optimal cutting parameters were determined: a tool diameter of 3 mm, a spindle speed of 18,000 rpm, and a feed rate of 3.8 m/min. They also found that the surface roughness increased with a greater milling depth.
Based on the field research in walnut industrial machining, high energy consumption and poor product quality have always been the critical problems that must be solved by enterprises. Cutting force is a key parameter in evaluating energy consumption, and surface smoothness is a crucial factor in determining the quality of the final product [12,13,14]. Thence, clarifying the impact of the cutting parameters on the cutting force and quality, and optimizing the cutting conditions, are important approaches to improving walnut machinability. There are many methods for the optimization of the cutting parameters, including response surface methodology (RSM), the genetic algorithm, and the neural network. RSM is a statistical method widely used for result prediction and parameter optimization, and regression models can be developed using RSM to determine the relationship between input variables and output results. To improve energy efficiency in the milling process, Zhu et al. [15] built a mathematical model using RSM to explore the relationship between energy efficiency and milling conditions. Meanwhile, Li et al. [16] used RSM to investigate the influence of input parameters on the comparative cutting energy in the process of the spiral milling of medium density fiberboard. These studies all demonstrated that the RSM model can be used for parameter optimization and result prediction.
The objective of this study was to characterize the machinability of walnut with straight-tooth cylindrical cutters. To this end, we determined the changes in cutting forces and surface quality for different milling conditions, i.e., rake angle, depth of cut, and cutting speed, supported by RSM. This research was intended to provide a theoretical foundation for the industrial machining of walnut.

2. Materials and Methods

2.1. Materials and Testing Equipment

The up-milling was conducted in a commercial computerized numerical control (CNC) machining center (MGK01, Nanxing Machinery Co., Ltd., Guangzhou, China) under dry conditions. The walnut wood (Table 1, Shanghai Yida Wood Co., Ltd., Shanghai, China) was machined by diamond cutting tools with constant diameters of 140 mm (Table 2, Leuco Precision Tooling Co., Ltd., Suzhou, China), and the cutting direction was parallel to the fiber direction of the walnut. The cutting forces produced during milling, denoted by Fx and Fy, were measured by a three-component piezoelectric dynamometer (9257B, Kistler Group, Winterthur, Switzerland) with a measuring range of −5.0 to ~ +5.0 kN and a charge amplifier (5070A, Kistler Group, Winterthur, Switzerland) with a sampling rate of 7100 Hz. The dynamic cutting force values were processed and analyzed using Dynoware software (2825D-02, Kistler Group, Winterthur, Switzerland). To better understand how the cutting force varies depending on the various conditions, the resultant force was adopted and calculated by Equation (1) [17].
F R = F x 2 + F y 2
where FR denotes the resultant force in N, and Fx and Fy are the component forces parallel and perpendicular to the feeding direction in N, respectively.
The surface roughness, Ra, was taken as the evaluation index for the smoothness of the machined surface, which was measured by using a surface profiler (S-NEX001SD-12, Tokyo Seimitsu Co., Ltd., Tokyo, Japan).

2.2. Materials and Testing Equipment

In this work, RSM was used to analyze the influence of various factors on the experimental outcomes by using Design-Expert software (Version 12, Stat-Ease Inc., USA. Minneapolis, MN, USA). As shown in Table 3, the ranges of the cutting parameters were selected based on walnut industrial machining, and the rake angle, depth of cut, and cutting speed were defined as γ, h, and vc, respectively. The level of each experimental variable was coded as −1, 0, or 1. A three-level factorial design by RSM is given in Table 4.
To accurately explore the influence of cutting on the surface roughness and the resultant force, the quadratic mathematical regression shown in Equation (2) [18] was used to establish the relationship between the results and the cutting conditions:
Y = b 0 + i k b i x i + i = 1 k 1 j = i + 1 k b i j x i x j + i = 1 k b i i x i 2
where Y is the experimental output of the resultant force in N and the surface roughness in μm, b0 is the free term, bi, bij, and bii are the term coefficients, and x is the dependent variable of the rake angle in degrees, the depth of cut in mm, and the cutting speed in m/s.

3. Results and Discussion

3.1. Subsection

Equation (3) shows an RSM model of the resultant cutting force based on the experimental results from Table 4 as follows:
F R = 72.37 8.17 γ + 6.38 h 1.39 v c + 2.04 γ h 2.43 γ v c + 2.09 h v c 3.94 γ 2 0.47 h 2 0.55 v c 2
where FR is the resultant cutting force in N, γ is the rake angle of cutting tool in degrees, h is the depth of cut in mm, and vc is the cutting speed in m/min.
Table 5 displays the fit statistics for the cutting force model. The values of R2, adjusted R2, and predicted R2 are near to one. Moreover, the difference between predicted R2 and adjusted R2 values is less than 0.2, indicating that the cutting force model has high accuracy [19]. In addition, the standard deviation and coefficient of variation percentage values were 2.62 and 3.8, suggesting a low relative dispersion of data points from the mean, further proving that the model fit well. The Adequate Precision measures the signal-to-noise ratio and has a value greater than four, which indicates the model can accurately predict observed or real values [20].
Figure 1 illustrates the correlation between the actual and predicted values of the resultant cutting force. It shows that the developed model has high accuracy with no observed outliers, and that it can therefore be used to predict the resultant force and optimize the cutting conditions [21].

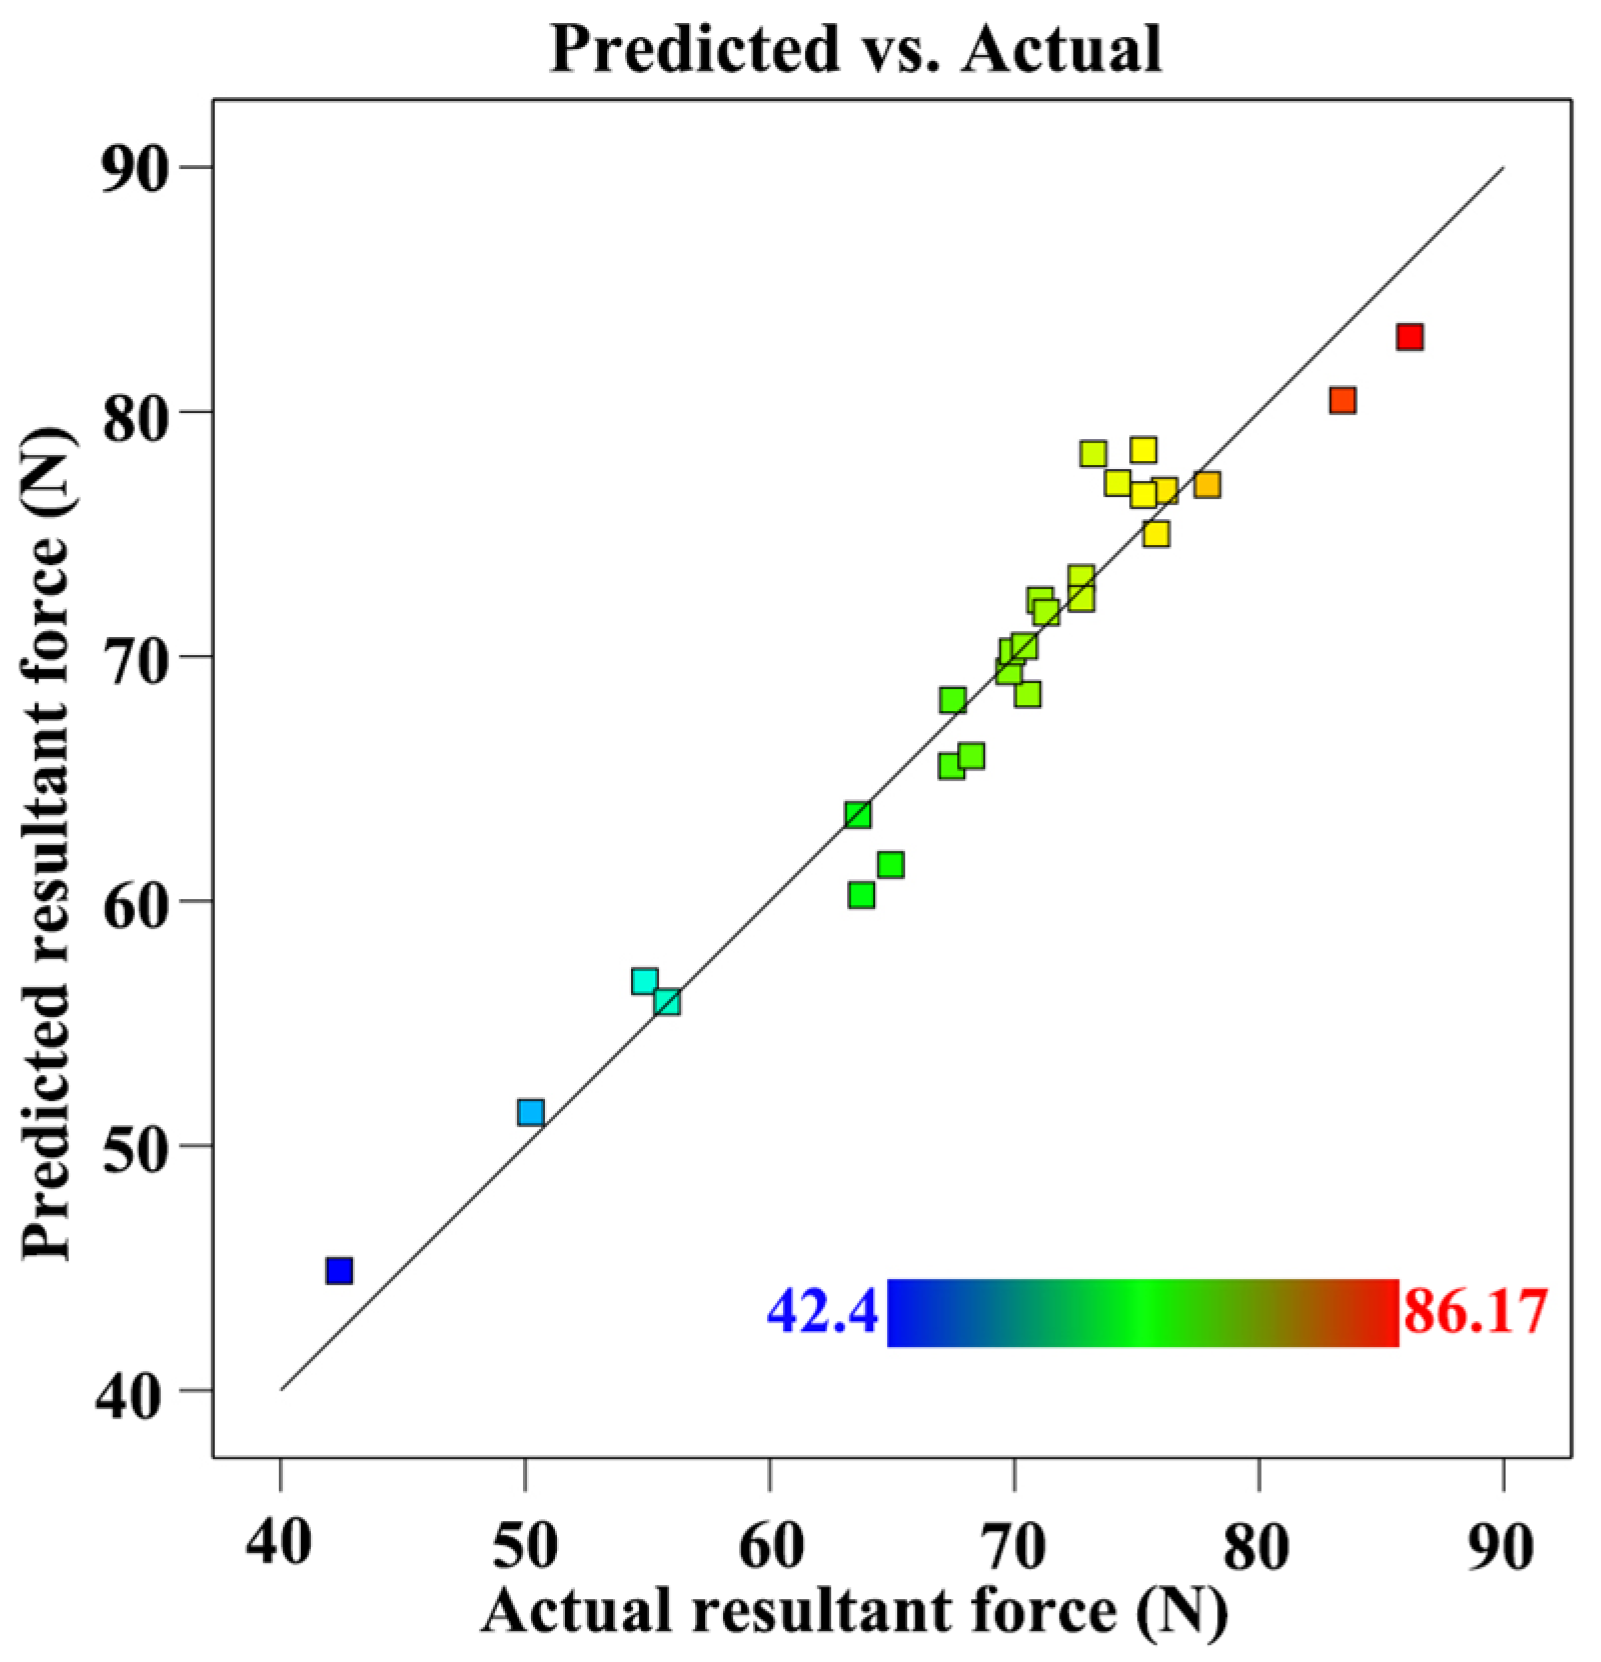
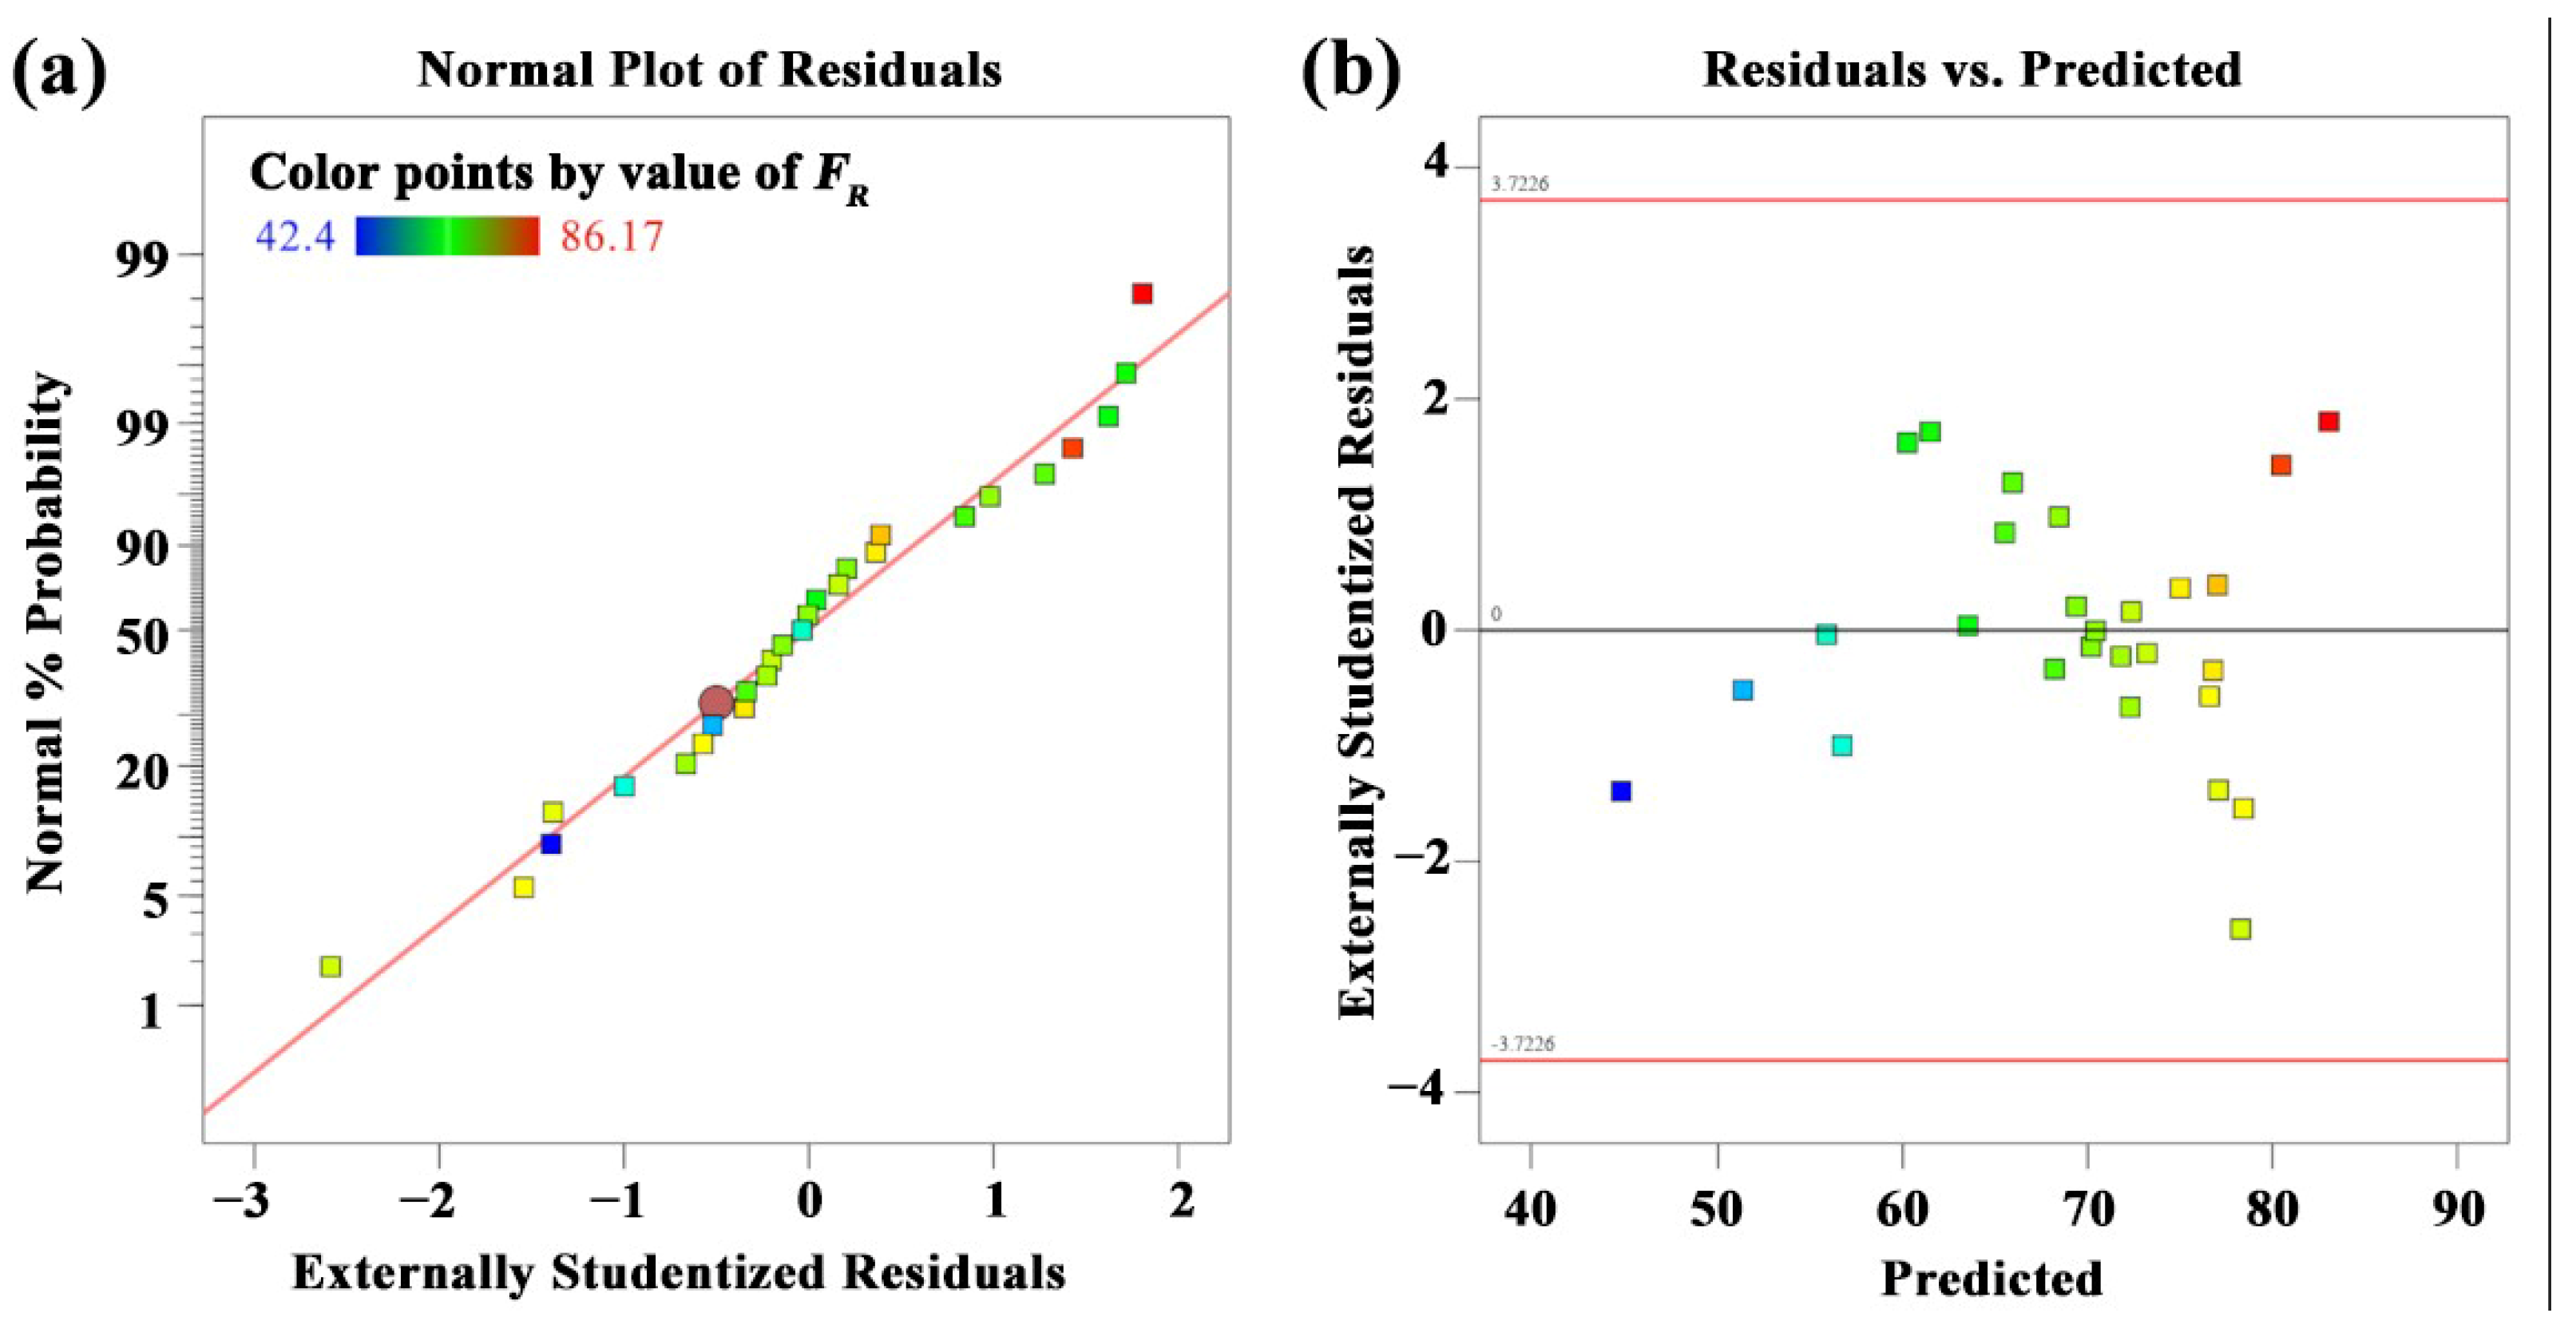
3.2. Analysis of Variance for Resultant Force

The primary assumption for conducting a one-way analysis of variance (ANOVA) is normality. ANOVA assumes that the data are normally distributed. Therefore, the normal distribution of resultant force is checked via scatterplots, as shown in Figure 2. Figure 2a shows that results of resultant force are concentrated in the set range, indicating that the data have the characteristics of a normal distribution. Furthermore, Figure 2b reveals that the prediction data correspond to the residual in a scattered and irregular manner. As a result, ANOVA can be used for further analysis.
Table 6 provides the ANOVA results for the resultant force with a 5% (or 0.05) significance level. According to Valarmathi et al. [22], if the p-value is less than 0.05, the model is significant; otherwise, it is insignificant. The findings suggest that the resultant force model is significant, as the p-value is less than 0.05 (F = 36.18, p < 0.05). They imply a 0.01 percent probability that an F-value this large could occur due to noise. Furthermore, the rake angle (γ), depth of cut (h), cutting speed (vc), two-level interactions of γ × h, γ × h, and h × vc, and products of γ2 have a statistically significant effect on the resultant force, as their p-values are less than the 0.05 significance level. However, the products of h2 and vc2 make an insignificant contribution to the resultant force.
In Table 6, % Cont refers to the percentage of the source sum of squares relative to the total sum of squares. A higher % Cont value means a greater impact on the results. The % Cont value of γ is 51.01, indicating that it has the greatest influence on the resultant cutting force, followed by h with a value of 31.11 and vc with a value of 1.48.
Figure 3 represents the 3D response surface maps and contour maps for the various interactions of cutting conditions with the resultant force. According to the density of the contour map, the resultant force is mainly impacted by the rake angle in the interaction of rake angle and depth of cut (Figure 3a), and the rake angle in the interaction of rake angle and cutting speed (Figure 3b), whereas, the cutting force is primarily affected by the depth of cut in the interaction of cutting speed and depth of cut (Figure 3c).

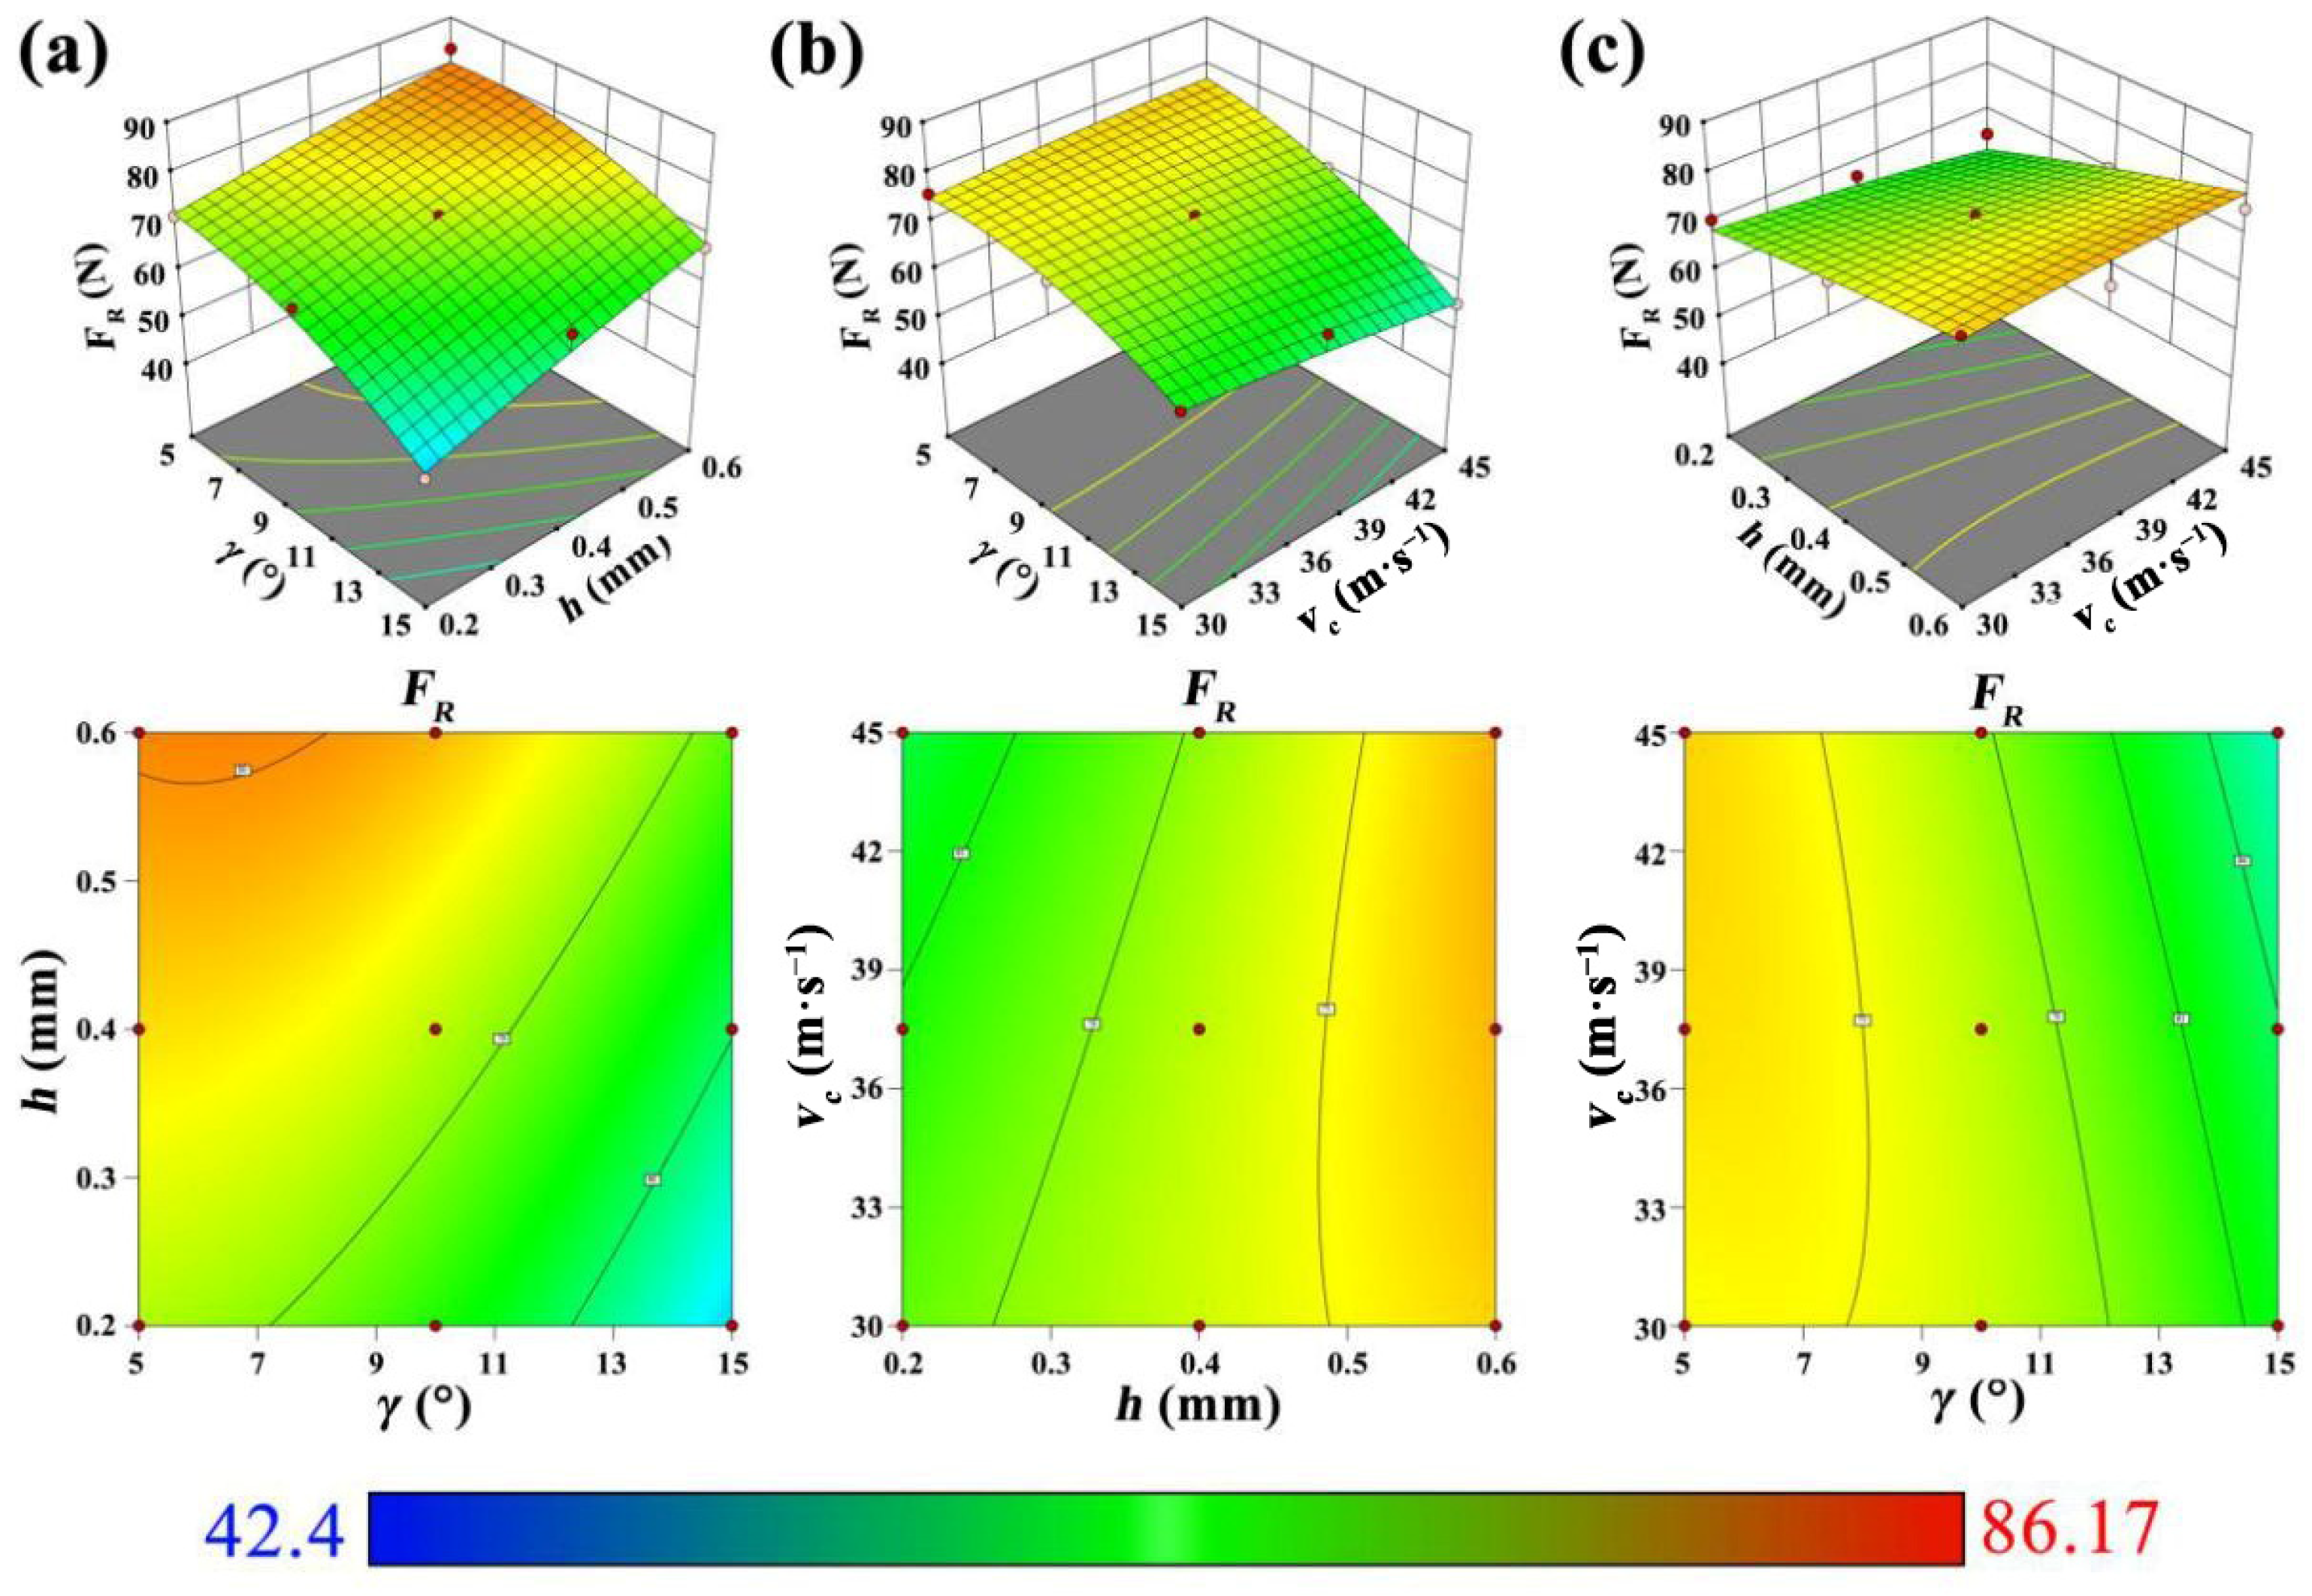
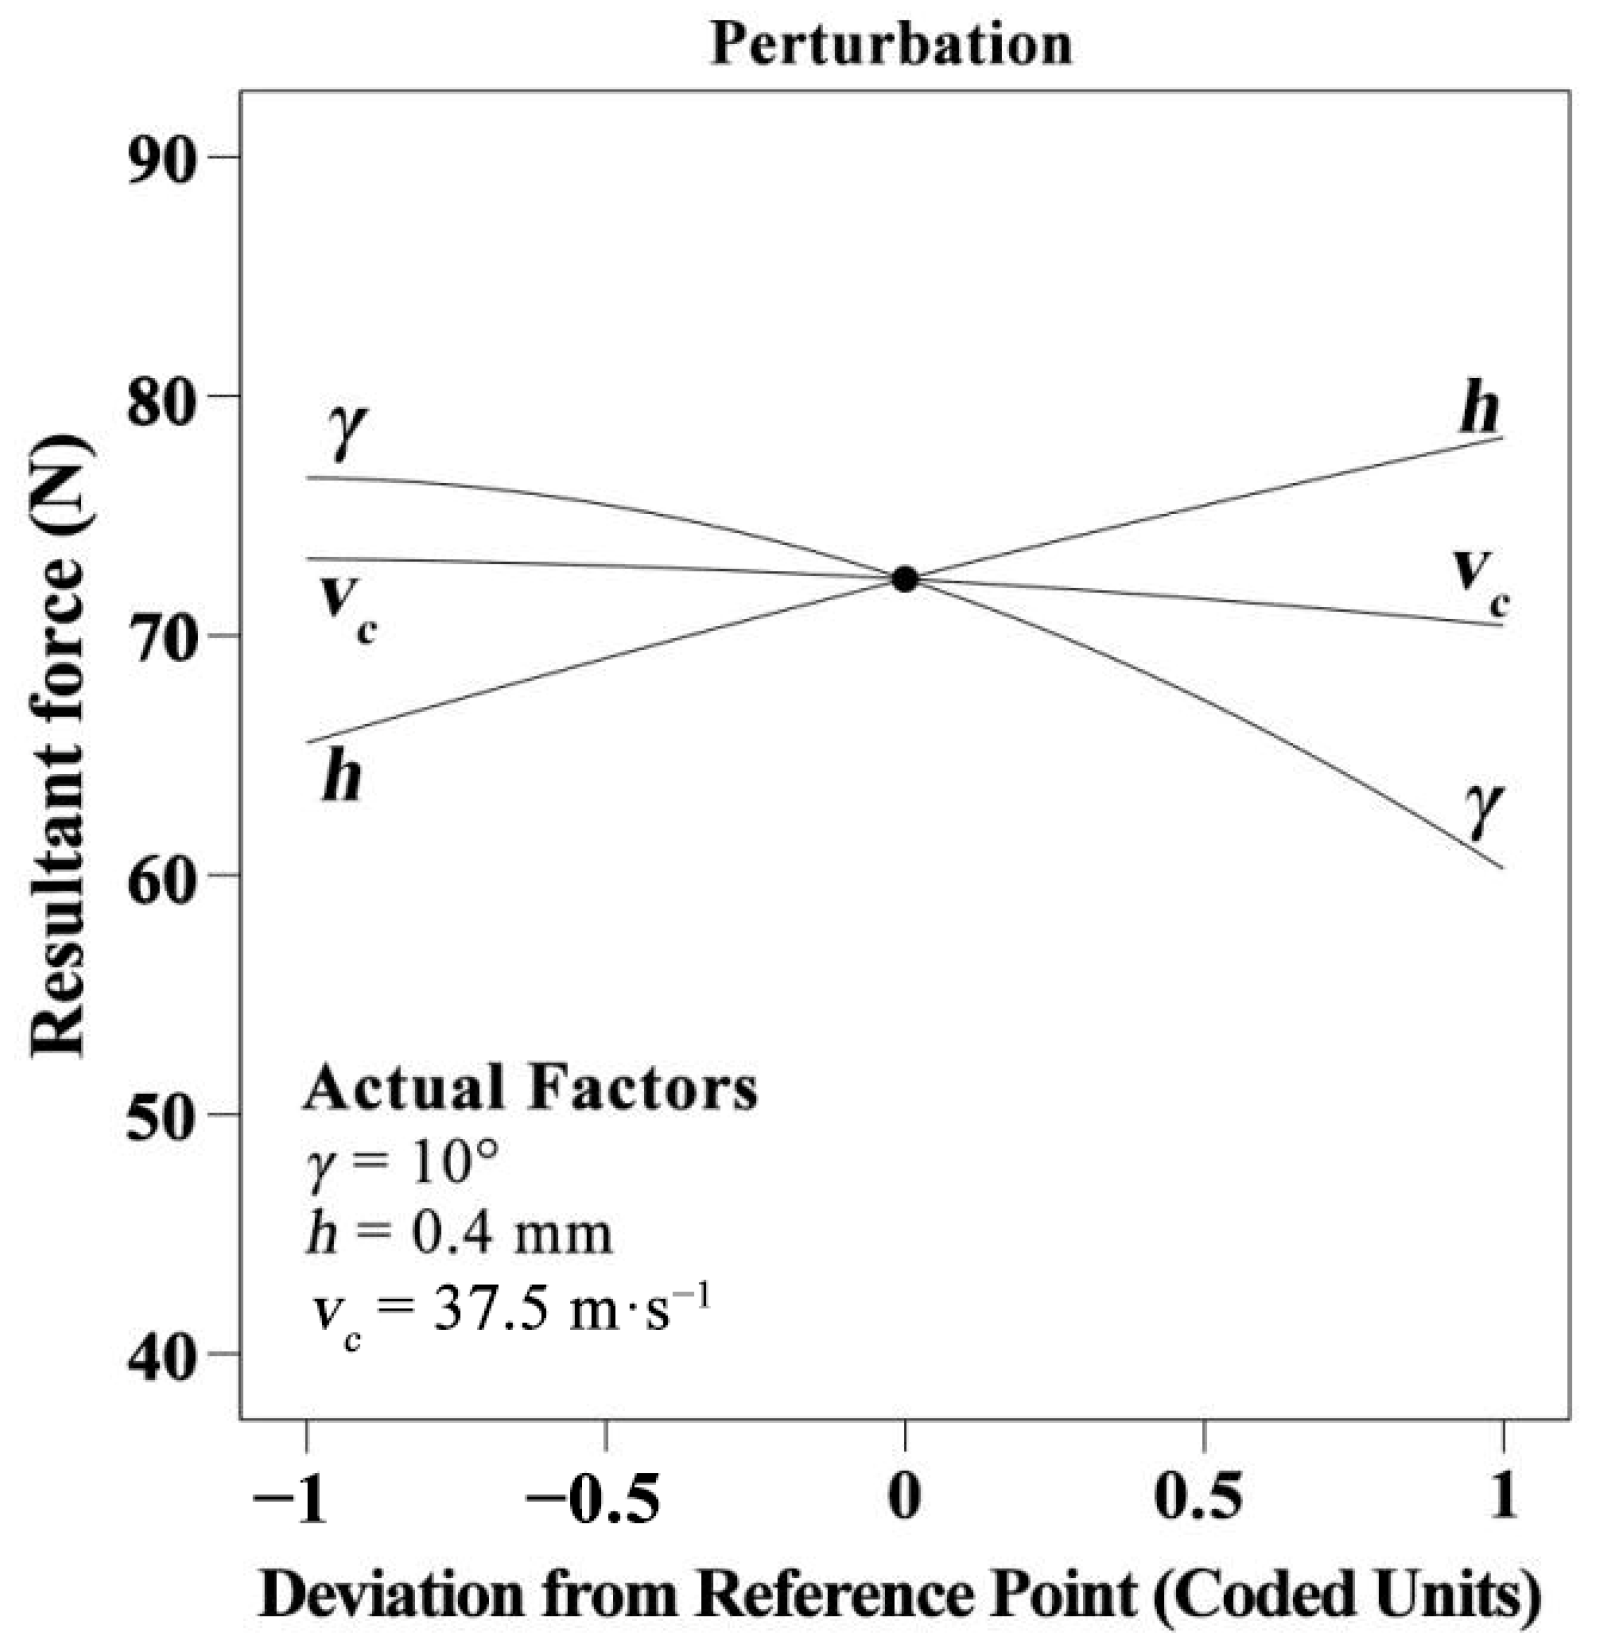
3.3. Influence of Cutting Variables on the Resultant Force

Figure 4 shows the impact of cutting parameters on the resultant force, revealing that there is a negative correlation between the resultant force and the cutting speed and rake angle, but a positive correlation with depth of cut. It means that an increase in the rake angle in straight-tooth cylindrical milling allows it to cut off wood fiber more easily, with the sharper cutting edge leading to a low resultant force. Meanwhile, the changes in the resultant force were determined by the quantity of material removed. With an increase in cutting speed and a reduction in depth of cut, a lower quantity of material will be removed by the cutter. Hence, the resultant force shows an increasing trend with the decrease of the cutting speed and the increase of the depth of cut.

3.4. Regression Model of Surface Roughness

Equation (4) shows a regression model for determining the relationship between the input variables and output results of surface roughness:
R a = 8.17 1.56 γ + 0.82 h 0.17 v c 0.33 γ h + 1.04 γ v c + 0.21 h v c 0.75 γ 2 + 0.07 h 2 + 0.008 v c 2
where Ra is the surface roughness in μm, γ is the rake angle of cutting tool in °, h is the depth of cut in mm, and vc is the cutting speed in m/min.
Table 7 displays the fit statistics of the surface roughness model. The values of R2, adjusted R2, and predicted R2 are near to one. Meanwhile, as the difference between predicted R2 and adjusted R2 values is less than 0.2, it can be deduced that the surface roughness model has reasonable accuracy. Moreover, the Std. Dev. and C.V.% values are 0.50 and 6.46, suggesting a low relative dispersion of data points from the mean, further proving that the model fit well. The Adequate Precision has a value greater than four, which indicates the model can accurately predict the observed values. Finally, Figure 5 shows the correlation between the actual and predicted values of the surface roughness. It reveals that the developed model has high accuracy with no observed outliers, and that it can be utilized to make accurate surface roughness predictions and optimize cutting parameters [21].

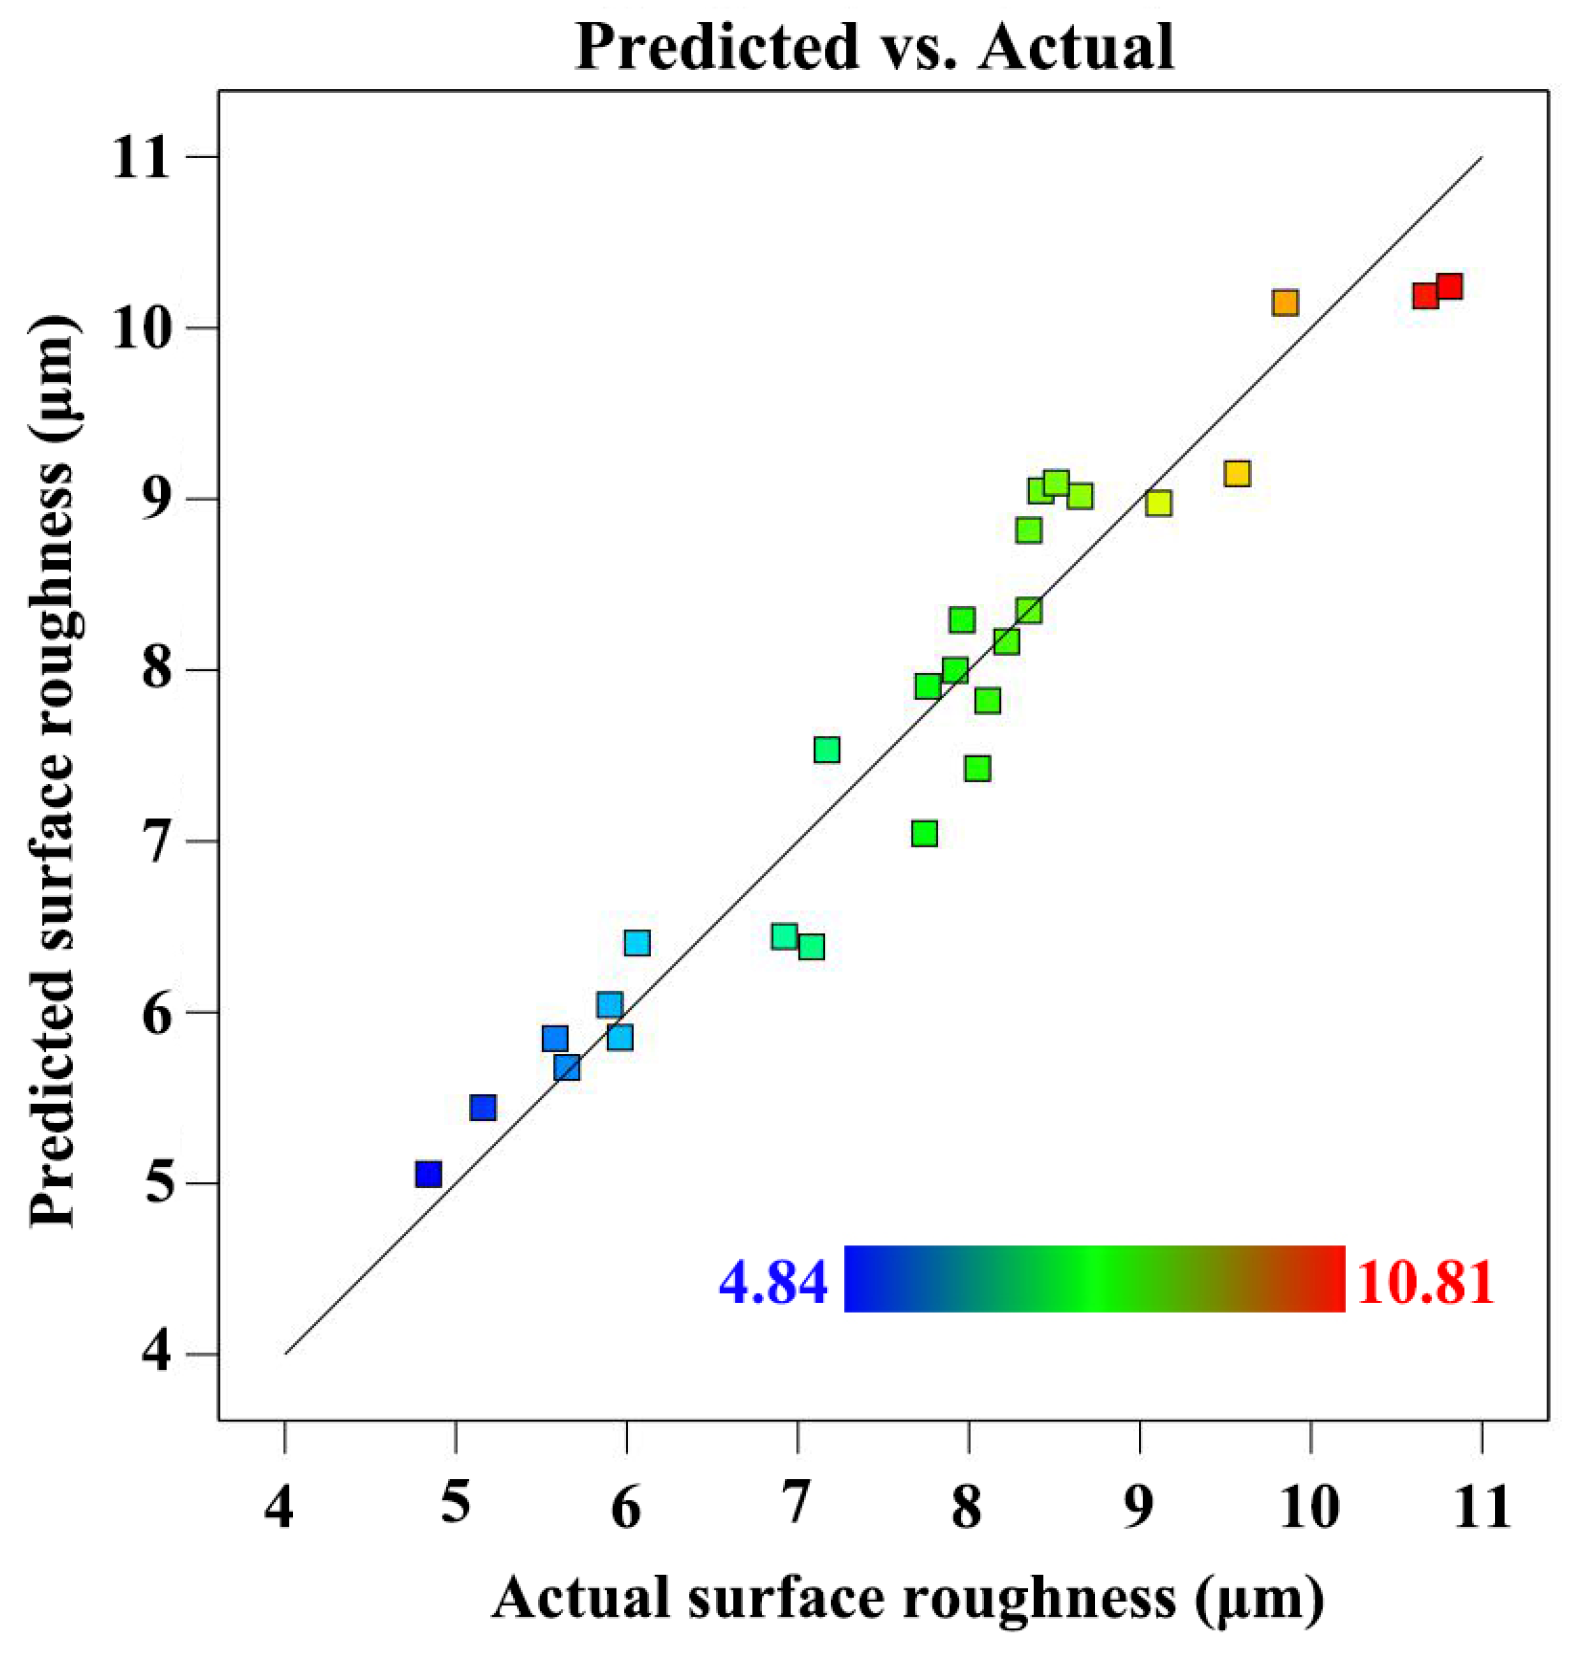
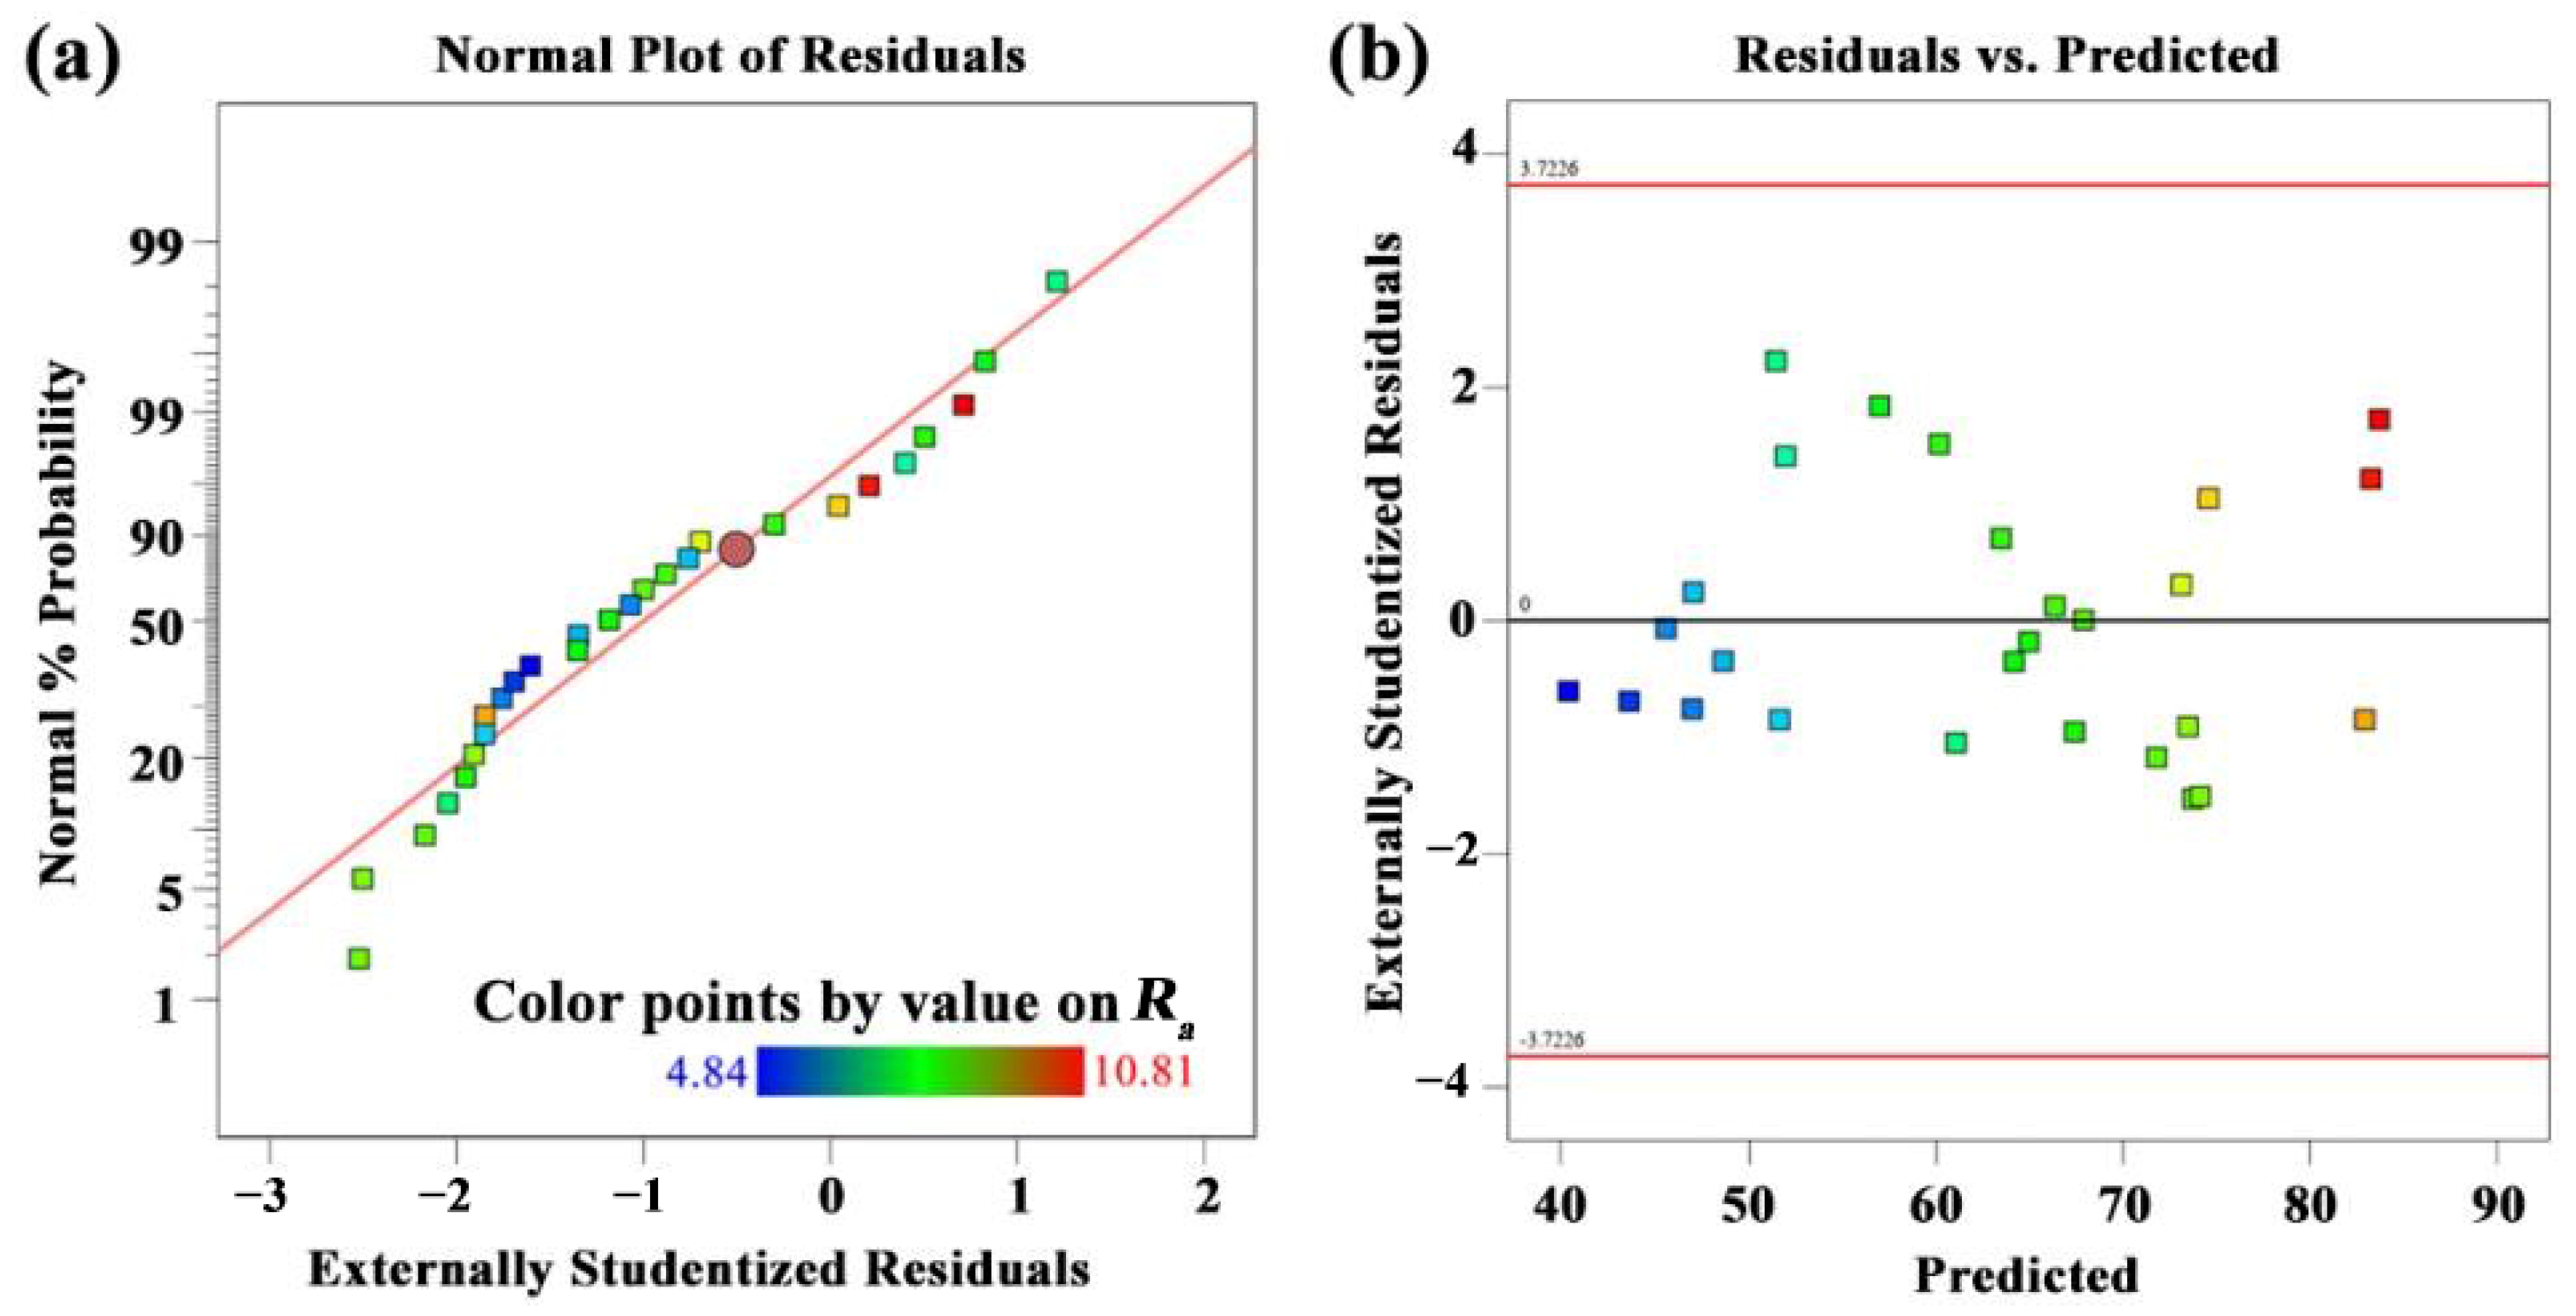
3.5. Regression Model of Surface Roughness

Figure 6a shows that the effective data points for surface roughness are concentrated within the setting range, indicating that the data have the characteristics of a normal distribution. In addition, Figure 6b shows that the distribution of the residual and predicted values of the surface roughness is irregular, thereby proving that the model has a good fit and that the regression model can be used to predict the surface roughness of the finished work.
Table 8 provides ANOVA results for surface roughness with a 5% (or 0.05) significance level. The findings suggest that the surface roughness model is significant, as the p-value is less than 0.05 (F = 27.55, p < 0.05). It implies a 0.01 percent chance that an F-value this large could occur due to noise. Furthermore, the rake angle (γ), the cutting speed (vc), the two-level interactions of γ × h, and the products of γ2 have a statistically significant effect on the surface roughness, as their p-values are less than the 0.05 significance level. However, the depth of cut (h), the two-level interactions of γ × vc and h × vc, and the products of h2 and vc2 make insignificant contributions to the surface roughness [23]. The % Cont value of γ is 66.71, indicating that it has the greatest influence on the surface roughness, followed by h with a value of 18.01 and vc with a value of 0.83.
Figure 7 shows the 3D response surface maps and contour maps displaying the interactions of various cutting conditions with the surface roughness. Based on the density of the 3D surface maps and contour maps, it can be seen that the rake angle of the milling cutter is responsible the most significant portion of the influence on the milled products’ surface roughness in the interaction of the rake angle and the depth of cut (Figure 7a), and in the interaction of rake angle and cutting speed (Figure 7b); whereas, the surface roughness is mainly affected by the depth of cut in the interaction of the cutting speed and the depth of cut (Figure 7c).

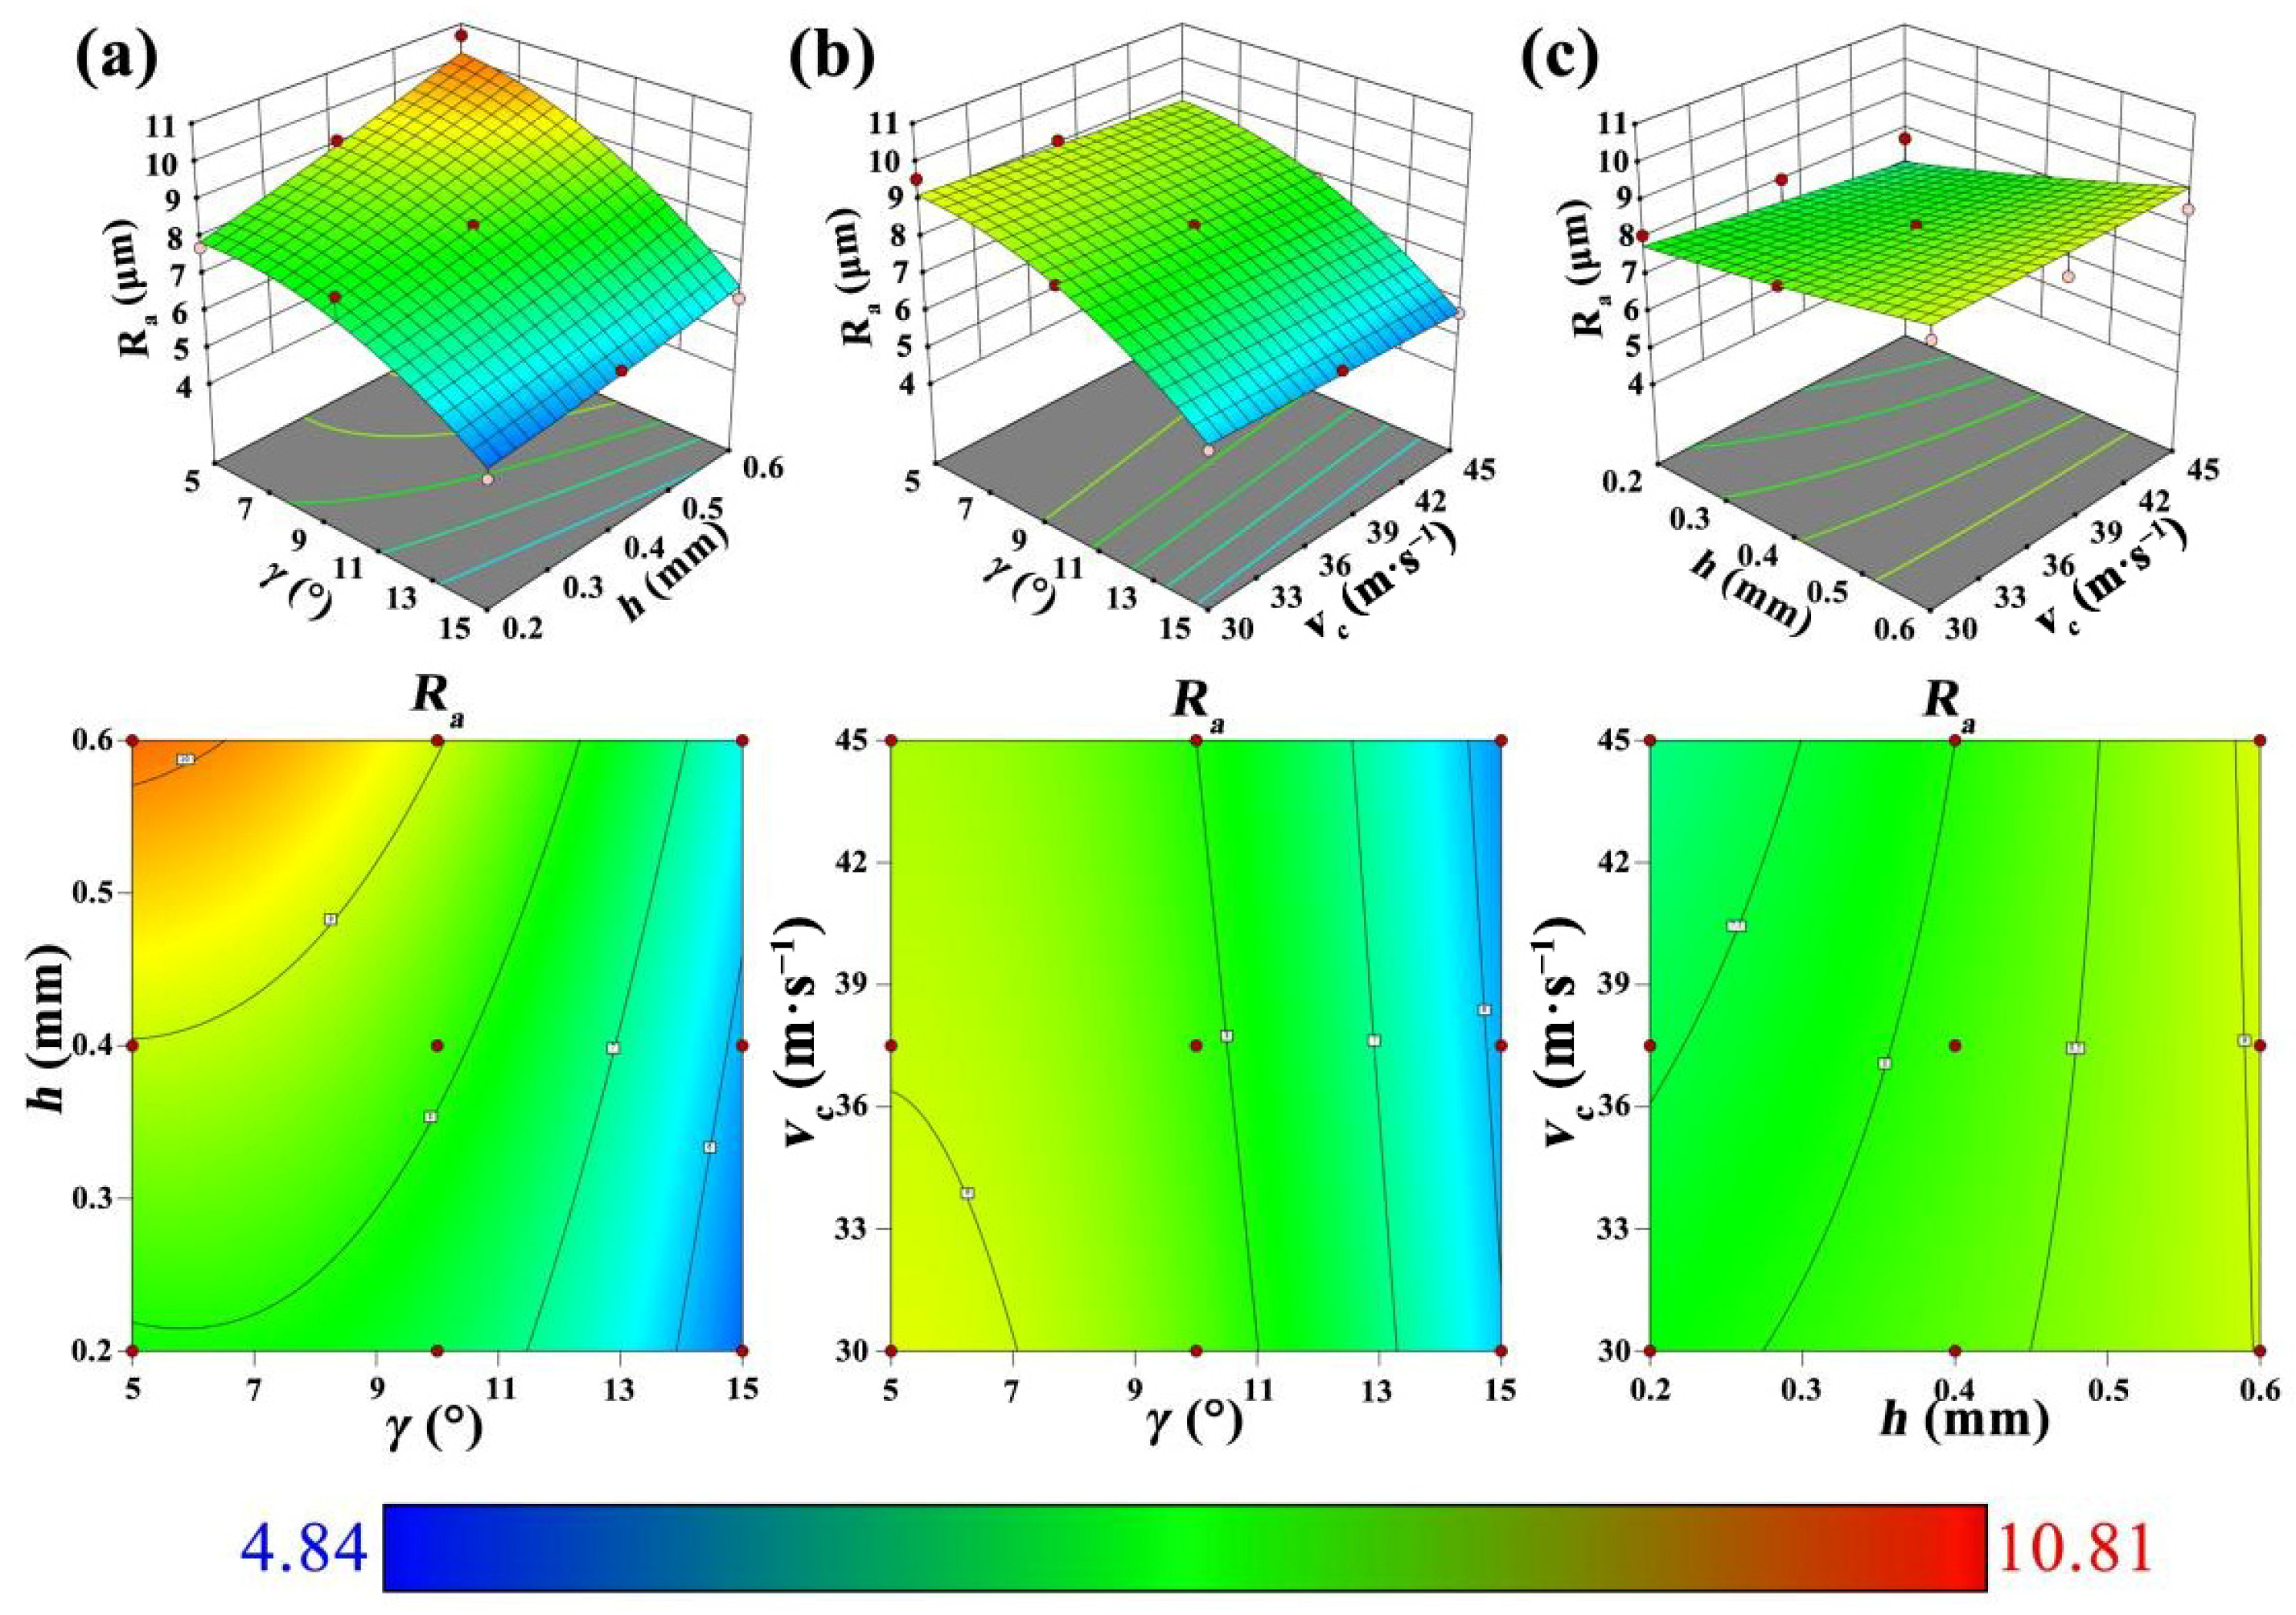
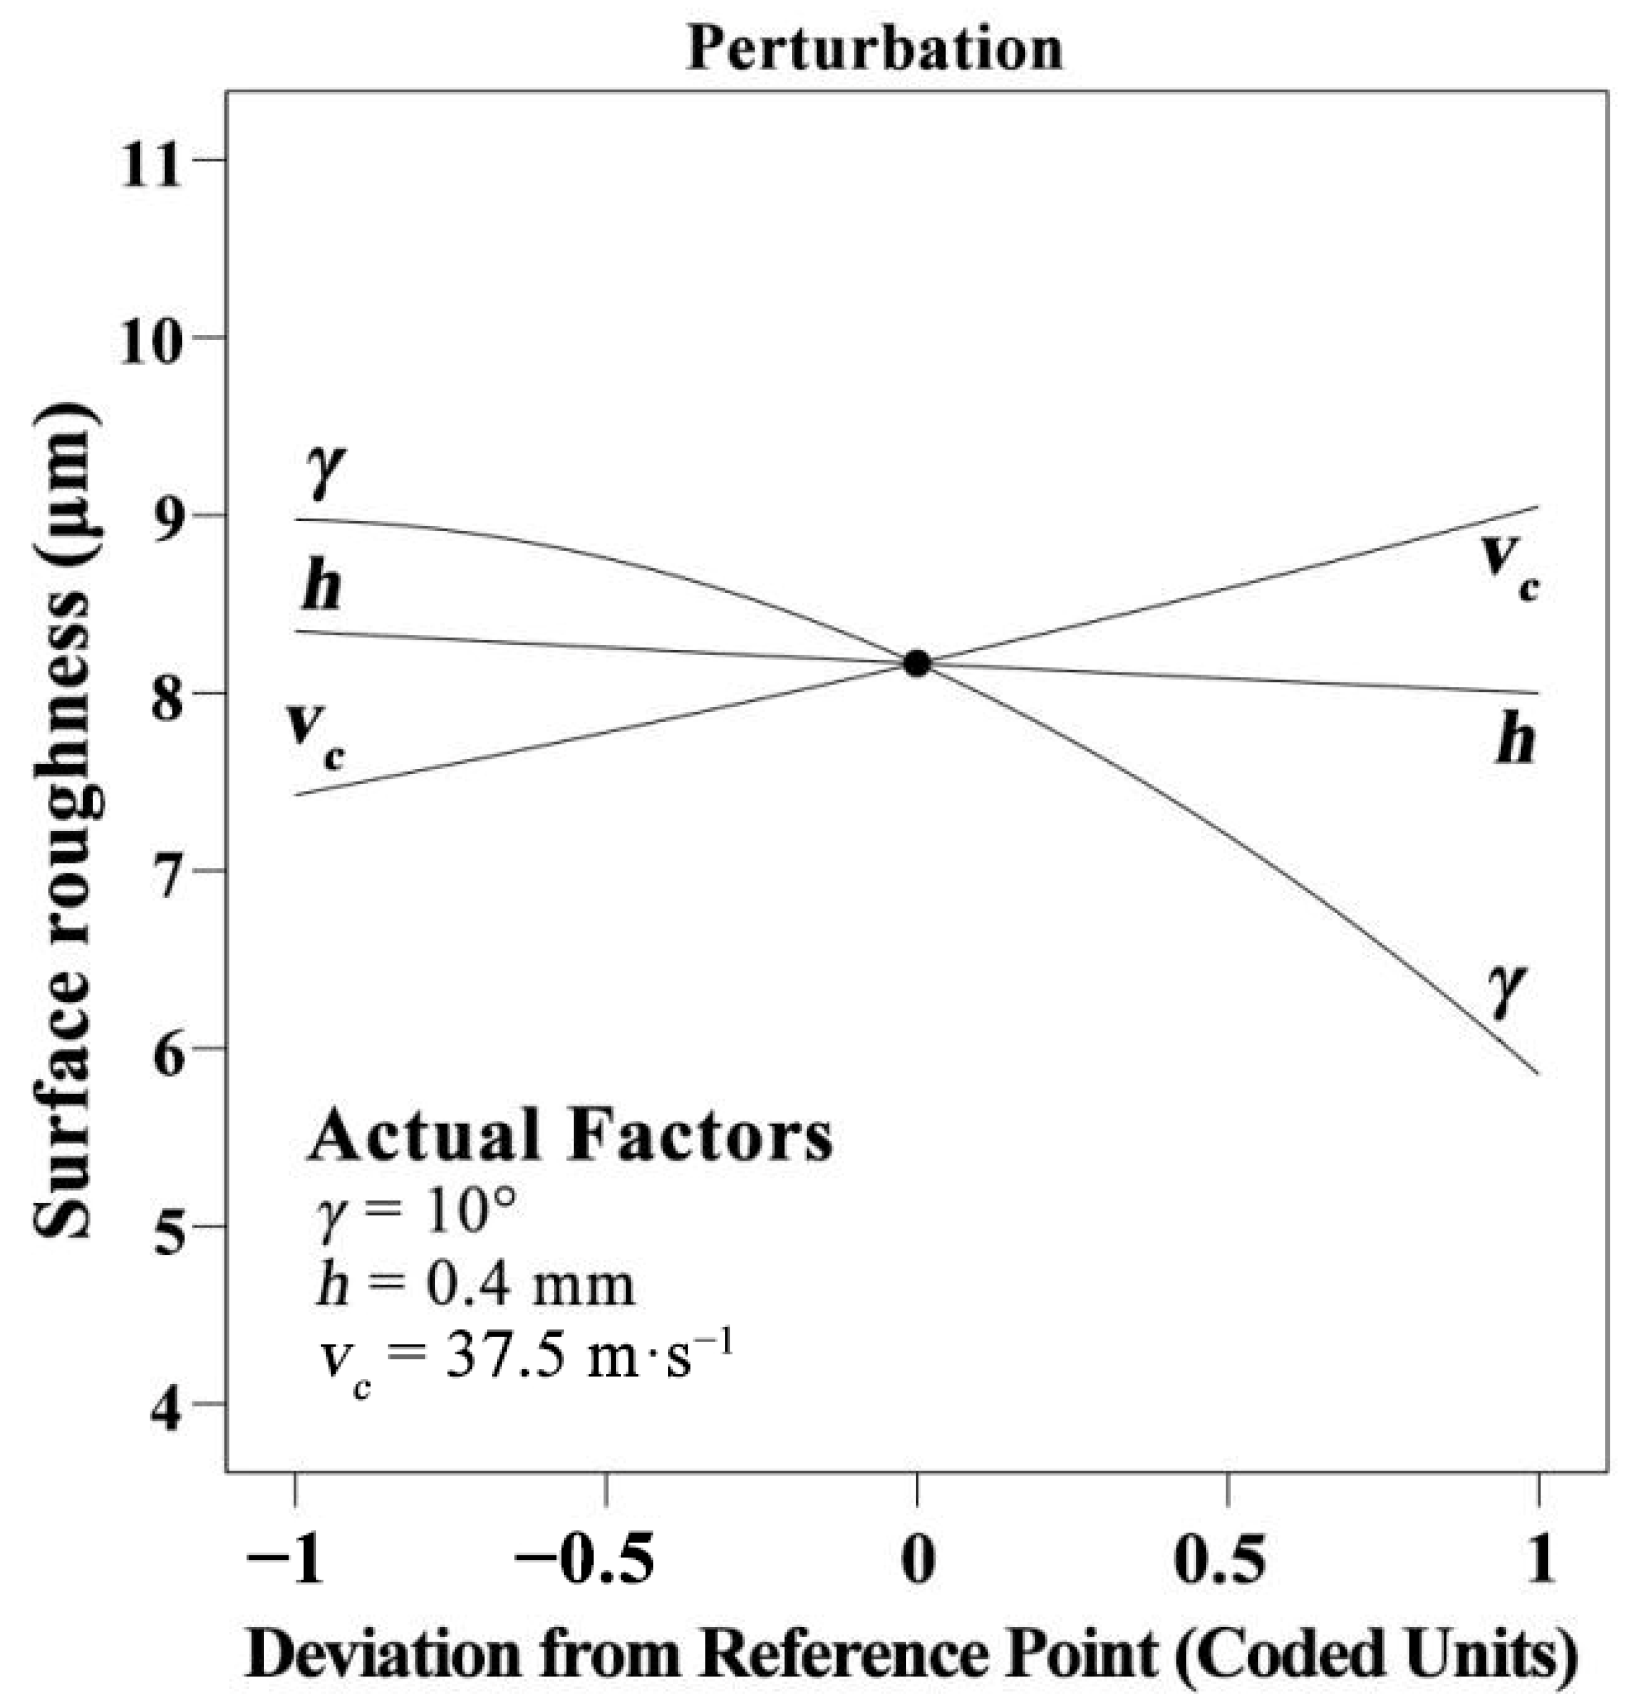
3.6. Influence of Cutting Variables on Surface Roughness

Figure 8 depicts the impact of the cutting parameters on the surface roughness. The results indicate a negative correlation between the surface roughness and the cutting speed and rake angle, but a positive correlation with the depth of cut. This indicates that, with an increase in the rake angle, the sharper rake angle reduces the chip deformation and damage on the machined face to improve the final surface quality. With the rise in the cutting speed and the decrease in the depth of cut, a smaller removal volume improves the cutting stability, with respect to lower resistance. Hence, the surface roughness shows an increasing trend with the decrease of the cutting speed and the increase of the depth of cut.

3.7. Optimization of Cutting Conditions and Verification

According to related research, cutting force is the key factor affecting energy consumption and tool wear, and surface roughness is the crucial parameter determining the quality of the final products [24,25]. Meanwhile, in industrial walnut processing, manufacturers work to improve the material removal rate with a greater depth of cut to achieve higher machining efficiency. Therefore, for the sake of improving the enterprise benefits and product quality, it is suggested that the ideal cutting condition for walnut milling is to produce the minimum cutting force and minimum surface roughness at the greatest depth of cut possible.
The optimal cutting conditions for the predicted points determined by RSM are denoted by red dots as follows: a 15° rake angle, 45 m/s cutting speed, and 0.2 mm cutting depth. The results for the resultant force and surface roughness at the optimal cutting conditions are shown in Table 9. The resultant force (FR) and surface roughness (Ra) were 42.4 N and 4.84 μm, close to the predicted values of 44.6 N and 5.11 μm, with error rates of 5.2% and 5.6% at the optimal conditions for the milling of walnut. Hence, it is concluded that the created models can be used to guide the selection of an optimal cutting condition considering the machining efficiency and production costs.

4. Conclusions

In this paper, the resultant force and surface roughness were analyzed by RSM during the straight-tooth milling of walnut. The main conclusions are given as follows:
(1)
Both the resultant force and the surface roughness have similar tendencies at different milling conditions. They were all positively related to the depth of cut and negatively correlated with the cutting speed and the tool rake angle.
(2)
Two regression models with high accuracy were developed, which can be used for the prediction of the resultant force and the surface roughness, and for the optimization of the cutting conditions.
(3)
Both the cutting tool rake angle and the depth of cut had significant effects on the resultant force and surface roughness, while the cutting speed only made a significant contribution to the resultant force. Meanwhile, the rake angle of the cutting tool made the greatest contribution to both the resultant force and the surface roughness, followed by the depth of cut and the cutting speed.
(4)
The optimal condition, with minimum resultant force, minimum surface roughness, and the highest machining efficiency, was determined to be a rake angle of 15°, cutting speed of 45 m/s, and depth of cut of 0.2 mm. These parameters are suggested for the industrial manufacturing of walnut, for maximum product quality and enterprise benefits.

Author Contributions

Conceptualization, Z.Z., S.J., D.B. and Z.W.; methodology, X.W., Z.Z. and D.B.; software, Z.W.; validation, Z.Z., S.J., D.B. and Z.W.; formal analysis, D.B.; investigation, Q.T. and J.G.; resources, X.W. and Z.Z.; data curation, S.J.; writing—original draft preparation, S.J. and Z.W.; writing—review and editing, Z.Z. and D.B.; visualization, Z.W.; supervision, X.G. and D.B.; project administration, X.G.; funding acquisition, Z.Z. All authors have read and agreed to the published version of the manuscript.

Funding

This research was supported by the National Natural Science Foundation of China [grant number 31971594], the Natural Science Foundation of the Jiangsu Higher Education Institutions of China [21KJB220009], the Self-Made Experimental and Teaching Instruments of Nanjing Forestry University in 2021 [nlzzyq202101], the project from Technology Innovation Alliance of Wood/Bamboo Industry [TIAWBI2021-08], Qing Lan Project, and the International Cooperation Joint Laboratory for Production, Education, Research and Application of Ecological Health Care on Home Furnishing.

Data Availability Statement

Not applicable.

Conflicts of Interest

The authors declare no conflict of interest.

References

  1. Voulgaridis, V.; Vassilios, V.G. The walnut wood and its utilisation to high value products. Acta Hortic. 2004, 705, 69–81. [Google Scholar] [CrossRef]
  2. Zhang, X.; Yu, J.; Zhao, J.; Fang, L. Overlaying performance and bonding mechanism of wood-based panels decorated by EVA film reinforced decorative wood veneer. Wood Mater. Sci. Eng. 2022, 1–9. [Google Scholar] [CrossRef]
  3. Zhou, C.; Huang, T.; Luo, X.; Kaner, J.; Fu, X. Cluster analysis of kitchen cabinet operation posture based on OpenPose technology. Int. J. Ind. Ergon. 2022, 91, 103352. [Google Scholar] [CrossRef]
  4. Stevens, M.E.; Pijut, P.M. Rapid in vitro shoot multiplication of the recalcitrant species Juglans nigra L. Vitr. Cell. Dev. Biol. Plant 2005, 54, 309–317. [Google Scholar] [CrossRef]
  5. Chen, B.; Yu, X.; Hu, W. Experimental and numerical studies on the cantilevered leg joint and its reinforced version commonly used in modern wood furniture. BioResources 2022, 17, 3952. [Google Scholar] [CrossRef]
  6. Jafarian, H.; Demers, C.M.; Blanchet, P.; Laundry, V. Effects of interior wood finishes on the lighting ambiance and materiality of architectural spaces. Indoor Built Environ. 2018, 27, 786–804. [Google Scholar] [CrossRef]
  7. Wu, S.; Xu, W. Effects of Low-Energy-Density Microwave Treatment on Graphene/Polyvinyl Alcohol-Modified Poplar Veneer. Forests 2022, 13, 210. [Google Scholar] [CrossRef]
  8. Çakıroğlu, E.O.; Demir, A.; Aydın, İ.; Büyüksarı, Ü. Prediction of Optimum CNC Cutting Conditions Using Artificial Neural Network Models for the Best Wood Surface Quality, Low Energy Consumption, and Time Savings. Bioresource 2022, 17, 2501–2524. [Google Scholar] [CrossRef]
  9. Lučić, R.B.; Čavlović, A.; Ištvanić, J.; Ðukić, I.; Mihulja, G. Power requirements during wood planing and surface quality of planed elements. In Proceedings of the 2nd International Scientific Conference on Woodworking Technique, Zalesina, Croatia, 11–15 September 2007. [Google Scholar]
  10. Doumbia, B.S.; Yang, C.; Ma, Y.; Jiang, T.; Li, X.; Yu, W.J. Analysis of Neodymium-Doped Yttrium-Aluminum-Garnet Laser and Experimental Prospects for Cutting Micro-Thin Black Walnut Veneers in Industry. Bioresource 2021, 16, 2416–2432. [Google Scholar] [CrossRef]
  11. Azemović, E.; Horman, I.; Busuladžić, I. Impact of planing treatment regime on solid fir wood surface. Procedia Eng. 2014, 69, 1490–1498. [Google Scholar] [CrossRef]
  12. Zerti, A.; Yallese, M.A.; Meddour, I.; Belhadi, S.; Haddad, A.; Mabrouki, T. Modeling and multi-objective optimization for minimizing surface roughness, cutting force, and power, and maximizing productivity for tempered stainless steel AISI 420 in turning operations. Int. J. Adv. Manuf. Tech. 2019, 102, 135–157. [Google Scholar] [CrossRef]
  13. Liu, Y.; Zhou, J.; Fu, W.; Zhang, B.; Chang, F.H.; Jiang, P.F. The effect of bamboo surface roughness of cutting parameters on the bamboo milling. Bioresources 2020, 15, 8323–8338. [Google Scholar] [CrossRef]
  14. Kıvak, T. Optimization of surface roughness and flank wear using the Taguchi method in milling of Hadfield steel with PVD and CVD coated inserts. Measurement 2014, 50, 19–28. [Google Scholar] [CrossRef]
  15. Zhu, Z.L.; Buck, D.; Guo, X.L.; Xiong, X.Q.; Xu, W.; Cao, P.X. Energy Efficiency Optimization for Machining of Wood Plastic Composite. Machines 2022, 10, 104. [Google Scholar] [CrossRef]
  16. Li, R.R.; He, C.J.; Xu, W.; Wang, X.D. Modeling and optimizing the specific cutting energy of medium density fiberboard during the helical up-milling process. Wood Mater. Sci. Eng. 2022, 1–8. [Google Scholar] [CrossRef]
  17. Cao, P.X.; Zhu, Z.L.; Guo, X.L.; Wang, X.D.; Fu, C.C.; Zhang, C. Cutting force and cutting quality during tapered milling of glass magnesium board. Appl. Sci. 2019, 9, 2533. [Google Scholar] [CrossRef] [Green Version]
  18. Li, R.R.; He, C.J.; Xu, W.; Wang, X.D. Prediction of surface roughness of CO2 laser modified poplar wood via response surface methodology. Maderas-Cienc. Tecnol. 2022, 24, 1–12. [Google Scholar] [CrossRef]
  19. Li, R.R.; Yang, F.; Wang, X.D. Modeling and Predicting the Machined Surface Roughness and Milling Power in Scot’s Pine Helical Milling Process. Machines 2022, 10, 331. [Google Scholar] [CrossRef]
  20. Li, R.R.; Yao, Q.; Xu, W.; Li, J.; Wang, X. Study of cutting power and power efficiency during straight-tooth cylindrical milling process of particle boards. Materials 2021, 15, 879. [Google Scholar] [CrossRef]
  21. Yang, Y.; Xu, W.; Liu, X.; Wang, X. Study on permeability of cunninghamia lanceolata based on steam treatment and freeze treatment. Wood Res.-Slovak. 2021, 66, 721–731. [Google Scholar] [CrossRef]
  22. Valarmathi, T.N.; Palanikumar, K.; Latha, B. Measurement and analysis of thrust force in drilling of particle board (PB) composite panels. Measurement 2013, 46, 1220–1230. [Google Scholar] [CrossRef]
  23. Bao, X.; Ying, J.; Cheng, F.; Zhang, J.; Luo, B.; Li, L.; Liu, H. Research on neural network model of surface roughness in belt sanding process for Pinus koraiensis. Measurement 2018, 115, 11–18. [Google Scholar] [CrossRef]
  24. Zhou, C.; Shi, Z.; Kaner, J. Life Cycle Analysis for Reconstituted Decorative Lumber from an Ecological Perspective: A Review. BioResources 2022, 17, 3912–3928. [Google Scholar] [CrossRef]
  25. Karpat, Y.; Özel, T. Multi-objective optimization for turning processes using neural network modeling and dynamic-neighborhood particle swarm optimization. Int. J. Adv. Manuf. Technol. 2007, 35, 234–247. [Google Scholar] [CrossRef]
Figure 1. Correlation graph for resultant force.
Forests 13 02126 g001
Figure 2. (a) Normal distribution of experimental data (b) predicted value with residuals.
Forests 13 02126 g002
Figure 3. Two-level interactions on resultant force: (a) rake angle and depth of cut (b) rake angle and cutting speed and (c) cutting speed and depth of cut.
Forests 13 02126 g003
Figure 4. Effect of cutting conditions on resultant force.
Forests 13 02126 g004
Figure 5. Correlation graphs for surface roughness.
Forests 13 02126 g005
Figure 6. (a) Normal distribution of experimental data (b) predicted value with residuals.
Forests 13 02126 g006
Figure 7. Two-level interactions on surface roughness: (a) rake angle and depth of cut (b) rake angle and cutting speed and (c) cutting speed and depth of cut.
Forests 13 02126 g007
Figure 8. Effect of cutting conditions on surface roughness.
Forests 13 02126 g008
Table 1. Material properties of walnut.
DensityMoisture ContentModulus of ElasticityModulus of Rupture
0.72 g/cm310.5%12.11 GPa104.24 MPa
Table 2. Parameters of cutting tools.
No.Tool GeometryMaterial Properties
Rake AngleWedge AngleClearance AngleCoefficient of
Thermal Expansion
Thermal
Conductivity
Hardness
172°13°1.18 × 10⁻⁶ K−1560 W·m−1K−18000 HV
210°72°
315°72°
Table 3. Cutting factors, levels, and experimental responses.
Experimental FactorsFactor LevelExperimental Responses
−101
Rake angle (°) γ51015Resultant force (N)
Surface roughness (μm)
Depth of cut (mm) h0.20.40.6
Cutting speed (m/s) vc3037.545
Table 4. Experimental design and results.
No.γ (°)h (mm)vc (m·s−1)FR (N)Ra (μm)
150.23052.8911.4
2100.23066.758.12
3150.23086.176
450.43071.067.4
5100.43075.2810.91
6150.43075.85.75
750.63073.885.94
8100.63073.287.02
9150.63072.747.32
1050.237.549.235.32
11100.237.563.616.72
12150.237.583.425.35
1350.437.570.417.66
14100.437.572.744.95
15150.437.573.237.67
1650.637.573.224.42
17100.637.572.445.56
18150.637.572.546.26
1950.24542.48.93
20100.24555.86.88
21150.24576.1310.74
2250.44567.484.35
23100.44569.646.3
24150.44569.789.52
2550.64570.34.26
26100.64569.925.36
27150.64569.949.26
Table 5. Fit statistics for resultant force model.
ModelR2Adjusted R2Predicted R2Standard DeviationCoefficient of VariationAdeq. Precision
Cutting force95%92%0.872.623.8023.91
Table 6. Variance analysis of resultant force.
SourceSum of Squares% ContdfMean SquareF-Valuep-Value
Model2145.6795.049248.9536.18<0.0001 *
γ658.6051.0111202.46174.77<0.0001 *
h286.8831.111733.32106.58<0.0001 *
vc177.101.48134.865.070.0379 *
γ × h890.622.13150.187.290.0152 *
γ × vc0.12203.01170.8610.300.0051 *
h × vc39.392.23152.637.650.0132 *
γ22.543.95193.1413.540.0019 *
h281.110.0611.300.18860.6696
vc29.330.0811.830.26540.6131
Residual201.184.96176.88\\
Total2357.5410026\\\
Note: * indicates p < 0.05.
Table 7. Fit summary of the surface roughness model.
ModelR2Adjusted R2Predicted R2Standard DeviationCoefficient of VariationAdeq.
Precision
Surface roughness94%90%0.820.506.4617.11
Table 8. Variance analysis of surface roughness.
SourceSum of Squares% ContdfMean SquareF-Valuep-Value
Model61.5493.5896.8427.55<0.0001 *
γ43.8766.71143.87176.77<0.0001 *
h11.8418.01111.8447.72<0.0001 *
vc0.54780.8310.54782.210.1557
γ × h1.311.9911.315.270.0347 *
γ × vc0.00080.00110.00080.00340.9545
h × vc0.54610.8310.54612.200.1563
γ23.405.1713.4013.680.0018 *
h20.03030.0510.03030.12230.7309
vc20.00040.00110.00040.00150.9699
Residual4.226.42170.2482\\
Total65.7610026\\\
Note: * indicates p < 0.05.
Table 9. Optimization and verification of resultant force and surface roughness.
Testsγ (°)h (mm)vc (m·s−1)FR (N)Ra (μm)
Prediction150.24542.44.84
Verification150.24244.65.11
Error///5.2%5.6%
Publisher’s Note: MDPI stays neutral with regard to jurisdictional claims in published maps and institutional affiliations.

