Article

Research on Tea Trees Germination Density Detection Based on Improved YOLOv5

1
School of Technology, Beijing Forestry University, No. 35 Tsinghua East Road, Beijing 100083, China
2
Information Technology Research Center, Beijing Academy of Agriculture and Forestry Sciences, Beijing 100097, China
3
College of Robotics, Beijing Union University, Beijing 100020, China
4
Beijing Engineering Research Center of Smart Mechanical Innovation Design Service, Beijing Union University, Beijing 100020, China
5
Tea Research Institute, Chongqing Academy of Agricultural Science, Chongqing 402160, China
*
Authors to whom correspondence should be addressed.
Forests 2022, 13(12), 2091; https://doi.org/10.3390/f13122091
Submission received: 10 November 2022 / Revised: 1 December 2022 / Accepted: 6 December 2022 / Published: 8 December 2022

Abstract

:
Tea plants are one of the most widely planted agricultural crops in the world. The traditional method of surveying germination density is mainly manual checking, which is time-consuming and inefficient. In this research, the Improved YOLOv5 model was used to identify tea buds and detect germination density based on tea trees canopy visible images. Firstly, five original YOLOv5 models were trained for tea trees germination recognition, and performance and volume were compared. Secondly, backbone structure was redesigned based on the lightweight theory of Xception and ShuffleNetV2. Meanwhile, reverse attention mechanism (RA) and receptive field block (RFB) were added to enhance the network feature extraction ability, achieving the purpose of optimizing the YOLOv5 network from both lightweight and accuracy improvement. Finally, the recognition ability of the Improved YOLOv5 model was analyzed, and the germination density of tea trees was detected according to the tea bud count. The experimental results show that: (1) The parameter numbers of the five original YOLOv5 models were inversely proportional to the detection accuracy. The YOLOv5m model with the most balanced comprehensive performance contained 20,852,934 parameters, the precision rate of the YOLOv5m recognition model was 74.9%, the recall rate was 75.7%, and the mAP_0.5 was 0.758. (2) The Improved YOLOv5 model contained 4,326,815 parameters, the precision rate of the Improved YOLOv5 recognition model was 94.9%, the recall rate was 97.67%, and the mAP_0.5 was 0.758. (3) The YOLOv5m model and the Improved YOLOv5 model were used to test the validation set, and the true positive (TP) values identified were 86% and 94%, respectively. The Improved YOLOv5 network model was effectively improved in both volume and accuracy according to the result. This research is conducive to scientific planning of tea bud picking, improving the production efficiency of the tea plantation and the quality of tea production in the later stage.

1. Introduction

Tea trees are one of the most widely planted agricultural and forestry crops in the world. At present, more than 50 countries and regions in the world have a tea planting industry, and the planting scale continues to increase. Tea buds can be processed into tea leaves and related products after maturation, which is a worldwide renowned beverage. In the past decade, world tea consumption has increased by 4.5% every year. According to the data, in 2020, China’s tea production increased to 2.97 million tons, and the output value exceeded 250 billion yuan, making a major contribution to the global tea industry [1]. According to the FAO (Food and Agriculture Organization of the United Nations), total world tea production will reach 8 million tons by 2027. The technology of quick access to tea plastination information is the core technology of tea plastination automation management, and it has become a bottleneck problem restricting the development of tea plastination automation management. Germination density is one of the identification indexes of yield traits, which is closely related to the yield of tea. Through germination density information of tea plantations, researchers can estimate the early yield, which is important for tea plantation managers to master crop growth conditions and adjust production management measures in the later stage. At present, the method of manual counting is often used to count the tea trees germination density information in the germination information detection, which has the problems of long time, high cost, and poor accuracy.
In recent years, with the development of image recognition algorithms and deep learning algorithms, many innovative technologies have been applied to agriculture and forestry work, including crop recognition and yield prediction. Zhang et al. [2] used the improved CNN (convolutional neural networks) for target recognition of apple trees canopies under the condition of full leaves, and the average recognition accuracy reached 95%. Huang et al. [3] optimized the YOLOv5 (“You Only Live Once” Algorithm Vision 5) network based on the CBAM (convolutional block attention module) and data enhancement to improve the generalization ability of the model. ASFF (adaptive fusion feature) and L2 regularization were also used in this research to solve the low recognition effect caused by the overlap of fruit and leaves. Koirala et al. [4] built a deep learning detection model named “Mango YOLO” based on YOLOv3 and YOLOv2 (tiny) models. The F1 score of this network model in fruit image detection is 0.97, and this network is recommended for mango recognition. At the same time, the research also counts the detection results and estimates the output of the whole orchard combined with the correction factor of hidden fruits. To solve the problem of target recognition confusion caused by the color similarity between immature fruits and background (leaves), Lyu et al. [5] proposed a lightweight YOLOv5 CS (Citrus Sort) target detection model to achieve target detection and accurate counting of green citrus in natural environment, while improving the speed of image processing. Deb et al. [6] proposed an LS (location-sensitive) net convolution neural network for leaf recognition of rosette plants to solve the problem of accurately segmenting and recognizing leaves when multiple leaves overlap in images with complex backgrounds and achieved better results than other networks. Baweja et al. [7] used stereo vision, Hough transform, and FCN (fully convolutional networks) to distinguish sorghum stems from the background at pixel level. Li et al. [8] used FCN, unary brightness transformation, and pairwise region comparison to distinguish cotton bracts from background.
In the field of crop identification in agriculture and forestry, many researchers have conducted relevant research and achieved good results. However, there are complex environments in the tea plantations, including uncontrolled lighting and a high degree of similarity between the foreground area and the background (leaves). Therefore, the identification of fresh tea leaves in the complex environment of tea plantations is a difficult issue of research in this field. Kamrul et al. [9] applied three classification algorithm network models, VGG16 (very deep convolutional networks with 16 layers), CNN, and R-CNN (region-CNN), to identify fresh tea leaves, and the recognition accuracy of the three models all exceeded 92%. Wei et al. [10] identified and classified fresh tea leaves based on fluorescence imaging tea images, and used two CNN models VGG16 and ResNet-34 for model training, respectively. The results show that the performance of the VGG16 model is better than the ResNet-34 model, and the recognition accuracy reaches 97.5%. Chen et al. [11] used machine vision to classify and recognize fresh tea flakes (FTL). The topological structure of FTL is established to extract the shape-based features of each FTL, and the support vector machine model is used for classification. The experimental results show that the performance of the vision-based recognition method is good, with the accuracy of 94% and 85%. Cui et al. [12] proposed a tea recognition method based on L-CNN-SVM (lightweight convolutional neural network and support vector machine), aiming to realize tea recognition using wavelet eigenmap generated by decomposition and reconstruction of wavelet time-frequency signals. The model was tested in the hyperspectral image datasets of black tea, green tea, and yellow tea, and the accuracy of the model reached 98.7%. Yan et al. [13] improved a lightweight convolutional neural network MC-DM (multi class DeepLabV3 + MobileNetV2) based on DeepLabV3+ to segment tea germination images. The spatial pyramid pool module is introduced to improve the pixel sampling ability and increase the receptive field. At the same time, the network lightweight design based on MobileNetV2 improves the efficiency and accuracy of segmentation. Chen et al. [14] solved the problem that tea buds and complex background in tea canopy images are difficult to identify and picking points are difficult to determine. A combination of machine vision and deep learning is proposed to identify fresh tea buds in the field and determine the picking points. The fast region-based convolutional neural network (faster R-CNN) was trained to identify and segment tea buds and background leaves, and then the full convolutional network (FCN) was trained to identify plucking points in tea buds. The faster R-CNN model achieved a precision of 79% and a recall of 90%. The FCN achieved a mean accuracy of 84.91% and a mean intersection-over-union of 70.72%. However, there are still some problems with the current research. Studies on tea bud recognition are mostly applied in single plant images. In actual tea gardens, the connected area of tea trees is larger, and there is a lack of relevant research on large area tea bud recognition and detection. At the same time, some deep learning networks have high complexity and large model size, which require harsh operating environment. These networks are not conducive to mobile terminal deployment, so it is difficult to realize the field application of tea trees information detection.
The main purpose of identifying agricultural crops is density calculation, then yield prediction and load estimation can be carried out. Tatsumi et al. [15] applied traditional machine learning to compute and recognize the high-altitude images of tomato gardens, and established models to predict tomato biomass and yield. Lu et al. [16] extracted fruit and crown features based on the improved CA-YOLOv4 network for crop load management. Other researchers estimate crop biomass based on drone imagery and machine learning and deep learning methods; crops include wheat [17], rice [18], maize [19], and barley [20]. Most of these density identification methods cannot reconcile the recognition accuracy with the operational efficiency, which makes it difficult to achieve the application of real-time detection task in plantations. Therefore, according to the application of tea tree germination detection, this research improved YOLOv5 from model lightweight and model accuracy by combining lightweight model design, attention mechanism, spatial pyramid optimization, and other theories. The Improved YOLOv5 model identified and counted tea buds in images to calculate the tea trees germination density, and its general framework is shown in Figure 1. This rapid detection method of tea trees germination density is helpful for the automatic management of tea plantations.

2. Materials and Methods

2.1. Experimental Subject

Fuding White Tea (Camellia sinensis cv. Fuding-dabaicha) are clonal varieties of tea plant, small trees type, middle class, and early species. The Fuding white tea plant is 1.5~2 m high and 1.6~2 m wide, with semi-open tree potential for small tree types. The branches are dense, and the internodes are long. The bark is gray, leaves are elliptic, apex acuminate and are slightly pendulous, base is slightly obtuse, and leaf margin is slightly upward. This is usually up to 12 cm × 5.4 cm, and the average aspect ratio is 2.2. The leaves are yellow-green and shiny. The lateral veins are distinct, with 7–11 pairs. They are serrated more neat, obvious, with 27–38 pairs. Mesophyll is slightly thick and still soft. One bud and two leaves are 5.1 cm long, and 100 buds weigh 23 g. They are suitable to produce green tea, black tea, and white tea.

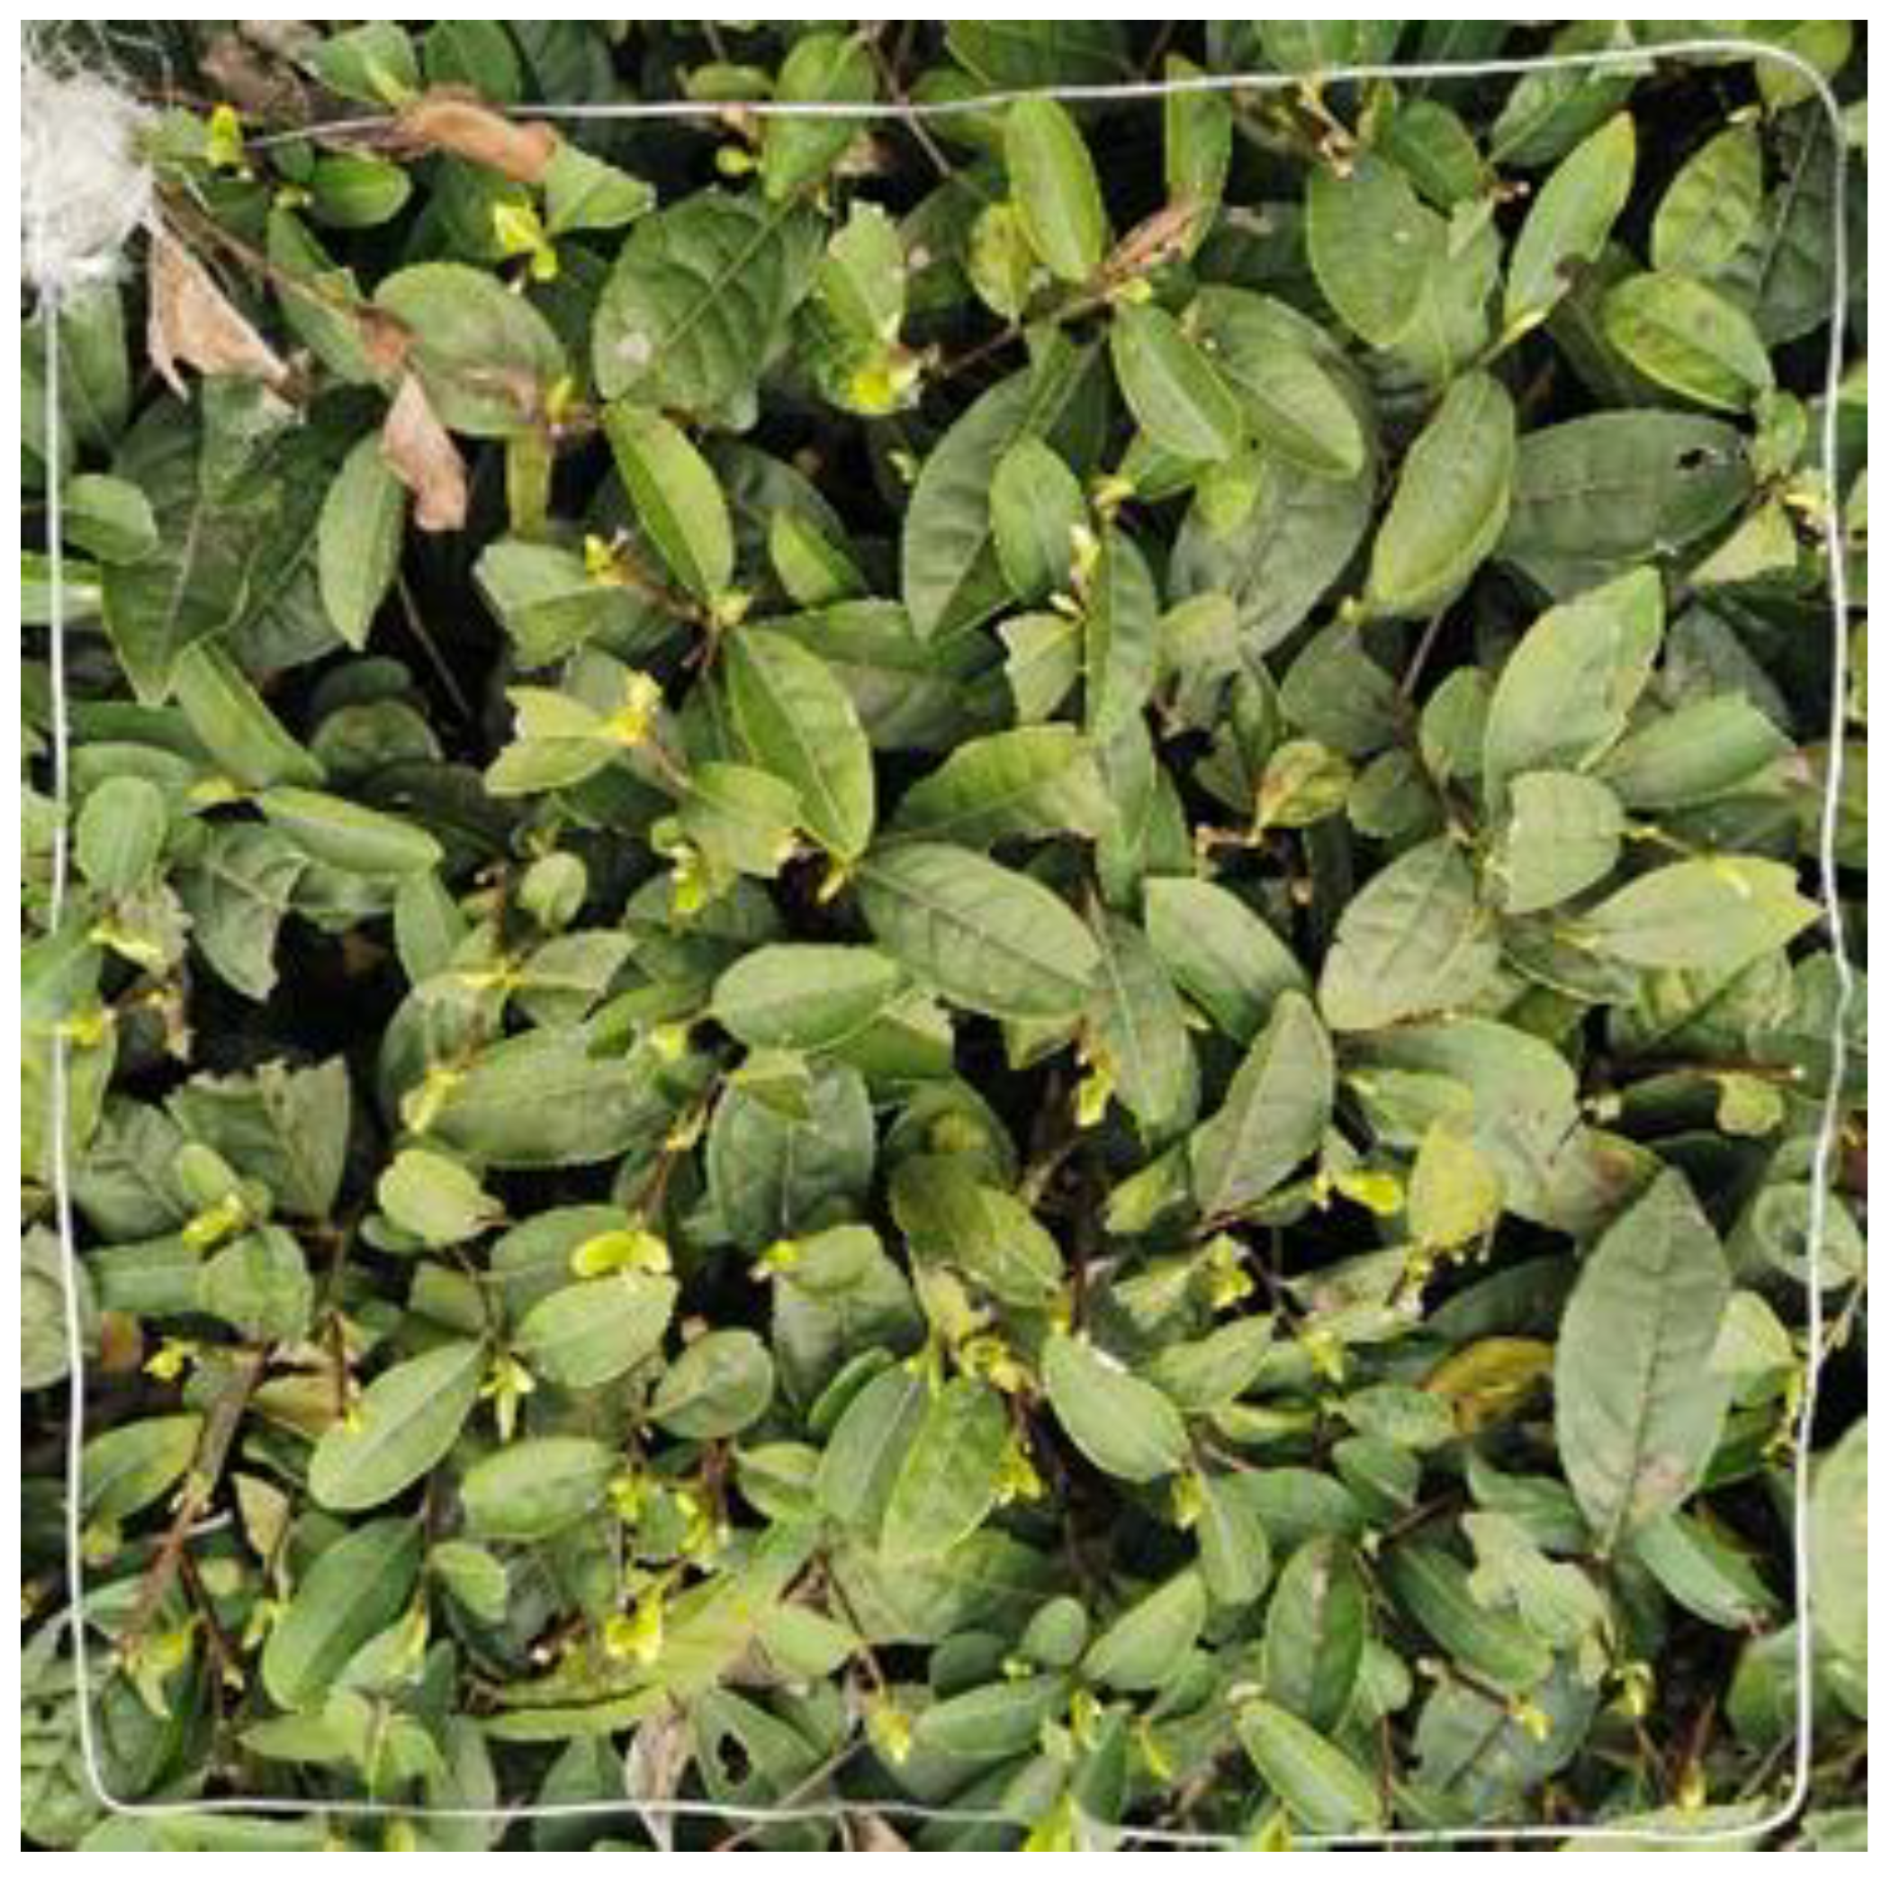
2.2. Tea Trees Germination Images Acquisition

The tea trees germination images acquisition experiment was carried out in the tea plantation of Yongchuan District, Chongqing, during the tea bud harvesting period in March 2020. The sprouted Fuding white tea trees were selected as the experimental object; each experimental tea tree was numbered and marked. Five cross image acquisition areas were selected on the canopy of each experimental tea tree, and each image acquisition area was marked with a 1 square foot box, as shown in Figure 2.
Generally, the germination of Fuding white tea trees starts from 9 a.m. to 11 a.m. During this period, a Sony DSC-RX100M4 camera was used to acquire images. The parameters of the camera are shown in Table 1. Images were taken vertically from each image acquisition area. When collecting images, the height of the lens is 20–40 cm away from the tea buds. Images were taken every two days. A total of 360 images taken from 72 experimental tea trees were obtained to ensure that the tea trees germination images database was widely representative.

2.3. Image Processing

The steps of image processing are as follows:
  • Cut the original image into four pieces of one size;
  • Label the buds in the image to obtain the ground truth box anchor coordinates;
  • Check the database (delete the redundant image and empty xml file, and check whether the ground truth box is correct);
  • Data enhancement.
The flowchart of image processing steps is shown in Figure 3.
Due to the high spatial resolution of the image, the original image is cut into four pieces of one size after removing the excess parts outside the marker box, as shown in Figure 4, to further expand the amount of sample data and improve the effect of training network. The dataset contains a total of 1440 tea trees germination images.
Before training the YOLOv5 model, the picture should be labeled with the ground truth box according to the target, and the anchor coordinate data of the category box should be obtained and converted into a file format that can be recognized by YOLOv5. Labelimg software (vision 1.8.6) was used to create a labeling box to label each tea bud target in the canopy image, as shown in Figure 5, with 29,085 tea buds labeled in total. A total of 80% of the tea trees germination images of each plot and each scene were randomly selected as the training set and the other 20% as the validation set to construct the tea trees germination database.
After the dataset is loaded into the model, the proposed prior box information is obtained by clustering analysis based on k-means algorithm. The YOLOv5 network adopts the mosaic data enhancement method and provides 4-mosaic and 9-mosaic two data enhancement methods. As tea buds are relatively small targets in the canopy background, 4-mosaic data enhancement method is adopted, and the enhanced image example is shown in Figure 6.

2.4. YOLOv5 Network

YOLO network is a region-free object detection algorithm, which has the characteristics of faster detection speed and good overall feature extraction effect. Its basic network structure is shown in Figure 7 [21].
In 2020, Glenn Jocher of UitralyticsLLC launched the YOLOv5 network on GitHub [22]. The network structure of YOLOv5 is shown in Figure 8, which is mainly composed of the input, backbone, neck, and head [23].
The input of the YOLOv5 network mainly features three designs: mosaic data enhancement module, adaptive anchor box calculation, and adaptive image scaling. The backbone in the YOLOv5 network consists of focus structure and CSP structure. The neck in the YOLOv5 is a combination of FPN + PAN structure. The output master of the YOLOv5 network uses CIOU_Loss as the bounding box loss function and weighted non-maximum suppression (nms) [24].
The YOLOv5 network has a total of five model structures: YOLOv5n, YOLOv5s, YOLOv5m, YOLOv5l, and YOLOv5x. These five model structures are consistent in architecture. Only the depth and width of the model are extended and reduced, and the accuracy and speed are different.

2.5. Model Optimization Theory

Although YOLOv5 is an advanced and mature target detection model, there are still some optimization possibilities in model efficiency and recognition effect. The YOLOv5 network is composed of the input, backbone, neck, and prediction. Therefore, the optimization process of the improved YOLOv5 is also introduced in this order. The design of the improved YOLOv5 was based on the Python language and programmed in JetBrains PyCharm software (vision 2019.1).
Reverse attention mechanism (RA) focuses on the reverse ground truth, which can amplify the reverse response in the confused region, then obtain higher resolution and better boundary recognition effect [25]. The principle of RA is shown in Equation (1).
R i = f i A i
where R i represents the output reverse attention feature; f i represents the feature of high-level side output; and A i notices the weight in reverse. The inverse attention weight A i is calculated as Equation (2).
A i = ( σ ( ρ ( S i + 1 ) ) )
where ρ ( ) represents the up-sampling operation,   σ represents sigmoid function, and ( ) is from the 1 minus the input of the inverse operator matrix e.
FReLU expands ReLU and PReLU into 2D activation functions with only a small amount of computational burden and improves the overall image recognition ability of the model [26]. The principle of FReLU is shown in Equation (3).
y = m a x ( x , T ( x ) )
where T ( x ) represents the spatial context feature extractor, the m a x ( ) conditions of the () function (previously ReLU x < 0) are replaced by 2D funnel conditions, and solving the problem of the activation function of the space is not sensitive.
CARAFE lightweight up-sampling operator further reduces the number of parameters and computational cost of the model [27]. The principle of CARAFE is shown in Equations (4) and (5).
w l = ψ ( N ( x l , k e n c o d e r ) )
x l = ( N ( x l , k u p ) , w l )
where ψ represents the kernel prediction module; w l is the kernel; x represents the feature map; and x represents a new feature map generated by up-sampled kernel recombination. For any target position l of x , there is a corresponding source position l at input x , and N ( x l , k ) is expressed as a k × k subregion of x centered at position l .
Compared with the original loss function, BCE with logits loss function improves the mutual exclusivity of classes. Considering the dichotomous application of tea bud recognition, this loss function optimization can maintain the recognition accuracy of the model. The principle of BCE with logits loss function is shown in Equation (6).
L o s s = { l 1 , , l N } ,   l n = [ y n × log ( σ ( x n ) ) + ( 1 y n ) × ( 1 σ ( x n ) ) ]
where N represents the number of batches, and each batch predicts n labels; σ ( x n ) represents a sigmoid function that maps x to the interval (0, 1).

2.6. Tea Trees Germination Density Calculation

Germination density refers to the number of buds and leaves on the picking surface of a tea plant, usually expressed as the number of buds per square meter. According to the experimental design, the actual area of each image is known to be a quarter of a square foot (0.0278 square meters). The tea tree germination detection model based on Improved YOLOv5 was used to count the tea buds in the picture after recognition, and the quantity information of tea buds in the picture was obtained. The germination density information of tea trees can be calculated according to Equation (7).
S D = 1 n p c s n S A n
where S D represents the germination density of tea plant (unit: pcs/m3), p c s n represents the number of tea buds identified in the n th image (unit: pcs), and S A represents the actual visual field area of the image, which is a constant of 0.0278 (unit: m3).

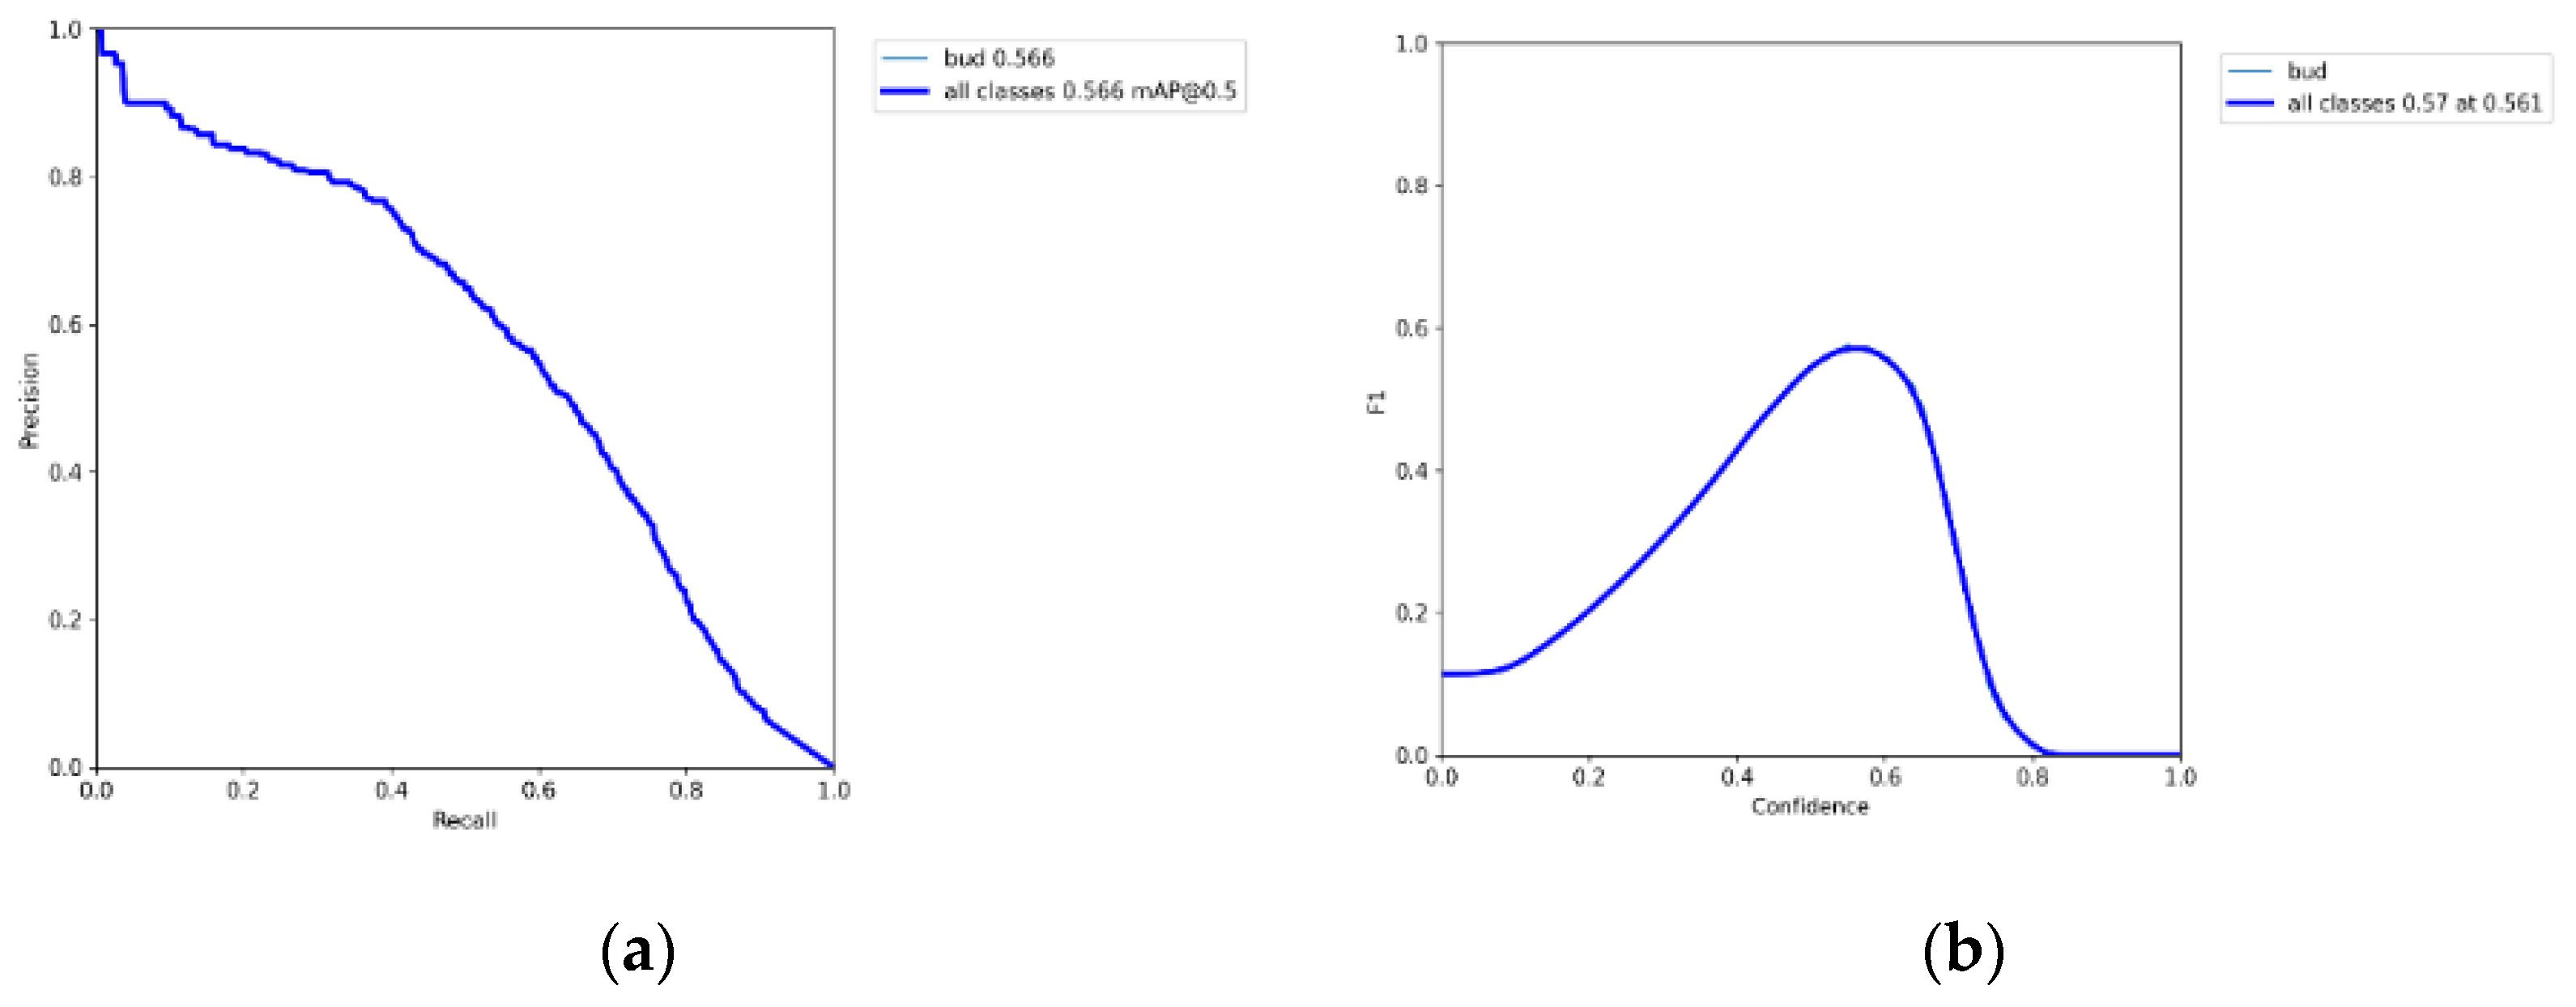
2.7. Evaluation Indicator

In the classification model, there are four prediction situations: true positive, true negative, false positive, and false negative [28]. The relationship between these four situations is shown in Table 2.
Precision represents the proportion of samples predicted to be positive that are actually positive, and its calculation method is shown in Equation (8).
p r e c i s i o n = T P / ( T P + F P )
where TP is the number of true positive samples and FP is the number of false positive samples. The accuracy index is a measure of the prediction accuracy of the model. Generally speaking, the higher the accuracy, the better the model effect.
In the measure of recall, multiple actual positive samples are correctly predicted to be positive samples, and the calculation method is shown in Equation (9).
r e c a l l = T P / ( T P + F N )
where TP is the number of true positive samples and FN is the number of false negative samples.
In addition to precision and recall, F1Score, box_loss, obj_loss, mean average precision (mAP), and other model performance evaluation indicators were also selected in this study [29].
F1Score is a harmonic average measurement index based on accuracy and recall for classification problems, and its calculation method is shown in Equation (10).
F 1 S c o r e = 2 × P r e c i s i o n × R e c a l l P r e c i s i o n + R e c a l l
The equation shows that F1Score is an index that integrates precision rate and recall rate. The value ranges from 0 to 1, and the larger the score, the better the classification effect of the model.
The P–R curve represents the relationship between precision and recall. The recall and accuracy are inversely proportional, meaning that while accuracy increases, recall declines and vice versa. There is a point on the P–R curve with the same accuracy rate and recall rate, which is called the BEP (break-even point). At this point, a balance is reached between accuracy and recall. It is very important to determine the BEP according to the specific scenario of the model application. The area enclosed by the P–R curve, horizontal axis, and vertical axis is the AP (average precision). Generally speaking, the higher the AP value, the better the model’s performance. Accordingly, the arithmetic mean of the AP values of each category is called the mAP (mean average precision) [30].
The obj_loss (object loss) indicates the probability that the detected object belongs to a certain category, i.e., the probability that the prediction box contains the object [31].

3. Result

3.1. Improved YOLOv5
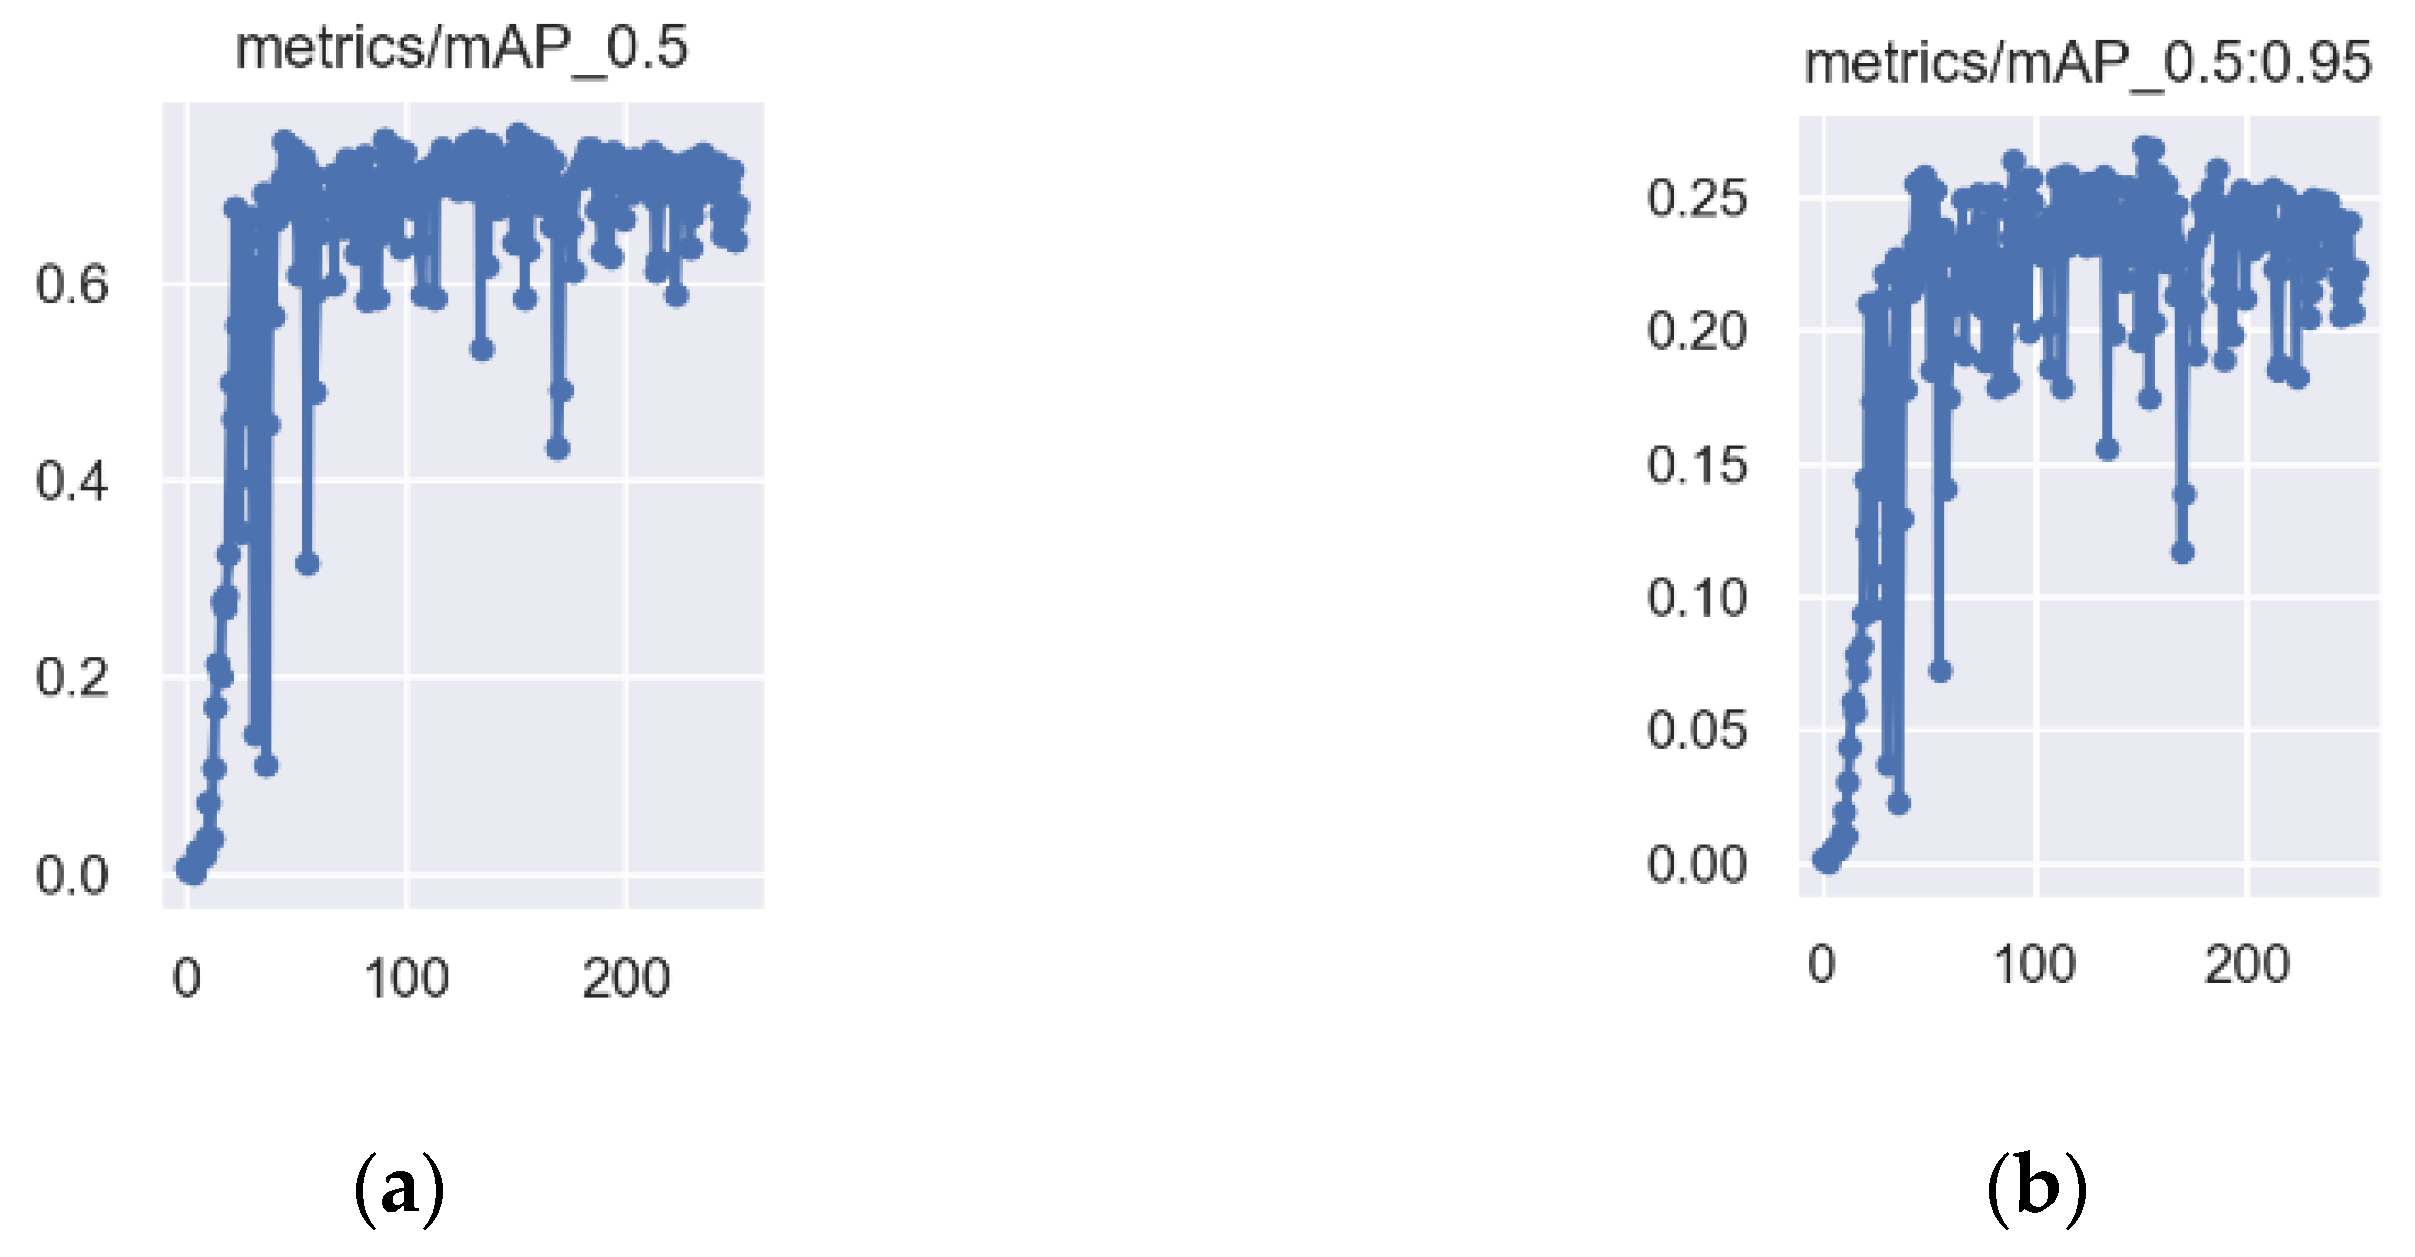
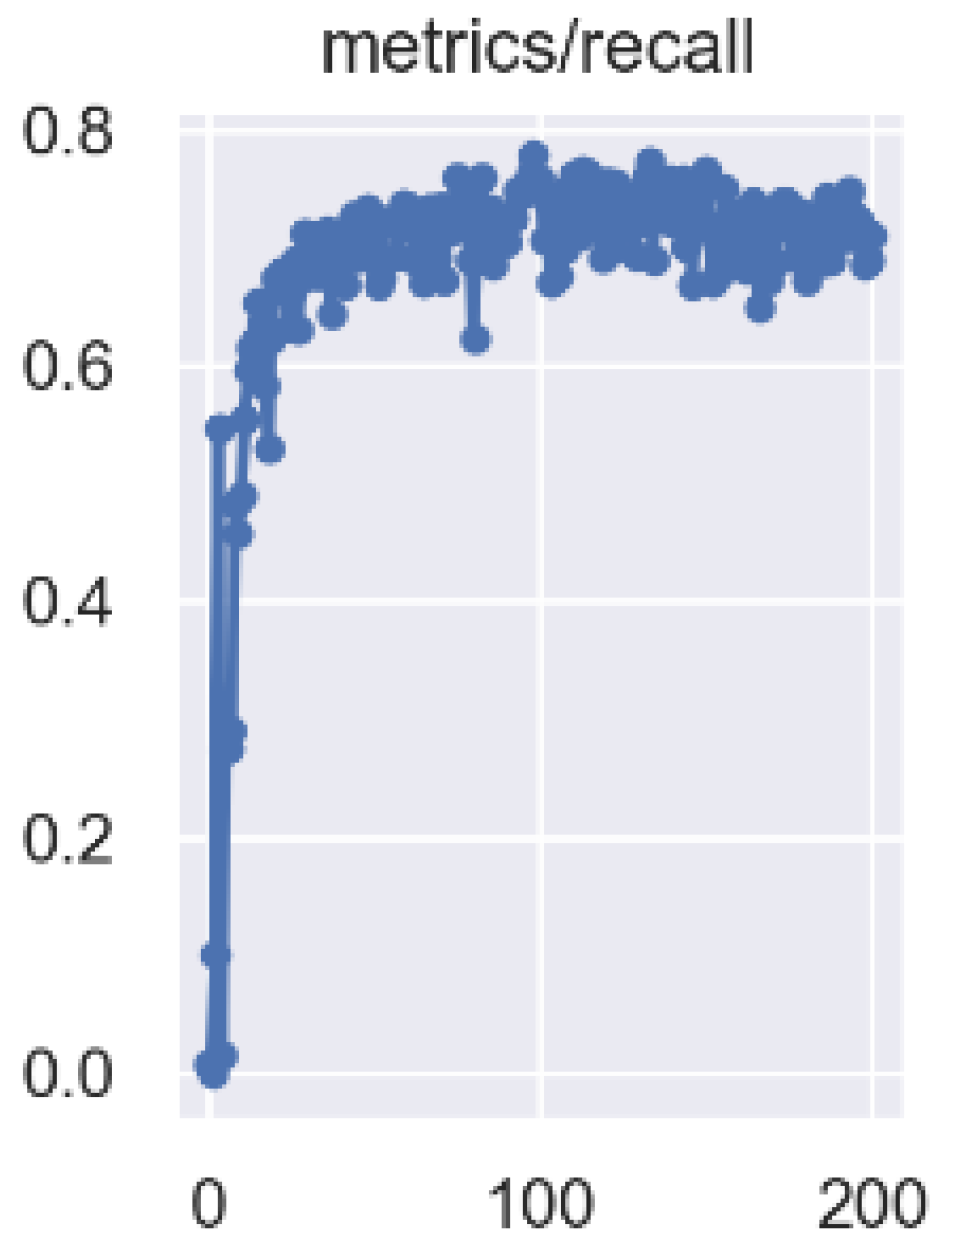
Due to the large number of CBL + CSP module parameters used in the original YOLOv5 network backbone, a new backbone consisting of Stemblock + Xception + ShuffleNetV2 structure was designed. The newly designed backbone structure is shown in Figure 9. The Stemblock module introduces a branch into the bottleneck layer, first reducing the number of channels and then down sampling. The other branch pools and concatenates the original input. The Stemblock module structure in the figure shows that this operation reduces the size of the output feature map to a quarter of the input while delivering enough information, reducing the number of parameters. Due to its depth-wise separate convolution and residual connects design, the Xception module greatly reduces the number of model parameters while retaining feature information [32]. The ShuffleNetV2 module is designed based on four lightweight network principles and implements lightweight network operation at the memory access cost and platform character levels [33]. Combining the Xception module with the ShuffleNetV2 module can achieve comprehensive lightweight optimization effect in both model floating point operations (FLOPs) and model platform running speed.
In the process of lightweight optimization of the model, the reduction of parameters is bound to have a certain negative impact on the detection ability of the model. Therefore, receptive field block (RFB) [34] was applied in this research to strengthen the feature extraction ability of the model. The original spatial pyramid pooling (SPP) module of YOLOv5 is replaced by RFB module with dilated convolution. The receptive field of lightweight target detection network is increased without increasing too much calculation and too many layers.
Based on the original structure of the neck in YOLOv5, reverse attention mechanism (RA) is used to update the CSP2_1 module to form a new C3 module. Accordingly, Funnel ReLU nonlinear visual activation function (FReLU) was used to improve the original CBL module of the neck. In addition, CARAFE lightweight up-sampling operator is used to complete the up-sampling operation in the neck. The improved neck, CBF module, and C3 module structure are shown in Figure 10.
BCE with logits loss function check is designed before output. The overall structure of the Improved YOLOv5 network is shown in Figure 11.

3.2. Model Training

Adam algorithm comes from adaptive moment estimation, which was proposed by Diederik Kingma in 2014 [35]. Adam algorithm is estimated by calculating a moment gradient, and the second moment gradient adaptively calculated a corresponding weight to each parameter. In 2017, Ilya Loshchilov proposed Adam + weight (AdamW) optimization algorithm [36]. AdamW directly adds the gradient of the regularization term into the formula of backpropagation, which improves the computational efficiency of the optimization algorithm.
In summary, AdamW optimizer is used to optimize the YOLO model loss function in the process of network training in the reverse pass, and the training platform configuration is shown in Table 3. The training process is completed on NVIDIA GeForce GTX 1080, which has 2560 stream processing units, the core frequency is 1607/1734 MHz, the video memory is 8 GB, and the video memory bit width is 256 bit.
The model training information are shown in Table 4. The table shows that with the increase of network depth, the training time of convergence also increases. The YOLOv5n model with the smallest volume only contains 1,760,518 parameters, and the training time is only 2.773 h. The YOLOv5x model with the largest network depth contains 86,173,414 parameters, and the total training time is 13.422 h.
Table 4 shows that parameters of the Improved YOLOv5 model is nearly four times less than that of the YOLOv5m model, and good convergence effect has been achieved after about 100 iterations. It indicates that the model has successfully achieved a lightweight feature.

3.3. Tea Buds Recognition Accuracy

The changes of precision during the training process of tea trees germination detection models based on five original YOLOv5 models and Improved YOLOv5 model are shown in Figure 12.
The changes of localization loss (box_loss) and confidence loss (obj_loss) during the training process of the tea trees germination detection models based on five original YOLOv5 models are shown in Figure 13. Among them, the box_loss and obj_loss of the training set and validation set gathered statistics, respectively.
Other training results of these six models are shown in Figure A1, Figure A2, Figure A3, Figure A4, Figure A5, Figure A6, Figure A7, Figure A8, Figure A9, Figure A10, Figure A11, Figure A12, Figure A13, Figure A14, Figure A15, Figure A16, Figure A17 and Figure A18 (Appendix A). By comparing the performance index parameters of the original YOLOv5 models, and considering the amount of model parameters, it was concluded that the performance index scores of the tea trees germination detection model based on YOLOv5m were more balanced. The optimal volume of the model was 42.6 MB, which contained 20,852,934 parameters. By comparing the YOLOV5m model with the improved YOLOv5 model, the improved YOLOv5 model had obviously better results in both recognition accuracy and efficiency.

3.4. Tea Trees Germination Density Detection Accuracy

The confusion matrix of the YOLOv5m and improved YOLOv5 model obtained by testing with picture samples in the test set is shown in Figure 14. It shows that the model correctly identifies 86% and 94% tea buds in the test set and fails to identify 14% and 16% tea buds. There was no mistaking the background as tea buds in both tea germination models.
Figure 15 shows the tea trees germination detection results of YOLOv5m and Improved YOLOv5 on the test set. The figure shows that both the YOLOv5m and Improved YOLOv5 models have accurately identified the buds in the tea trees canopy, but YOLOv5m has a serious phenomenon of repeated detection.
A total of 5817 tea buds were marked in the test set images, and 5469 tea buds were identified using the tea trees germination detection model based on YOLOv5. Comparing the germination density value obtained from the tea trees germination density detection algorithm with the manually calculated germination density value, the tea trees germination density detection algorithm in this research has a high detection accuracy, with an accuracy rate of 94%. Through communication with the staff of the raw tea purchasing unit and actual calculation, the corresponding relationship that 500 g of raw tea can be obtained from 56,000 tea buds is obtained. According to this relationship, the yield of the whole tea garden can be estimated. It is helpful for the producers to adjust the production measures according to the growth status of tea plants and realize the automatic management of tea gardens.

4. Discussion

The YOLOv5 network was originally designed to be used for multiple classification complex target detection tasks, and the main network composed of Backbone CBL + CSP has deep layers and large parameters, resulting in large model computation [37]. The overly complex network structure has wasted arithmetical resources in the task of tea bud recognition and is not suitable for the follow-up research of real-time detection of tea trees information [38]. Therefore, this research used the combination module of the Xception structure and ShuffleNetV2 structure to redesign the network backbone part. The experimental results in Table 5 showed that the complexity of the Improved YOLOv5 network has been effectively lightened, and its parameter quantity has been greatly reduced by nearly four times compared with original YOLOv5 models.
This is because Xception uses a deeply separable convolution structure and residual connections to realize the complete decoupling of cross channel correlation and spatial correlation. While retaining the maximal recognition ability, it greatly reduces the model volume and improves the calculation efficiency. ShuffleNetv2 follows the two concepts: using direct measurement instead of indirect measurement to evaluate the complexity of the model and evaluating the target platform. It has improved on the basis of ShuffleNetV1 and realized the lightweight and efficient operation of the network at the level of memory access cost and platform characteristics [39]. In addition, CARAFE lightweight up-sampling operator was used in this study to reduce the arithmetical cost of up-sampling operation [40]. The experimental results show that the convergence time of the Improved YOLOv5 model is shorter than YOLOv5m model.
In the original YOLOv5 network, although the model recognition effect is improved with the increase of model layers, the scores of evaluation indicators are not obvious. This is due to two reasons: the initial network layers of YOLOv5 are too deep and the receptive field is too small during feature extraction, resulting in gradient confusion in the process of model convergence and information transmission. In this research, FReLU nonlinear visual activation function was used to improve the CBL module, and the RFB module was used to increase the receptive field. This is because FReLU changes the activation function from 1D to 2D [41]. This visual condition helps to extract the spatial layout of objects and obtain the ability of pixel-based modeling [42]. The dilated convolution in the RFB module realizes the enlargement of receptive fields and the fusion of characteristic maps of different receptive fields and does not cause too much computation and increase the network depth roughly [43]. This combination further enhances the ability of the network to detect the macro target, and can better approximate the complex shape layout, which is suitable for the irregular shape of tea buds. The experimental results showed that the accuracy, recall, mAP, and various loss scores of the Improved YOLOv5 model in tea trees germination detection are obviously improved, and the repeated recognition of tea buds is well solved.
In the tea trees canopy image, the yellow green tea bud and the green canopy leaf background color are not obvious, especially the junction of tea bud and leaf background, which is easy to cause confusion. This situation led to the problem that although the original YOLOv5 model accurately recognized the tea buds in the tea trees germination detection, there was deviation in the prediction box boundary. Based on this problem, this research used RA mechanism to amplify the reverse response of the area at the junction of tea bud and leaf background to obtain high resolution boundary salient features [44], and to better distinguish the color confusion between yellow green tea bud and green canopy background. The experiment shows that although RA mechanism increased a small amount of computation, RA mechanism improved the microscopic recognition effect of the model in tea trees germination detection, and it is a cost-effective model optimization strategy.
As a conclusion, the Improved YOLOv5 model performs better than the original YOLOv5 model in the application of tea germination recognition, but there are still cases where tea buds cannot be recognized. The experimental results showed that most of these tea buds are incomplete in the image, which indicates that the method used in this research can only extract the shape, texture, and other shape features of tea buds, and when the effective shape features of tea buds cannot be extracted, there will be missing recognition [45].
This study showed that the Improved YOLOv5 model is effective in tea trees germination detection. Combining with the calculation method of tea trees germination density, it can achieve efficient detection of tea trees information, which can provide technical support for the related research in the field of tea trees yield characteristics evaluation, tea picking, and processing intelligent equipment.

5. Conclusions

In this research, we proposed an improved YOLOv5 model combined with model optimization theory, which solved the problems of low accuracy and efficiency of tea buds’ recognition in the original YOLOv5 model. On this basis, we proposed a tea trees germination density detection method based on machine vision technology and Improved YOLOv5 model. Compared with original YOLOV5 model, the probability of correct recognition of tea buds in this method is 94%, which has been improved by nearly 10%. Reliable germination density information can be obtained to achieve rapid and accurate detection of tea trees. This research is conducive to scientific planning of tea bud picking, improving the production efficiency of the tea plantation and the quality of tea production in the later stage. However, as the data set used in this research was only visible light images, there are still some limitations in experimental methods. In the future, we will further use multispectral imaging combined with image fusion technology to expand the quality of the dataset and develop a detection model with better generalization ability to obtain a more capable detection method for tea trees germination density.

Author Contributions

Conceptualization, J.W. and F.W.; methodology, J.W., X.L. and G.Y.; software, J.W.; validation, J.W. and X.L.; formal analysis, J.W. and F.W.; investigation, L.Y. and F.W.; resources, L.Y., F.W. and G.Y.; data curation, X.L.; writing—original draft preparation, J.W.; writing—review and editing, J.W., X.L. and B.X.; visualization, J.W. and H.Y.; supervision, L.Y., S.M. and Z.X.; project administration, L.Y.; funding acquisition, L.Y. and S.M. All authors have read and agreed to the published version of the manuscript.

Funding

This research was funded by the Fundamental Research Funds for the Central Universities (BLX202126); the Opening Foundation of Key Lab of State Forestry Administration on Forestry Equipment and Automation under Grant (BFUKF202220); the Chongqing Technology Innovation and Application Development Special Project (cstc2021jscx-gksbX0064); Qingyuan Smart Agriculture Research Institute + New R&D Insititutions Construction in North and West Guangdong (2019B090905006); and the General Program of Science and Technology Development Project of Beijing Municipal Education Commission of China under Grant (KM201911417008).

Data Availability Statement

All data included in this study are available upon request by contact with the corresponding author.

Conflicts of Interest

The authors declare no conflict of interest.

Appendix A

Figure A1. The changes of recall of YOLOV5n.
Forests 13 02091 g0a1
Figure A2. The precision/recall curve and F1Score/confidence curve of YOLOV5n: (a) PR_curve; (b) F1_curve.
Forests 13 02091 g0a2
Figure A3. The change of mean average precision (mAP) of YOLOV5n: (a) mAP_0.5; (b) mAP_0.5:0.95.
Forests 13 02091 g0a3
Figure A4. The changes of recall of YOLOV5s.
Forests 13 02091 g0a4
Figure A5. The precision/recall curve and F1Score/confidence curve of YOLOV5s: (a) PR_curve; (b) F1_curve.
Forests 13 02091 g0a5
Figure A6. The change of mean average precision (mAP) of YOLOV5s: (a) mAP_0.5; (b) mAP_0.5:0.95.
Forests 13 02091 g0a6
Figure A7. The changes of recall of YOLOV5m.
Forests 13 02091 g0a7
Figure A8. The precision/recall curve and F1Score/confidence curve of YOLOV5m (a) PR_curve; (b) F1_curve.
Forests 13 02091 g0a8
Figure A9. The change of mean average precision (mAP) of YOLOV5m: (a) mAP_0.5; (b) mAP_0.5:0.95.
Forests 13 02091 g0a9
Figure A10. The changes of recall of YOLOV5l.
Forests 13 02091 g0a10
Figure A11. The precision/recall curve and F1Score/confidence curve of YOLOV5l: (a) PR_curve; (b) F1_curve.
Forests 13 02091 g0a11
Figure A12. The change of mean average precision (mAP) of YOLOV5l: (a) mAP_0.5; (b) mAP_0.5:0.95.
Forests 13 02091 g0a12
Figure A13. The changes of recall of YOLOV5x.
Forests 13 02091 g0a13
Figure A14. The precision/recall curve and F1Score/confidence curve of YOLOV5x: (a) PR_curve; (b) F1_curve.
Forests 13 02091 g0a14
Figure A15. The change of mean average precision (mAP) of YOLOV5x: (a) mAP_0.5; (b) mAP_0.5:0.95.
Forests 13 02091 g0a15
Figure A16. The changes of recall of Improved YOLOV5.
Forests 13 02091 g0a16
Figure A17. The precision/recall curve and F1Score/confidence curve of Improved YOLOV5: (a) PR_curve; (b) F1_curve.
Forests 13 02091 g0a17
Figure A18. The change of mean average precision (mAP) of Improved YOLOV5: (a) mAP_0.5; (b) mAP_0.5:0.95.
Forests 13 02091 g0a18

References

  1. FAO. Current Market Situation and Medium Term Outlook for Tea to 2027; CCP:TE18/CRS1; FAO: Rome, Italy, 2018. [Google Scholar]
  2. Zhang, X.; Fu, L.; Karkee, M.; Whiting, M.D.; Zhang, Q. Canopy Segmentation Using Res-Net for Mechanical Harvesting of Apples. IFAC-Pap. Online 2019, 52, 300–305. [Google Scholar] [CrossRef]
  3. Huang, H.; Huang, T.; Li, Z.; Lyu, S.; Hong, T. Design of Citrus Fruit Detection System Based on Mobile Platform and Edge Computer Device. Sensors 2022, 22, 59. [Google Scholar] [CrossRef] [PubMed]
  4. Koirala, A.; Walsh, K.B.; Wang, Z.; McCarthy, C. Deep learning for real-time fruit detection and orchard fruit load estimation: Benchmarking of ‘MangoYOLO’. Precis. Agric. 2019, 20, 1107–1135. [Google Scholar] [CrossRef]
  5. Lyu, S.; Li, R.; Zhao, Y.; Li, Z.; Fan, R.; Liu, S. Green Citrus Detection and Counting in Orchards Based on YOLOv5-CS and AI Edge System. Sensors 2022, 22, 576. [Google Scholar] [CrossRef]
  6. Ye, Z.; Guo, Q.; Wei, J.; Zhang, J.; Zhang, H.; Bian, L.; Guo, S.; Zheng, X.; Cao, S. Recognition of terminal buds of densely-planted Chinese fir seedlings using improved YOLOv5 by integrating attention mechanism. Front. Plant Sci. 2022, 13, 991929. [Google Scholar] [CrossRef]
  7. Zhao, J.; Zhang, X.; Yan, J.; Qiu, X.; Yao, X.; Tian, Y.; Zhu, Y.; Cao, W. A Wheat Spike Detection Method in UA V Images Based on Improved YOLOv5. Remote Sens. 2021, 13, 3095. [Google Scholar] [CrossRef]
  8. Li, S.; Zhang, S.; Xue, J.; Sun, H. Lightweight target detection for the field flat jujube based on improved YOLOv5. Comput. Electron. Agric. 2022, 202, 107391. [Google Scholar] [CrossRef]
  9. Kamrul, M.H.; Rahman, M.; Robin, M.R.I.; Hossain, M.S.; Hasan, M.H.; Paul, P. A Deep Learning Based Approach on Categorization of Tea Leaf. In Proceedings of the International Conference on Computing Advancements (ICCA 2020), Dhaka, Bangladesh, 10–12 January 2020; Article No.: 72. pp. 1–8. [Google Scholar]
  10. Wei, K.; Chen, B.; Li, Z.; Chen, D.; Liu, G.; Lin, H.; Zhang, B. Classification of Tea Leaves Based on Fluorescence Imaging and Convolutional Neural Networks. Sensors 2022, 22, 7764. [Google Scholar] [CrossRef]
  11. Chen, Z.; He, L.; Ye, Y.; Chen, J.; Sun, L.; Wu, C.; Chen, L.; Wang, R. Automatic sorting of fresh tea leaves using vision-based recognition method. J. Food Process Eng. 2020, 43, e13474. [Google Scholar] [CrossRef]
  12. Cui, Q.; Yang, B.; Liu, B.; Li, Y.; Ning, J. Tea Category Identification Using Wavelet Signal Reconstruction of Hyperspectral Imagery and Machine Learning. Agriculture 2022, 12, 1085. [Google Scholar] [CrossRef]
  13. Yan, C.; Chen, Z.; Li, Z.; Liu, R.; Li, Y.; Xiao, H.; Lu, P.; Xie, B. Tea Sprout Picking Point Identification Based on Improved DeepLabV3+. Agriculture 2022, 12, 1594. [Google Scholar] [CrossRef]
  14. Chen, Y.T.; Chen, S.F. Localizing plucking points of tea leaves using deep convolutional neural networks. Comput. Electron. Agric. 2020, 171, 105298. [Google Scholar] [CrossRef]
  15. Tatsumi, K.; Igarashi, N.; Mengxue, X. Prediction of plant-Level tomato biomass and yield using machine learning with unmanned aerial vehicle imagery. Plant Methods 2021, 17, 77. [Google Scholar] [CrossRef] [PubMed]
  16. Lu, S.; Chen, W.; Zhang, X.; Karkee, M. Canopy-attention-YOLOv4-based immature/mature apple fruit detection on dense-foliage tree architectures for early crop load estimation. Comput. Electron. Agric. 2022, 193, 106696. [Google Scholar] [CrossRef]
  17. Lu, N.; Zhou, J.; Han, Z.; Li, D.; Cao, Q.; Yao, X.; Tian, Y.; Zhu, Y.; Cao, W.; Cheng, T. Improved estimation of aboveground biomass in wheat from RGB imagery and point cloud data acquired with a low-cost unmanned aerial vehicle system. Plant Methods 2019, 15, 17. [Google Scholar] [CrossRef] [Green Version]
  18. Yang, Q.; Shi, L.; Han, J.; Zha, Y.; Zhu, P. Deep convolutional neural networks for rice grain yield estimation at the ripening stage using UAV-based remotely sensed images. Field Crop. Res. 2019, 235, 142–153. [Google Scholar] [CrossRef]
  19. Han, L.; Yang, G.; Dai, H.; Xu, B.; Yang, H.; Feng, H.; Li, Z.; Yang, X. Modeling maize aboveground biomass based on machine learning approaches using UAV remote-sensing data. Plant Methods 2019, 15, 10. [Google Scholar] [CrossRef] [Green Version]
  20. Escalante, H.J.; Rodríguez-Sánchez, S.; Jiménez-Lizárraga, M.; MoralesReyes, A.; De La Calleja, J.; Vazquez, R. Barley yield and fertilization analysis from UAV imagery: A deep learning approach. Int. J. Remote Sens. 2019, 40, 2493–2516. [Google Scholar] [CrossRef]
  21. Wu, X.; Sahoo, D.; Hoi, S.C.H. Recent advances in deep learning for object detection. Neurocomputing 2020, 396, 39–64. [Google Scholar] [CrossRef] [Green Version]
  22. Qiu, Z.; Zhao, Z.; Chen, S.; Zeng, J.; Huang, Y.; Xiang, B. Application of an improved YOLOv5 algorithm in real-time detection of foreign objects by ground penetrating radar. Remote Sens. 2022, 14, 1895. [Google Scholar] [CrossRef]
  23. Woo, S.; Park, J.; Lee, J.Y.; Kweon, I.S. CBAM: Convolutional block attention module. In Proceedings of the 15th European Conference on Computer Vision; Springer: Munich, Germany, 2018; pp. 3–19. [Google Scholar]
  24. Bradley, A.P. The Use of the Area Under the ROC Curve in the Evaluation of Machine Learning Algorithms. Pattern Recognit. 1997, 30, 1145–1159. [Google Scholar] [CrossRef] [Green Version]
  25. Chollet, F. Xception: Deep Learning with Depth wise Separable Convolutions. In Proceedings of the 2017 IEEE Conference on Computer Vision and Pattern Recognition (CVPR), Honolulu, HI, USA, 21–26 July 2017; pp. 1800–1807. [Google Scholar]
  26. Ma, N.; Zhang, X.; Zheng, H.; Sun, J. ShuffleNet V2: Practical Guidelines for Efficient CNN Architecture Design. In Proceedings of the European Conference on Computer Vision (ECCV), Munich, Germany, 8–14 September 2018. [Google Scholar]
  27. Liu, S.; Huang, D.; Wang, Y. Receptive Field Block Net for Accurate and Fast Object Detection. arXiv 2018, arXiv:abs/1711.07767. [Google Scholar]
  28. Kubat, M.; Matwin, S. Addressing the Curse of Imbalanced Training Data Sets: One-sided Selection. In Proceedings of the 4th International Conference on Machine Learning, San Francisco, CA, USA, 8–12 July 1997. [Google Scholar]
  29. Huang, Q.; Xia, C.; Wu, C.; Li, S.; Wang, Y.; Song, Y.; Kuo, C.J. Semantic Segmentation with Reverse Attention. arXiv 2017, arXiv:abs/1707.06426. [Google Scholar]
  30. Ma, N.; Zhang, X.; Sun, J. Funnel Activation for Visual Recognition. arXiv 2020, arXiv:abs/2007.11824. [Google Scholar]
  31. Wang, J.; Chen, K.; Xu, R.; Liu, Z.; Loy, C.C.; Lin, D. CARAFE++: Unified Content-Aware ReAssembly of Features. IEEE Trans. Pattern Anal. Mach. Intell. 2022, 44, 4674–4687. [Google Scholar] [CrossRef]
  32. Rezatofighi, S.H.; Tsoi, N.; Gwak, J.; Sadeghian, A.; Reid, I.D.; Savarese, S. Generalized Intersection Over Union: A Metric and a Loss for Bounding Box Regression. In Proceedings of the 2019 IEEE/CVF Conference on Computer Vision and Pattern Recognition (CVPR), Long Beach, CA, USA, 15–20 June 2019; IEEE Conference: Piscataway, NJ, USA, 2019; pp. 658–666. [Google Scholar]
  33. Yu, J.; Jiang, Y.; Wang, Z.; Cao, Z.; Huang, T.S. UnitBox: An Advanced Object Detection Network. In Proceedings of the 24th ACM international Conference on Multimedia, Amsterdam, The Netherlands, 15–19 October 2016. [Google Scholar]
  34. Kingma, D.P.; Ba, J. Adam: A Method for Stochastic Optimization. arXiv preprint 2015, arXiv:1412.6980. [Google Scholar]
  35. Loshchilov, I.; Hutter, F. Fixing Weight Decay Regularization in Adam. arXiv 2017, arXiv:abs/1711.05101. [Google Scholar]
  36. Mureşan, H.; Oltean, M. Fruit recognition from images using deep learning. arXiv preprint 2017, arXiv:1712.00580. [Google Scholar] [CrossRef] [Green Version]
  37. Deng, L.; Yu, D. Deep learning: Methods and applications. Found. Trends Signal Process. 2014, 7, 197–387. [Google Scholar] [CrossRef] [Green Version]
  38. Lecun, Y.; Bengio, Y.; Hinton, G. Deep learning. Nature 2015, 521, 436–444. [Google Scholar] [CrossRef]
  39. Darwish, A.; Ezzat, D.; Hassanien, A.E. An optimized model based on convolutional neural networks and orthogonal learning particle swarm optimization algorithm for plant diseases diagnosis. Swarm Evol. Comput. 2020, 52, 100616. [Google Scholar] [CrossRef]
  40. Haase, D.; Amthor, M. Rethinking Depth wise Separable Convolutions: How In-tra-Kernel Correlations Lead to Improved MobileNets. In Proceedings of the 2020 IEEE/CVF Conference on Computer Vision and Pattern Recognition (CVPR), Seattle, WA, USA, 13–19 June 2020. [Google Scholar]
  41. Hinton, G.E.; Salakhutdinov, R.R. Reducing the dimensionality of data with neural networks. Science 2006, 313, 504–507. [Google Scholar] [CrossRef] [PubMed] [Green Version]
  42. Guo, Y.; Sun, L.; Zhang, Z.; He, H. Algorithm Research on Improving Activation Function of Convolutional Neural Networks. In Proceedings of the Chinese Control & Decision Conference, Nanchang, China, 3–5 June 2019; pp. 3582–3586. [Google Scholar]
  43. He, K.; Zhang, X.; Ren, S.; Sun, J. Spatial pyramid pooling in deep convolutional networks for visual recognition. IEEE Trans. Pattern Anal. Mach. Intell. 2015, 37, 1904–1916. [Google Scholar] [CrossRef] [PubMed]
  44. Wang, Q.; Teng, Z.; Xing, J.; Gao, J.; Hu, W.; Maybank, S. Learning attentions: Residual at-tentional siamese network for high performance online visual tracking. In Proceedings of the 2018 IEEE/CVF Conference on Computer Vision and Pattern Recognition(CVPR), Salt Lake City, UT, USA, 23 June 2018; pp. 4854–4863. [Google Scholar]
  45. Saxena, L.; Armstrong, L. A survey of image processing techniquesfor agriculture. In Proceedings of the Asian Federation for Information Technology in Agriculture, Hanoi, Vietnam, 24–26 November 2022; Australian Society of Information and Communication Technologies in Agriculture: Perth, Australia, 2022; pp. 401–413. [Google Scholar]
Figure 1. Research general framework.
Forests 13 02091 g001
Figure 2. Fuding white tea trees.
Forests 13 02091 g002
Figure 3. Flowchart of image processing steps.
Forests 13 02091 g003
Figure 4. Data set image sample.
Forests 13 02091 g004
Figure 5. Image labeling software.
Forests 13 02091 g005
Figure 6. Image enhancement sample.
Forests 13 02091 g006
Figure 7. YOLO network structure.
Forests 13 02091 g007
Figure 8. YOLOv5 network structure.
Forests 13 02091 g008
Figure 9. New backbone structure.
Forests 13 02091 g009
Figure 10. New neck structure.
Forests 13 02091 g010
Figure 11. Improved YOLOv5 network structure.
Forests 13 02091 g011
Figure 12. The changes of precision of different YOLOv5 models: (a) YOLOv5n; (b) YOLOv5s; (c) YOLOv5m; (d) YOLOv5l; (e) YOLOv5x; (f) Improved YOLOv5.
Forests 13 02091 g012
Figure 13. The changes of box_loss and obj_loss of different YOLOv5 models: (a-1) train/box_loss of YOLOv5n; (a-2) train/obj_loss of YOLOv5n; (a-3) val/box_loss of YOLOv5n; (a-4) val/obj_loss of YOLOv5n; (b-1) train/box_loss of YOLOv5s; (b-2) train/obj_loss of YOLOv5s; (b-3) val/box_loss of YOLOv5s; (b-4) val/obj_loss of YOLOv5s; (c-1) train/box_loss of YOLOv5m; (c-2) train/obj_loss of YOLOv5m; (c-3) val/box_loss of YOLOv5m; (c-4) val/obj_loss of YOLOv5m; (d-1) train/box_loss of YOLOv5l; (d-2) train/obj_loss of YOLOv5l; (d-3) val/box_loss of YOLOv5l; (d-4) val/obj_loss of YOLOv5l; (e-1) train/box_loss of YOLOv5x; (e-2) train/obj_loss of YOLOv5x; (e-3) val/box_loss of YOLOv5x; (e-4) val/obj_loss of YOLOv5x; (f-1) train/box_loss of improved YOLOv5; (f-2) train/obj_loss of improved YOLOv5; (f-3) val/box_loss of improved YOLOv5; (f-4) val/obj_loss of improved YOLOv5.
Forests 13 02091 g013aForests 13 02091 g013b
Figure 14. Confusion matrix of YOLOv5m and improved YOLOv5: (a) confusion matrix of YOLOv5m; (b) confusion matrix of improved YOLOv5.
Forests 13 02091 g014
Figure 15. Tea trees germination detection results: (a) tea trees germination detection results based on YOLOv5m; (b) tea trees germination detection results based on improved YOLOv5.
Forests 13 02091 g015
Table 1. Sony DSC-RX100M4 camera.
Camera LensISO SpeedResolutionMaximum Aperture
Zeiss Vario-Sonnar TISO-1253648 × 2736F1.8(W)~2.8(T)
Table 2. Relationship between forecast scenarios.
Positive CategoryNegative Category
Positive PredictionTrue Positive
(TP)
False Positive
(FP)
Negative PredictionFalse Negative
(FN)
True Negative
(TN)
Table 3. Training platform configuration.
SystemCPUGPUMemory
Windows 10 21H2Intel(R) Core i7-7820xNVIDIA GeForce GTX 108032 G
Table 4. Training information of different YOLOv5 models.
ModelEpochsConvergence Time
(h)
LayersParametersSize
(MB)
YOLOv5n2532.7732131,760,5184.2
YOLOv5s1962.4332137,012,82214.8
YOLOv5m2014.29429020,852,93442.6
YOLOv5l24615.46736746,108,27893.2
YOLOv5x23713.42244486,173,414173.5
Improved YOLOv51993.1791534,326,8158.8
Table 5. Detection results of six YOLOv5 models.
ModelTrain/
box_loss
Train/
obj_loss
PrecisionRecallmAP_0.5mAP_0.5:0.95Val/
box_loss
Val/
obj_loss
YOLOv5n0.0446350.0669010.713160.712910.702320.22580.0489750.059104
YOLOv5s0.0460340.0748280.734440.746270.746970.265340.0495540.055801
YOLOv5m0.04590.0671460.748940.75680.757550.268440.0468980.055746
YOLOv5l0.0443130.0662450.754490.73660.743730.265110.0479240.057541
YOLOv5x0.0462620.0706070.720620.751840.744890.25920.0484730.057528
Improved YOLOv50.0300590.0509680.949110.976420.913970.0523120.241390.055131
Publisher’s Note: MDPI stays neutral with regard to jurisdictional claims in published maps and institutional affiliations.

