Article

Determination Factors for the Spatial Distribution of Forest Cover: A Case Study of China’s Fujian Province

1
College of Economics and Management, Nanjing Forestry University, Nanjing 210037, China
2
Institute of Geographic Sciences and Natural Resources Research, Chinese Academy of Sciences, Beijing 100101, China
3
Wageningen School of Social Sciences, Wageningen University and Research, 6708 PB Wageningen, The Netherlands
4
Jiangsu Institute of Science and Technology Information, Nanjing 210037, China
*
Author to whom correspondence should be addressed.
Forests 2022, 13(12), 2070; https://doi.org/10.3390/f13122070
Submission received: 17 October 2022 / Revised: 1 December 2022 / Accepted: 2 December 2022 / Published: 5 December 2022
(This article belongs to the Special Issue Forest Ecological Management and Sustainable Development)

Abstract

:
Understanding the determination factors of the spatial distribution of forest cover is crucial for global forest governance. This study contributed a nuanced case, focusing on the determination factors for the spatial distribution of forest cover in Fujian Province, China, in 2020. In order to achieve this, a high-resolution GIS-based data set was used, and spatial auto-correlation and geographic detector approaches were adopted. Three findings are presented in the results. First, the spatial distribution of forest cover is affected by natural conditions. In regions with more precipitation, higher altitude, or cooler temperatures, forest cover is higher. The relationship between the spatial distribution of forest cover and slope is an inverted-U shape. Second, socioeconomic factors have a greater explanatory capacity. In particular, regions with dense populations or roads have less forest cover. Third, there is an inverted-U-shaped relationship between the spatial distribution of forest cover and GDP per capita. With the growth of GDP per capita, forest cover is first positive, but subsequently negative. The results indicate that natural factors could shape the spatial distribution of forest cover, while socioeconomic factors could play a more significant role in the spatial distribution of forest cover.

1. Introduction

The spatial distribution of forest cover has been uneven and dynamic across the globe. While tropical regions still experience deforestation, forest cover has expanded in Europe after a period of decline [1,2,3,4]. In recent decades, China has reversed the decline of forest cover and experienced net forest cover expansion [5], while its spatial distribution of forest cover is still uneven. For example, the forest cover of traditional forest regions in northeast China is shrinking, and forest cover in central and western China is still low, while forest cover in the south of China is gradually increasing [6].
The dynamic and uneven spatial distribution of forest cover prompts a need to identify the determination factors. With the advancement of GIS-based techniques, recent studies have shown an urgent need to unravel potential determination factors in various regions [7,8].
A great number of scholars have investigated the close relationship between topographical and climatic factors and the spatial distribution of forest cover [9,10,11,12]. For example, the forest cover of northeastern China is clustered in mountainous and hilly regions, and is affected by terrain and landform [13]. In addition, precipitation and altitude have a correlation, and they determine the spatial distribution of forest cover in the Qaidam Basin. Regions with higher precipitation in the Qaidam Basin have greater forest cover, and the largest forest cover is found between 3000 and 3500 m above sea level [14]. Additionally, forest cover decreases with an increase in temperature and a decrease in precipitation [9]. Against the background of climate change, the global spatial distribution of forest cover will continue to evolve. Specifically, in regions with high altitudes and heavy precipitation in the Boreal Zone, Atlantic Zone, and Continental Zone, rising temperatures will increase forest cover, while in regions with low elevations and poor precipitation in the Mediterranean, forest degradation will be severe [15]. Therefore, the natural environment can exert control over forest cover [16].
Recent studies have paid increasing attention to humans’ capacity to act upon the forest cover [17,18]. The transformation between a variety of land types brought on by the change in land use is the primary determination factor for the spatial distribution of forest cover [19]. In the context of population expansion, the spread of arable land and construction land has condensed the geographical extent of forests [20]. Subsequently, population shift, which is mainly manifested by the large-scale migration of rural populations to cities, has become prevalent [21], reducing the pressure on forests. Additionally, agricultural land productivity has increased, which has encouraged the conversion of agricultural land in forest margin regions to forests [22,23], or vice versa. With the growth of per capita income, the core demand of the public for forests has begun to convert from wood supply toward ecological services [24]. A great number of countries are gradually reducing deforestation and promoting afforestation. Electricity consumption is becoming increasingly popular, and a transition from traditional wood fuel to electricity and fossil energy has decreased the demand for fuel wood [25]. In particular, road infrastructure construction significantly reduces transportation costs, resulting in an expansion of the scope of forests available for lucrative cutting activities [26,27]. The influence of road infrastructure construction on the spatial distribution of forest cover cannot be overlooked [28,29].
China’s forest cover has steadily increased since the 1980s. However, from a spatial perspective, forest cover varies between regions [5]. Specifically, some provinces in southern China have taken the lead in increasing national forest cover. Fujian Province, located on China’s southeastern coast, is a typical case, with the percentage of forest cover increasing from 37 percent to 66.8 percent over the past four decades [30]. The spatial distribution of forest cover in Fujian Province reveals substantial variation between diverse regions. The issue of what factors determine the spatial distribution for forest cover has not yet been resolved.
Before 1949, socioeconomic retrogression and war in Fujian Province led to the destruction of original forests [5]. Over the next three decades, the percentage of forest cover in Fujian declined by ten percent [30]. With the rapid economic growth and remarkable social progress starting in the eastern coastal cities since the 1980s, forest cover of Fujian province has been steadily increasing. Additionally, transportation infrastructure, especially rural roads, has made great progress in the last twenty years, which lays the foundation for the flow of labor between regions and the substitution of fuel wood [31]. As a result, population emigration creates beneficial conditions for forest restoration in rural regions [19]. While observing the change in forest cover, the variation of socioeconomic factors is an important consideration [4]. The spatial distribution of forest cover reflects forest cover change intuitively. Will these socioeconomic factors influence the spatial distribution of forest cover? In addition, the eastern regions of Fujian Province are flat, while the central and western regions are mainly hills and mountains. With the variation in topography, the climate conditions also change [32]. Therefore, Fujian is a perfect case to explore the determination factors for the spatial distribution of forest cover. This paper used a spatial auto-correlation approach to analyze spatial distribution characteristics of forest cover at the county level. In addition, the geographic detector approach was adopted to investigate the determination factors for the spatial distribution of forest cover. Clarifying the determinants for the spatial distribution of forest cover can help achieve forest growth in developing countries experiencing population growth and economic development.
The rest of the paper is organized as follows. Section 2 describes the data sources and research methods. Section 3 describes our research results. Section 4 discusses the determination factors for the spatial distribution of forest cover. Section 5, finally, presents our conclusions.

2. Data Sources and Research Methods

2.1. Data Sources

Forest cover data for the Fujian province in 2020 was obtained from 30 m- resolution land use data. The natural environmental condition data, road density data, and land-use data were obtained from the Chinese Academy of Sciences’ resources and environment science data center. The land use data encompassed six categories of land: agricultural land, forestland, grassland, water area, construction land, and undeveloped land [33]. In order to measure the spatial distribution of forest cover in Fujian Province, forest refers to four sub-categories: closed forest, open forest, shrub, and other forest [16]. Forest cover in this study refers to the ratio of closed forest area to total land area. Due to the availability of climatic data, the average annual temperature and precipitation for each county-level jurisdiction were instead retrieved from the data from 2019. The social and economic data (population density, industry output, grain output, GDP, forestry production, and electricity consumption) were acquired from the statistical yearbook of Fujian Province and from the statistical yearbook of prefecture-level cities of Fujian Province.

2.2. Research Methods

2.2.1. Global Spatial Auto-Correlation

The spatial distribution of forest cover at the county level in Fujian Province was described using global spatial auto-correlation. The range [−1, 1] was used for the Global Moran’s I statistic. A significant and positive Moran’s I indicates that the region with a larger (smaller) amount of forest cover is spatially clustered. In contrast, if Moran’s I is strongly negative, there is a considerable geographical difference between the region and the surrounding area in terms of forest cover. If Moran’s I is near zero, forest cover is distributed randomly, or there is no geographical link. The formula for calculating Moran’s I is as follows:
I = ( n i j W ij ) i j W ij x i x ¯ x j x ¯ i x i x ¯ 2
where W ij is the spatial weight matrix, n is the number of regional elements, x i is the observed value of the ith regional element, and x ¯ is the average observed value.

2.2.2. Local Spatial Auto-Correlation

The local Moran’s I index reveals the similarity or connection of forest cover between a county-level jurisdiction and the neighboring county-level jurisdiction in Fujian Province. In addition, the global Moran’s I index is decomposed to the county level of Fujian province. Local spatial auto-correlation results include four types: H-H clustering type, L-L clustering type, H-L clustering type, and L-H clustering type. H-H clustering type refers to the high value of forest cover in the reference county-level jurisdiction, which is surrounded by county-level jurisdictions with a similarly high value of forest cover. L-L clustering type indicates that the reference county-level jurisdiction has a low value and is surrounded by other county-level jurisdictions with low values. H-L clustering type indicates that the reference unit has a high value and is surrounded by low-value units, whereas L-H clustering type indicates that the reference unit has a low value and is surrounded by high-value units. The formula of the local Moran’s I index is expressed as follows:
I i = y i y ¯ s 2 j = 1 n W ij y i y ¯
where s 2 is the discrete variance of y i , y ¯ is the mean, and W ij is the spatial weight matrix.

2.2.3. Geographical Detector

The geographical detector serves as a statistical method suitable for testing associations between a geographical phenomenon and its potential determination factors [34]. The geographical detector has proven its advantage in making no strict assumptions for explaining determination factors of geographical phenomena, which is suitable for exploratory studies. Based on spatial differentiation, this fundamental theory evaluates the consistency between potential determination factors and geographical phenomena. The potential determination factor should have a similar spatial distribution as the geographical phenomenon if potential determination factors have critical effects on the geographical phenomenon [35]. We selected 12 indicators from the natural environmental factors and socioeconomic factors (Table 1). Then, we applied the geographical detector to analyze potential determination factors in the forest cover in Fujian Province.
The mechanism of the geographical detector is as follows. First, Fujian was divided into n units, and the forest cover of every unit was recorded: y 1 ,   y 2 …… y n . In fact, the potential determination factors must be categorical variables in the geographical detector. However, the potential determination factors selected in this paper are all continuous variables. The natural discontinuity grading technique was taken to transform continuous variables into categorical variables. Based on the highest value, mean value, and standard deviation of continuous variables, the natural discontinuity grading technique was used to divide a continuous value into nine geographical strata ( X i , i = 1, 2…9). In particular, stratum 1 (category 1) suggests that the actual value of the determination factor was the smallest, whereas stratum 9 (category 9) suggests that the actual value was the largest. Then, the distribution of the forest cover was overlaid with the geographical stratum X. Every unit recorded the forest cover and each potential determination factor’s category. Then, two approaches for the geographical detector were adopted: factor detector and risk detector.
Factor detector calculates the explanatory power of each potential determination factor for the forest cover’s spatial distribution. In this study, q is defined as the difference between one and the ratio of accumulated dispersion variance of the forest cover of each sub-region to that of the entire study region. If factor X affects the forest cover, the dispersion variance of the forest cover in each sub-region will be small, whereas the variance between sub-regions will be large. In other words, when the factor completely explains the spatial distribution of forest cover, and the variance σ x , i 2 = 0, then the variance σ 2 ≠ 0 and q = 1; in contrast, when a factor is completely unrelated to forest cover, then q = 0. The q value ranges between [0, 1]. The effect of a determination factor on the spatial distribution of forest cover increases with q. Equation (3) shows the expression for the q value for the factor detector:
q = 1 1 N σ 2 i = 1 9 n x , i σ x , i 2
where N is the total number of units over the entire region, σ 2 is the variance between sub-regions, n x , i is the number of units in sub-region X i , and σ x , i 2 is the dispersion variance of the forest cover in each sub-region. The q value indicates the explanatory power of a determination factor on the distribution of forest cover.
The risk detector is usually used to examine the difference in average values between sub-regions of factor X. However, we focus on calculating the average values of forest cover in each sub-region X i . Equation (4) shows the expression for the average values of forest cover:
Y x , i = k = 1 m y m m
where Y x , i is the mean of forest cover in sub-region X i , m is the number of units in sub-region X i , and y m is the forest cover of each unit.

3. Research Results

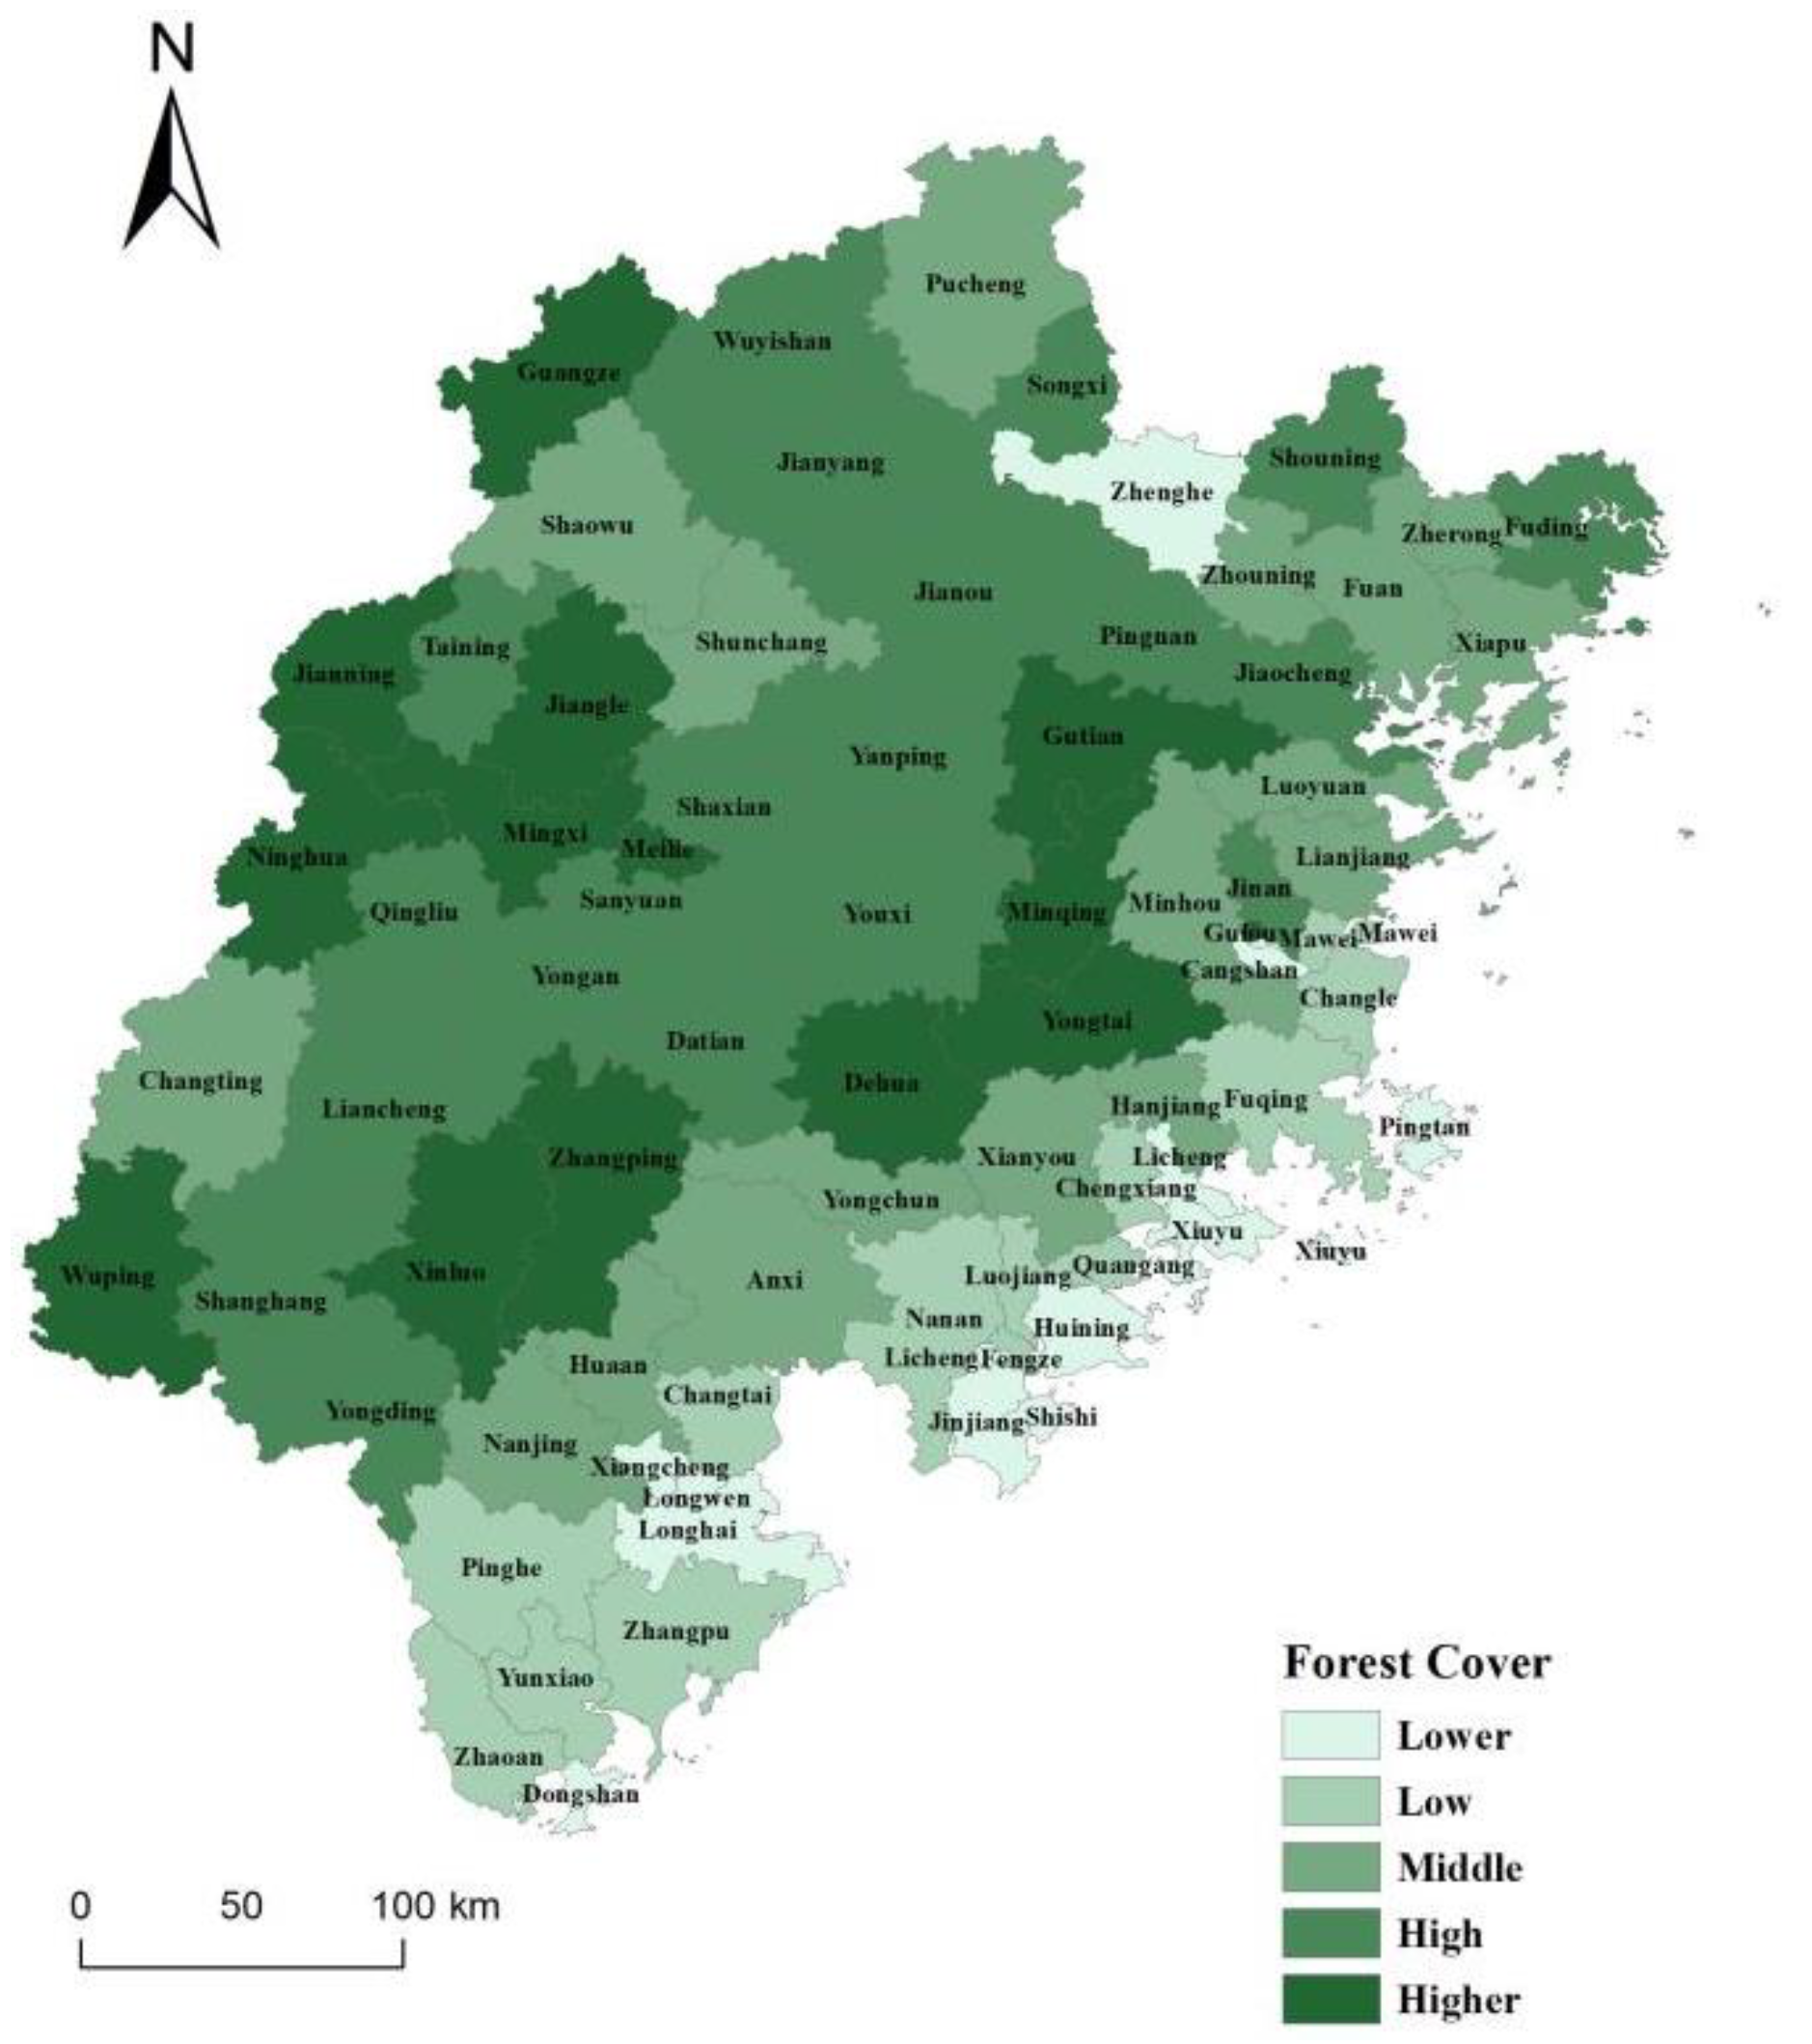
3.1. Spatial Distribution of Forest Cover

We categorized forest cover into five levels based on the natural discontinuity grading method: lower, low, middle, high, and higher. The forest cover in the majority of county-level jurisdictions is middle or above, with 51 county-level jurisdictions accounting for 65.4 percent. Only a small number of county-level jurisdictions (27, representing 34.6%) did not meet the middle level of forest cover. In particular, high forest covers are concentrated in the central and western county-level jurisdictions of Fujian Province. Forest cover showed a declining trend eastward (Figure 1).

3.2. Global Spatial Auto-Correlation

ArcGIS software was used to examine global spatial auto-correlation. Moran’s I value for forest cover at the county level in Fujian province was 0.4246. Thus, the spatial distribution of forest cover in Fujian Province showed a positive correlation and had certain spatial agglomeration distribution characteristics (Table 2).

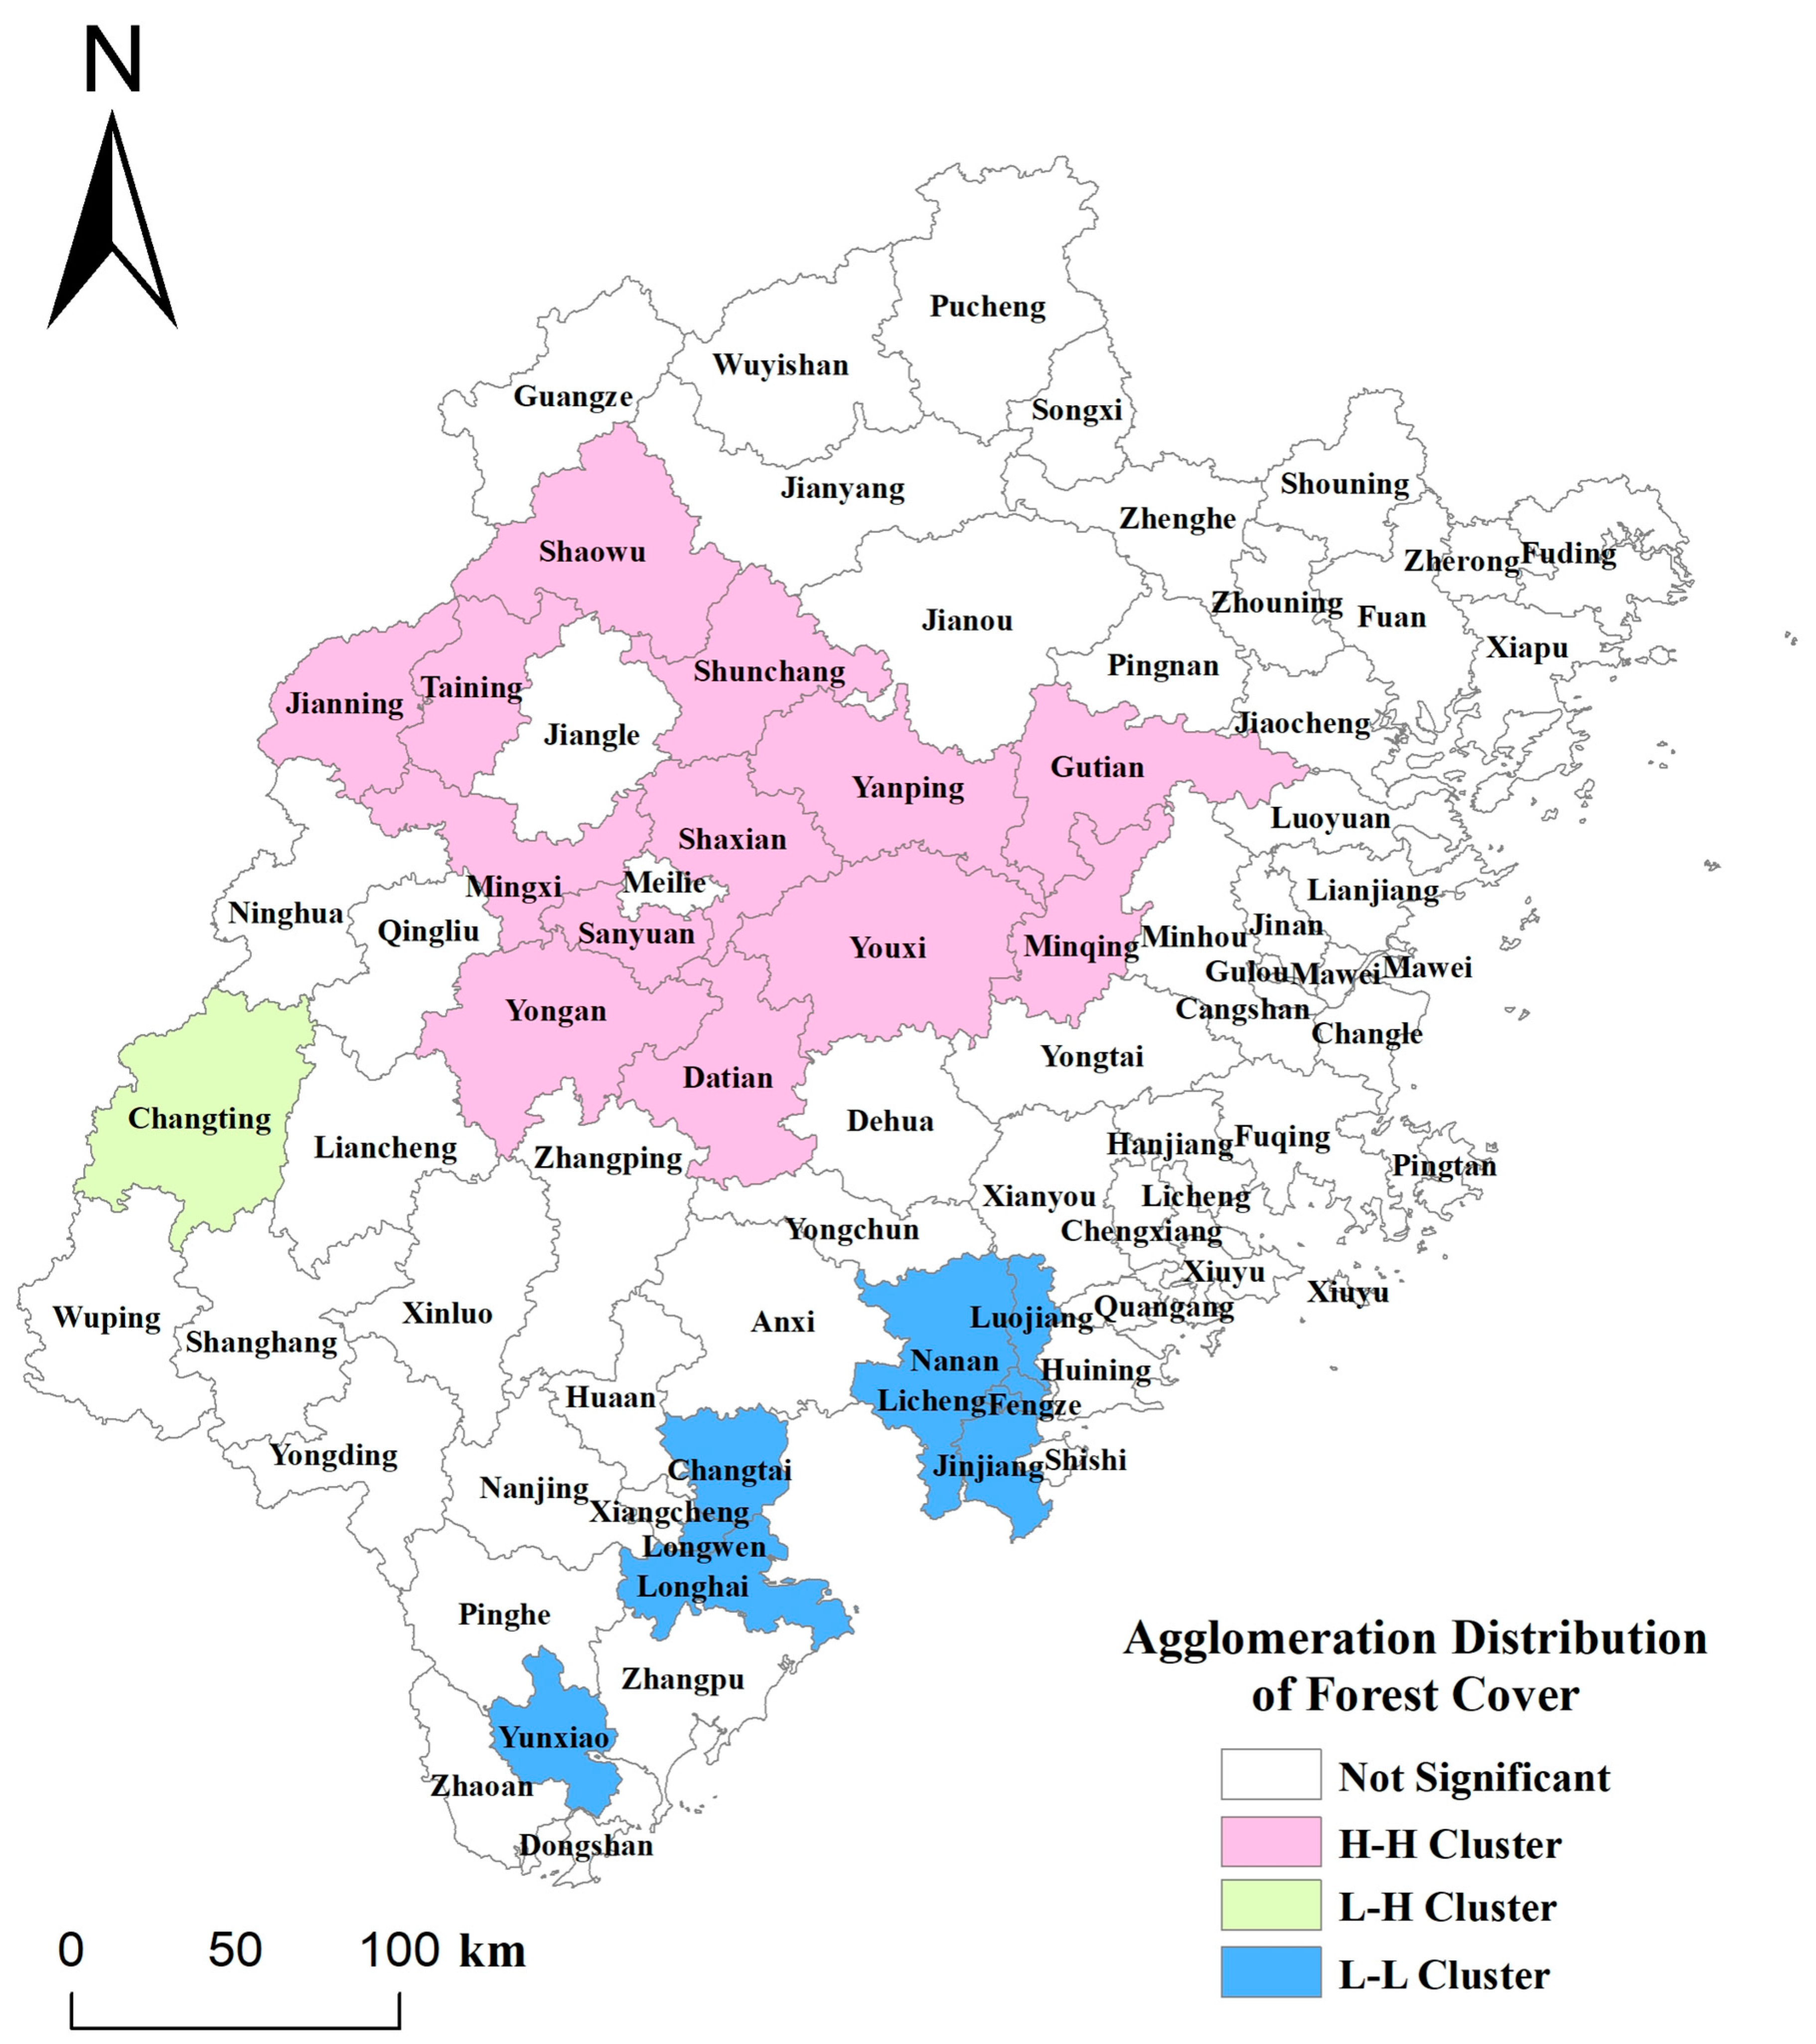
3.3. Local Spatial Auto-Correlation

Based on the local spatial auto-correlation analysis of forest cover at the county level in Fujian Province, the results showed that most county-level jurisdictions demonstrated non-significant spatial patterns (see Table 3). The corresponding spatial agglomeration distribution map showed how forest cover was distributed (see Figure 2). In particular, the positive correlation type includes H-H clustering type and L-L clustering type, while the negative correlation type includes H-L clustering type and L-H clustering type.
In conjunction with Table 3 and Figure 2, the local spatial auto-correlation analysis of forest cover indicated that H-H and L-L accounted for 14 and 10 county-level jurisdictions, or 17.95% and 12.82% of the total number of county-level jurisdictions, respectively. H-L and L-H clustering types accounted for 0 and 1 county-level jurisdictions, or 1.28% of the total number of county-level jurisdictions, among those with negative correlation values. Fifty-three county-level jurisdictions were insignificant, constituting 67.95% of the total. The spatial distribution of positive and negative correlation types varied tremendously. The H-H cluster type mostly created a loop-shaped block distribution in the center, and was located in the western portions of Sanming City, Fuzhou City, the southwestern portion of Ningde City, and the confluence of the southwestern portions of Nanping City and Sanming City. The majority of L-L clusters were located in the south of Quanzhou City, and in the northeast and south of Zhangzhou City. The majority of L-H clusters were found in the northwest portion of Longyan City.

3.4. Geographic Detector Results

3.4.1. Factor Detector Results

Several variables affected the spatial distribution of forest cover in Fujian Province. The factor detector results from the geographical detector revealed the q and p values of each variable that might impact the spatial distribution of forest cover, which were then ranked according to the explanatory power of each determination factor (Table 4). Overall, the q value of socioeconomic factors was greater than that of natural environmental factors. In other words, natural environmental factors affected the spatial distribution of forest cover, but their explanatory power was less powerful than that of socioeconomic factors.
Among the natural environmental factors, climate factors had the greatest influence on the spatial distribution of forest cover. The slope had comparably low explanatory power for forest cover, and the q value was significantly less than 0.1 (q = 0.045). The explanatory power of slope was the lowest among all selective factors, diminishing the explanatory power of topography for the spatial distribution of forest cover. However, temperature had a greater explanatory power for the spatial distribution of forest cover (q = 0.309) compared to other natural environmental conditions. The explanatory power of elevation and precipitation was, respectively, 0.277 and 0.266. Therefore, the impacts of elevation and precipitation on the spatial distribution of forest cover were nearly identical. In general, natural environmental factors, such as annual average temperature, elevation, and precipitation, had significant impacts on the spatial distribution of forest covers. Dire environmental circumstances were the limiting factors of forest cover.
Among socioeconomic factors, population density had the strongest explanatory power for the spatial distribution of forest cover (q = 0.566), indicating that population density played a key role in the spatial distribution of forest cover. Moreover, the effect of road density on the spatial distribution of forest cover should not be overlooked. The explanatory power of road density ranked second, only lower than population density (q = 0.418). The spatial distribution of forest cover was closely associated with economic development in various locations. The explanatory power of rural household per capita disposable income and per capita GDP for the spatial distribution of forest cover was 0.316 and 0.267, respectively. Moreover, household electricity consumption and tertiary industry production value had nearly identical impacts on the spatial distribution of forest cover. The explanatory power of household electricity consumption and tertiary industry production value was 0.306 and 0.304. Similarly, the explanatory power of grain output per unit area and forestry output value was 0.273 and 0.242. Overall, socioeconomic factors played an essential role in the spatial distribution of forest cover.

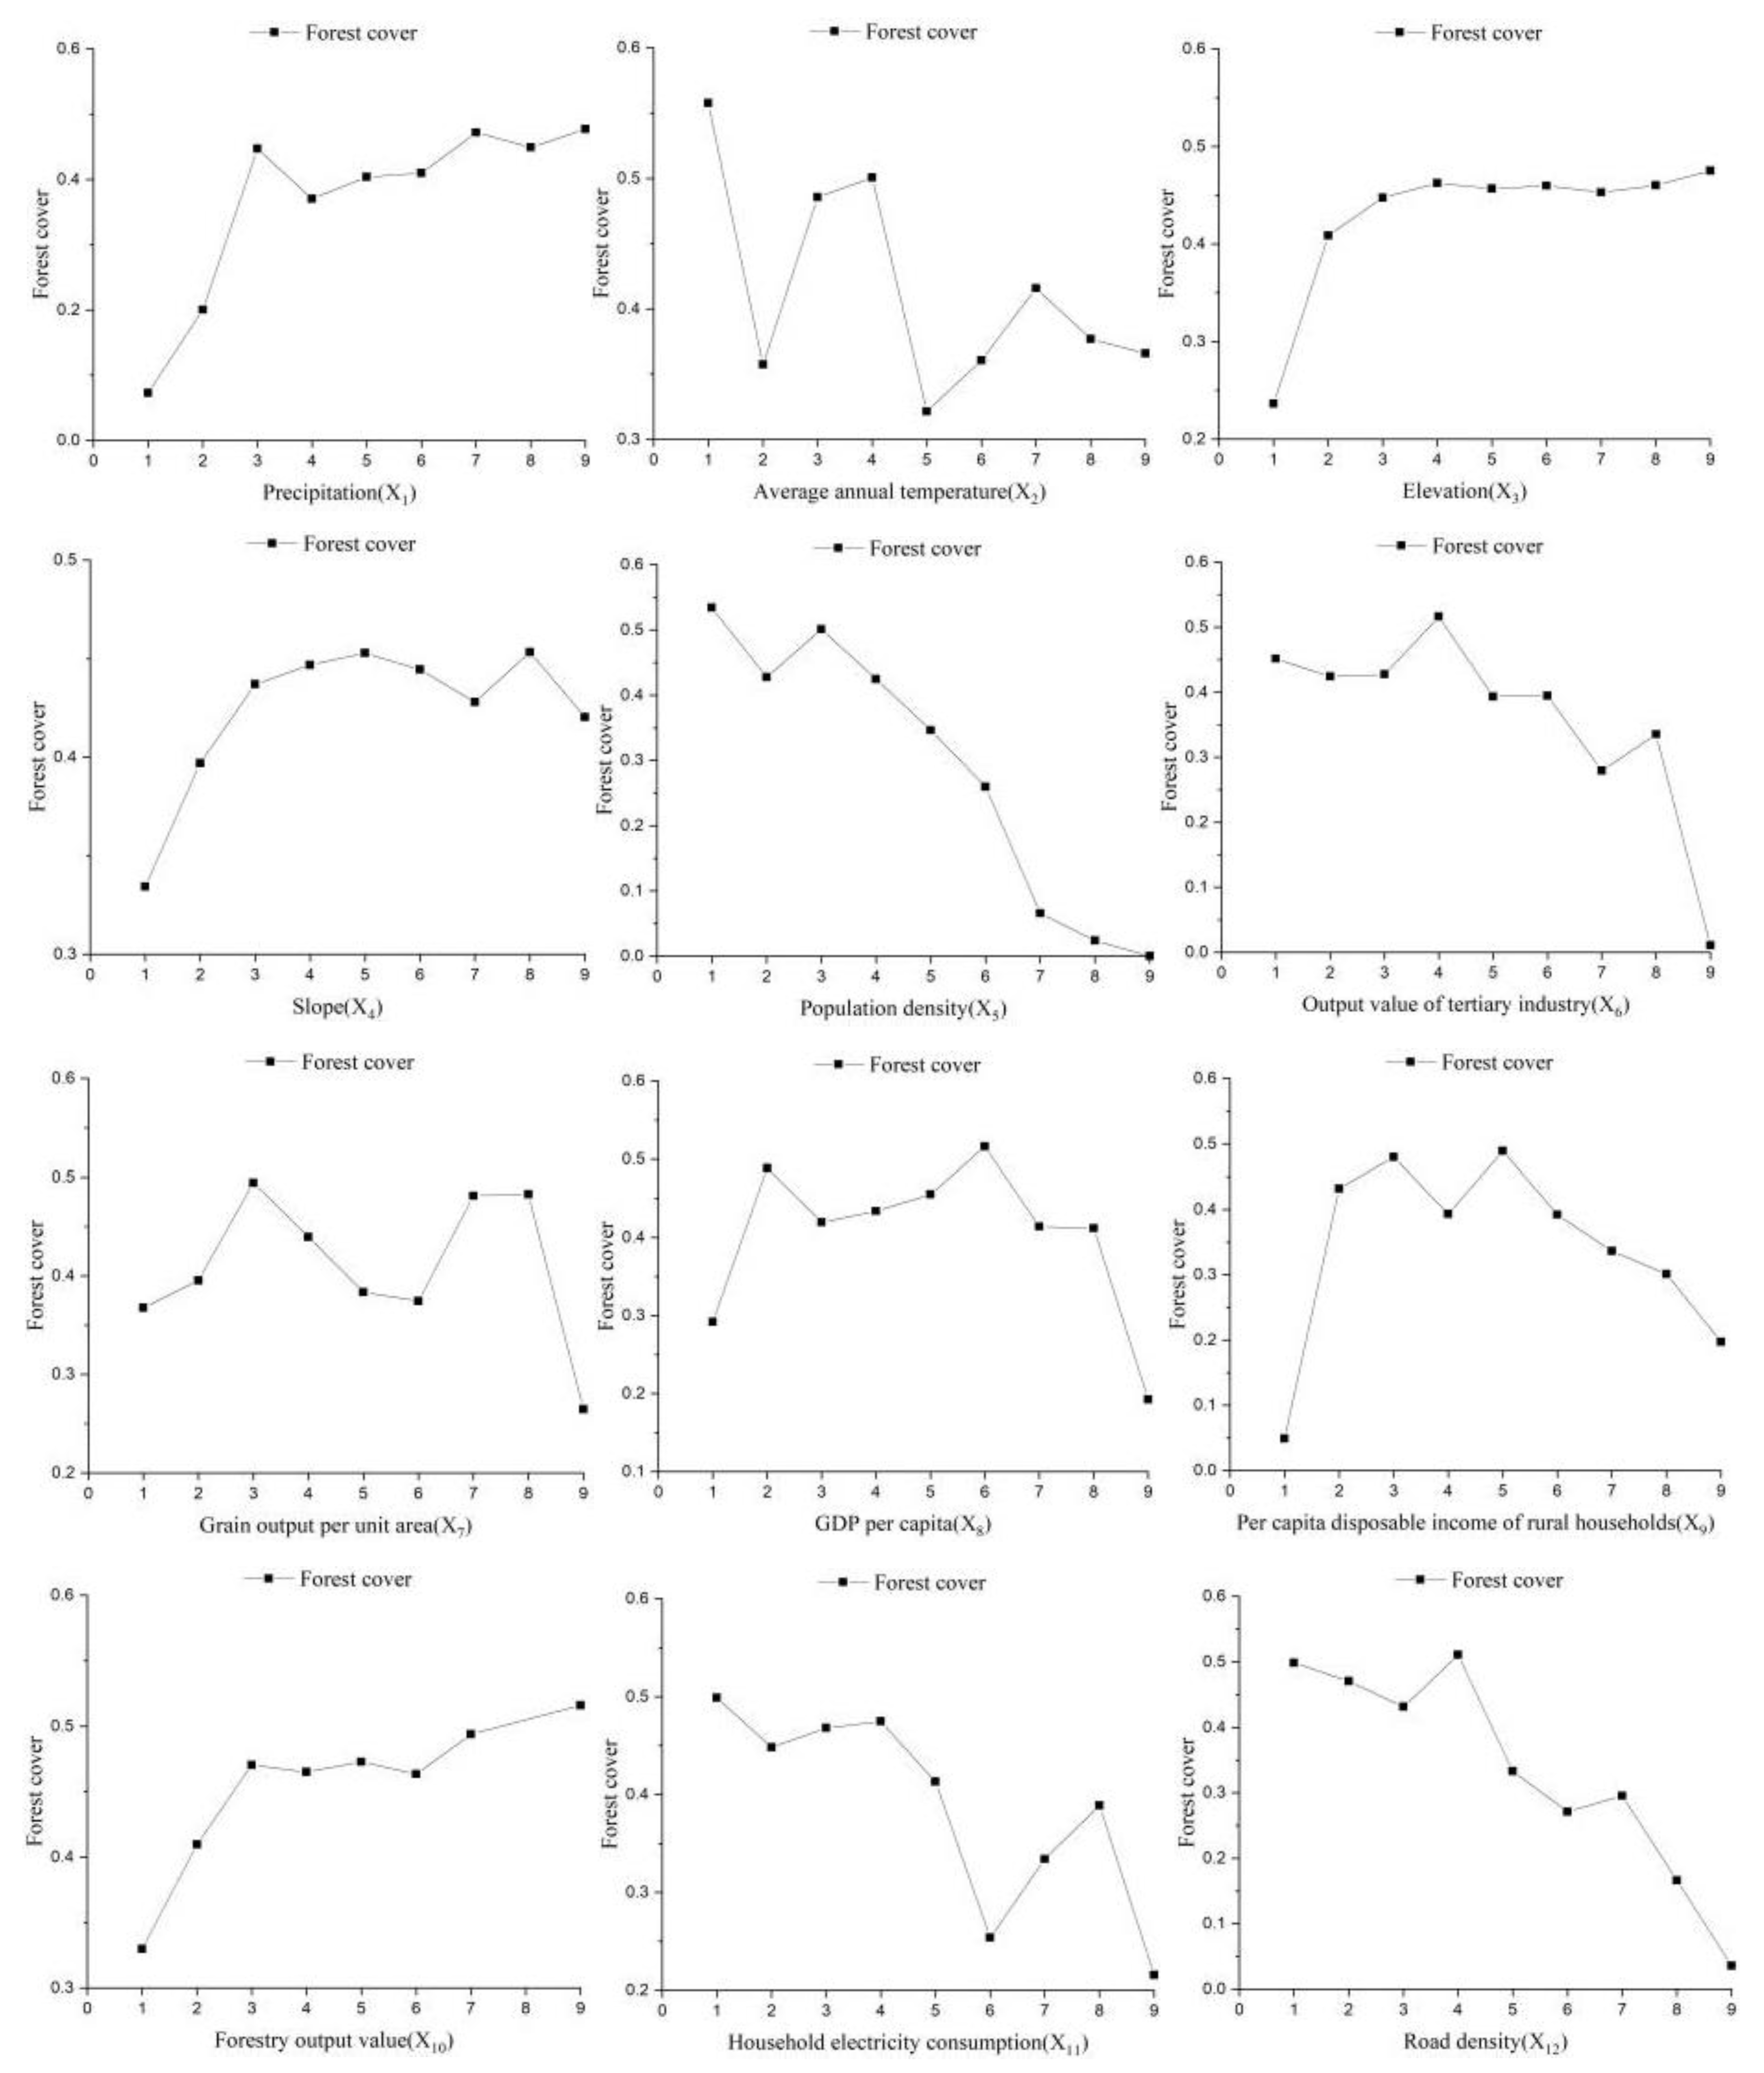
3.4.2. Risk Detector Results

According to the results of the risk detector (see Figure 3), the forest cover was higher in regions with more precipitation or higher altitude. Within a specific range, the forest cover constantly grew with the increase in regional slope, but when the slope surpassed a particular threshold, forest cover began to decrease. There was no evident change between forest cover and annual average temperature; however, the high value of forest cover was relatively concentrated in county-level jurisdictions with a lower annual average temperature.
Among the social and economic factors, population density, tertiary industry output value, and road density may be detrimental to regional forest covers. According to the results in Figure 3, county-level jurisdictions with denser populations or roads were prone to lower forest covers. The output value of the tertiary industry and forest cover also showed a similar relationship. Lifestyle usually interacted with population size and economic structure. Regions with a high output value for the tertiary industry possibly had better development, which tended to attract a large number of migrants. Therefore, the forest cover in regions with higher household electricity consumption also showed a downward trend. The spatial distribution of forest cover had an inverted U-shaped relationship with regional per capita GDP, as well as with household per capita disposable income level. Specifically, the higher the forestry output value was, the higher the forest cover was, indicating that the development of the forestry industry could promote regional forest cover. Moreover, the spatial distribution of forest cover and grain yield per unit area exhibited M-shaped fluctuations.

4. Discussion

Understanding the determinators for the spatial distribution of forest cover is crucial for forest governance. Through the case study on Fujian Province of China, twelve indicators, regarding the natural environmental conditions and socioeconomic factors, were chosen, and the determination factors for the spatial distribution of forest cover were identified. Compared with previous results, our findings have both similarities and differences.
To a certain extent, the natural environmental conditions had the explanatory power for the spatial distribution of forest cover. Regions with adequate precipitation, suitable temperature, steep terrain, and high elevation are prone to having a higher forest cover. The eastern regions of Fujian Province consist primarily of plains with flat topography and limited precipitation. The middle and western regions of Fujian Province are dominated by mountains and hills, with a complex topography and high elevation. Influenced by the elevation, precipitation increases gradually from east to west in Fujian Province. Consequently, the middle and western regions of Fujian Province develop a favorable natural environment for forest growth. Forest covers have formed agglomeration distribution in the central and western regions of Fujian Province. Therefore, diversities in natural environmental conditions result in the uneven distribution of forest cover.
Among social and economic factors, population density is the most powerful in explaining the spatial distribution of forest cover. The higher the population density is, the lower the forest cover will be. The finding confirms Wright and Sandel’s assertion that humans have the largest impact on existing forest cover [36,37]. On the other hand, Sloan stressed the synergistic influence of population density and other factors on forest cover [38]. This study discovered a particular association between population density, road density, the production value of the tertiary industry, and the spatial distribution of forest cover. Similarly, regions with higher road density or higher tertiary industrial output value have lower forest cover. The development of roads in the east of Fujian Province is useful for those who wish to move from the central and western regions to the eastern regions of Fujian Province. The road weakens the centrifugal force caused by the transportation cost of spatial distance. The migration of a large number of people has provided labor for the development of the tertiary industry in the eastern regions of Fujian Province [39]. Population aggregation and industry growth give rise to the expansion of built-up land and industrial land; as a result, deforestation speeds up [40]. Furthermore, the extension of human production and living space in the east has led to a rise in household electricity consumption. Consequently, regions with high household electricity consumption have a comparatively low forest cover [21,41]. In the central and western regions of Fujian Province, the high altitude and complicated terrain naturally protects forests from destruction. Due to the poor road construction in the mid-west of Fujian Province, a growing number of residents are choosing to emigrate, and the pressure of population on forest cover has gradually decreased. This result is also consistent with the literature, which suggests that roads are the primary cause of deforestation [42,43,44,45].
The relationship between forest cover and per capita GDP, as well as per capita income of rural households, has an inverted U shape. Economic development increases the opportunity cost of farming, and rural residents gradually prefer to engage in industrial activities and live in urban areas [21,39]. Consequently, agricultural land becomes vacant and is, naturally, turned into forest. Woodland, on the other hand, is changed into industrial land and urban land to meet the demands of industrial expansion and urban construction. The eastern regions of Fujian Province possess the endowment advantages of economic development. In the past several decades, the eastern regions of Fujian Province have realized the circular accumulation of resource elements and industrial growth. Meanwhile, various factor endowments in the central and western regions have gradually become attracted to the eastern regions of Fujian Province. The central and western regions of Fujian Province have formed conditions for the recovery and growth of forest resources, which further explains the agglomeration distribution of forest cover in the mid-west. This result confirms Caravaggio’s conclusion that the potential for economic growth to improve the growth of forest cover is limited [46]. In other words, the forest cover will reach a turning point of growth and cease increasing when the economic level reaches a certain point.
The spatial distribution of forest cover can be explained by the forestry production value. In particular, a region with a higher forestry output value has a higher forest cover. While the satisfaction of local timber demand depends on the availability of local timber, the boom in timber demand can play a key role in promoting the increase in forest cover [47]. Similarly, forest cover is currently high in the mid-west and low in the eastern regions of Fujian Province, according to the output of timber production. With the timber demand increasing, the coverage of forests will continue growing in the central and western regions of Fujian Province.
Despite the valuable findings of this study, several limitations do exist and deserve future advancement. First, considering that the results and the determination factors of the distribution of forest cover fluctuate depending on the historical context, cross-sectional analysis is insufficiently persuasive. Second, more determination factors could be incorporated into the analysis with the increasing availability of socioeconomic data.

5. Conclusions

This paper focused on the determination factors for the spatial distribution of forest cover. We used a 30 m resolution GIS-based data set and socioeconomic data set. Spatial auto-correlation and geographic detector approaches were adopted. This paper revealed the influence of natural environmental and socioeconomic factors on the spatial distribution of forest cover at a county-level jurisdiction. The results indicate that natural environmental factors could shape the spatial distribution of forest cover, while socioeconomic variables could play a more significant role in the spatial distribution of forest cover. This is primarily due to the limited control that natural environmental factors have over forest growth, whereas the progress of human beings’ capacity to interfere with forests can further change the spatial distribution of forest cover. Concerning the effect of time on the spatial distribution of forest cover, future studies could investigate the factors influencing the spatial distribution of forest cover in various temporal scenarios.

Author Contributions

Conceptualization, J.D., W.L. and X.L.; methodology, J.D., W.L. and X.L.; validation, J.D. and C.Z.; formal analysis, J.D. and C.Z.; data curation, J.D. and C.Z.; writing—original draft preparation, J.D. and C.Z.; writing—review and editing, W.L. and X.L.; visualization, C.Z.; funding acquisition, J.D. All authors have read and agreed to the published version of the manuscript.

Funding

This research was funded by China Postdoctoral Science Foundation, grant number 2018-1563.

Data Availability Statement

Not applicable.

Acknowledgments

We are grateful to the anonymous reviewers for their constructive reviews.

Conflicts of Interest

The authors declare no conflict of interest.

References

  1. Mather, A.S. Forest transition theory and the reforesting of Scotland. Scott. Geogr. J. 2004, 120, 83–98. [Google Scholar] [CrossRef]
  2. Barbier, E.B.; Burgess, J.C. The economics of tropical deforestation and land use: An introduction to the special issue. Land Econ. 2001, 77, 155–171. [Google Scholar] [CrossRef]
  3. Laso Bayas, J.C.; See, L.; Georgieva, I.; Schepaschenko, D.; Danylo, O.; Dürauer, M.; Bartl, H.; Hofhansl, F.; Zadorozhniuk, R.; Burianchuk, M. Drivers of tropical forest loss between 2008 and 2019. Sci. Data 2022, 9, 146. [Google Scholar] [CrossRef] [PubMed]
  4. Geist, H.J.; Lambin, E.F. Proximate Causes and Underlying Driving Forces of Tropical DeforestationTropical forests are disappearing as the result of many pressures, both local and regional, acting in various combinations in different geographical locations. BioScience 2002, 52, 143–150. [Google Scholar] [CrossRef] [Green Version]
  5. Li, L.; Chhater, A.; Liu, J. Multiple drivers and pathways to China’s forest transition. For. Policy Econ. 2019, 106, 101962. [Google Scholar] [CrossRef]
  6. Xu, X.; Liu, J.; Zhuang, D.; Zhang, S. Spatial-Temporal Dynamic Characteristics and Driving Forces of Forestland Resources in China; Journal of Beijing Forestry University: Beijing, China, 2004; pp. 41–46. [Google Scholar]
  7. Niu, X.; Hu, Y.; Lei, Z.; Yan, H.; Ye, J.; Wang, H. Temporal and Spatial Evolution Characteristics and Its Driving Mechanism of Land Use/Cover in Vietnam from 2000 to 2020. Land 2022, 11, 920. [Google Scholar] [CrossRef]
  8. Demissie, F.; Yeshitila, K.; Kindu, M.; Schneider, T. Land use/Land cover changes and their causes in Libokemkem District of South Gonder, Ethiopia. Remote Sens. Appl. Soc. Environ. 2017, 8, 224–230. [Google Scholar] [CrossRef]
  9. Redo, D.J.; Aide, T.M.; Clark, M.L. The relative importance of socioeconomic and environmental variables in explaining land change in Bolivia, 2001–2010. Ann. Assoc. Am. Geogr. 2012, 102, 778–807. [Google Scholar] [CrossRef]
  10. Gerhardt, F.; Foster, D.R. Physiographical and historical effects on forest vegetation in central New England, USA. J. Biogeogr. 2002, 29, 1421–1437. [Google Scholar] [CrossRef] [Green Version]
  11. Schulz, J.J.; Cayuela, L.; Rey-Benayas, J.M.; Schröder, B. Factors influencing vegetation cover change in Mediterranean Central Chile (1975–2008). Appl. Veg. Sci. 2011, 14, 571–582. [Google Scholar] [CrossRef]
  12. Kanade, R.; John, R. Topographical influence on recent deforestation and degradation in the Sikkim Himalaya in India; Implications for conservation of East Himalayan broadleaf forest. Appl. Geogr. 2018, 92, 85–93. [Google Scholar] [CrossRef]
  13. Zhang, Q.; Ren, R.; Zhao, L. Spatial distribution pattern and influencing factors of forest in Northeast China. J. Northeast. Froestry Unversity 2013, 41, 25–28. [Google Scholar]
  14. Zhu, W.B.; Lv, A.F.; Jia, S.F. Spatial distribution of vegetation and the influencing factors in Qaidam Basin based on NDVI. J. Arid. Land 2011, 3, 85–93. [Google Scholar] [CrossRef] [Green Version]
  15. Spathelf, P.; van der Maaten, E.; van der Maaten-Theunissen, M.; Campioli, M.; Dobrowolska, D. Climate change impacts in European forests: The expert views of local observers. Ann. For. Sci. 2014, 71, 131–137. [Google Scholar] [CrossRef] [Green Version]
  16. Huang, W.; Deng, X.; Lin, Y.; Jiang, Q. An Econometric Analysis of Causes of Forestry Area Changes in Northeast China. Procedia Environ. Sci. 2010, 2, 557–565. [Google Scholar] [CrossRef] [Green Version]
  17. Rodríguez García, V.; Caravaggio, N.; Gaspart, F.; Meyfroidt, P. Long- and Short-Run Forest Dynamics: An Empirical Assessment of Forest Transition, Environmental Kuznets Curve and Ecologically Unequal Exchange Theories. Forests 2021, 12, 431. [Google Scholar] [CrossRef]
  18. Senf, C.; Seidl, R. Mapping the coupled human and natural disturbance regimes of Europe’s forests. BioRxiv 2020. [Google Scholar] [CrossRef] [Green Version]
  19. Lambin, E.F.; Meyfroidt, P. Global land use change, economic globalization, and the looming land scarcity. Proc. Natl. Acad. Sci. USA 2011, 108, 3465–3472. [Google Scholar] [CrossRef] [Green Version]
  20. Singh, M.P.; Bhojvaid, P.P.; de Jong, W.; Ashraf, J.; Reddy, S.R. Forest transition and socio-economic development in India and their implications for forest transition theory. For. Policy Econ. 2017, 76, 65–71. [Google Scholar]
  21. Zhang, W.; Chong, Z.; Li, X.; Nie, G. Spatial patterns and determinant factors of population flow networks in China: Analysis on Tencent Location Big Data. Cities 2020, 99, 102640. [Google Scholar] [CrossRef]
  22. Michon, G.; de Foresta, H.; Levang, P.; Verdeaux, F. Domestic forests: A new paradigm for integrating local communities’ forestry into tropical forest science. Ecol. Soc. 2007, 12, 1. [Google Scholar] [CrossRef]
  23. Leblois, A.; Damette, O.; Wolfersberger, J. What has driven deforestation in developing countries since the 2000s? Evidence from new remote-sensing data. World Dev. 2017, 92, 82–102. [Google Scholar] [CrossRef]
  24. Liu, S.; Yang, Y.; Wang, H. Strategies and countermeasures for the development of plantation management in China: From single-objective management of seeking wood production to multi-objective management of enhancing ecosystem service quality and benefit. Acta Ecol. Sin. 2018, 38, 1–10. [Google Scholar]
  25. Kull, C.A.; Ibrahim, C.K.; Meredith, T.C. Tropical forest transitions and globalization: Neo-liberalism, migration, tourism, and international conservation agendas. Soc. Nat. Resour. 2007, 20, 723–737. [Google Scholar] [CrossRef]
  26. Laurance, W.F.; Campbell, M.J.; Alamgir, M.; Mahmoud, M.I. Road Expansion and the Fate of Africa’s Tropical Forests. Front. Ecol. Evol. 2017, 5, 75. [Google Scholar] [CrossRef] [Green Version]
  27. Pfaff, A.; Robalino, J.; Walker, R.; Aldrich, S.; Caldas, M.; Reis, E.; Perz, S.; Bohrer, C.; Arima, E.; Laurance, W.; et al. Road investments, spatial spillovers, and deforestation in the Brazilian Amazon. J. Reg. Sci. 2007, 47, 109–123. [Google Scholar] [CrossRef] [Green Version]
  28. Asher, S.; Garg, T.; Novosad, P. The ecological impact of transportation infrastructure. Econ. J. 2020, 130, 1173–1199. [Google Scholar] [CrossRef] [Green Version]
  29. Deng, X.; Huang, J.; Uchida, E.; Rozelle, S.; Gibson, J. Pressure cookers or pressure valves: Do roads lead to deforestation in China? J. Environ. Econ. Manag. 2011, 61, 79–94. [Google Scholar] [CrossRef]
  30. China Forestry Information Network [EB/OL]. Available online: http://www.lknet.ac.cn/ (accessed on 16 August 2022).
  31. Alamgir, M.; Campbell, M.; Sloan, S.; Goosem, M.; Clements, G.R.; Ibrahim-Mahmoud, M.; Laurance, W.F. Economic, Socio-Political and Environmental Risks of Road Development in the Tropics. Curr. Biol. 2017, 27, 1130–1140. [Google Scholar] [CrossRef] [Green Version]
  32. Breda, N.; Peuffer, M. Vulnerability to forest decline in a context of climate changes: New prospects about an old question in forest ecology. Ann. For. Sci. 2014, 71, 627–631. [Google Scholar] [CrossRef]
  33. Resources and Environmental Science and Data Center, Chinese Academy of Sciences [EB/OL]. Available online: www.resdc.cn/ (accessed on 25 July 2022).
  34. Wang, J.; Xu, C. Geodetector: Principles and Prospects. Acta Geogr. Sin. 2017, 72, 116–134. [Google Scholar]
  35. Ju, H.; Zhang, Z.; Zuo, L.; Wang, J.; Zhang, S.; Wang, X.; Zhao, X. Driving forces and their interactions of built-up land expansion based on the geographical detector–a case study of Beijing, China. Int. J. Geogr. Inf. Sci. 2016, 30, 2188–2207. [Google Scholar] [CrossRef]
  36. Wright, S.J.; Muller-Landau, H.C. The Future of Tropical Forest Species1. Biotropica 2006, 38, 287–301. [Google Scholar] [CrossRef]
  37. Sandel, B.; Svenning, J. Human impacts drive a global topographic signature in tree cover. Nat. Commun. 2013, 4, 2474. [Google Scholar] [CrossRef] [PubMed]
  38. Sloan, S. Fewer people may not mean more forest for Latin American forest frontiers. Biotropica 2007, 39, 443–446. [Google Scholar] [CrossRef]
  39. Halas, M.; Klapka, P.; Tonev, P. The use of migration data to define functional regions: The case of the Czech Republic. Appl. Geogr. 2016, 76, 98–105. [Google Scholar] [CrossRef]
  40. Li, X.; Zhang, Y.; Liu, Y.; Zhao, T. Dynamic Evolution and Future Prediction of Land Use Patterns in the Arid Desert Region of Northwest China from 1990 to 2020. Forests 2022, 13, 1570. [Google Scholar] [CrossRef]
  41. Lorenzen, M.; Orozco-Ramírez, Q.; Ramírez-Santiago, R.; Garza, G.G. Migration, socioeconomic transformation, and land-use change in Mexico’s Mixteca Alta: Lessons for forest transition theory. Land Use Policy 2020, 95, 104580. [Google Scholar] [CrossRef]
  42. Laurance, W.F.; Peletier-Jellema, A.; Geenen, B.; Koster, H.; Verweij, P.; Van Dijck, P.; Lovejoy, T.E.; Schleicher, J.; Van Kuijk, M. Reducing the global environmental impacts of rapid infrastructure expansion. Curr. Biol. 2015, 25, 259–262. [Google Scholar] [CrossRef] [Green Version]
  43. Freitas, S.R.; Hawbaker, T.J.; Metzger, J.P. Effects of roads, topography, and land use on forest cover dynamics in the Brazilian Atlantic Forest. For. Ecol. Manag. 2010, 259, 410–417. [Google Scholar] [CrossRef]
  44. Barber, C.P.; Cochrane, M.A.; Souza, C.M., Jr.; Laurance, W.F. Roads, deforestation, and the mitigating effect of protected areas in the Amazon. Biol. Conserv. 2014, 177, 203–209. [Google Scholar] [CrossRef]
  45. Hughes, A.C. Understanding and minimizing environmental impacts of the Belt and Road Initiative. Conserv. Biol. 2019, 33, 883–894. [Google Scholar] [CrossRef] [PubMed] [Green Version]
  46. Caravaggio, N. Economic growth and the forest development path: A theoretical re-assessment of the environmental Kuznets curve for deforestation. For. Policy Econ. 2020, 118, 102259. [Google Scholar] [CrossRef]
  47. Foster, A.D.; Rosenzweig, M.R. Economic growth and the rise of forests. Q. J. Econ. 2003, 118, 601–637. [Google Scholar] [CrossRef]
Figure 1. Spatial distribution of forest cover in Fujian Province in 2020.
Forests 13 02070 g001
Figure 2. Spatial agglomeration distribution result of forest cover in Fujian Province in 2020.
Forests 13 02070 g002
Figure 3. Results of risk detector for the spatial distribution of forest cover in Fujian Province.
Forests 13 02070 g003
Table 1. Determination factors of the spatial distribution of forest cover.
Determination FactorsUnitsMaxMin
Natural environmental factorsPrecipitationMm1948.41199.7
Average annual temperature°C21.016.4
ElevationM2138−6
Slope°82.30
Socioeconomic factorsPopulation densityperson/km218,30168
Output value of tertiary industrybillion17.580.34
Grain output per unit areaton/ha7.034.58
GDP per capitaRMB (yuan)307,55750,909
Per capita disposable income of rural householdsRMB (yuan)29,32314,449
Forestry output valueRMB (yuan)251,3560
Household electricity consumptionmillion kw·h2372.4147.3
Road densitykm/km2113.411.21
Table 2. Results of global spatial auto-correlation of forest cover in Fujian Province.
Moran’s IZ Scorep Value
Forest cover0.4245606.1209100.000000
Table 3. Summary of local spatial auto-correlation categories and the number of districts and counties with forest cover in Fujian Province.
Auto-Correlation TypeForest Cover
NumberRatio
H-H cluster1417.95%
H-L cluster00
L-H cluster11.28%
L-L cluster1012.82%
Not significant5367.95%
Total78100%
Table 4. Results of factor detector for the spatial distribution of forest cover in Fujian Province.
Determination FactorsForest Cover
q Valuep ValueRank
Precipitation (X1)0.2660.00010
Average annual temperature (X2)0.3090.0004
Elevation (X3)0.2770.0007
Slope (X4)0.0730.00012
Population density (X5)0.5660.0001
Output value of tertiary industry (X6)0.3060.0005
Grain output per unit area (X7)0.2730.0008
GDP per capita (X8)0.2670.0009
Per capita disposable income of rural households (X9)0.3160.0003
Forestry output value (X10)0.2420.00011
Household electricity consumption (X11)0.3040.0006
Road density (X12)0.4180.0002
Publisher’s Note: MDPI stays neutral with regard to jurisdictional claims in published maps and institutional affiliations.

