
Tropical Forest Disturbance Monitoring Based on Multi-Source Time Series Satellite Images and the LandTrendr Algorithm
 , , , ,
  and
and 
Abstract
:1. Introduction
2. Method
2.1. Study Area
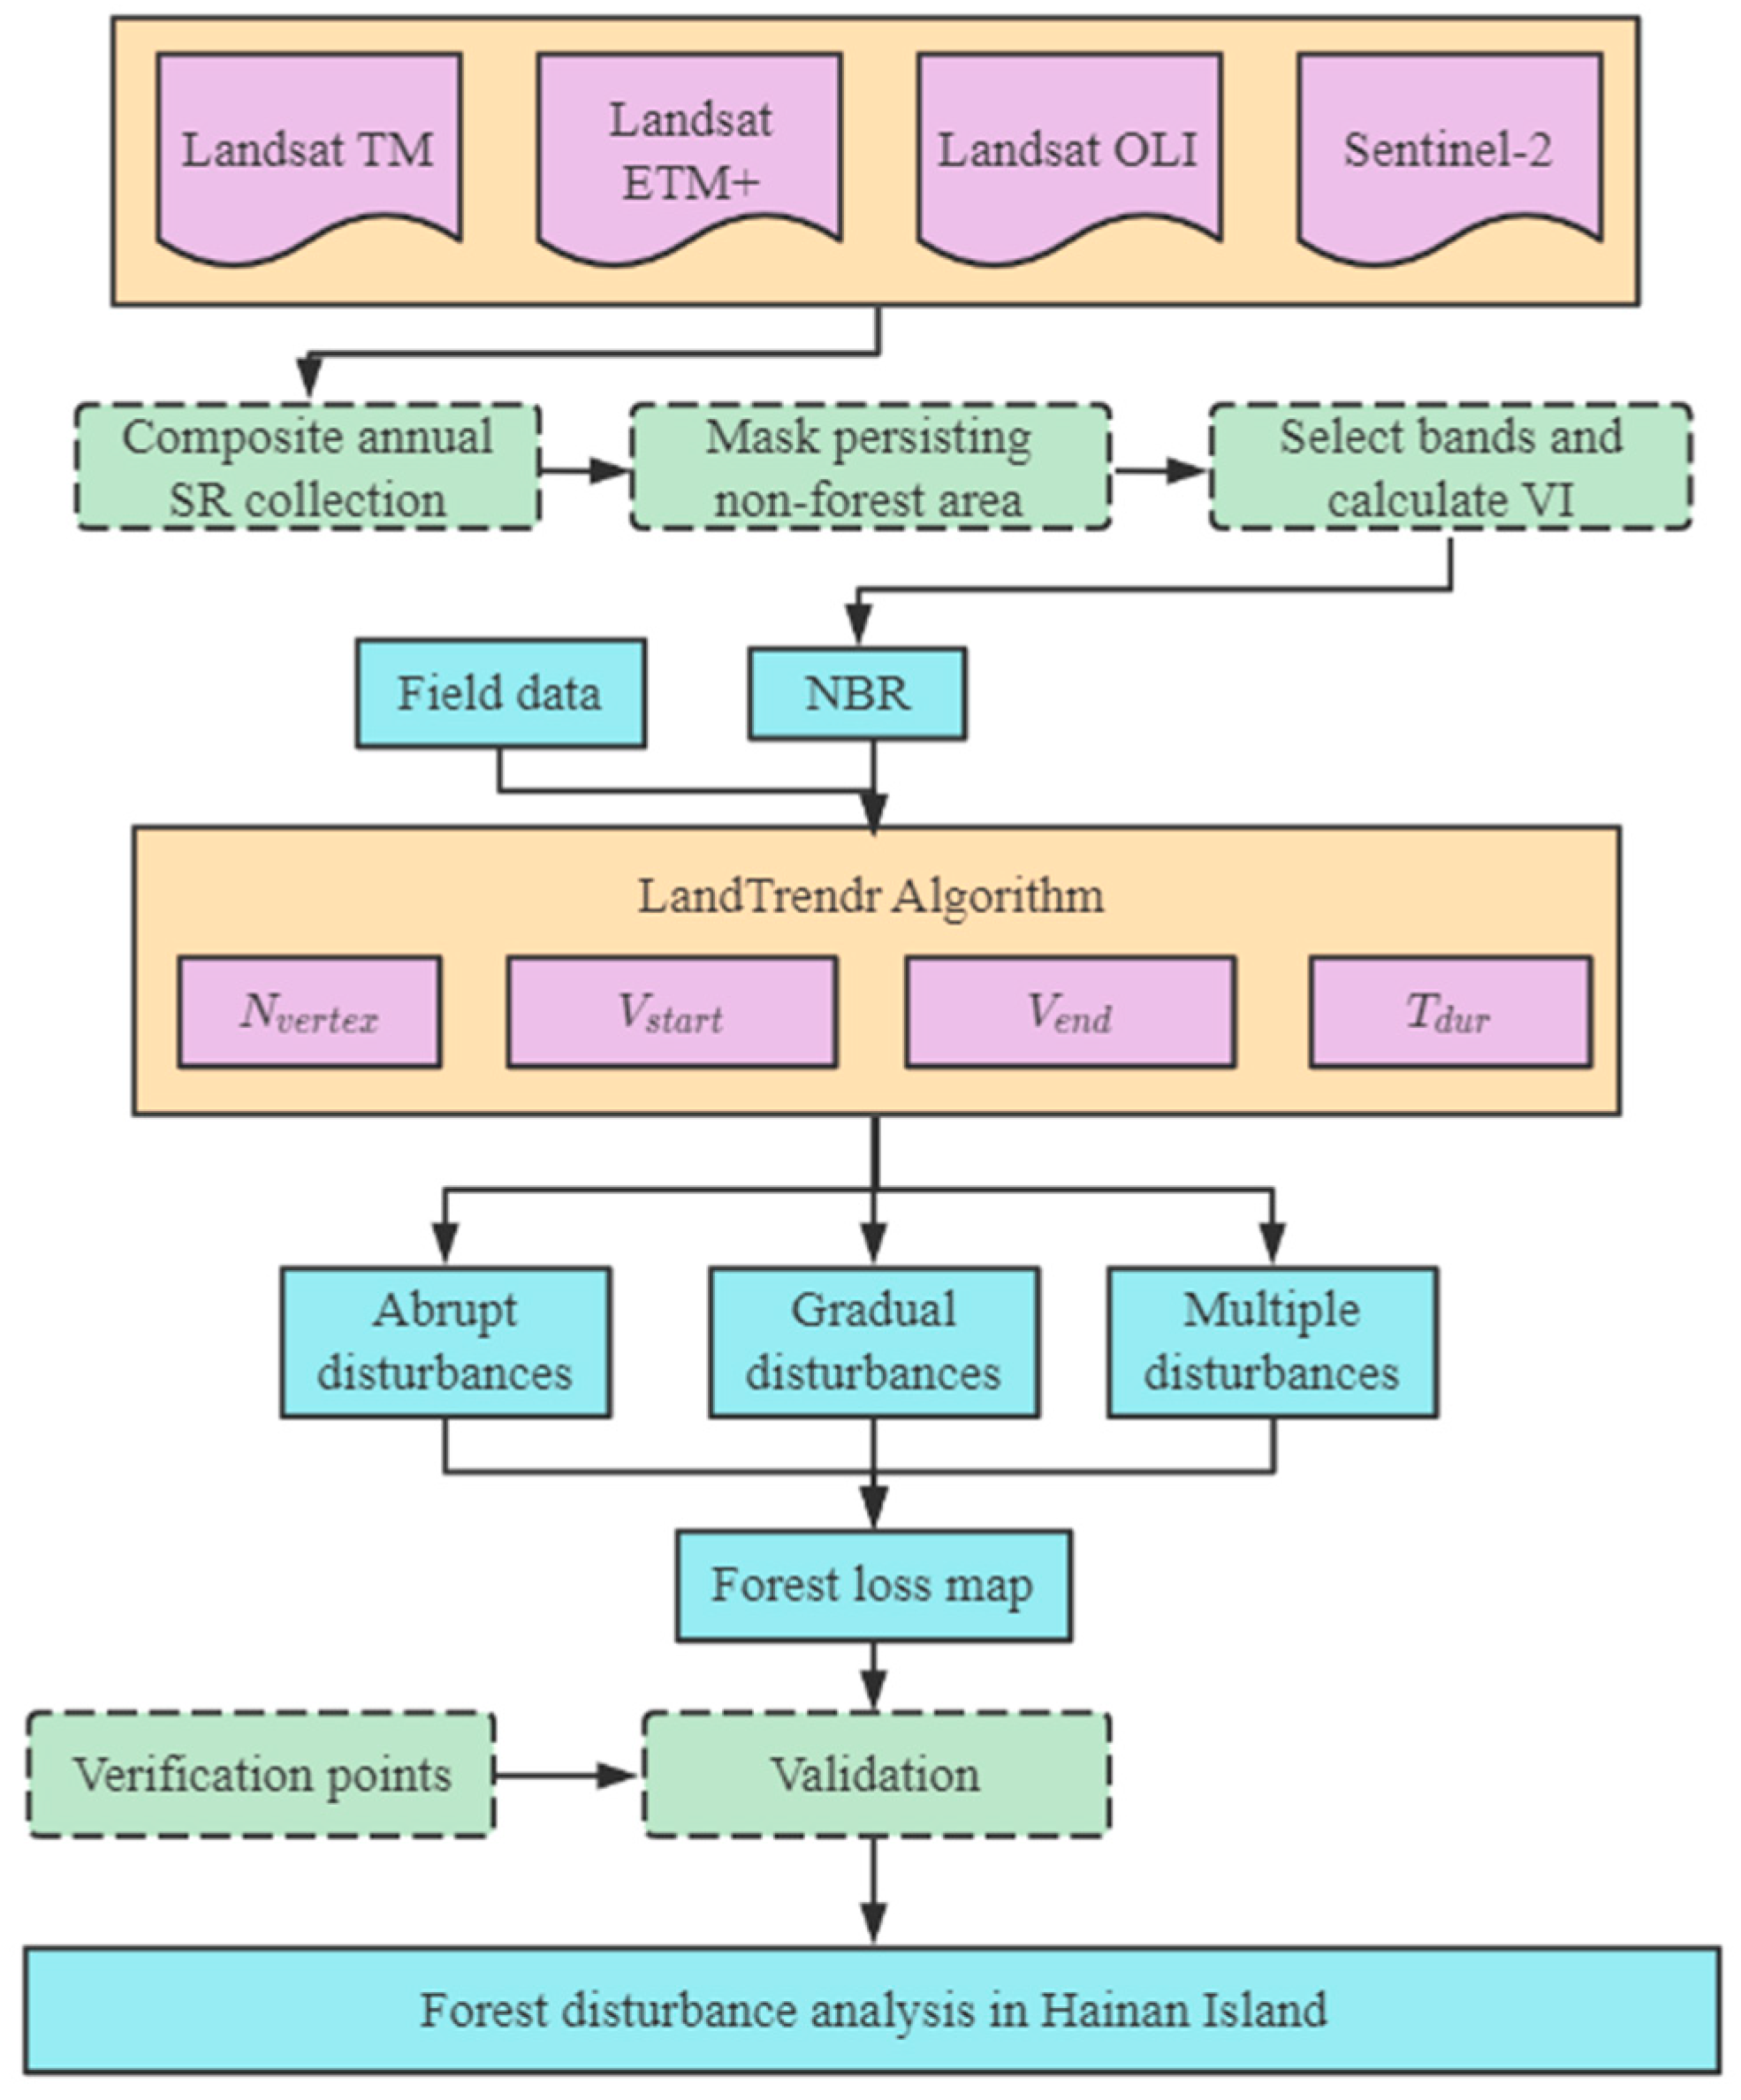
2.2. Workflow
2.3. Data Source and Processing
2.3.1. Satellite Imagery
2.3.2. Forest Cover Data
2.3.3. Terrain Data
2.3.4. Verification Data
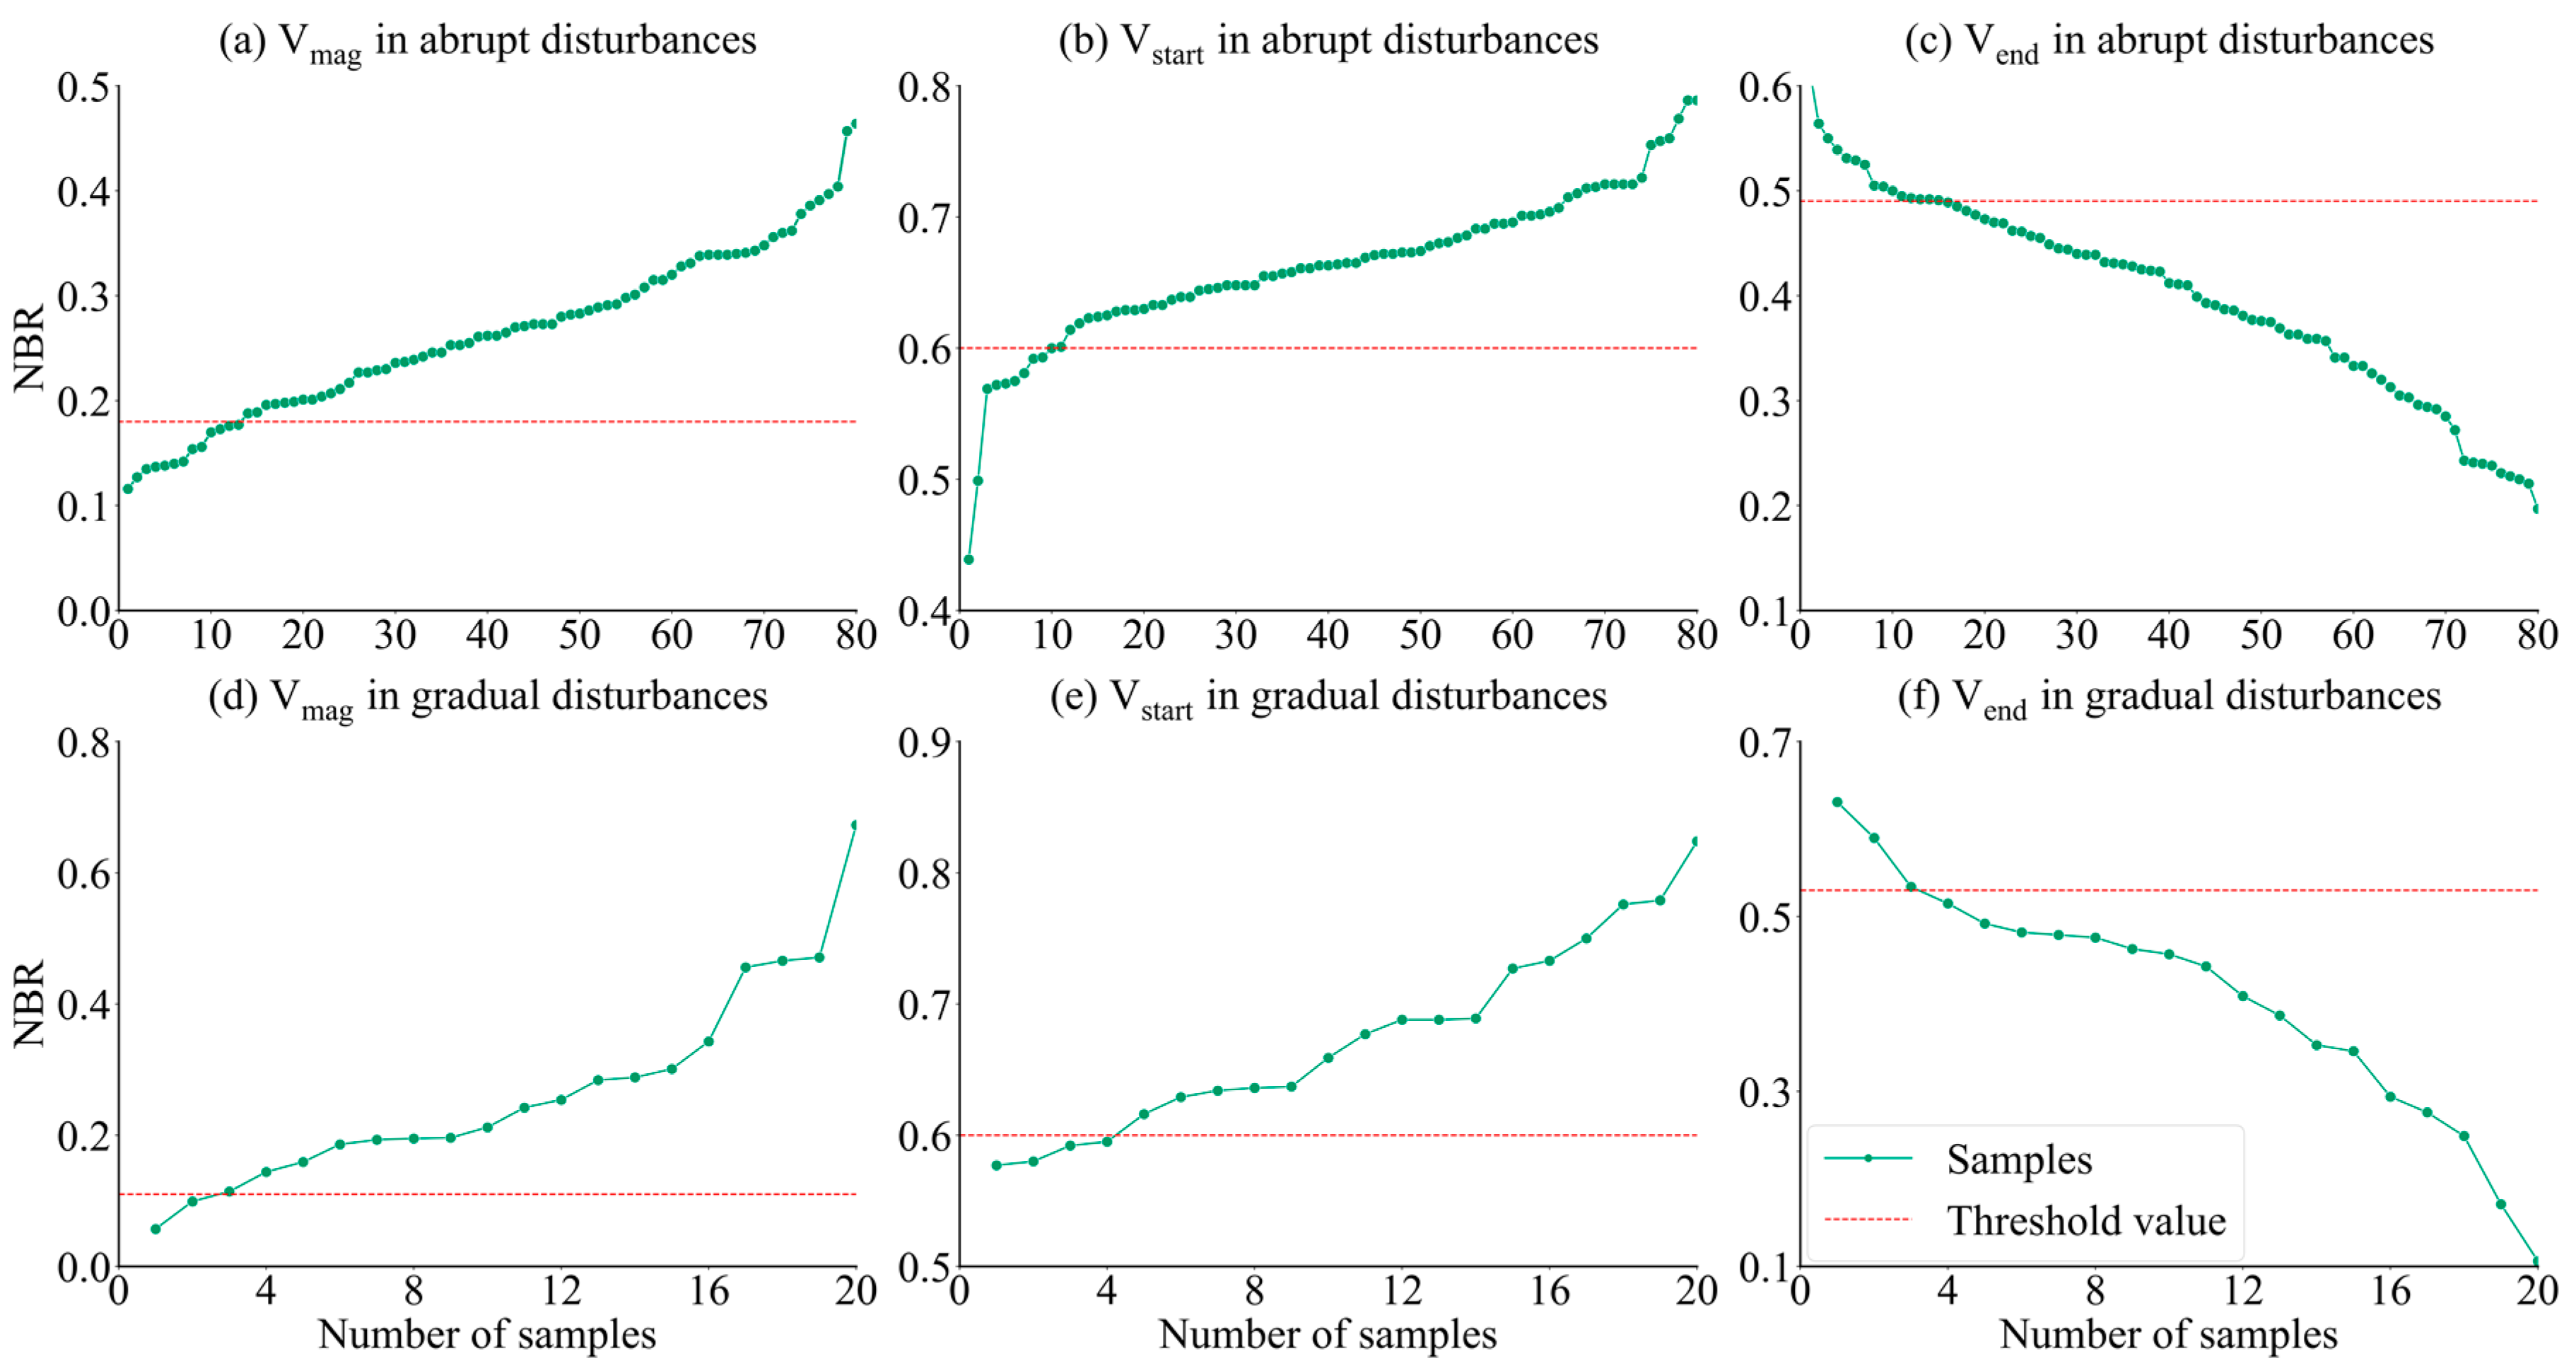
2.4. Forest Disturbance Identification
3. Results
3.1. Accuracy Assessment
3.2. Spatial Characteristics of Forest Disturbances on Hainan Island
3.2.1. Forest Disturbances over Different Cities and Counties
3.2.2. Forest Disturbances in Different Terrain Areas
3.3. Temporal Characteristics of Forest Disturbance
4. Discussion
4.1. Data and Algorithms for Forest Disturbance Monitoring
4.2. Forest Disturbances on Hainan Island and Its Drivers
5. Conclusions
Author Contributions
Funding
Institutional Review Board Statement
Informed Consent Statement
Data Availability Statement
Acknowledgments
Conflicts of Interest
References
- Gasparri, N.I.; Grau, H.R. Deforestation and fragmentation of Chaco dry forest in NW Argentina (1972–2007). For. Ecol. Manag. 2009, 258, 913–921. [Google Scholar] [CrossRef]
- Liu, S.; Wei, X.; Li, D.; Lu, D. Examining Forest Disturbance and Recovery in the Subtropical Forest Region of Zhejiang Province Using Landsat Time-Series Data. Remote Sens. 2017, 9, 479. [Google Scholar] [CrossRef] [Green Version]
- Potapov, P.V.; Turubanova, S.A.; Adusei, B.; Broich, M.; Altstatt, A.; Mane, L.; Justice, C.O. Quantifying forest cover loss in Democratic Republic of the Congo, 2000–2010, with Landsat ETM+ data. Remote Sens. Environ. 2012, 122, 106–116. [Google Scholar] [CrossRef]
- Pan, Y.; Birdsey, R.A.; Fang, J.; Houghton, R.; Kauppi, P.E.; Kurz, W.A.; Phillips, O.L.; Shvidenko, A.; Lewis, S.L.; Canadell, J.G.; et al. A large and persistent carbon sink in the world’s forests. Science 2011, 333, 988–993. [Google Scholar] [CrossRef] [PubMed] [Green Version]
- Brooks, T.M.; Mittermeier, R.A.; Mittermeier, C.G.; Da Fonseca, G.A.B.; Rylands, A.B.; Konstant, W.R.; Flick, P.; Pilgrim, J.; Oldfield, S.; Magin, G.; et al. Habitat Loss and Extinction in the Hotspots of Biodiversity. Conserv. Biol. 2002, 16, 909–923. [Google Scholar] [CrossRef] [Green Version]
- Jarron, L.; Hermosilla, T.; Coops, N.; Wulder, M.; White, J.; Hobart, G.; Leckie, D. Differentiation of Alternate Harvesting Practices Using Annual Time Series of Landsat Data. Forests 2017, 8, 15. [Google Scholar] [CrossRef] [Green Version]
- Wei, X.; Blanco, J.A. Significant Increase in Ecosystem C Can Be Achieved with Sustainable Forest Management in Subtropical Plantation Forests. PLoS ONE 2014, 9, e89688. [Google Scholar] [CrossRef]
- Bowd, E.J.; Banks, S.C.; Bissett, A.; May, T.W.; Lindenmayer, D.B. Direct and indirect disturbance impacts in forests. Ecol. Lett. 2021, 24, 1225–1236. [Google Scholar] [CrossRef]
- Portillo-Quintero, C.; Hernández-Stefanoni, J.L.; Reyes-Palomeque, G.; Subedi, M.R. The Road to Operationalization of Effective Tropical Forest Monitoring Systems. Remote Sens. 2021, 13, 1370. [Google Scholar] [CrossRef]
- Pflugmacher, D.; Cohen, W.B.; Kennedy, R.E. Using Landsat-derived disturbance history (1972–2010) to predict current forest structure. Remote Sens. Environ. 2012, 122, 146–165. [Google Scholar] [CrossRef]
- Schneibel, A.; Stellmes, M.; Röder, A.; Frantz, D.; Kowalski, B.; Haß, E.; Hill, J. Assessment of spatio-temporal changes of smallholder cultivation patterns in the Angolan Miombo belt using segmentation of Landsat time series. Remote Sens. Environ. 2017, 195, 118–129. [Google Scholar] [CrossRef] [Green Version]
- Li, Y.; Wu, Z.; Xu, X.; Fan, H.; Tong, X.; Liu, J. Forest disturbances and the attribution derived from yearly Landsat time series over 1990–2020 in the Hengduan Mountains Region of Southwest China. For. Ecosyst. 2021, 8, 73. [Google Scholar] [CrossRef]
- Senf, C.; Pflugmacher, D.; Wulder, M.; Hostert, P. Characterizing spectral-temporal patterns of defoliator and bark beetle disturbances using Landsat time series. Remote Sens. Environ. 2015, 170, 166–177. [Google Scholar] [CrossRef]
- Marzo, T.D.; Gasparri, N.I.; Lambin, E.F.; Kuemmerle, T. Agents of Forest Disturbance in the Argentine Dry Chaco. Remote Sens. 2022, 14, 1758. [Google Scholar] [CrossRef]
- Schwantes, A.M.; Swenson, J.J.; Jackson, R.B. Quantifying drought-induced tree mortality in the open canopy woodlands of central Texas. Remote Sens. Environ. 2016, 181, 54–64. [Google Scholar] [CrossRef] [Green Version]
- Meigs, G.W.; Kennedy, R.E.; Cohen, W.B. A Landsat time series approach to characterize bark beetle and defoliator impacts on tree mortality and surface fuels in conifer forests. Remote Sens. Environ. 2011, 115, 3707–3718. [Google Scholar] [CrossRef]
- Griffiths, P.; Kuemmerle, T.; Kennedy, R.E.; Abrudan, I.V.; Knorn, J.; Hostert, P. Using annual time-series of Landsat images to assess the effects of forest restitution in post-socialist Romania. Remote Sens. Environ. 2012, 118, 199–214. [Google Scholar] [CrossRef]
- Yan, G.; Solórzano, J.V.; Quevedo, A.; Loya-Carrillo, J.O. How BFAST Trend and Seasonal Model Components Affect Disturbance Detection in Tropical Dry Forest and Temperate Forest. Remote Sens. 2021, 13, 2033. [Google Scholar]
- Kennedy, R.E.; Yang, Z.; Cohen, W.B.; Pfaff, E.; Braaten, J.; Nelson, P. Spatial and temporal patterns of forest disturbance and regrowth within the area of the Northwest Forest Plan. Remote Sens. Environ. 2012, 122, 117–133. [Google Scholar] [CrossRef]
- Kennedy, R.E.; Yang, Z.; Cohen, W.B. Detecting trends in forest disturbance and recovery using yearly Landsat time series:LandTrendr-Temporal segmentation algorithms. Remote Sens. Environ. 2010, 114, 2897–2910. [Google Scholar] [CrossRef]
- Huang, C.; Goward, S.N.; Masek, J.G.; Thomas, N.; Zhu, Z.; Vogelmann, J.E. An automated approach for reconstructing recent forest disturbance history using dense Landsat time series stacks. Remote Sens. Environ. 2010, 114, 183–198. [Google Scholar] [CrossRef]
- Verbesselt, J.; Zeileis, A.; Herold, M. Near real-time disturbance detection using satellite image time series. Remote Sens. Environ. 2012, 123, 98–108. [Google Scholar] [CrossRef]
- Zhu, Z.; Woodcock, C.E. Continuous change detection and classification of land cover using all available Landsat data. Remote Sens. Environ. 2014, 144, 152–171. [Google Scholar] [CrossRef] [Green Version]
- Zhu, Z. Change detection using landsat time series: A review of frequencies, preprocessing, algorithms, and applications. Isprs. J. Photogramm. 2017, 130, 370–384. [Google Scholar] [CrossRef]
- Ju, J.; Roy, D.P. The availability of cloud-free Landsat ETM+ data over the conterminous United States and globally. Remote Sens. Environ. 2008, 112, 1196–1211. [Google Scholar] [CrossRef]
- Cohen, W.B.; Yang, Z.; Healey, S.P.; Kennedy, R.E.; Gorelick, N. A LandTrendr multispectral ensemble for forest disturbance detection. Remote Sens Environ. 2018, 205, 131–140. [Google Scholar] [CrossRef]
- Tang, D.; Fan, H.; Yang, K.; Zhang, Y. Mapping forest disturbance across the China-Laos border using annual Landsat time series. Int. J. Remote. Sens. 2019, 40, 2895–2915. [Google Scholar] [CrossRef]
- Yang, Y.; Peter, D.E.; Alex, M.L.; David, M.; Zhang, S.; Zhenyu, W. Detecting the dynamics of vegetation disturbance and recovery in surface mining area via Landsat imagery and LandTrendr algorithm. J. Clean. Prod. 2018, 178, 353–362. [Google Scholar] [CrossRef]
- Kennedy, R.; Yang, Z.; Gorelick, N.; Braaten, J.; Cavalcante, L.; Cohen, W.; Healey, S. Implementation of the LandTrendr Algorithm on Google Earth Engine. Remote Sens. 2018, 10, 691. [Google Scholar] [CrossRef] [Green Version]
- Shao, Z.; Cai, J.; Fud, P.; Hu, L.; Liu, T. Deep learning-based fusion of Landsat-8 and Sentinel-2 images for a harmonized surface reflectance product. Remote Sens. Environ. 2019, 235, 111425. [Google Scholar] [CrossRef]
- Claverie, M.; Junchang, J.; Jeffrey, G.M.; Jennifer, L.D.; Eric, F.V.; Roger, J.; Sergii, V.S.; Christopher, J. The Harmonized Landsat and Sentinel-2 surface reflectance data set. Remote Sens. Environ. 2018, 219, 145–161. [Google Scholar] [CrossRef]
- Schiberna, E.; Borovics, A.; Benke, A. Economic Modelling of Poplar Short Rotation Coppice Plantations in Hungary. Forests 2021, 12, 623. [Google Scholar] [CrossRef]
- Temesgen, D.; Gonzálo, J.; Turrión, M.B.; Tunney, H. Effects of short-rotation Eucalyptus plantations on soil quality attributes in highly acidic soils of the central highlands of Ethiopia. Soil Use Manag. 2016, 32, 210–219. [Google Scholar] [CrossRef]
- Pasquarella, V.J.; Evalo, P.A.; Bratley, K.H.; Bullock, E.L.; Gorelick, N.; Yang, Z.; Kennedy, R.E. Demystifying LandTrendr and CCDC temporal segmentation. Int. J. Appl. Earth Obs. Geoinf. 2022, 110, 102806. [Google Scholar] [CrossRef]
- Gu, X.; Chen, B.; Yun, T.; Li, G.; Wu, Z.; Kou, W. Spatio-temporal Changes of Forest in Hainan Island from 2007 to 2018 Based on Multi-source Remote Sensing Data. Chin. J. Trop. Crops 2022, 43, 418–429. [Google Scholar]
- Li, G.; Weili, K.; Zhixiang, W.; Xicai, Z.; Ting, Y.; Jun, M.; Rui, S.; Ying, L.; Bangqian, C. Spatio-temporal changes of rubber plantations in Hainan Island over the past 30 years. J. Nanjing For. Univ. 2022, 1–11. [Google Scholar]
- Huang, J. Study on Sustainable Management of Tropical Forests in Hainan Island, China. Ph.D. Thesis, Chinese Academy of Forestry, Beijing, China, 2006. [Google Scholar]
- Zhu, M.; Wang, X.; Wang, S.; Wang, W.; Zou, Y.; Liang, Q. Carbon storage and distribution of rubber and eucalyptus plantations in Danzhou, Hainan Island. Ecol. Sci. 2016, 35, 43–51. [Google Scholar]
- Hainan Provincial Bureau of Statistics. In Hainan Statistical Yearbook; China Statistics Press: Beijing, China, 2020.
- Wang, S.; Ouyang, Z.; Zhang, C.; Xu, W.; Xiao, Y. The dynamics of spatial and temporal changes to forested land and key factors driving change on Hainan Island. Acta Ecol. Sin. 2012, 32, 7364–7374. [Google Scholar] [CrossRef] [Green Version]
- Chen, B.; Li, X.; Kou, W.; Qin, Y.; Yang, C.; Xie, G. Mapping tropical forests and deciduous rubber plantations in Hainan Island, China by integrating PALSAR 25-m and multi-temporal Landsat images. Int. J. Appl. Earth Obs. 2016, 50, 117–130. [Google Scholar] [CrossRef]
- Hermosilla, T.; Wulder, M.A.; White, J.C.; Coops, N.C. Prevalence of multiple forest disturbances and impact on vegetation regrowth from interannual Landsat time series (1985–2015). Remote Sens. Environ. 2019, 233, 111403. [Google Scholar] [CrossRef]
- Vogelmann, J.E.; Gallant, A.L.; Shi, H.; Zhu, Z. Perspectives on monitoring gradual change across the continuity of Landsat sensors using time-series data. Remote Sens. Environ. 2016, 185, 258–270. [Google Scholar] [CrossRef] [Green Version]
- Hislop, S.; Haywood, A.; Alaibakhsh, M.; Nguyen, T.H.; Soto-Berelov, M.; Jones, S.; Stone, C. A reference data framework for the application of satellite time series to monitor forest disturbance. Int. J. Appl. Earth Obs. 2021, 105, 102636. [Google Scholar] [CrossRef]
- Xi, Z.; Lu, D.; Liu, L.; Ge, H. Detection of Drought-Induced Hickory Disturbances in Western Lin An County, China, Using Multitemporal Landsat Imagery. Remote Sens. 2016, 8, 345. [Google Scholar] [CrossRef] [Green Version]
- Quintero, N.; Viedma, O.; Urbieta, I.R.; Moreno, J.M. Assessing Landscape Fire Hazard by Multitemporal Automatic Classification of Landsat Time Series Using the Google Earth Engine in West-Central Spain. Forests 2019, 10, 518. [Google Scholar] [CrossRef]
- Zhu, Z.; Wang, S.; Woodcock, C.E. Improvement and expansion of the Fmask algorithm: Cloud, cloud shadow, and snow detection for Landsats 4–7, 8, and Sentinel 2 images. Remote Sens. Environ. 2015, 159, 269–277. [Google Scholar] [CrossRef]
- Chastain, R.; Housman, I.; Goldstein, J.; Finco, M. Empirical cross sensor comparison of Sentinel-2A and 2B MSI, Landsat-8 OLI, and Landsat-7 ETM+ top of atmosphere spectral characteristics over the conterminous United States. Remote Sens. Environ. 2019, 221, 274–285. [Google Scholar] [CrossRef]
- White, J.C.; Wulder, M.A.; Hermosilla, T.; Coops, N.C.; Hobart, G.W. A nationwide annual characterization of 25 years of forest disturbance and recovery for Canada using Landsat time series. Remote Sens. Environ. 2017, 194, 303–321. [Google Scholar] [CrossRef]
- Escuin, S.; Navarro, R.; Fernández, P. Fire severity assessment by using NBR (Normalized Burn Ratio) and NDVI (Normalized Difference Vegetation Index) derived from LANDSAT TM/ETM images. Int. J. Remote Sens. 2008, 29, 1053–1073. [Google Scholar] [CrossRef]
- Chen, B.; Xiao, X.; Ye, H.; Ma, J.; Doughty, R.; Li, X.; Zhao, B.; Wu, Z.; Sun, R.; Dong, J.; et al. Mapping Forest and Their Spatial-Temporal Changes From 2007 to 2015 in Tropical Hainan Island by Integrating ALOS/ALOS-2 L-Band SAR and Landsat Optical Images. Ieee J-Stars. 2018, 11, 852–867. [Google Scholar] [CrossRef]
- Gelabert, P.J.; Rodrigues, M.; de la Riva, J.; Ameztegui, A.; Sebastià, M.T.; Vega-Garcia, C. LandTrendr smoothed spectral profiles enhance woody encroachment monitoring. Remote Sens. Environ. 2021, 262, 112521. [Google Scholar] [CrossRef]
- Jutras-Perreault, M.; Gobakken, T.; Ørka, H.O. Comparison of two algorithms for estimating stand-level changes and change indicators in a boreal forest in Norway. Int. J. Appl. Earth Obs. 2021, 98, 102316. [Google Scholar] [CrossRef]
- Zhu, L.; Liu, X.; Wu, L.; Tang, Y.; Meng, Y. Long-Term Monitoring of Cropland Change near Dongting Lake, China, Using the LandTrendr Algorithm with Landsat Imagery. Remote Sens. 2019, 11, 1234. [Google Scholar] [CrossRef] [Green Version]
- Li, J.; Roy, D.P. A Global Analysis of Sentinel-2A, Sentinel-2B and Landsat-8 Data Revisit Intervals and Implications for Terrestrial Monitoring. Remote Sens. 2017, 9, 902. [Google Scholar] [CrossRef] [Green Version]
- Curtis, E.W.; Thomas, R.L.; Martin, H.; Marvin, E.B. Transitioning from change detection to monitoring with remote sensing: A paradigm shift. Remote Sens. Environ. 2020, 238, 111558. [Google Scholar]
- Shimizu, K.; Ota, T.; Mizoue, N. Detecting Forest Changes Using Dense Landsat 8 and Sentinel-1 Time Series Data in Tropical Seasonal Forests. Remote Sens. 2019, 11, 1899. [Google Scholar] [CrossRef]
- Hua, J.; Chen, G.; Yu, L.; Ye, Q.; Jiao, H.; Luo, X. Improved Mapping of Long-Term Forest Disturbance and Recovery Dynamics in the Subtropical China Using All Available Landsat Time-Series Imagery on Google Earth Engine Platform. IEEE J. Sel. Top. Appl. Earth Obs. Remote Sens. 2021, 14, 2754–2768. [Google Scholar] [CrossRef]
- Grogan, K.; Dirk, P.; Patrick, H.; Robert, K.; Rasmus, F. Cross-border forest disturbance and the role of natural rubber in mainland Southeast Asia using annual Landsat time series. Remote Sens. Environ. 2015, 169, 438–453. [Google Scholar] [CrossRef]
- Liu, R. Historical Analysis of China’s Natural Rubber Industry. China State Farm. 2016, 7, 36–39. [Google Scholar]
- Mo, Y. Natural rubber production and market situation. World Trop. Agric. Inf. 2012, 5, 1–3. [Google Scholar]
- Li, Q. Research on the Development Countermeasures of Hainan Eucalyptus Industry. Trop. Agric. Guangxi 2010, 3, 51–54. [Google Scholar]
- Ma, Y.; Fan, S.; Liu, Q.; Liu, H. Analysis of Forest Resource Dynamics in Hainan Province. J. Anhui Agric. Sci. 2012, 40, 14295–14299. [Google Scholar]
- Tian, X. Exploration on the Development of Hainan New Tropical Leisure Orchard. Xiandai Hortic. 2011, 5, 22–23. [Google Scholar]
- Zhu, J. Present Situation, Problems and Development Suggestions of Hainan Mango Industry. Agric. Eng. Technol. 2019, 39, 20–21. [Google Scholar]
- Yu, W.; Zhang, M.; Mai, Q.; Jiang, J. Damage of Typhoon Damrey to the Rubber Industry in Hainan State Farm Bureau and Its Countermeasures for Future Development. Chin. J. Trop. Agric. 2006, 26, 41–43. [Google Scholar]
- Li, W.; Zhang, J.; Liu, S.; Che, X.; Chen, X.; Zou, H. Meteorological characteristics and monitoring index of drought in Hainan Island. J. Trop. Biol. 2022, 13, 324–330. [Google Scholar]
- Chen, Y. Risk assessment of typhoon disaster in Hainan Island based on GIS. Bachelor’s Thesis, Chongqing Jiaotong University, Chongqing, China, 2021. [Google Scholar]
- Chen, X.; Li, W.; Liang, C.; Bai, R.; Wu, H. Major agrometeorological disasters in Hainan and their control. J. Trop. Biol. 2022, 13, 416–421. [Google Scholar]
- Yu, S.; Zhai, P.; Zhang, Q. Variation of Char acteristics of Drought in Hainan Island during 1961. Chin. J. Trop. Crops 2006, 27, 111–115. [Google Scholar]
- Zhang, C.; Wu, S. Analysis on the Effect of High Temperature on Drought in Southwestern Hainan Island. Adv. Meteorol. Sci. Technol. 2020, 10, 96–101. [Google Scholar]
- Xue, Y.; Yang, Z.; Chen, Y.; Wang, X.; Wu, S.; Huang, G.; Lin, Z. Typhoon ‘rammasun’ impact on forest ecosystem in hainan. Trop. For. 2014, 42, 34–38. [Google Scholar]
- Ma, J.; Yang, W. Difference Analysis of Storm Surge between Typhoon Kalmaegi and Rammasun. Guangdong Water Resour. Hydropower 2015, 112, 20–24. [Google Scholar]


Publisher’s Note: MDPI stays neutral with regard to jurisdictional claims in published maps and institutional affiliations. |
© 2022 by the authors. Licensee MDPI, Basel, Switzerland. This article is an open access article distributed under the terms and conditions of the Creative Commons Attribution (CC BY) license (https://creativecommons.org/licenses/by/4.0/).
Share and Cite
Yin, X.; Kou, W.; Yun, T.; Gu, X.; Lai, H.; Chen, Y.; Wu, Z.; Chen, B. Tropical Forest Disturbance Monitoring Based on Multi-Source Time Series Satellite Images and the LandTrendr Algorithm. Forests 2022, 13, 2038. https://doi.org/10.3390/f13122038
Yin X, Kou W, Yun T, Gu X, Lai H, Chen Y, Wu Z, Chen B. Tropical Forest Disturbance Monitoring Based on Multi-Source Time Series Satellite Images and the LandTrendr Algorithm. Forests. 2022; 13(12):2038. https://doi.org/10.3390/f13122038
Chicago/Turabian StyleYin, Xiong, Weili Kou, Ting Yun, Xiaowei Gu, Hongyan Lai, Yue Chen, Zhixiang Wu, and Bangqian Chen. 2022. "Tropical Forest Disturbance Monitoring Based on Multi-Source Time Series Satellite Images and the LandTrendr Algorithm" Forests 13, no. 12: 2038. https://doi.org/10.3390/f13122038