Article

Contribution of Dry Forests and Forest Products to Climate Change Adaptation in Tigray Region, Ethiopia

1
Leibniz-Zentrum für Agrarlandschaftsforschung (ZALF) e. V., 15374 Müncheberg, Germany
2
Institute of International Forestry and Forest Products, Technical University of Dresden, 01737 Tharandt, Germany
3
Tigray Institute of Policy Studies, Mekelle 7000, Ethiopia
4
Mekelle Environment and Forest Research Centre, Ethiopian Environment and Forest Research Institute, Mekelle 7000, Ethiopia
5
Ethiopian Environment and Forest Research Institute, Addis Ababa 24536, Ethiopia
6
Department of Agricultural Economics, Humboldt Universität zu Berlin, 10099 Berlin, Germany
7
Urban Plant Ecophysiology, Humboldt Universität zu Berlin, 10099 Berlin, Germany
*
Author to whom correspondence should be addressed.
Forests 2022, 13(12), 2026; https://doi.org/10.3390/f13122026
Submission received: 21 October 2022 / Revised: 18 November 2022 / Accepted: 23 November 2022 / Published: 29 November 2022

Abstract

:
Despite their ecological importance, dry forests’ contribution to climate change adaptation is often neglected. Hence, this study was initiated to assess the socioeconomic contribution of dry forests to climate change adaptation in Tigray Region, Ethiopia. A mixed quantitative and qualitative research design was used to examine the role of dry forests in climate change adaptation. Household questionnaire survey, key informants, and a focus group discussion were used to collect data. The results indicated that 94% of all households visited a dry forest at least once a month to access the forest and forest products. While the dry forest income level varied significantly (p < 0.05), the overall dry forest income level contributed to 16.8% of the total household income. Dry forest income enabled the reduction of the area between the line of equality and the Lorenz curve by 21% in dry evergreen Afromontane Forest users, by 3.02% in Combretum–Terminalia woodland users, and by 3% in Acacia–Commiphora woodland users. Gender, occupation, wealth status, and distance from the forest to their homes are all factors that significantly affected Combretum–Terminalia woodland users’ income level. Among Acacia–Commiphora woodland users, the respondents’ age influenced the dry forest income level, whereas, among dry evergreen Afromontane Forest users, the family size of the household influenced the dry forest income level. The findings of this study could help policy makers understand the crucial role of dry forest income in the livelihood of the community and in climate change adaptation. Policymakers could reduce the pressure on dry forests by introducing policies that recognize the role of dry forest income in reducing poverty and income inequality and by establishing farmer cooperation in commercializing the non-timber forest products which support the long-term coping and adaptation strategy. Further research is needed to understand the increasing role of dry forest products in climate change adaptation over time and its contribution to the national economy at large.

1. Introduction

Supporting the livelihoods of roughly one billion people worldwide, dry forests cover almost half of the world’s sub-tropical and tropical forests [1]. Around 320 million people in Africa depend on dry forest resources [2], the majority being from Sub-Saharan Africa [3]. In Ethiopia, with around 55 million ha covered by dry forest, it represents the largest remaining forest vegetation in the country [4]. The dry forests are mostly located in the country’s dry and semi-arid lowlands, where rural peoples rely on agriculture, traditional pastoralism, and agro-pastoralism as their main sources of income.
Dry forests produce a wide variety of items that play a vital role in income generation for households in developing countries [5]. The income generated by the dry forest is greater than the sum of the income from other activities for lower income classes in the western and southeastern parts of Ethiopia [6,7]. The forests also play a key role in reducing poverty and income inequality [6,8]. The available products provided by the dry forest help the poorest people establish businesses that become a source of economic development and poverty alleviation while facilitating rural–urban linkage [9]. In addition to income generation, dry forest products contribute to local food security, particularly during times of agricultural scarcity [10]. The diversified diet of dry forest products, such as wild fruit, supplies nutrition to vulnerable communities [11]. Furthermore, the importance of the forest on food quality among the poorer communities obtains more emphasis [12]. Over 100 million people in both urban and rural areas are predicted to be fed by the African Miombo woodlands, the most extensive dry forest type in the African grassland and woodland ecoregion [13,14,15]. Furthermore, the dry forest contributes to the safety net for vulnerable households by providing cheap fuels such as firewood and charcoal [16].
It has been confirmed that, from theory, climate change model simulations and empirical evidence show that warmer climates lead to events of reduced annual precipitation and thereby increase the risk of drought [17]. In an indication of the relationship between the global climate change scenario and drought incidents, studies confirmed that projected climate change impacts on drought patterns are vital to address the various risks of future droughts [18]. The dryland regions in the Horn of Africa in general, and Ethiopia in particular, are highly affected by recurrent droughts [19,20]. The increasing trend in the intensity and frequency of droughts is exacerbating the vulnerability of the communities [21]. The majority of the vulnerable communities in the dryland region of Ethiopia reside in or near the dry forest, and, thus, its resources play a vital role by providing service, especially in the drought season [6,22]. The provision of the ecosystem services provided by the dry forest is highly resistant to droughts, supporting people by improving their adaptive capacity in the face of climate change risks [23,24]. The provisioning services that are commonly used by households are wild food, gum and resin, firewood, charcoal, and fodders to maintain livestock assets [25,26]. There is growing evidence that dry forest ecosystem services help to reduce the sensitivity and improve the adaptive capacity of impoverished households and communities [6,27,28]. The differences in use patterns could be due to social and economic backgrounds as well as closeness to the forest. This clearly implies that a site-specific examination of forest dependency is required before implementing policy and management interventions designed to promote sustainable resource management that are tailored to accommodate intercommunity heterogeneity.
The vital roles of dry forests in increasing income and in mitigating poverty would give additional weight to supporting climate change adaptation efforts and would contribute to combat desertification [24,29]. Until recently, the dry forests in Ethiopia and elsewhere in the Horn of Africa received less attention in national and regional planning, thereby neglecting the capacity of dry forests in climate change adaptation and undervaluing their contributions to long-term environmental management [6,24].
In international and national climate change mitigation negotiations, sustainable forest management is a key strategy that is promoted to reduce the negative impact of climate change [30]. Dry forests contribute to the sustained provision of ecosystem goods and services that can help people to adapt to and mitigate the local consequences of the changing climate [31,32]. However, dry forests have not yet attracted the same international attention as humid tropical forests [33,34]. In Ethiopia, there is little empirical evidence demonstrating the actual and potential contribution of dry forests to climate change adaptation. Various studies in the region analyzed the occurrence of droughts using different climatic factors. The commonly used six global factors (the SSTAs of the tropical Indian Ocean, tropical Atlantic Ocean, tropical Pacific Ocean, Nino 3.4 region, Red Sea, and atmospheric-pressure-based SOI) and two local factors (Albedo and NDVI) confirmed the drought frequency in the Tigray Region [
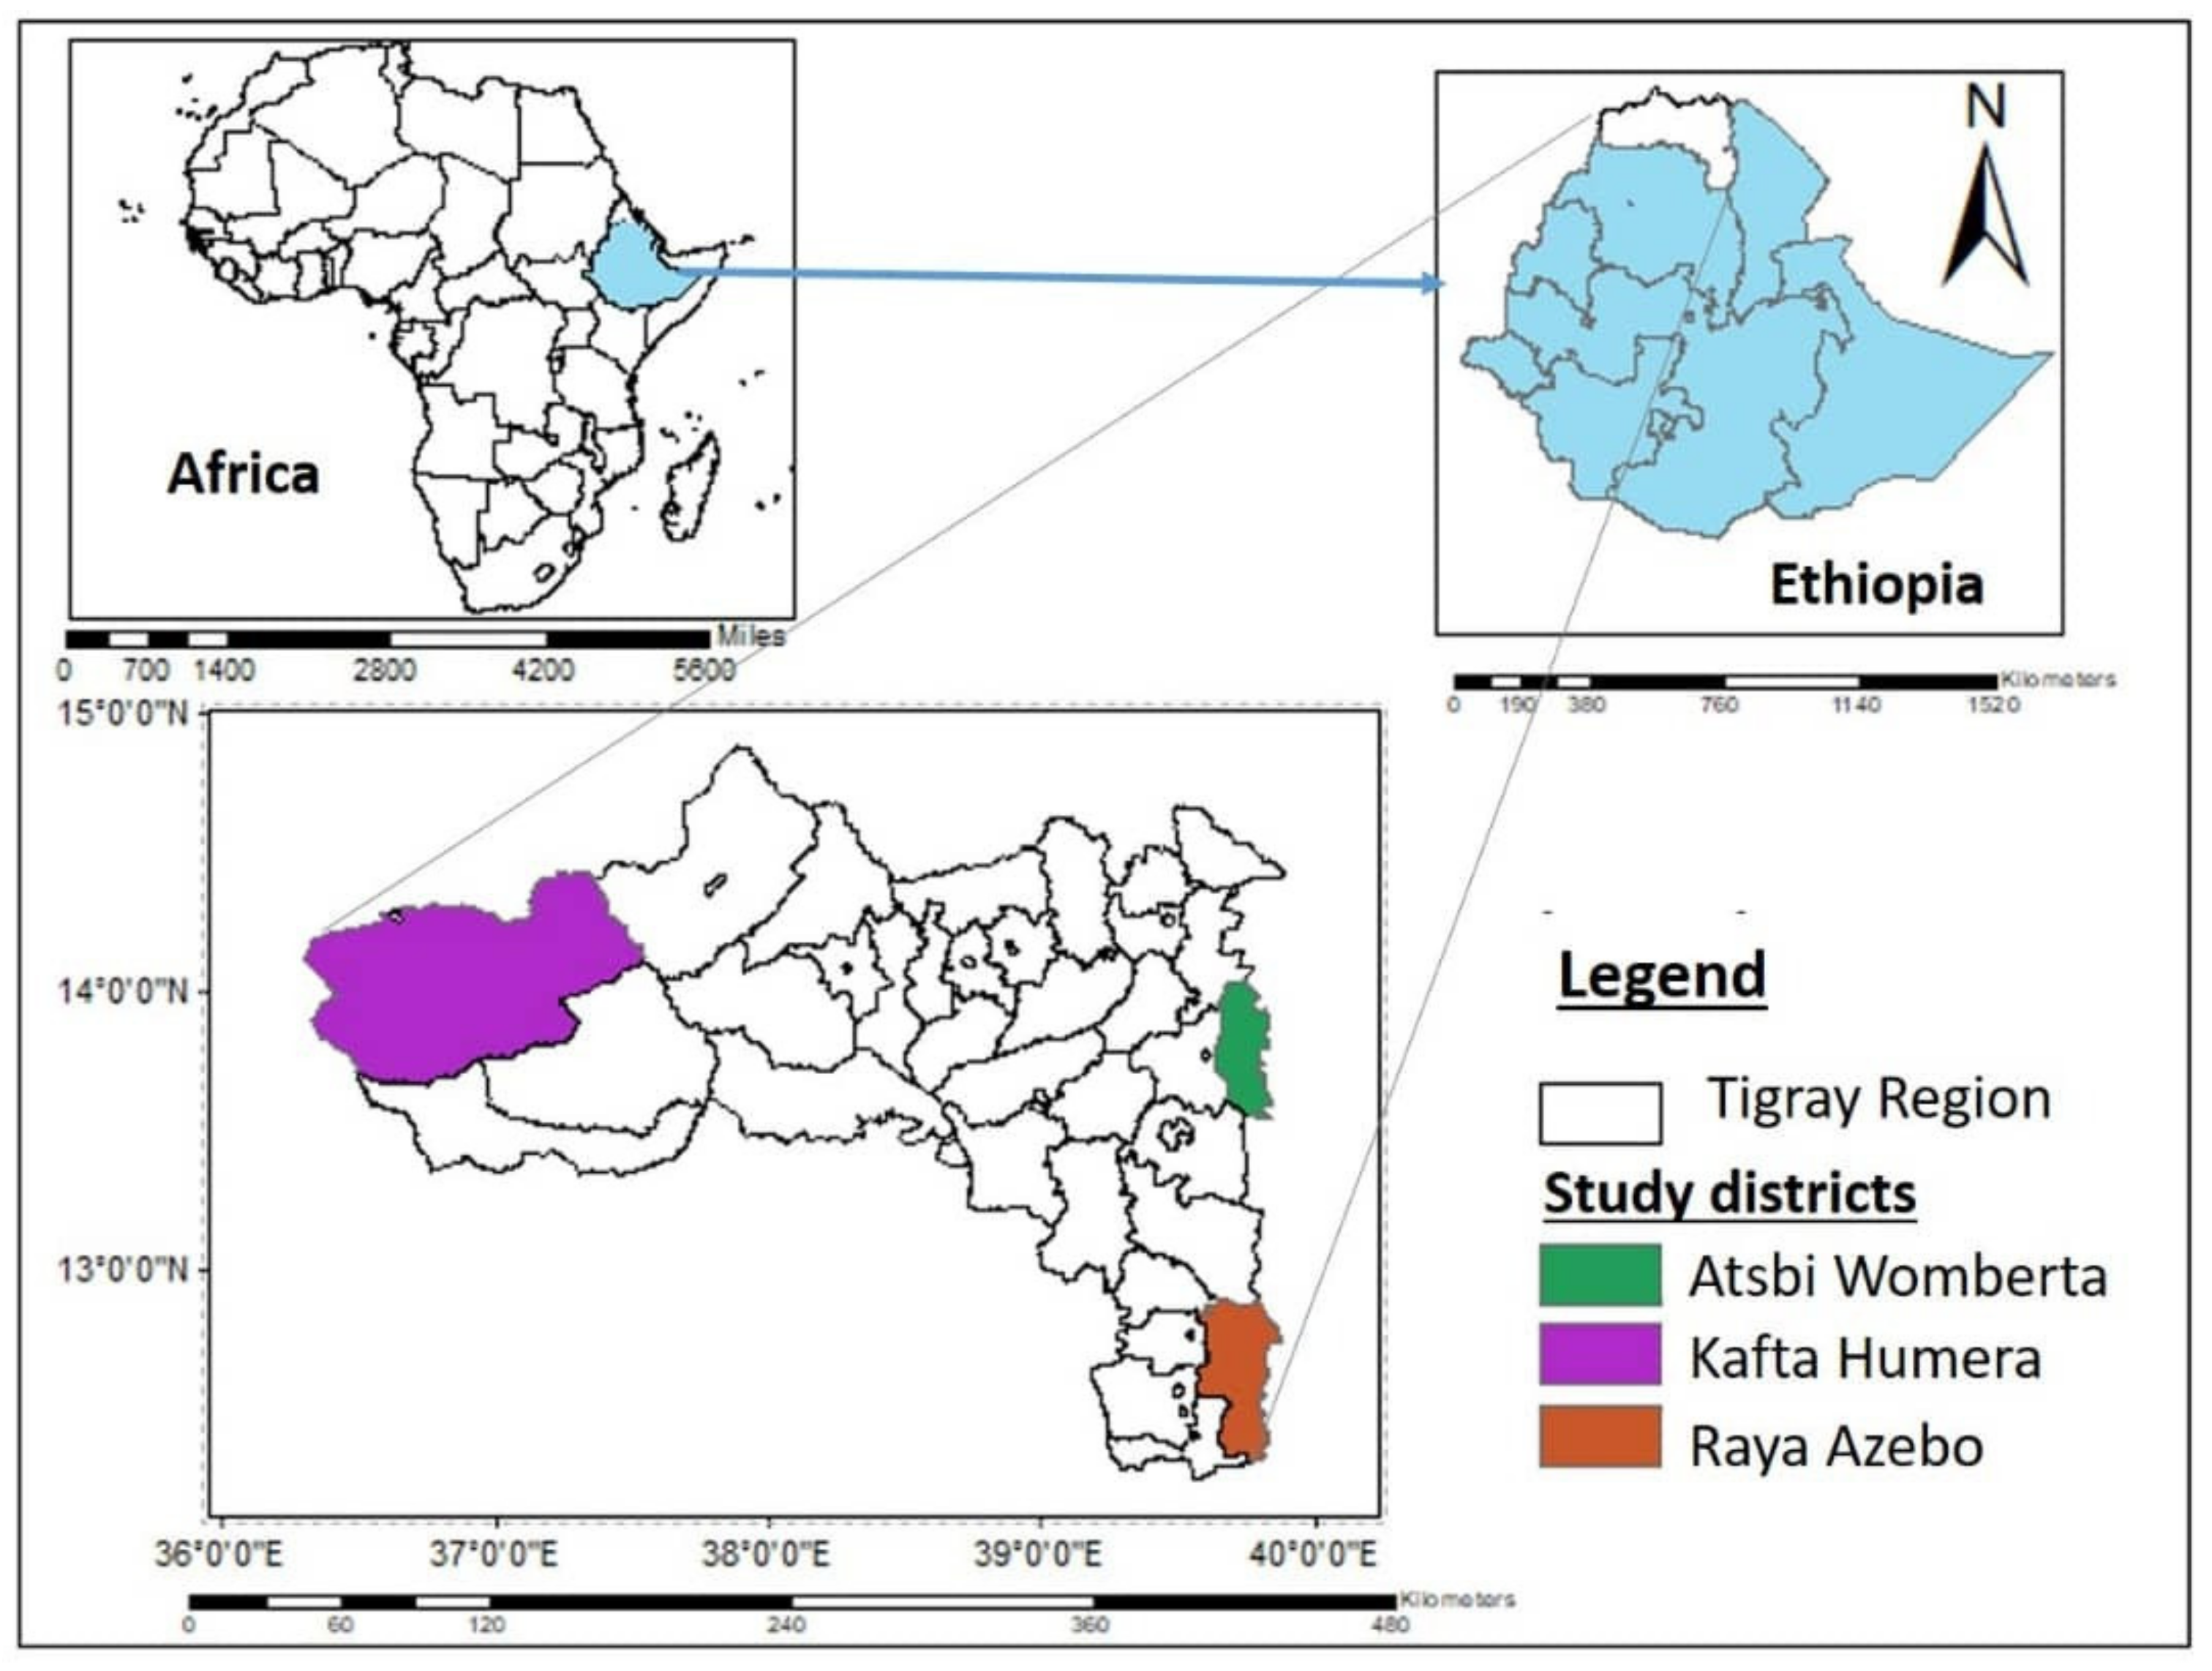
35]. In the ground, the dry forests of Ethiopia are contributing a significant livelihood backup to the community during the recurrent drought occurrence as an impact of climate change. Therefore, this study depicted the socioeconomic contribution of dry forests and forest products to climate change adaptation in the Tigray Region which is one of the hotspots for the dryland forests of Ethiopia. Hence, this study contributed to the national forest policy and climate change adaptation strategy of Ethiopia.

2. Materials and Methods

2.1. The Study Area

The drylands, including arid, semi-arid, and dry sub-humid areas of Ethiopia, are estimated to cover 70 percent of the country’s total landmass. This study was conducted in the semi-arid dryland of western, eastern, and northern zones of Tigray Regional State of Ethiopia, geographically located at 12°15′ to 14°57′ N latitude and 36°27′ to 39°59′ longitude (Figure 1). The region is organized into six administrative zones with an estimated population exceeding six million of which 80% live in rural area. The climate is predominantly characterized as tropical semi-arid with irregular rainfall and frequent drought periods [36]. The mean annual rainfall varies from 500 to 900 mm, and the temperature ranges from 15 °C to 25 °C. The topography of the region ranges from massif highland of 3900 m.a.s.l to the northwestern lowlands where the elevation is as low as 500 m.a.s.l [37].
The vegetation in the study area principally comprises dry evergreen Afromontane Forest, Combretum–Terminalia, and Acacia–Commiphora in Atsbi Womberta, Kafta Humera, and Raya Azebo, respectively [37,38].

2.2. Sampling Procedure and Data Collection

Multistage sampling techniques were employed to select study villages and respondents based on their vegetation type, accessibility, dry forest endowment, and existence of high-value dry forest species. Three study villages were selected from Kafta Humera (KH), Atsbi Womberta (AW), and Raya Azebo (RA) Districts, which are characterized by Combretum–Terminalia woodlands, dry evergreen Afromontane forest, and Acacia–Commiphora woodlands, respectively. A total of 170 households (i.e., 51 from Kafta Humera, 58 from Atsbi Womberta, and 61 from Raya Azebo) were randomly selected for a household survey. In addition, from each district, 15 key informants and one focus group (6 members per group) were purposely selected for more in-depth discussion. The key informants were elders, local administrators, religious leaders, and youth representatives in each of the study districts. The variations among households in terms of wealth were identified using locally relevant wealth indicators [6]. All household interview questionnaires were translated into the local language, Tigirigna, and a paper-based questionnaire was filled out by enumerators. The key informant interviews and focus group discussions were also conducted using the local language and were led by the researchers’ team. Participation in the study was voluntary; all interviewees were informed about data protection issues by the enumerators and gave their consent orally at the beginning of each interview.
Primary data collection was conducted in May 2020. The survey questionnaire had different variables, including household characteristics, livelihood strategies, household assets and income composition, expenditures, collected dry forest products, push and pull factors conditioning dry forest income dependence, perception of climate change, major threats, drought years, climate change coping, and adaptation strategies [6]. During the household survey, the price of forest products and crop data were recorded using Birr (the local currency in Ethiopia). Key informant interviews and focus group discussions were used to understand the local context and to identify relevant criteria to categorize households into different wealth groups.

2.3. Data Analysis

Based on the local key informant interviews and focus group discussions, wealth status was categorized into four wealth groups, very poor, poor, medium, and rich, during the quantitative data analysis. Data was compiled and managed using Statistical Package for Social Sciences (SPSS); IBM Corp. Released 2011. IBM SPSS Statistics for Windows, Version 20.0. Armonk, NY: IBM Corp. The output of forest dependency was regressed against selected explanatory variables: age, family size, landholding size, educational level, occupation, sex, marital status, distance from the forest, and wealth status. Dry forest income was measured as a binary indicator of forest income, where 0 if forest income = 0 and 1 if forest income > 0. Binary logistic regression model was used to determine the socioeconomic factors influencing households’ forest dependency [39]. These variables were used as a proxy for socioeconomic status. The variables were chosen mainly because they cut across the social and economic domains; hence, they provided a comprehensive insight into the pattern of household forest dependency.
Total household income was calculated as the sum of total household subsistence income and total household cash income from all income sources, including income from dry forests. Spearman bivariate correlation analysis was applied to analyze the correlation between forest income with on-farm and off-farm activities. Cash income included income from the sale of forest products, while subsistence income was calculated as the value of products being directly consumed by the household or given away to friends and relatives as gifts multiplied by their local price per unit volume. Costs, such as purchased feed for animal and farm inputs, were subtracted from the total. We considered the natural forest, and labor was not considered as a cost. Various descriptive and statistical tests, including ANOVA and t-tests, were employed to examine variation in dry forest income levels of households with different socioeconomic characteristics. Both Lorenz curve and Gini coefficient were computed to assess the income equalizing effect of dry forest income [40]. Below is the description of the model used to determine the socioeconomic factors influencing forest dependency.
Logit   ( Y ) = ln   ( Π 1 - Π ) = α + β X 1 + β X 2  
Therefore,
Π = probability (Y = outcome / X1 = x1, X2 = x2)
e α + β 1 X 1 + β 2 X 2 1 + e α + β 1 X 1 + β 2 X 2
where π denotes the probability of an outcome which is the households’ dependency on forest; α is the Y intercept; βs are the regression coefficients; Xs are the set of explanatory variables, age, gender, family size, wealth, landholding size, educational level, marital status, and distance from the forest; and e = 2.71828 (natural logarithm base).
Age was taken as an indicator, as forest dependency in different households differed based on how many years the household had lived in the area and had relied on the forest product [41]. Gender was included as explanatory variable, as forest product gathering differed according to gender [42]. For instance, some tasks, such as firewood collection, exclusively belonged to women, whereas cutting wood for construction was tasked to men. Single, married, and widowed households were different in the task segregation explained under gender. Thereby, marital status was taken as one of the socioeconomic measures of forest dependency. Family size indicated the total number in household size and its role in forest dependency. The family size could be the indicator for the level of family engagement in the forest [41]. The level of wealth category was taken as indicator for the level of forest dependency, where richer people might depend less as compared to impoverished people. Landholding size denoted the total landholding size of the household, which could correlate with the forest dependency. For instance, households with larger landholding sizes may have depended less on forest products, as the land size they held gave them an opportunity to diversify their income with on-farm activities [43]. Educational level was taken as an indicator, as the forest dependency of educated people could be less dependent than that of illiterate people [44]. Additionally, the economic alternative increased with education level. Dependency of the household on the forest could be varied with distance from the forest. Thereby, the distance from the forest was considered as one of the indicators for the reliance of the household on the forest [45]. Table 1 presents the description and measurement of the explanatory variables used in the logit model.

3. Results

The results of this study were presented in explanatory texts and descriptive statistics. Our results showed that the majority of the households participating in the survey believed in the existence of climate change and the significant damage from climate change on their crops and livelihoods. More importantly, the contribution of the dry forest to the livelihood of the community was revealed by their dependency on the dry forest and the frequency of their visits to access the forest and forest products.

3.1. Household Socioeconomic Characteristics

According to their places of origin, the sampled district originated from different vegetation types: from Combretum–Terminalia woodlands (30%), dry evergreen Afromontane forest (34%), and Acacia–Commiphora woodlands (36%). About 75% of the responding households were male-headed. The average household age of the respondents was 48 ± 14 years, and each respondent had resided in his/her current village for about 35 ± 19 years. On average, the walking distance from a respondent’s residence to the nearest forest boundary took about 90 min. The wealth status of the households was defined differently by the communities in all three study sub-regions.
(i)
KH: a rich status was defined as having >150 cattle, >150 sheep, and >30 ha of land; a medium status was defined as having 100–150 sheep and cattle and 10–30 ha of land; and a poor status was defined as having <5 ha of land.
(ii)
AW: a rich status was defined as having paired oxen; a medium status was defined as having one ox; and a poor status was defined as not having oxen and farmland.
(iii)
RA: a rich status was defined as having >3 ha of land and two pairs of oxen; a medium status was defined as having a pair of oxen; and a poor status was defined as not having oxen and land.
Based on the above community-based wealth category, only 5.4% of the households were rich, and the rest were medium (53%) or poor and very poor (41.6%). The detailed heterogeneous characteristics of the 170 households are described in Table 2.

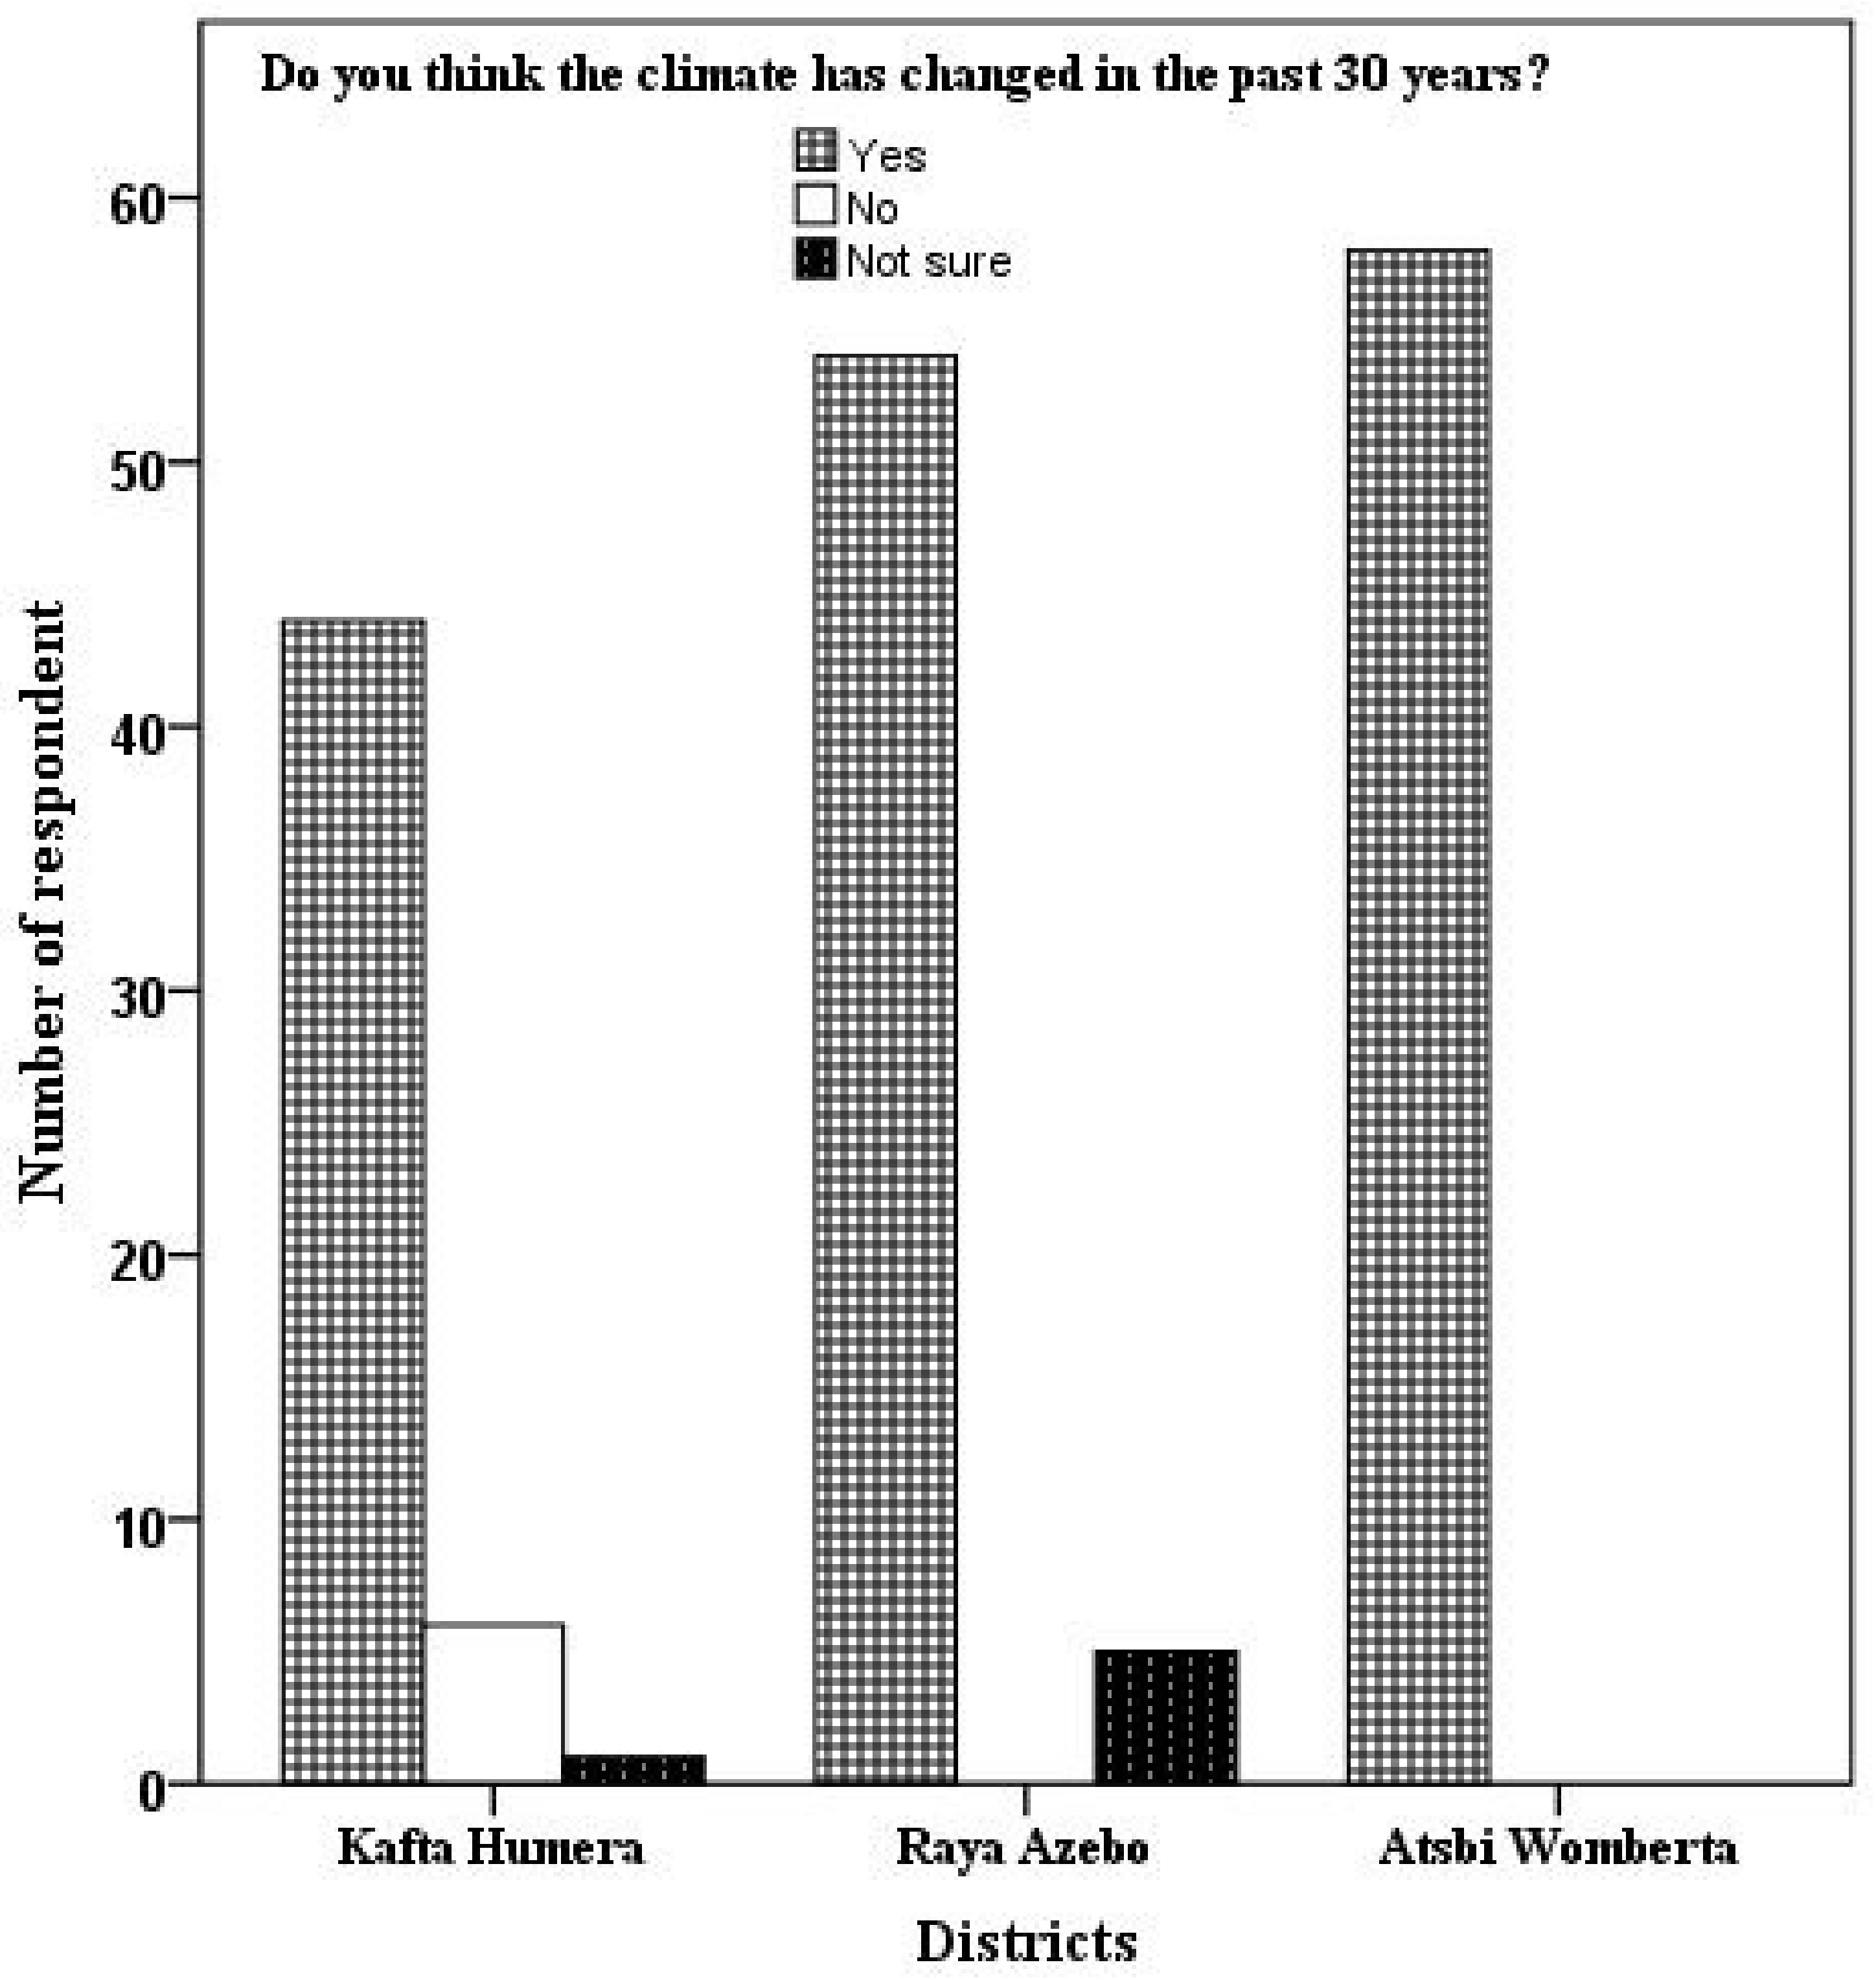
3.2. The Perception of Climate Change and Its Impacts

Participants were asked about their perception of the existence of climate change to analyze how they foresaw the importance of the dryland forest in climate change adaptation. Out of all the respondents, 92.5% (KH = 86.2%, AW = 100%, and RA = 91.5%) perceived the presence of climate change, 11.8% in KH said that they perceived no change, while 2% in KH and 8.5% in RA were not sure about the existence of climate change as shown in Figure 2. The chi-squared statistics were significant (χ2 = 20.8, p < 0.005) in association with Cramer’s phi statistic (ϕc = 0.351), indicating a strong relationship between the district and the perception of climate change.
Out of all the respondents, 69% connected the presence of climate change with the decrease in the amount and intensity of rainfall; 23% connected it with the increasing temperature; and the rest connected it with irregular rainfall, wind speed, and other factors.
The chi-squared statistics showed a significant (χ2 = 60.8, p < 0.001) association with Cramer’s phi statistic (ϕc = 0.605), indicating a strong relationship between the district and the perception of climate change (Table 3).
The respondents believed that climate change was caused by human activities, and, for example, deforestation for agricultural expansion, firewood, timber, and farm tools was believed to be the cause by 61.3%, 20.8%, 13.1%, and 4.8% of respondents, respectively. Some respondents believed in more external drivers, such as a punishment from God or natural hazards. During the focus group discussion, we identified the major recent droughts in 2003, 2011, 2012, and 2015, and flooding was identified in 2008 in the KH District. In the AW District, droughts occurred in 2008, 2012, 2016, and 2017, plus high frost occurred in 2018. Whereas, in RA, droughts occurred in 1991, 1992, 2008, and 2015. Among all of the households, about 74.5% of their livelihoods were highly affected by droughts.
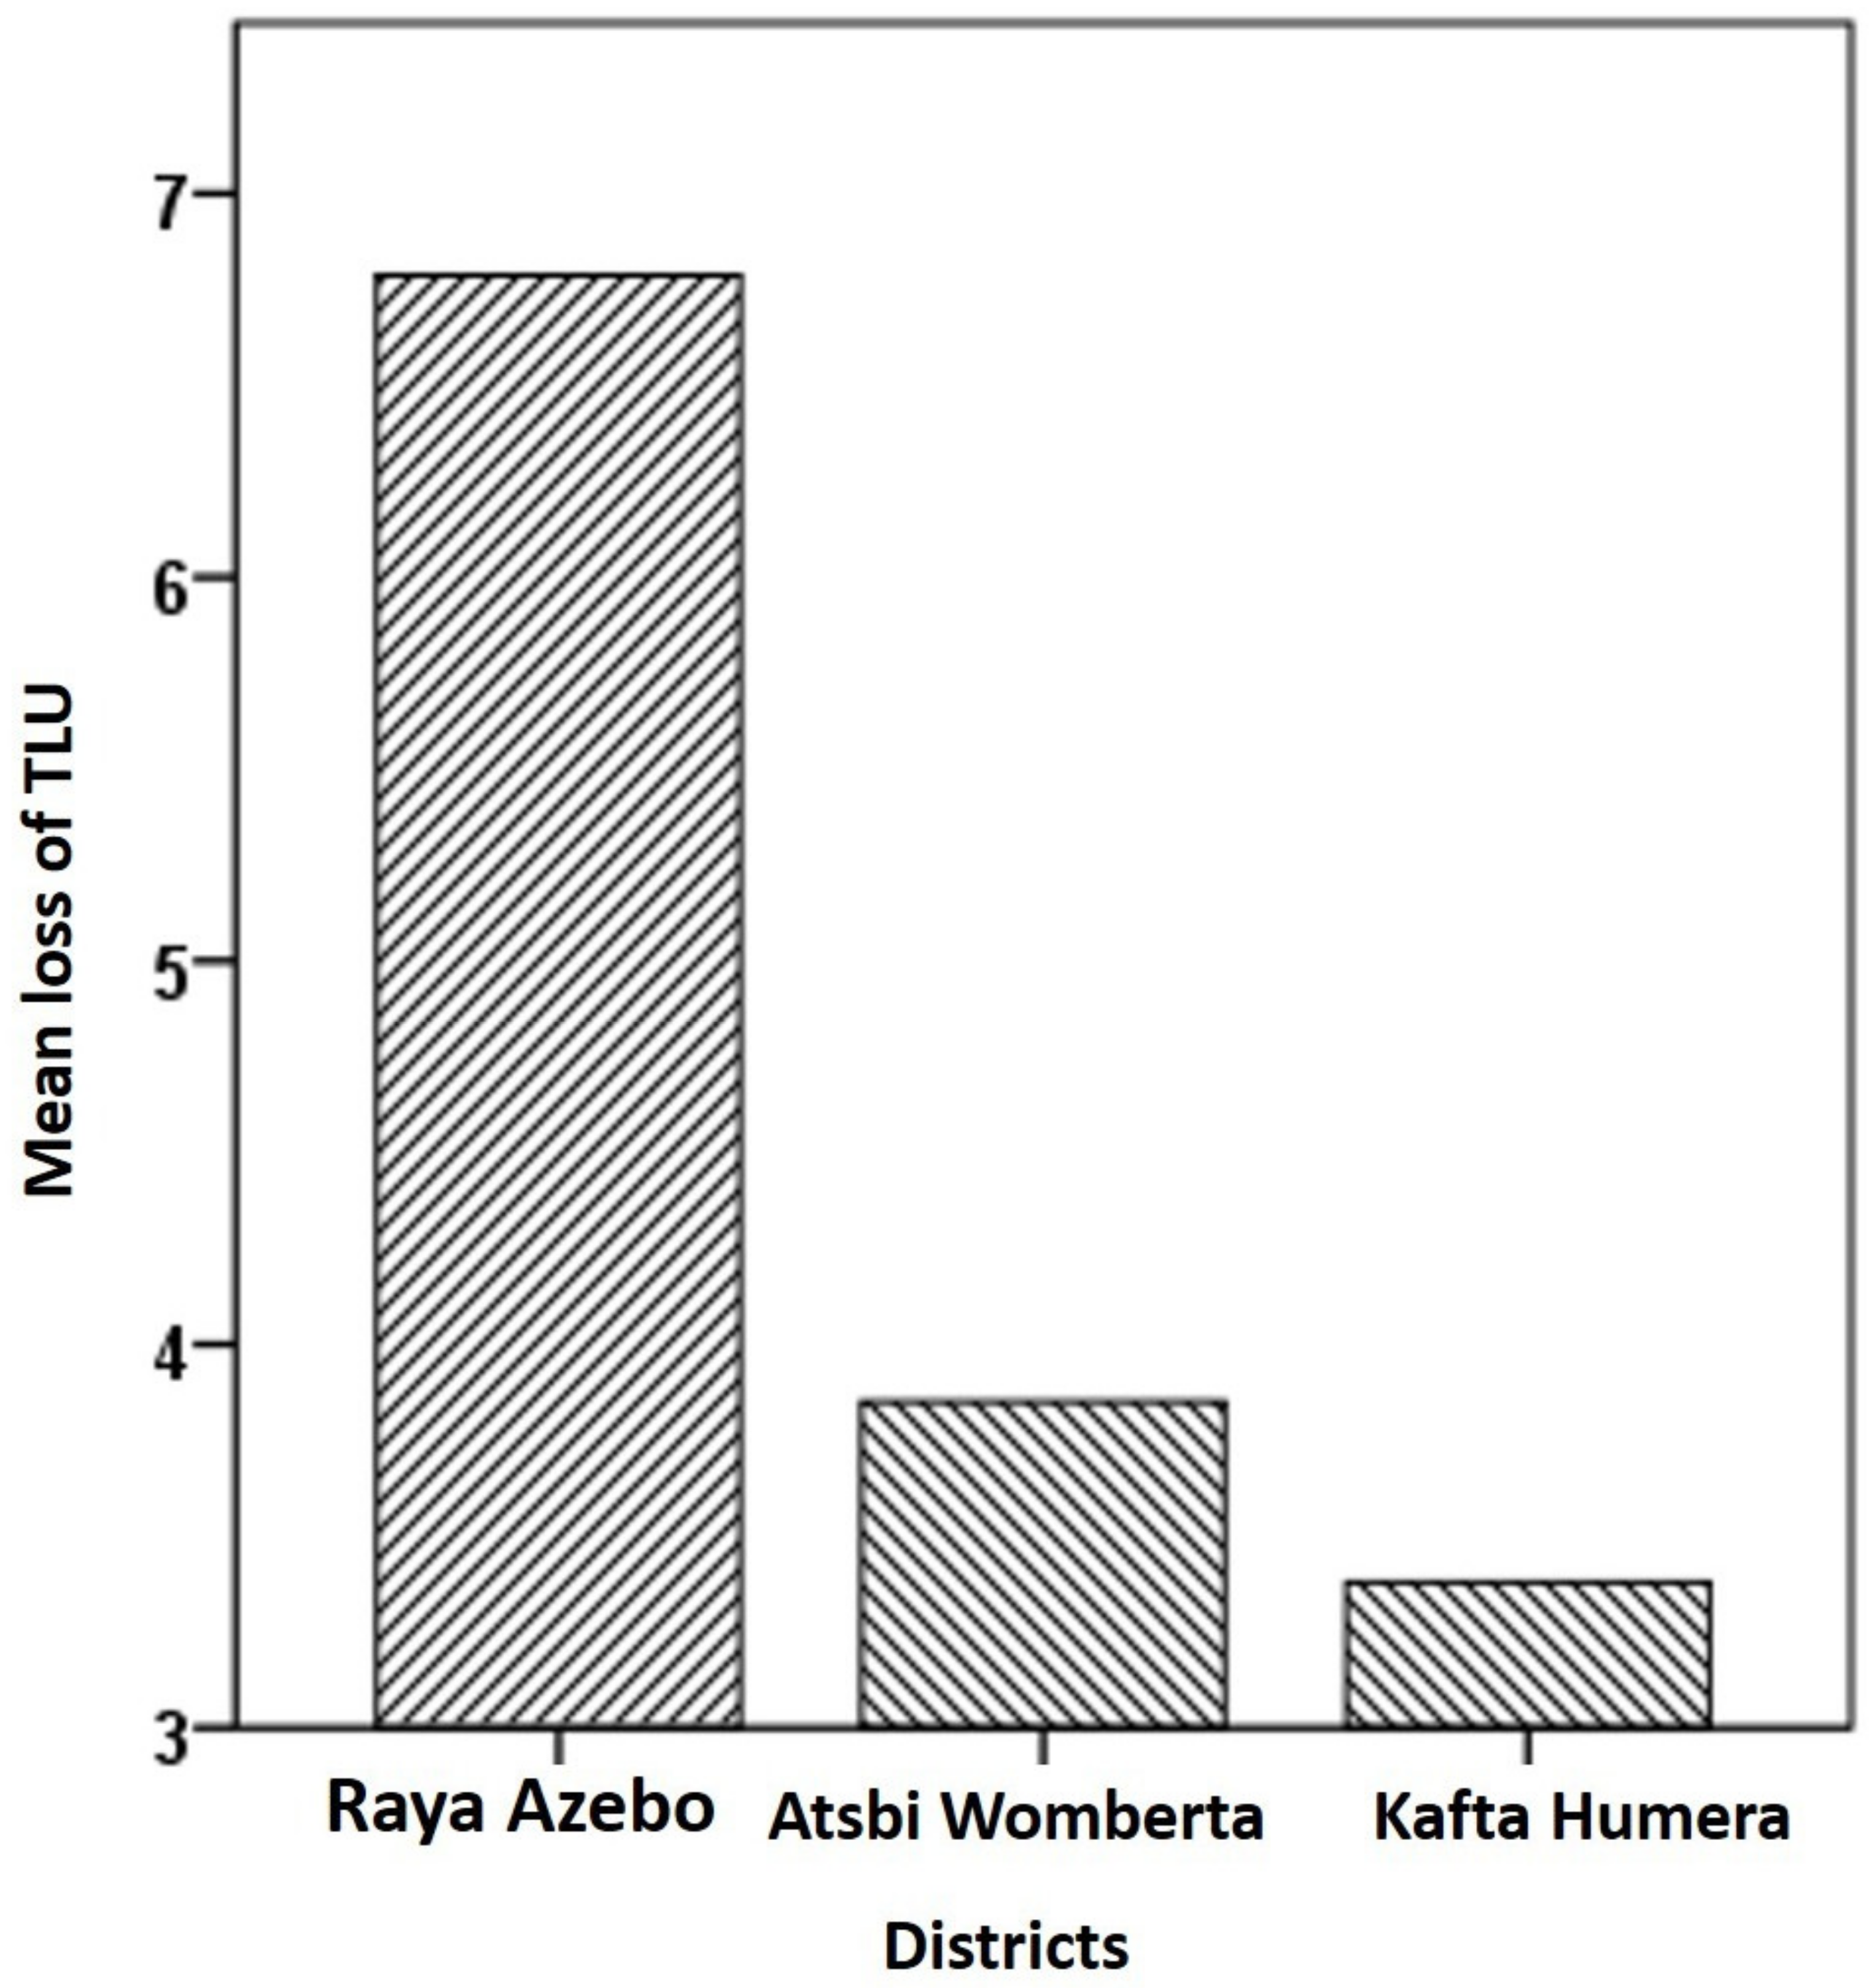
More than 82% reported that crops were highly vulnerable to climate change followed by livestock production. Due to higher temperatures and low rain fall in the KH District, Sorghum bicolour (sorghum) and Sesamum indicum (sesame) were the most vulnerable crops; for the AW District, they were Hordeum vulgare (barley), Triticum aestivum (wheat), and Pisum sativum (peas); and, for RA, they were Hordeum vulgare (Barley), Eragrostis teff (teff), and Sorghum bicolour (sorghum). With an average value of 3.32 TLU, significant variations in livestock loss occurred due to drought-related risk across the three districts (Figure 3). Of the livestock, cattle and sheep were highly vulnerable to droughts, whereas goats were relatively resistant.
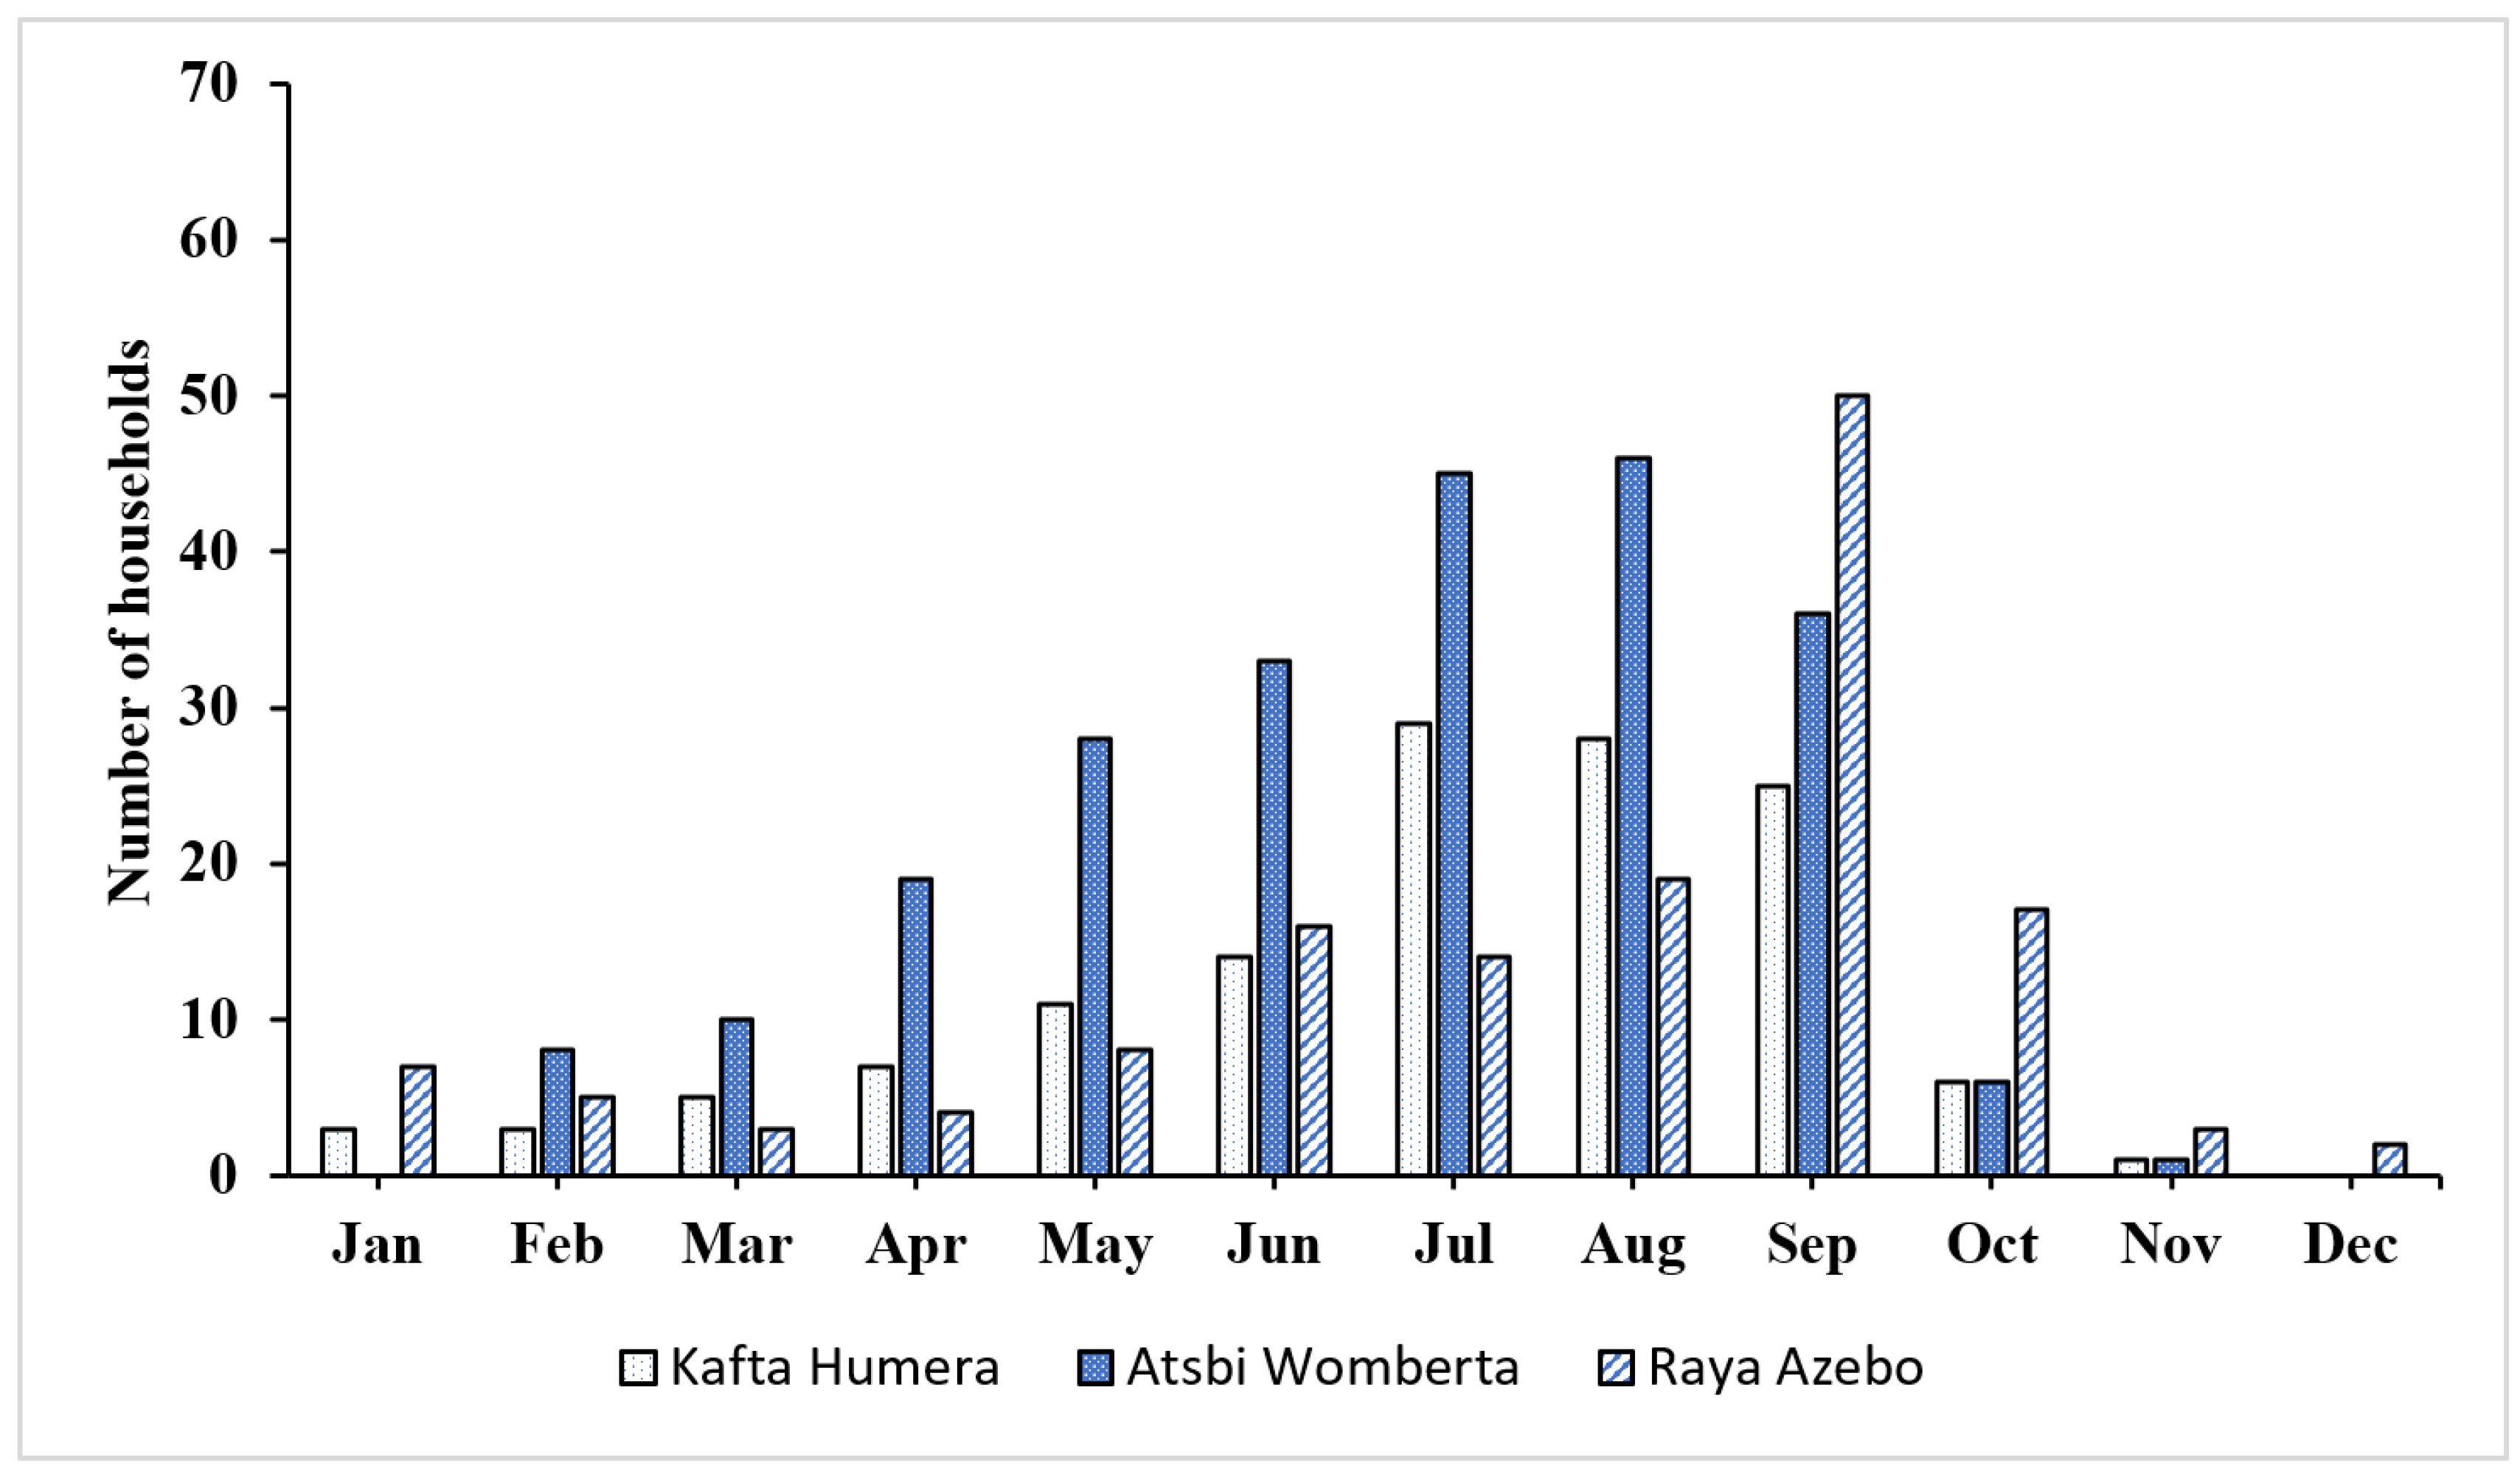
From July to September, more than 52% of the respondents faced difficulties in covering their household food consumption by themselves. These months were the most severe for the AW District followed by the RA District (Figure 4).

3.3. Climate Change Coping and Adaptation Strategies

The households’ climate change coping and adaptation strategies were categorized as livestock-based, crop-based, forest-based, and externally driven strategies. In these categories, sub-strategies were defined, and the households in the study sites were asked to identify which sub-strategies were applied in the context of their households. The household respondents (58.1%) reported that both off-farm (wage and petty trade) and dry forest services and goods were less affected during the drought events. The prime coping strategy used by many of the respondents in AW and RA was participation in off-farm activities (77.6% and 34.4%). Meanwhile, the livestock and crop-based (35.7% and 35.7%) strategies were used equally as prime coping strategies in KH, whereas forest-based coping strategies covered 16.7%, 14.8%, and 12.1% of the prime coping strategies in KH, RA, and AW, respectively (Table 4).
Livestock-, crop-, and forest-based products were three adaptation strategies that were equally applied to reduce the impacts of climate changes in the KH District. In the AW District, off-farm activities were followed by livestock-based adaptation strategies, whereas, in the RA District, the livestock-based strategy, followed by the crop-based adaptation strategy and participation in off-farm activities, was adopted as shown in Table 5. More than 54% of the households’ selected adaptation and coping strategies were based on their own indigenous knowledge obtained through consultation with elders and family members. Only 13% of the respondents benefited from the climate forecast/early warning information from the districts’ agricultural expertise and the media. Table 5 shows the major household adaptation strategies applied in order to reduce the impacts imposed by climate change.

3.4. Contribution of Dry Forest to Climate Change Adaptation

Overall, four major sources of income, crops, livestock, the forest, and off-farm activities (casual work and petty trade), were identified. There was a significant association between the district (Χ2(10) = 21.27, p < 0.05) and the income source type. The total household income source was estimated in Ethiopian Birr (ETB) in all study sites, and the results showed that the greatest sources of a household’s total income in KH (425,932.94 ETB) and RA (43,435.42 ETB) were from crop production followed by livestock, whereas in AW (298,434.51 ETB), they were from off-farm activates and the forest. There is likely a significant difference in terms of dry forest income (p < 0.05). More than 94% of all households visited the forest at least once a month for access to it and its products. About 43.5% and 35.5% of the households collected forest products once a month followed by their collection once a week, respectively. The contribution of the dry forest to household income was about 24.4% in AW, 22.15% in KH, and 4.93% in RA (Table 6). More than 34% of dry forest access was from women supporting their livelihoods. The dry forest was used for risk reduction, as a means of income diversification, and for saving before the onset of a drought. Similarly, based on our assessment, the dry forest also provided livestock fodder, especially during drought periods. In general, the compiled information from the households, key informant interviews, and focus group discussions confirmed that there was an increasing household dependency on dry forest income.
The contribution of each forest product was varied across vegetation types; for instance, the contribution of timber and firewood was higher in dry evergreen Afromontane Forests than in the two vegetation types. More than 51% of the households collected forest products from state forests, and 34.7% collected from community forests. Most of the dry forest and forest products were used for timber and firewood production. Their contribution to medicine, gum and resin, and animal feed were lower compared to others (Figure 5).
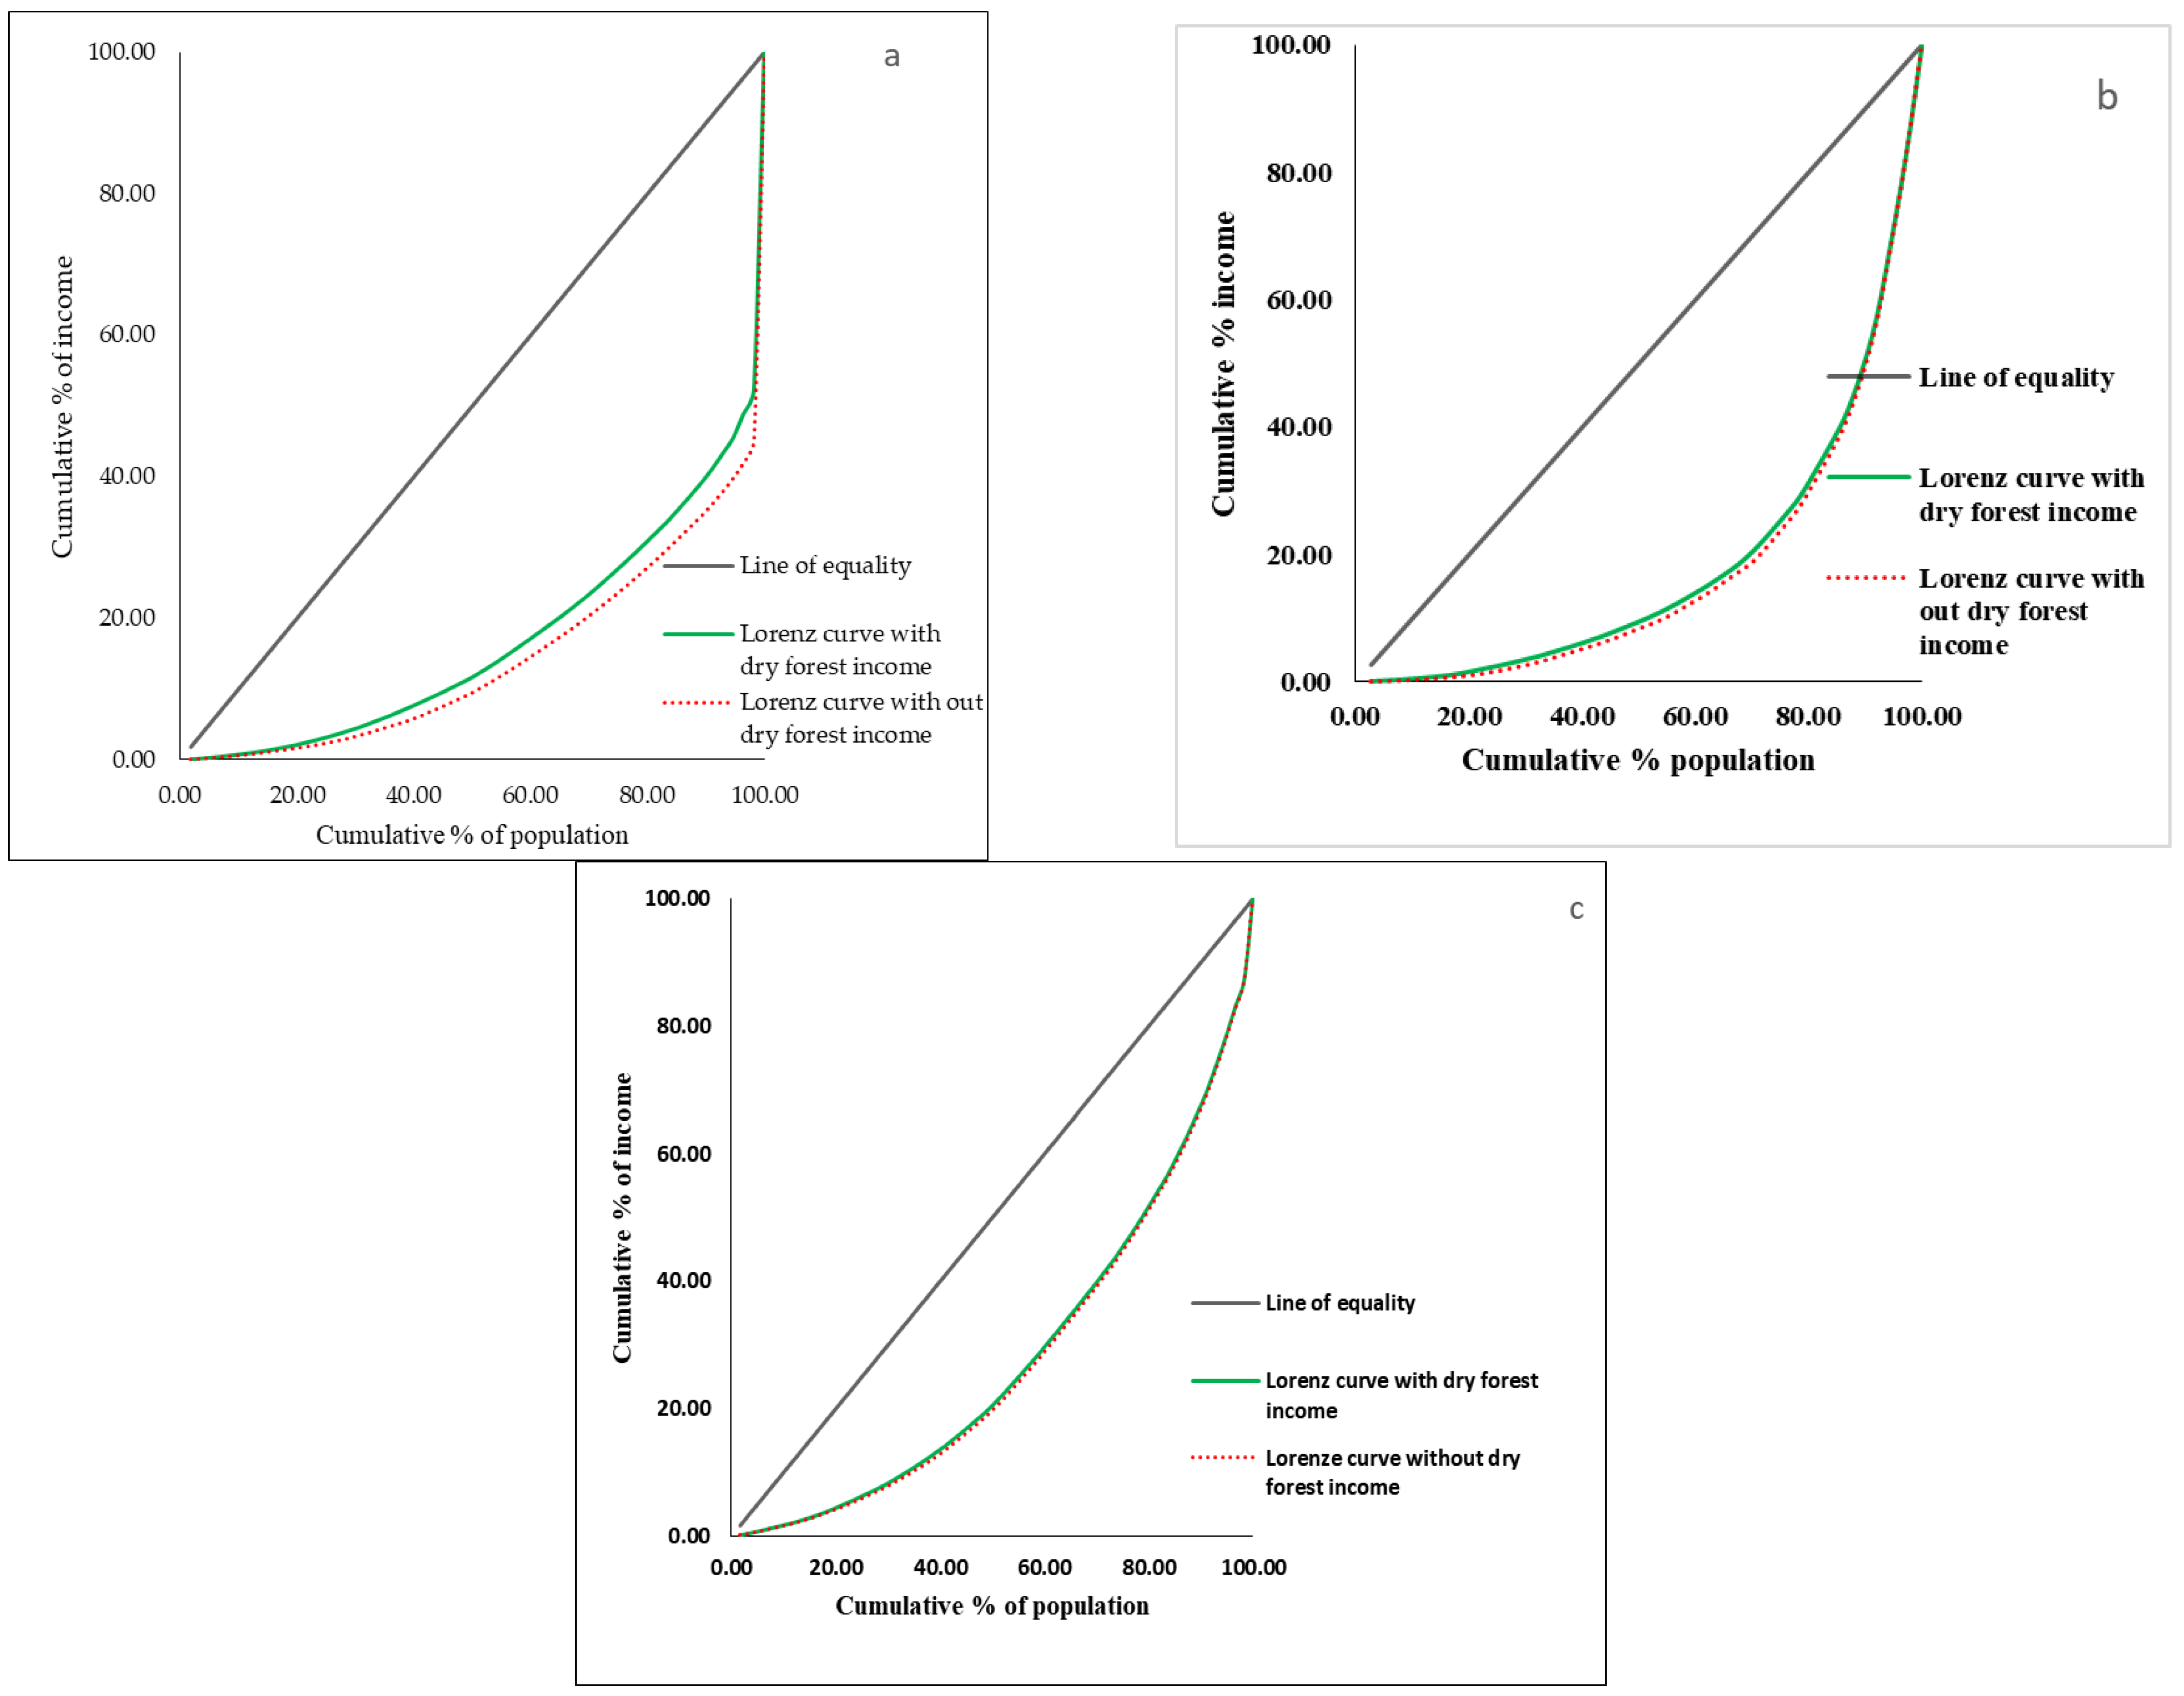
Overall, a total of 48 major species of dry forests were used for timber, firewood, charcoal, wild edible fruits, animal feed, gum, and incense (Appendix A). This study confirmed that the dry forest contributed to minimizing the variation in total household incomes. The quantitative analysis of the different dry forest types showed a positive effect. The Gini coefficient depicted that forest income in the study area contributed to narrowing the gap between the line of equality and the Lorenz curve by 21% in AW, 3.02% in KH, and 3% in RA, which is illustrated in Figure 6a–c, respectively.
Generally, this study found that 53% of income from dry forests contributed to the medium wealth group, and 41% contributed to the poor. However, the dry evergreen Afromontane Forest contributed to 62% of the poor wealth group in the AW District.

3.5. Socioeconomic Factors Influencing Household Dry Forest Income

A Spearman bivariate correlation analysis showed that the level of dry evergreen Afromontane Forest income was positively and significantly correlated with income from livestock (p < 0.01) and crop production (p < 0.05) in the AW District. However, it was insignificant for off-farm activities (casual and pity trade), remittance, and direct aid and food for work programs. The income from Acacia–Commiphora woodlands was positively and significantly correlated with income from livestock production (p < 0.05), but it was negative and significantly correlated with income from direct aid and food for work programs (p < 0.05) in the RA District. Moreover, the income from Combretum–Terminalia woodlands was not significantly association with the other sources of income. However, this was positively related to livestock, remittance, and off-farm activities, but it was negatively correlated with crop production and food for work programs.
Gender, occupation, wealth status, and the distance of the forest from their houses were variables that significantly affected the income level from Combretum–Terminalia woodlands in the KH District. The age of the respondent in RA and the family size of the household in the AW District (Table 7) influenced dry forest income levels.

4. Discussion

4.1. The Perception of Climate Change and Its Impacts

Understanding the perception of climate change is crucial, as it influences individual- and community-based adaptation. Coping and adaptation decisions mainly depend on the perceived susceptibility to climate variability and change [46]. The vast majority of respondents in the study area believed that climate change had occurred. Changes in temperature and rainfall were recognized by the study participants, mostly in terms of weather patterns, greater temperatures, below-normal rainfalls, short rainy seasons, alongside the increased frequency and intensity of extreme weather events. Farmers’ understanding of climate change was documented in similar ways in surveys conducted in Ethiopia [47]. Our findings were also similar to those of previous studies that reported on the southern lowlands of Ethiopia, where 88% of 359 respondents perceived a decrease in rainfall [48]. Other studies in the Nile Basin of Ethiopia, based on a survey of 1000 households in twenty districts, reported a decline in precipitation and an increase in temperature between 1985 and 2005 [49,50].
Climate change has a wide range of effects on agriculture. Changes in the spatiotemporal distribution of rainfall, soil moisture availability, length of the growing season, pest and disease incidence, and shifts in the optimal growing locations can all affect crop productivity [51]. In addition to the direct effects of climate extremes, variations in the availability of feed and water as well as the incidence of diseases have a significant impact on livestock productivity. Farmers’ perception of the climate change impacts on agricultural production in the study area showed that 82% of the respondents perceived that crops, followed by livestock production, were highly vulnerable to climate change. A large majority of the respondents perceived a considerable reduction in crop production due to higher temperatures and reduced rainfall. Furthermore, many respondents also perceived a decrease in livestock production due to droughts. Similar studies found that the majority of respondents (77%) perceived a considerable reduction in crop production [51].
Understanding the perception of climate change of these communities may influence how they respond to and adapt to its effect. It is also helpful to understand the role of dry forests in coping and adaptation strategies. Similarly, to execute suitable community-based adaptation methods, it is necessary to understand the local perceptions of climate change and to develop a consensus on the reality of its implications.

4.2. Climate Change Coping and Adaptation Strategies

Farmers have different coping and adaptation strategies to deal with climate change, including recurrent droughts. The respondents in the study area used various methods to cope with the climate change effects, such as destocking, off-farm activities, gum and resin marketing, other forest product collection, aid, migration, and other coping mechanisms. These finding match with the findings [22] that households in dry forest areas used various coping strategies such as destocking, off-farm activities, gum and resin marketing, other forest product collection, aid, and migration at 82.2%, 48.6%, 69.8%, 81.9%, 76.4%, and 84.8%, respectively. In other studies, households in the Nile Basin of Ethiopia used nothing (51.3%), sold livestock (26%), and borrowed from relatives (10%) to cope with extreme climate events [52]. Furthermore, a study conducted in a Kenyan district showed that sales of assets, casual labor, food aid, reliance on friends and relatives, and migration were coping strategies to address climate change [53].
Climate change adaptation has the potential to reduce the impact of the changes in climatic conditions. Hence, studying the adaptation measures taken by communities is important for developing sustainable strategies. Common adaptation strategies in this study area included the use of improved crop varieties, changing planting date, diversifying crops, water diversion and irrigation, exchanging animals for cereals, storing hay, livestock diversification, increasing fuelwood and charcoal collection, gum and resin collection, and area closure. Additionally, credit unions, migration, and food aid were also used. Similar practices reported in empirical studies included cultivating different crops, changing crop variety, changing planting and harvesting dates, planting trees, irrigation, off-farm income diversification, conservation agriculture, as well as soil and water conservation [54,55,56]. In Africa, farmers routinely change their planting date by a month or a year in response to rainfall variability [57].

4.3. The Role of Dry Forests for Adaptation Strategies

The dry forests, which occur in many parts of the country and have several months of severe or absolute drought, are the dominant feature of landscapes in countries such as Ethiopia. Due to their extensive distribution, importance to local livelihoods, and vulnerability to climate change, it is crucial to study the interaction between the dry forest and communities, specifically with respect to recurrent droughts. According to the UN Convention on Combating Desertification (UNCCD), enhancing the understanding between dryland development, ecosystem management, and community resilience is crucial for combatting desertification [58].
The results indicated that the reduction in crop production and the loss of livestock were the main factors that decreased the livelihood coping and adaptation strategies. Furthermore, the key informant interviews and focus group discussions indicated that the droughts exacerbated community’s vulnerability. The livelihood dependence on the dry forest has increased since 2000. For instance, the majority of respondents and key informants confirmed that the fodder production from the dry forest increased during drought periods with increased grazing. Similar studies in the Negele Borana Zone showed that most camels and goats survive the recurrent drought season by grazing on leaves from the dry forest [22].
The respondents emphasized that the role of dry forests was increasingly important for coping and adaptation strategies. Dry-forest-based income plays a crucial role in filling the seasonal income gaps, especially if crop production and livestock decline during droughts. Dry forests are essential for filling seasonal income gaps during drought periods in the drylands of southeastern Ethiopia [6]. Despite a reduction in head count poverty in Ethiopia from 59% to 12% between 1992 and 2011, poverty in the study area remains higher than the national average [59]. The incorporation of dry forest income helps reduce poverty. Moreover, forests play an important role in coping with unforeseen gaps in income [8]. According to different studies, income sources of the households in the different study sites were listed as crops, livestock, and remittance. Some included aid-based income as one of the sources, but forest income was often forgotten. This study revealed that the contribution of dry forests to household incomes was 16.57%, whereby it showed a great contribution as compared to the 10% contribution of the nonfarm income share by remittance in the region [60]. Moreover, the study revealed that, in KH, the forest income share was about 28%, which was the same amount of income provided as that of crops and livestock during drought occurrences. The addition of forest income in the study area decreased the area between the line of equality, the Lorenz curve, and the Gini coefficient. The study conducted in the drylands of southeastern Ethiopia indicated that the addition of forest income reduced the area between the line of equality, the Lorenz curve, and the Gini coefficient by 15% in Liben and 12.4% in Afder [6].
The contribution of the dry forest to household incomes differed within the districts. The highest dry forest shares of household incomes were registered in AW and KH followed by RA. The variation in the goods and services between the vegetation types might have been related to the difference in the economic importance of tree species.

5. Conclusions

The aim of this study was to assess the socioeconomic contribution of dry forests to the local communities living in the dryland ecoregion of the Tigray Region, Ethiopia. The livelihood of the people in the study area depended on crop production, livestock rearing, forest products, and nonfarm activities (casual work and petty trade). This study indicated that the community relied on the dry forest for construction materials, fuel wood collection, gum and resin, wild fruit, honey, and charcoal. Our findings confirmed that dry forest products played an important role in the livelihoods of the households and in poverty alleviation in the dryland area, where droughts are common phenomena and are expected to be recurrent as climate change exacerbates the situation. The study results emphasized the increasing role of dry forests for coping and adaptation strategies, especially during the recurrent drought period when crop and livestock production were declining. Additionally, their role is increasingly important in filling the seasonal income gaps in this period. Despite the important role of dry forests, this study revealed that increasing pressure, due to recurrent droughts and population increases, will exacerbate forest degradation.
The current findings had broad policy implications, especially since the study revealed the critical role of dry forest income in the livelihood of the community and in climate change adaptation. If dry forest income is not considered in household incomes, the poverty headcount ratio and income inequality rise. Better management of dry forests is crucial for improving livelihoods while also ensuring long-term adaptation roles. Promoting their integration into national, regional, and local development planning can help to improve the sustainability of the dry forest. Various options are needed to find a balance between the increasing role of dry forests in climate change adaptation and forest degradation. For instance, policymakers can reduce the pressure on dry forests by introducing agroforestry systems and by establishing farmer cooperation in commercializing non-timber forest products such as gum and resin. Finally, more research is needed to understand the increasing role of dry forest products in climate change adaptation over time and to understand their contribution to the national economy at large.

Author Contributions

Conceptualization, M.T., A.M., B.T. and S.B.E.; methodology, M.T, A.M. and B.T.; software, A.M., M.T. and S.B.E.; validation, M.T., A.M., B.T., Z.M., K.L. and S.S.; formal analysis, M.T., A.M., S.B.E. and K.L.; investigation, M.T., A.M., S.B.E. and Z.M.; resources, M.T, Z.M., K.L. and S.S.; data curation, A.M. B.T. and M.T.; writing—original draft preparation, M.T., A.M. and B.T.; writing—review and editing, M.T., S.B.E., K.L. and S.S.; visualization, M.T., A.M. and S.B.E.; supervision, M.T. B.T. and Z.M.; project administration, M.T., A.M. and Z.M.; funding acquisition, B.T., Z.M., K.L. and S.S. All authors have read and agreed to the published version of the manuscript.

Funding

This research was funded by the then Ethiopian Environment and Forestry Research Institute, now merged with Ethiopian Forestry Development. The publication of the article was funded by the Open Access Fund of the Leibniz Association.

Data Availability Statement

Not applicable.

Conflicts of Interest

The authors declare no conflict of interest.

Appendix A

Table A1. Major dry forest species and their uses in the study area.
No.Scientific NameLocalUsed for
TimberFirewoodCharcoalWild FoodAnimal FeedGum and Resin
1Acacia etbaicadedeta
2Acacia meliferasebansa
3Acacia niloticachea
4Acacia tortiliskarora
5Adansonia digitataDima
6Anogeissus leiocarpaHanse
7Asystasia gangeticagirbia
8Azadirachta indicaNeem kolla
9Balanites aegyptiacamekie
10Becium grandiflorum (Lam.) Pichi-serm.tebeb
11Boswellia papyriferameqer
12Cadia purpureashlen
13Carissa edulisagam
14Celtis africanarowey
15Combretum fragrans (C. adegonium)tenkeleba
16Combretum aculeatumMuluo
17Commiphora quadricinctaAnqua
18Cordia africanamaytaroAwhie
19Dalbergia melanoxylonZibbe
20Diospyros mespiliformisAye
21Dodonaea angustifoliatahses
22Erica arboreahasti
23Euclea schimperikleaw
24Euclyptus camaldulensisKeyih Kelamitos
25Ficus sycomorussagla
26Grewia ferrugineatsimkuya
27Juniperus procerasreda/Tsihdi Habesha
28M. undata (Thunb.) Blakelockhatshats
29Maytenus arbutifoliaatat
30Meriandra bengalensis (Konig ex. Roxb.) Benth.Meseguh
31Olea europaea subsp. AfricanaAwlie
32Opuntia ficus-indicabeles
33Pennisetum sphacelatumselah
34Rhus glutinosa A.Rich.tetaelo
35Rhus natalensisatamin
36Rhus spp.mishela eiff
37Tamarindus indicahumer
38Tarchonanthus camphorantusEibukk
39Terminalia browniiweiba
40Ziziphus spina-christigaba
41Unknownswansa
42UnknownAwutelo
43UnknownTsekemto
44Unknownmendae
45Unknownbiyanka/dayanka
46Unknownagewdayo
47Unknowntsera
48Unknownderasi

References

  1. Mwangi, E.; Dohrn, S. Biting the Bullet: How to Secure Access to Dry Lands Resources for Multiple Users; International Food Policy Research Institute: Washington, DC, USA, 2006. [Google Scholar]
  2. Petheram, L.; Campbell, B.; Marunda, C.; Tiveau, D.; Shackleton, S. The Wealth of the Dry Forests: Can Sound Forest Management Contribute to the Millennium Development Goals in Sub-Saharan Africa? Forest Livelihood Briefs 4; CIFOR: Bogor, Indonesia, 2006. [Google Scholar]
  3. CIFOR. Thinking beyond the Canopy; CIFOR Annual Report; CIFOR: Bongor, Chad, 2008. [Google Scholar]
  4. Lemenih, M.; Abebea, T.; Olsson, M. Gum and resin resources from some Acacia, Boswellia and Commiphora species and their economic contributions in Liban, south-east Ethiopia. J. Arid Environ. 2003, 56, 146–166. [Google Scholar] [CrossRef]
  5. Vedeld, P.; Angelsen, A.; Sjaastad, E.; Kobugabe Berg, G. Counting on the Environment: Forest Incomes and the Rural Poor; EDP 98; World Bank: Washington, DC, USA, 2004. [Google Scholar]
  6. Worku, A.; Pretzsch, J.; Kassa, H.; Auch, E. The significance of dry forest income for livelihood resilience: The case of the pastoralists and agro-pastoralists in the drylands of southeastern Ethiopia. For. Policy Econ. 2014, 41, 51–59. [Google Scholar] [CrossRef]
  7. Mamo, G.; Sjaastad, E.; Vedeld, P. Economic dependence on forest resources: A case from Dendi District, Ethiopia. For. Policy Econ. 2007, 9, 916–927. [Google Scholar] [CrossRef]
  8. Fonta, W.M.; Eme, H.I.; Elias, A. Can non-wood forest products be used in promoting household food security? Evidence from savannah and rain forest regions of Southern Nigeria. J. Econ. Sustain. Dev. 2011, 2, 1–13. [Google Scholar]
  9. Alemu, A.; Pretzsch, J.; El-Sheikh, T.M.; Yahia, O.A. Commodity chain of frankincense from the dry woodlands of Nuba Mountains, South Kordofan State, Sudan. Small-Scale For. 2012, 11, 365–388. [Google Scholar] [CrossRef]
  10. Rowland, D.; Blackie, R.R.; Powell, B.; Djoudi, H.; Vergles, E.; Vinceti, B.; Ickowitz, A. Direct Contributions of Dry Forests to Nutrition: A Review. Int. For. Rev.-Spec. Issue Glob. Dry For. 2015, 17, 44–52. [Google Scholar] [CrossRef] [Green Version]
  11. Ickowitz, A.; Powell, B.; Salim, A.; Sunderland, T. Dietary Quality and Tree Cover in Africa. Glob. Environ. Chang. 2014, 24, 287–294. Available online: http://www.sciencedirect.com/science/article/pii/S0959378013002318 (accessed on 21 October 2022). [CrossRef] [Green Version]
  12. Chukwuone, N.A.; Okeke, C.A. Can non-wood forest products be used in promoting household food security? Evidence from savannah and rain forest regions of Southern Nigeria. For. Policy Econ. 2012, 25, 1–9. [Google Scholar] [CrossRef]
  13. Campbell, B.M.; Angelsen, A.; Cunningham, A.; Katerere, Y.; Sitoe, A.; Wunder, S. Miombo Woodlands—Opportunities and Barriers to Sustainable Forest Management. Unpublished Internal Paper. CIFOR: Indonesia. 2007. Available online: http://www.cifor.org/miombo/docs/Campbell_BarriersandOpportunities.pdf (accessed on 24 May 2015).
  14. Syampungani, S.; Chirwa, P.W.; Akinnifesi, F.K.; Sileshi, G.; Ajayi, O.C. The miombo woodlands at the crossroads: Potential threats, sustainable livelihoods, policy gaps and challenges. Nat. Resour. Forum 2009, 33, 150–159. [Google Scholar] [CrossRef]
  15. Djoudi, H.; Vergles, E.; Blackie, R.R.; Koffi Koame, C.; Gautier, D. Dry forests, livelihoods and poverty alleviation: Understanding current trends. Int. For. Rev.-Spec. Issue Glob. Dry For. 2015, 17, 53–68. [Google Scholar] [CrossRef] [Green Version]
  16. Gumbo, D.; Moombe, K.; Kandulu, M.; Kabwe, G.; Ojanen, M.; Ndhlovu, E.; Sunderland, T. Dynamics of the Charcoal and Indigenous Timber Trade in Zambia: A Scoping Study in Eastern, Northern and Northwestern Provinces. CIFOR Occasional Paper 86. 2013. Available online: http://www.cifor.org/publications/pdf_files/OccPapers/OP-86.pdf (accessed on 21 October 2022).
  17. Trenberth, K.E. The impact of climate change and variability on heavy precipitation, floods, and droughts. Encycl. Hydrol. Sci. 2005, 17, 1–11. [Google Scholar]
  18. Haile, G.G.; Tang, Q.; Hosseini-Moghari, S.M.; Liu, X.; Gebremicael, T.G.; Leng, G.; Kebede, A.; Xu, X.; Yun, X. Projected impacts of climate change on drought patterns over East Africa. Earth’s Future 2020, 8, e2020EF001502. [Google Scholar] [CrossRef]
  19. Intergovernmental Panel on Climate Change (IPCC). Africa: Climate change, impacts, adaptation and vulnerability. In Contribution of Working Group II to the Fourth Assessment Report of the IPCC on Climate Change; Parry, M.L., Canziani, O.F., Palutikof, J.P., van der Linden, P.J., Eds.; Cambridge University Press: Cambridge, UK, 2007; pp. 433–467. [Google Scholar]
  20. NAPA. Ethiopian Climate Change National Adaptation Programme of Action; Government of Federal Democratic Republic of Ethiopia: Addis Ababa, Ethiopia, 2007. [Google Scholar]
  21. Homann, S. Towards endogenous livestock development: Borana pastoralists’ responses to environmental and institutional changes. Hum. Ecol. 2008, 36, 503–520. [Google Scholar] [CrossRef] [Green Version]
  22. Amanuel, W.; Tesfaye, M.; Worku, A.; Seyoum, G.; Mekonnen, Z. The role of dry land forests for climate change adaptation: The case of Liben Woreda, Southern Oromia, Ethiopia. J. Ecol. Environ. 2019, 43, 11. [Google Scholar] [CrossRef]
  23. Pulla, S.; Ramaswami, G.; Mondal, N.; Chitratarak, R.; Suresh, H.S.; Dattaraja, H.S.; Vivek, P.; Parthasarathy, N.; Ramesh, B.R.; Sukumar, R. Assessing the resilience of global seasonally dry tropical forests. Int. For. Rev.-Spec. Issue Glob. Dry For. 2015, 17, 90–112. [Google Scholar] [CrossRef]
  24. FAO. Global Forest Resources Assessment 2010: Main Report; Food and Agriculture Organization of the United Nations: Rome, Italy, 2010; Available online: http://www.fao.org/docrep/013/i1757e/i1757e.pdf (accessed on 21 October 2022).
  25. Fisher, M.; Chaudhury, M.; Mccusker, B. Do Forests Help Rural Households Adapt to Climate Variability? Evidence from Southern Malawi. World Dev. 2010, 38, 1241–1250. [Google Scholar] [CrossRef]
  26. Brockhaus, M.; Djoudi, H.; Locatelli, B. Envisioning the future and learning from the past: Adapting to a changing environment in northern Mali. Environ. Sci. Policy 2013, 25, 94–106. [Google Scholar] [CrossRef] [Green Version]
  27. Thondhlana, G.; Shackleton, S.; Muchapondwa, E. Kgalagadi Transfrontier Park and its land claimants: A pre-and postland claim conservation and development history. Environ. Res. Lett. 2011, 6, 024009. [Google Scholar] [CrossRef]
  28. Thondhlana, G.; Vedeld, P.; Shackleton, S. Natural resource use, income and dependence among San and Mier communities bordering Kgalagadi Transfrontier Park, southern Kalahari, South Africa. Int. J. Sustain. Dev. World Ecol. 2012, 19, 460–470. [Google Scholar] [CrossRef]
  29. Lemenih, M.; Kassa, H. (Eds.) Opportunities and Challenges for Sustainable Production and Marketing of Gums and Resins in Ethiopia; CIFOR: Bogor, Indonesia, 2011. [Google Scholar]
  30. Center for International Forest Research (CIFOR). Forest Product, Livelihood and Conservation: Case Study of NTFPs System; Sunderland, T., Ndoye, O., Eds.; CIFOR: Bogor, Indonesia, 2005; Volume 2. [Google Scholar]
  31. Robledo, C.; Clot, N.; Hammill, A.; Riche, B. The role of forest ecosystems in community-based coping strategies to climate hazards: Three examples for rural areas in Africa. For. Policy Econ. 2012, 24, 20–28. [Google Scholar] [CrossRef]
  32. Tesfaye, M.; Negash, M. Combretum—Terminalia vegetation accumulates more carbon stocks in the soil than the biomass along the elevation ranges of dry land ecosystem in Southern Ethiopia. J. Arid Environ. 2018, 155, 59–64. [Google Scholar] [CrossRef]
  33. Shepherd, G.; Chipeta, M.; Campbell, B. Africa’s Tropical Dry Forests—Time to Re-Engage: An Agenda for Priority Research; Centre for International Forestry Research: Bogor, Indonesia, 2002; Available online: http://www.cifor.org/library/1081/africas-tropical-dry-forests-time-to-re-engage-anagenda-for-priority-research/ (accessed on 21 October 2022).
  34. Sunderland, T.; Apgaua, D.; Baldauf, C.; Blackie, R.; Colfer, C.; Cunningham, A.B.; Dexter, K.; Djoudi, H.; Gautier, D.; Gumbo, D.; et al. Global dry forests: A prologue. Int. For. Rev. 2015, 17, 1–9. [Google Scholar] [CrossRef]
  35. Tefera, A.S.; Ayoade, J.O.; Bello, N.J. Analyses of the relationship between drought occurrences and their causal factors in Tigray Region, Northern Ethiopia. Tellus A Dyn. Meteorol. Oceanogr. 2020, 72, 1–18. [Google Scholar] [CrossRef] [Green Version]
  36. Van der Veen, A.; Gebrehiwot, T. Effect of policy interventions on food security in Tigray, Northern Ethiopia. Ecol. Soc. 2011, 16. [Google Scholar] [CrossRef] [Green Version]
  37. Gebrehiwot, K. Ecology and Management of Boswellia papyrifera (Del.) Hochst. Dry Forests in Tigray, Northern Ethiopia; Cuvillier Verlag: Göttingen, Germany, 2003; Available online: https://cuvillier.de/de/shop/publications/3129 (accessed on 21 October 2022).
  38. Friis, I.; Demissew, S.; Breugel, P.V. Atlas of the Potential Vegetation of Ethiopia; Biologiske Skrifter 58; The Royal Danish Academy of Sciences and Letters: Copenhagen, Denmark, 2010. [Google Scholar]
  39. Hosmer, D.W., Jr.; Lemeshow, S.; Sturdivant, R.X. Applied Logistic Regression; John Wiley & Sons: Hoboken, NJ, USA, 2013; Volume 398. [Google Scholar]
  40. Deaton, A. The Analysis of Household Surveys: A Microeconomic Approach to Development Policy; Johns Hopkins University Press: Baltimore, MD, USA; London, UK, 1997. [Google Scholar]
  41. Garekae, H.; Thakadu, O.T.; Lepetu, J. Socio-Economic Factors Influencing Household Forest Dependency in Chobe Enclave, Botswana. Ecol. Process. 2017, 6, 40. [Google Scholar] [CrossRef] [Green Version]
  42. Campbell, J. Land or Peasants? The Dilemma Confronting Ethiopian Resource Conservation. Afr. Aff. 1991, 90, 5–21. [Google Scholar] [CrossRef]
  43. Gunatilake, H.M. The Role of Rural Development in Protecting Tropical Rainforests: Evidence from Sri Lanka. J. Environ. Manag. 1998, 53, 273–292. [Google Scholar] [CrossRef]
  44. Jain, P.; Sajjad, H. Household Dependency on Forest Resources in the Sariska Tiger Reserve (STR), India: Implications for Management. J. Sustain. For. 2016, 35, 60–74. [Google Scholar] [CrossRef]
  45. Ali, N.; Hu, X.; Hussain, J. The Dependency of Rural Livelihood on Forest Resources in Northern Pakistan’s Chaprote Valley. Glob. Ecol. Conserv. 2020, 22, e01001. [Google Scholar] [CrossRef]
  46. Lee, M.T.; Markowitz, E.; Howe, D.P.; Ko, Y.C.; Leiserowitz, A. Predictors of Public Climate Change Awareness and Risk Perception around the World. Nat. Clim. Chang. 2015, 5, 1014–1020. [Google Scholar] [CrossRef]
  47. Legesse, B.; Ayele, Y.; Bewket, W. Smallholder farmers’ perceptions and adaptation to climate variability and climate change in Doba district, West Hararghe, Ethiopia. Asian J. Empir. Res. 2013, 3, 251–265. [Google Scholar]
  48. Amsalu, A.; Alebachew, A. Assessment of Climate Change-Induced Hazards, Impacts and Responses in the Southern Lowlands of Ethiopia; Cordaid: The Hague, The Netherlands; Forum for Social Studies: Addis Ababa, Ethiopia, 2009. [Google Scholar]
  49. Yesuf, M.; Falco, D.S.; Deressa, T.; Ringler, C.; Kohlin, G. The Impact of Climate Change and Adaptation on Food Production in Low-Income Countries: Evidence from the Nile Basin, Ethiopia; Discussion Paper; IFPRI: Washington, DC, USA, 2008. [Google Scholar]
  50. Deressa, T.; Hassan, M.R.; Ringler, C.; Alemu, T.; Yusuf, M. Determinants of Farmers’ Choice of Adaptation Methods to Climate Change in the Nile Basin of Ethiopia. Glob. Environ. Chang. 2009, 19, 248–255. [Google Scholar] [CrossRef] [Green Version]
  51. Bewket, W.; Alemu, D. Farmers’ perceptions of climate change and its agricultural impacts in the Abay and Baro-Akobo river basins, Ethiopia. Ethiop. J. Dev. Res. 2011, 33, 1–28. [Google Scholar] [CrossRef]
  52. Temesgen, T.; Claudia, R.; Rashid, M. Factors affecting the choices of coping strategies for climate extremes. In The Case of Farmers in the Nile Basin of Ethiopia; Discussion Paper; IFPRI: Washington, DC, USA, 2010. [Google Scholar]
  53. Andrew, M.; Robert, O.; Jeannette, V.; Juliet, K.; Denis, O.; Annita, T. Kenya Adaptation to Climate Change in the Arid Lands: Anticipating, Adapting to and Coping with Climate Risks in Kenya—Operational Recommendations for KACCAL; ILRI Research Report 18; International Livestock Research Institute: Nairobi, Kenya, 2007. [Google Scholar]
  54. Advancing Capacity to Support Climate Change Adaptations (ACCCA). Farm-level climate change perception and adaptation in drought prone areas of Tigray, Northern Ethiopia. In Improving Decision-Making Capacity of Smallholder Farmers in Response to Climate Risk Adaptation in three Drought Prone Districts on Northern Ethiopia; IDRC Project No 093; United Nations Institute for Training and Research (UNITAR): Geneva, Switzerland, 2010. [Google Scholar]
  55. Bryan, E.; Ringler, C.; Okoba, B.; Roncoli, C.; Silvestri, S.; Herrero, M. Adapting Agriculture to Climate Change in Kenya: Household and Community Strategies and Determinants. J. Environ. Manag. 2013, 114, 26–35. [Google Scholar] [CrossRef]
  56. Juana, J.S.; Kahaka, P.; Okurut, F.N. Farmers’ perceptions and adaptations to climate change in sub-Sahara Africa: A synthesis of empirical studies and implications for public policy in African agriculture. J. Agric. Sci. 2013, 5, 121. [Google Scholar] [CrossRef] [Green Version]
  57. Tadross, M.A.; Hewitson, B.C. The interannual variability of the onset of the maize growing season over South Africa and Zimbabwe. J. Clim. 2005, 18, 3356–3372. [Google Scholar] [CrossRef]
  58. Sietz, D.; Lüdeke, M.K.B.; Walther, C. Categorization of typical vulnerability patterns in global drylands. Glob. Environ. Chang. 2011, 21, 431–440. [Google Scholar] [CrossRef]
  59. Ministry of Finance and Economic Development (MoFED). Ethiopia’s Progress towards Eradicating Poverty: An Interim Report on Poverty Analysis Study; Ministry of Finance and Economic Development (MoFED): Addis Ababa, Ethiopia, 2012.
  60. Girmay, Z. Socio-Economic Assessment of Tigray IAIP and RTC. 2017. Available online: https://www.afdb.org/sites/default/files/48920_tigray_appendix_c10_socio-economic.pdf (accessed on 12 November 2022).
Figure 1. Location of the study area in the different agro-semiecologies of Tigray Region, Ethiopia.
Forests 13 02026 g001
Figure 2. Household perceptions of climate change in Tigray Region, Ethiopia.
Forests 13 02026 g002
Figure 3. Livestock loss due to drought-related risks in the 2010s. (The tropical livestock unit (TLU) is commonly taken to be an animal of 250 kg live weight.)
Forests 13 02026 g003
Figure 4. Food insecurity months of the three districts studied in Tigray Region.
Forests 13 02026 g004
Figure 5. Proportion of households collecting forest products from dry forests in the three districts.
Forests 13 02026 g005
Figure 6. Schematic presentation of the Lorenz curve showing income equalizing effect of dry forests in AW (a) KH (b) and RA Districts (c).
Forests 13 02026 g006
Table 1. Explanatory variables included in the logistic regression model.
VariableDescriptionMeasurement
AgeAge of the respondents Years
Gender (dummy)Sex of the respondents 1 if male, otherwise 0
Family sizeFamily size of the respondents Number
WealthWealth status of the respondents 0 if poor, 1 if medium, 2 if rich
Landholding sizeLandholding size of the respondentsHa
Educational levelEducational status of the respondents 0 if no formal education, 1 if primary, otherwise 2
Marital status Marital status of the respondents 1 if marred, 0 if not
Distance from the forest Distance from the forest on foot In minutes
Dry forest income In Ethiopian Birr
Table 2. Household (HH) characteristics of the three districts of Tigray Region, Ethiopia.
VariableKHAWRAOverall
No. of respondents (by sex) 51 (M = 84%; F = 16%)58 (M = 72%; F = 28%)61 (M = 70%; F = 30%)170 (M = 75%; F = 25%)
Mean family size 6 ± 37 ± 49 ± 57 ± 4
Respondents’ mean age 47 ± 1550 ± 1247 ± 1248 ± 14
Mean landholding size (ha) 4.39 ± 3.480.36 ± 0.221.00 ± 0.531.69 ± 2.51
Education level (illiterate, 1st, and 2nd) 47%, 45%, and 8%59%, 38%, and 3%64%, 31%, and 5%57%, 28%, and 5%
Occupation (farmer, business, and others) 94%, 2%, and 4%96%, 2%, and 2%100%, 0, and 097%, 1%, and 2%
Wealth status (rich, medium, and poor) 4%, 62%, and 34%7%, 31%, and 62%5%, 67%, and 28%5%, 53%, and 42%
Distance to forest (pace) 97 ± 6377 ± 55103 ± 9792 ± 74
Table 3. Most-perceived climate change indicators by the communities in three districts of Tigray Region, Ethiopia.
Climate VariablesDistrictTotal
KHRAAW
Increasing temperature2210638
High rainfall3003
Low rainfall154852115
Irregular RF6006
Other (wind, heat wave, frost)4004
Total505858166
Table 4. Household coping strategy to manage climate change impacts.
No.Copping Strategies Sub-Strategies AppliedNo. of HHs in Each District (%)Total HHs (%)
KHAWRA
1Livestock-based 35.710.326.223.0
Herd splitting, diversifying, and destocking YesYesYes
Livestock intensification (fattening and selling) YesYesYes
2Crop-based 35.7024.618.6
Intensification of crop production (use of improved seeds and fertilizers)YesNoYes
3Forest-based 16.712.114.814.3
Increasing fuel woodYesYesYes
Increasing charcoal collectionYesNoYes
Extracting animal feed from the forestYesYesYes
Wild food (fruit, seeds, leaves, honey, bush meat)YesYesYes
Increasing collection and marketing of gum and resinsYesNoNo
4Externally driven 11.977.634.444.1
Participation in off-farm activities (labor, sales, and pity trade)YesYesYes
Looking for aid, remittance/giftsNoYesYes
Migration to other areasNoYesYes
Source: Field survey.
Table 5. Major adaptation strategies applied (%) to reduce impact of climate change in three districts of Tigray Regional State.
No.Adaptation Strategies Sub-StrategiesNo. of HHs in Each District (%)Total HHs (%)
KHAWRA
1Livestock-based 27.819.029.924.5
Purchase of feed for animals YesYesYes
Exchange of animals for cereals NoYesYes
Store hayYesYesYes
Change in grazing itineraries (travelling further in search of forage and water)YesYesYes
Rotational grazingNoYesYes
Livestock diversificationYesYesYes
2Crop-based 27.813.227.922.6
Improved crop variety YesYesYes
Change planting dateYesYesYes
Diversify the cropYesYesYes
Water diversionNoYesYes
IrrigationYesYesYes
3Forest-based 27.817.216.419.4
Increasing fuelwood collection for saleYesNoYes
Increasing charcoal collection for saleYesNoYes
Extracting animal feed from the forestNoNoNo
Wild food (fruit, seeds, leaves, honey, bush meat)YesYesYes
Increasing collection and marketing of gum and resinsYesNoNo
Exclosure and reforestation with soil and water conservationYesYesYes
4Externally driven 16.750.027.933.5
Joining co-operative and credit unionsYesYesYes
MigrationNoYesNo
Food aid, credit, and inputs from the governmentNoYesYes
Food for work or cash for work program from community organizations, NGOs, or PSNPNoYesYes
Food aid, credit, and inputs from churches or religious organizationsNoYesYes
Food sharing, gifts, and credits from relatives or friendsNoYesYes
Reduction in household food consumption YesYesYes
Credit from banks or microfinance institutionsYesYesYes
Dropping out of children from schoolNoYesNo
Seeking employmentYesYesYes
Giving daughter for marriageNoYesNo
Making more savings YesYesYes
Source: Field survey.
Table 6. Measures of forest income among 170 households of the three districts of Tigray Region, Ethiopia.
VariableDescriptionKHAWRAOverall
Cash forest incomeTotal annual household income from the sale of forest products (in ETB)97.9420.68105.1074.15
Subsistence forest income Total imputed annual value of forest products used by the households (in ETB)1067.543953.841201.802100.45
Total forest incomeCombination of cash and subsistence income (in ETB)1165.493974.531306.902174.61
Share of forest incomeTotal forest income divided by total income (share)22.1524.404.9316.75%
Dry forest incomeBinary indicator of forest income: 0 if forest income = 0; 1 if forest income > 00.670.930.980.81
ETB: Ethiopian Birr.
Table 7. Household-level socioeconomic variables influencing level of dry forest income.
Explanatory Variables Kafta Humera, R2 = 0.59Raya Azebo, R2 = 0.19Atsbi Womberta, R2 = 0.30
Coef.t-Valuep-Value Coef.t-Valuep-Value Coef.t-Valuep-Value
(Constant)N/A2.8590.008N/A0.9730.336 −0.8130.422
Sex−0.5182.8590.008 **N/AN/AN/AN/AN/AN/A
Occupation0.053−3.5520.001 **N/AN/AN/A0.2851.8100.079
Age−0.0630.3490.7300.3232.3490.023 *−0.141−0.7230.475
Educational level−0.045−0.4020.690N/AN/AN/AN/AN/AN/A
Marital status −0.135−0.2570.799N/AN/AN/AN/AN/AN/A
Landholding size 0.322−1.0230.315N/AN/A0.0990.4670.6470.643
Wealth status−0.2942.5290.017 *−0.180−1.2350.223−0.153−0.9530.347
Distance from the forest −0.165−2.0560.049 *−0.136−0.9870.2390.2251.5200.138
Family size −0.096−1.1620.255−0.194−1.3240.1920.3642.4530.019 *
* significant; ** highly significant at 5% level; N/A Not Applicable.
Publisher’s Note: MDPI stays neutral with regard to jurisdictional claims in published maps and institutional affiliations.

