Article

Long-Term Effects of Altered Precipitation Patterns on Alpine Vegetation Species Composition on the Qinghai-Tibet Plateau

1
Department of Earth and Environmental Sciences, Xi’an Jiaotong University, Xi’an 710049, China
2
College of Urban and Environmental Sciences, Northwest University, Xi’an 710127, China
3
Department of Geography, University of California, Los Angeles, CA 90095, USA
*
Author to whom correspondence should be addressed.
Forests 2023, 14(1), 47; https://doi.org/10.3390/f14010047
Submission received: 2 November 2022 / Revised: 6 December 2022 / Accepted: 22 December 2022 / Published: 26 December 2022

Abstract

:
Changes in global precipitation patterns have had important impacts on terrestrial ecosystems. However, the relationship between alpine vegetation species composition and precipitation patterns remained uncertain. Based on in situ observations, long-term datasets of monthly aboveground biomass (AGB) and daily precipitation were applied in an alpine grassland on the Qinghai–Tibet Plateau (QTP), in order to characterize the responses of multi-species biomass to changing rainfall patterns. In this study, vegetation species composition exhibited obvious variations during 1997–2011 in alpine grasslands on the Qinghai–Tibet Plateau. Rapid increases in weed, Kobresia humilis, and Poa crymophila Keng squeezed the living space of the dominant species, Stipa sareptana var. krylovii. Meanwhile, effective precipitation had stronger effects on vegetation biomass, which were heterogeneous in different precipitation periods. Therefore, the crucial effective precipitation, accounting the effective precipitation in crucial periods, could better explain vegetation biomass variations, which could be a new representative climatic indicator to accurately describe vegetation change in alpine grasslands. In addition, crucial periods of effective precipitation appeared to influence heterogeneity for different vegetation species, which showed the heterogeneous adaptability of species to the changes in precipitation patterns. Precipitation patterns during 1997–2011 were more conducive to the growth of Poa crymophila Keng and Kobresia humilis, thereby changing the species composition in alpine grasslands. The coupling of biological environmental adaptability and abiotic crucial effective precipitation determined the variations of vegetation species composition. The new indicator of crucial effective precipitation could provide a new perspective for studying and predicting the species dynamics of alpine grassland.

1. Introduction

Vegetation forms a main component of the terrestrial biosphere and shows obvious response to climate change [1,2,3,4,5]. Grassland is one of the most important and largest terrestrial ecosystems, covering 30% of the land surface in the world [6,7]. Aboveground biomass (AGB), a key element of grassland ecosystems [8,9,10], is highly temporally variable compared to forest and cropland ecosystems [11,12,13]. Variations in grassland biomass have impacted the carbon balance, ecosystem service, profitability of pastoral livelihoods, and the sustainability of grassland resources as a whole [14,15,16,17]. Thus, vegetation variations of grassland and their responses to climate change have received wide attention in global ecological research programs.
Global climate change has greatly affected grasslands in alpine ecosystems, which are considered more sensitive to climate change than other regions [18,19]. In particular, as the third pole of the world, the Qinghai–Tibet Plateau (QTP) is one of typical alpine regions where vegetation is highly sensitive to climate variations [20,21,22,23]. Numerous previous research concluded that temperature was more important as a driving factor in vegetation growth on the QTP [22,24,25,26,27,28]. However, since the 21st century, global warming slowdown and frequent precipitation extremes caused by atmospheric circulation made the impacts of precipitation on vegetation more concerned [29,30,31]. According to recent studies, changing precipitation patterns showed more significant effects on vegetation than annual and seasonal precipitation [32,33,34,35,36,37]. Nevertheless, very few researchers gave attention to effects of precipitation patterns on alpine vegetation, in contrast to previous numerous reports in the alpine grasslands on the QTP. Therefore, further study is necessary to explore the responses of vegetation biomass to precipitation patterns in alpine ecosystems.
Global circulation models have predicted a shift in precipitation patterns to growing season rainfall events that were larger in size but fewer in frequency [38,39]. Precipitation patterns have complex impacts on vegetation, which have received wide attention in explaining vegetation dynamics, especially in arid and semi-arid regions. In this research, precipitation intensity has been a key element in driving vegetation change [40,41]. Many studies concluded that large precipitation events increased soil water content (SWC), which promoted plant photosynthesis and enhanced vegetation productivity, while light precipitation was more likely to evaporate from surface before soaking into the ground [32,33,34,42]. However, temporal distribution of precipitation in a year might show more important effects on vegetation growth. In addition, accelerated climate variations have changed the adaptability and competitiveness of different species in the alpine ecosystem [43]. Yet the variations of grassland species composition still remained unclear with regard to their relationship with climate change. Lack of study in alpine ecosystems causes uncertainty in the effects of precipitation, which confirms the urgent demand to explore responses of grassland vegetation to precipitation in alpine regions.
The Qinghai–Tibet Plateau is one of the most important pastoral regions in China. Livestock grazing intensity depends on grassland vegetation variations in alpine regions. Grassland biomass dynamics are determined by climate variations. In the present research, long term observations of multi-species aboveground biomass (AGB) were applied to measure the trends of vegetation variations and species composition dynamics from 1997 to 2011 in the alpine grassland. Then, based on daily precipitation, we analyzed the relationships between grassland AGB and precipitation in different periods to ascertain the impacts of changing precipitation patterns on alpine vegetation species composition. This study aims to reveal the characteristics of multi-species biomass variations in response to multi-period precipitation, explore impacts of precipitation patterns on species composition and ecosystem function, and provide scientific support for future grassland and grazing management in alpine areas.

2. Materials and Methods

2.1. Site Description

This research is conducted based on observed vegetation and climate datasets at the Haibei Station (red triangle in Figure 1, covering an area of about 27 hectares, 36.98° N, 100.98° E, and 3160 m), located on a typical alpine grassland of the QTP (Figure 1). The station was founded in 1976 and joined the Chinese Ecosystem Research Network (CERN) in 1989, which had been one of the most important ecological research platforms for alpine ecosystems in the QTP. Long term continuous observation has enabled the station to accumulate the most comprehensive monitoring data in the QTP. Haibei Station represents the special ecological environment of the QTP, which is cold, anoxic, and strongly ultraviolet. At the same time, the sample plot of the station includes the main plant types of the QTP, which can represent the species composition characteristics of the alpine grassland of the QTP. With a typical plateau continental monsoon climate, the region is characterized by severe and long winters, and short and cool summers with long insolation duration and large temperature differences between day and night [44]. The mean annual temperature during 1997~2011 is around 1.4 °C, with monthly average temperature extremes of −12.3 °C in January and 13 °C in July. Annual precipitation averages 403.3 mm over the 15 studied years, concentrated in the plant growing season from May to September. Annual evaporation is 1400 mm and the frost-free season is 48 days on average. The soil is classified as sandy loam. The plant species mainly include Stipa sareptana var. krylovii (Roshev.) P.C. Kuo & Y.H. Sun, Koeleria cristata (Linn.) Pers, Kobresia humilis (C. A. Mey ex Trauvt.) Sergievskaya, Poa crymophila Keng, and Artemisia scoparia Waldst. et Kit.

2.2. Data Collection

In situ aboveground biomass and daily precipitation observed at the Haibei station were used in this research. Six 60 m × 30 m blocks were selected to observe the aboveground biomass. Six 0.5 m × 0.5 m quadrats in each blocks were randomly selected for clipping plants, classification by species, washing, and oven drying at 65 °C for 72 h, and then weighting dry plant material. The aboveground biomass of different species was investigated every month during the growing season (May–September). The grassland biomes consisted of five types of forage grasses (Stipa sareptana var. krylovii, Koeleria cristata, Kobresia humilis, Poa crymophila Keng, and Artemisia scoparia) and weeds. We selected the aboveground biomass in the vigorous growth period (From June to August) to analyze vegetation variations and their responses to precipitation patterns during 1997~2011 on the QTP. In order to study the impacts of precipitation patterns on vegetation, daily precipitation events measured by rain gauge were divided into effective precipitation events (more than 5 mm) and ineffective precipitation events (less than 5 mm), based on previous research [45]. In order to fully understand the time lag effect and cumulative effect of precipitation on vegetation, multi-period precipitations were calculated to explore the effects on vegetation in different time scales, including current month, previous month, the month before last, previous September, last 2 months, last 3 months, and previous September to current month. Furthermore, daily effective precipitation events were used to recognize response patterns between precipitation and vegetation biomass in daily scales.

2.3. Statistical Analysis

In this study, regular approaches, such as least squares regression, Pearson correlation, and independent-sample t-test, were used to analyze responses of AGB in the vigorous growth period (June, July, and August) to precipitation in different periods. Then we used Partial Least Squares (PLS) analysis to reveal the correlation between AGB and precipitation at daily scale.
Previous research has shown that PLS analysis can work effectively in relating vegetation to climate records at daily resolution [46,47,48]. With PLS regression, we focused on the responses of AGB to daily precipitation during all 365 days of the year, based on data during 1997~2011. The main outputs of PLS analysis were the variable importance in the projection (VIP), standardized model coefficients, and root mean squared errors (RMSE). The VIP value reflected the importance of the climate factors to interpret the vegetation growth, and the commonly held threshold was 0.8. The standardized model coefficient indicated the strength and direction of the impacts of daily precipitation on vegetation biomass. Centering and scaling of daily precipitation and AGB is necessary to allow comparisons between different variables. The root mean squared errors (RMSE) of the regression analyses are calculated to determine the accuracy of the PLS model.
In our research, AGB datasets were observed in June, July, and August during 1997~2011, while precipitation was daily precipitation for 365 days preceding the peak biomass (i.e., running from the 1st of the previous July, August and September to the end of June, July and August of each year, since the periods of aboveground biomass are June, July and August; in leap years, the last day of this interval has been excluded). In the PLS analysis, periods with VIP greater than 0.8 and high absolute values of model coefficients represented the relevant stages in precipitation significantly influencing grassland AGB. Positive model coefficients indicated that increasing precipitation benefited increases in AGB, while negative model coefficients implied negative impacts on AGB. All analyses were implemented in the R 3.2.0 programming language. PLS analysis was mainly based on the ‘pls’ package and used within procedures implemented in the ‘chillR’ package [49].

2.4. Random Forest

Random Forest can work well in nonlinear regression analysis by creating a collection of classification trees with binary divisions [50]. To further quantify contributions of precipitation in different periods on vegetation change, the random forest algorithm was used to rank the importance of the influencing factors and to quantify the contribution of each factor. The main evaluation metrics of variable importance in the RF model are IncMSE and IncNodePurity. In this paper, IncNodePurity was used as the evaluation index of variable importance. Random Forest analysis was implemented in the Python 3.8.1.

3. Results

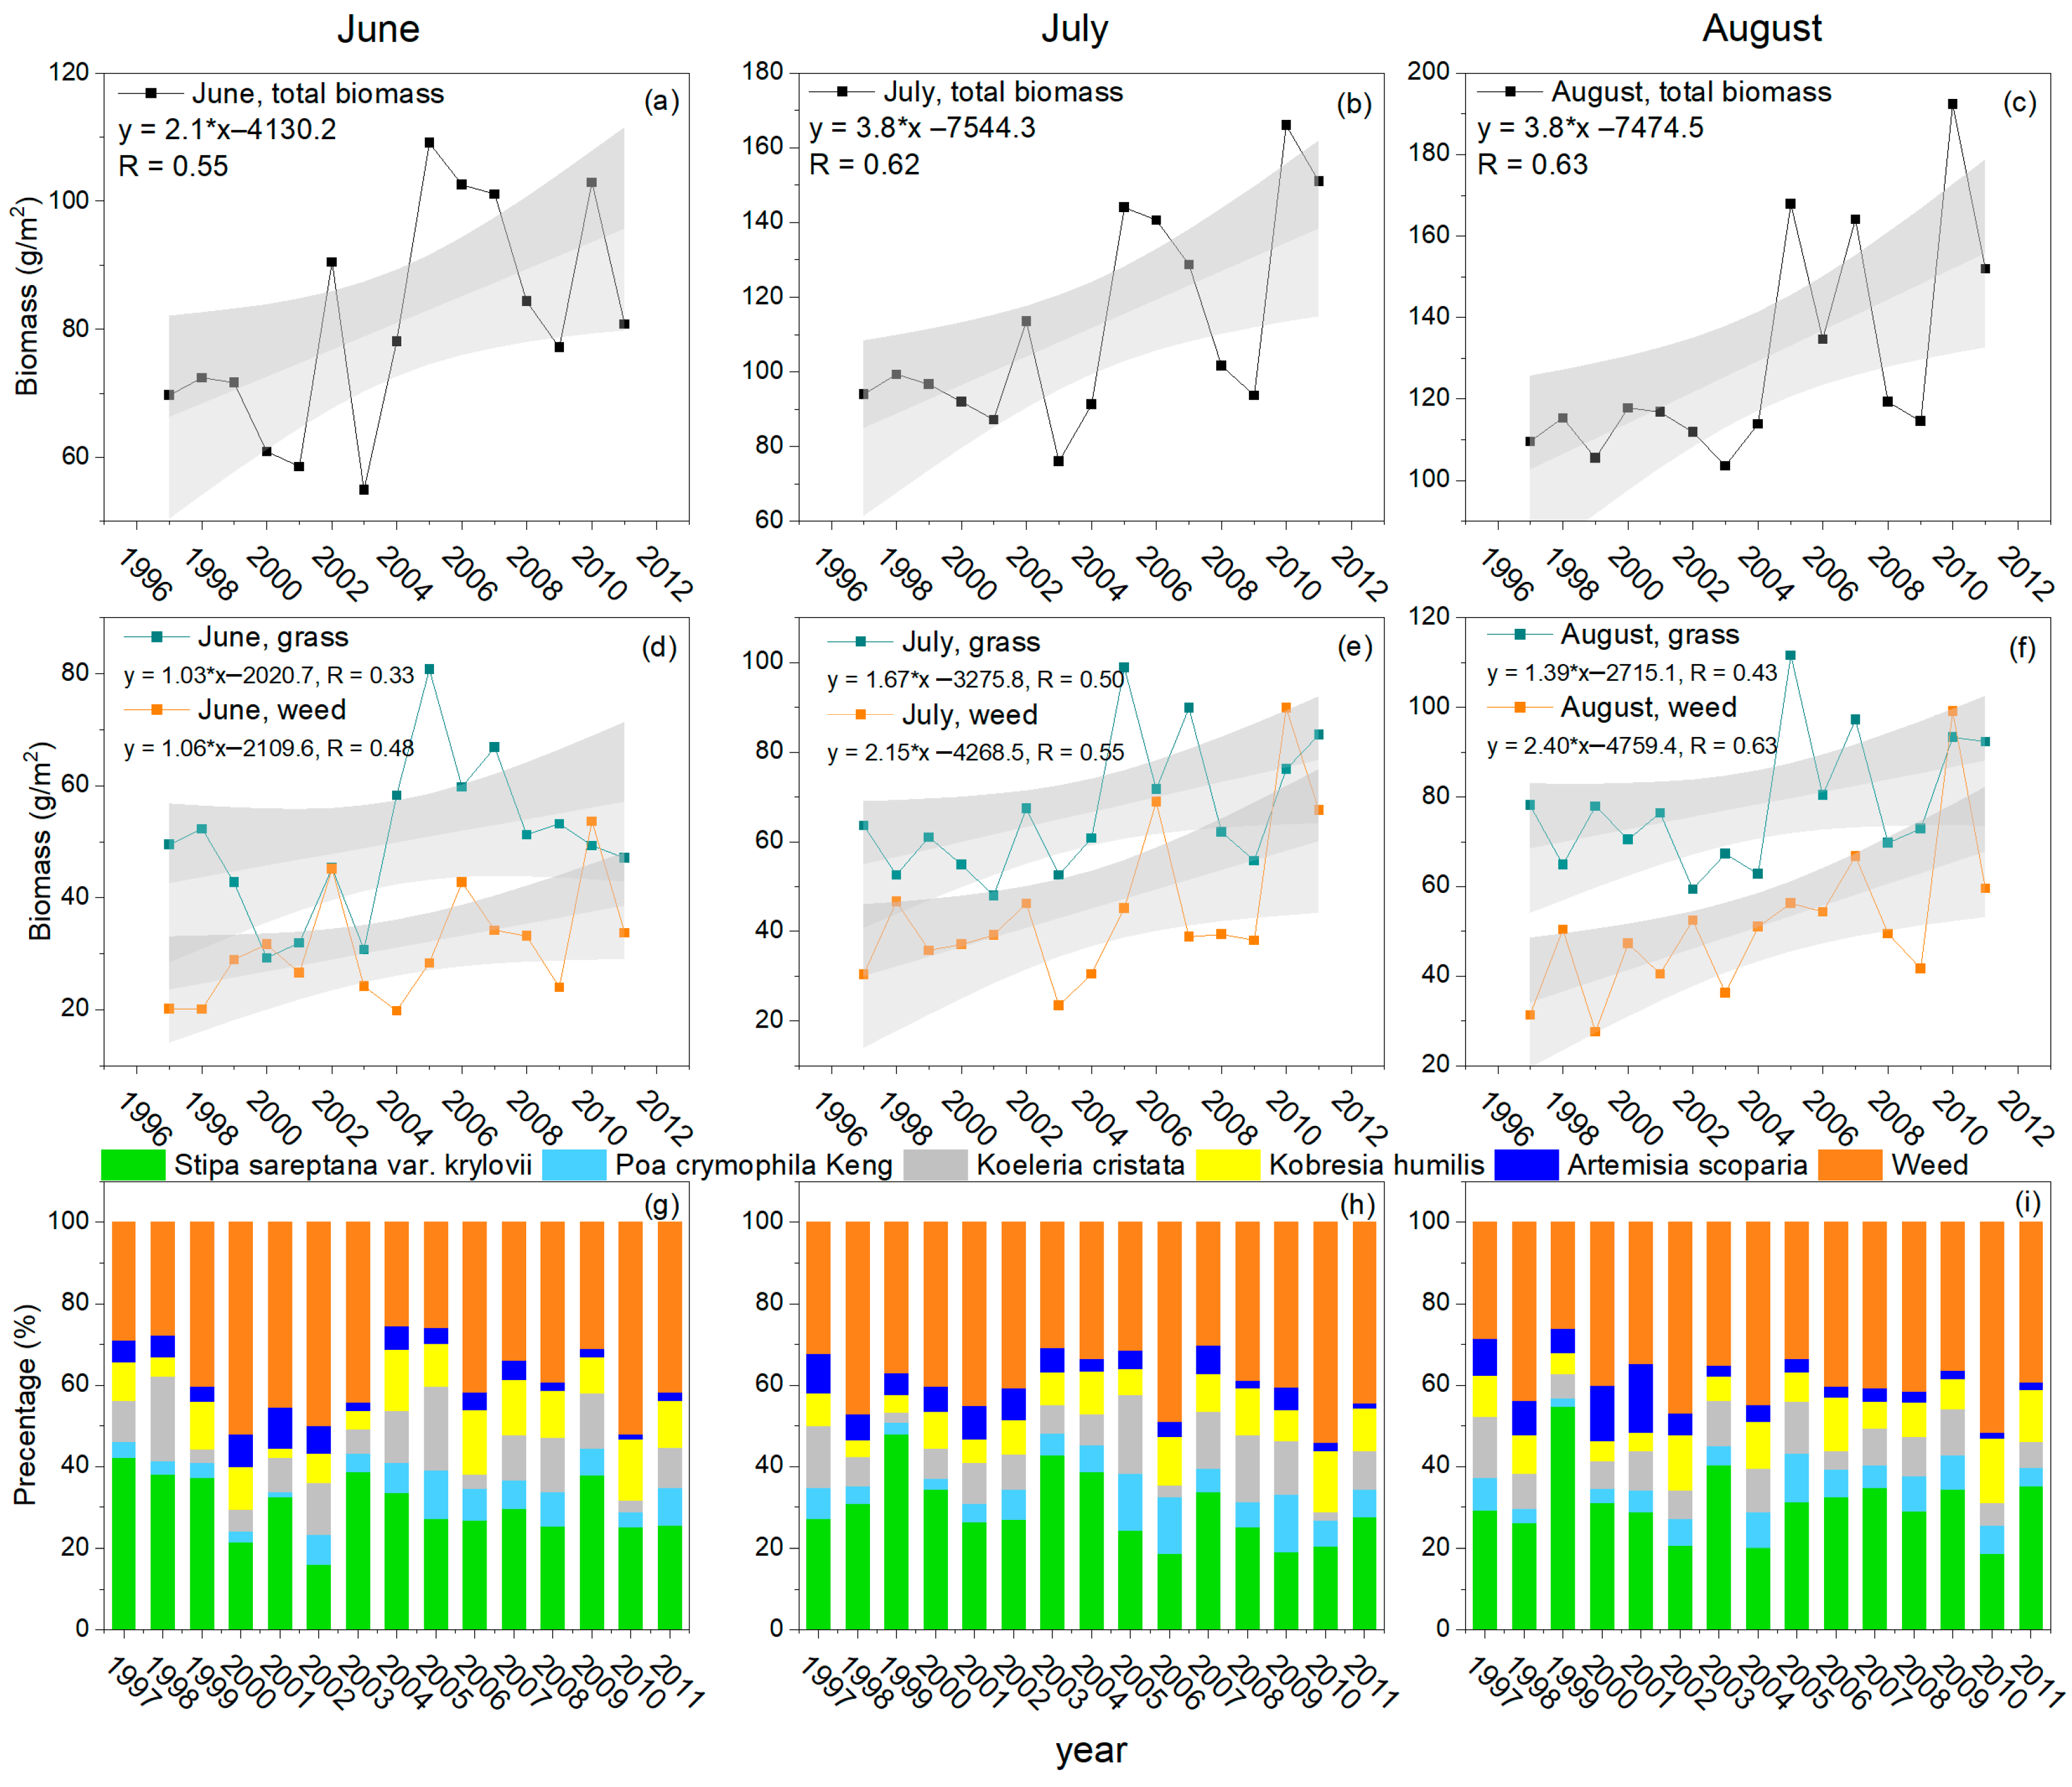
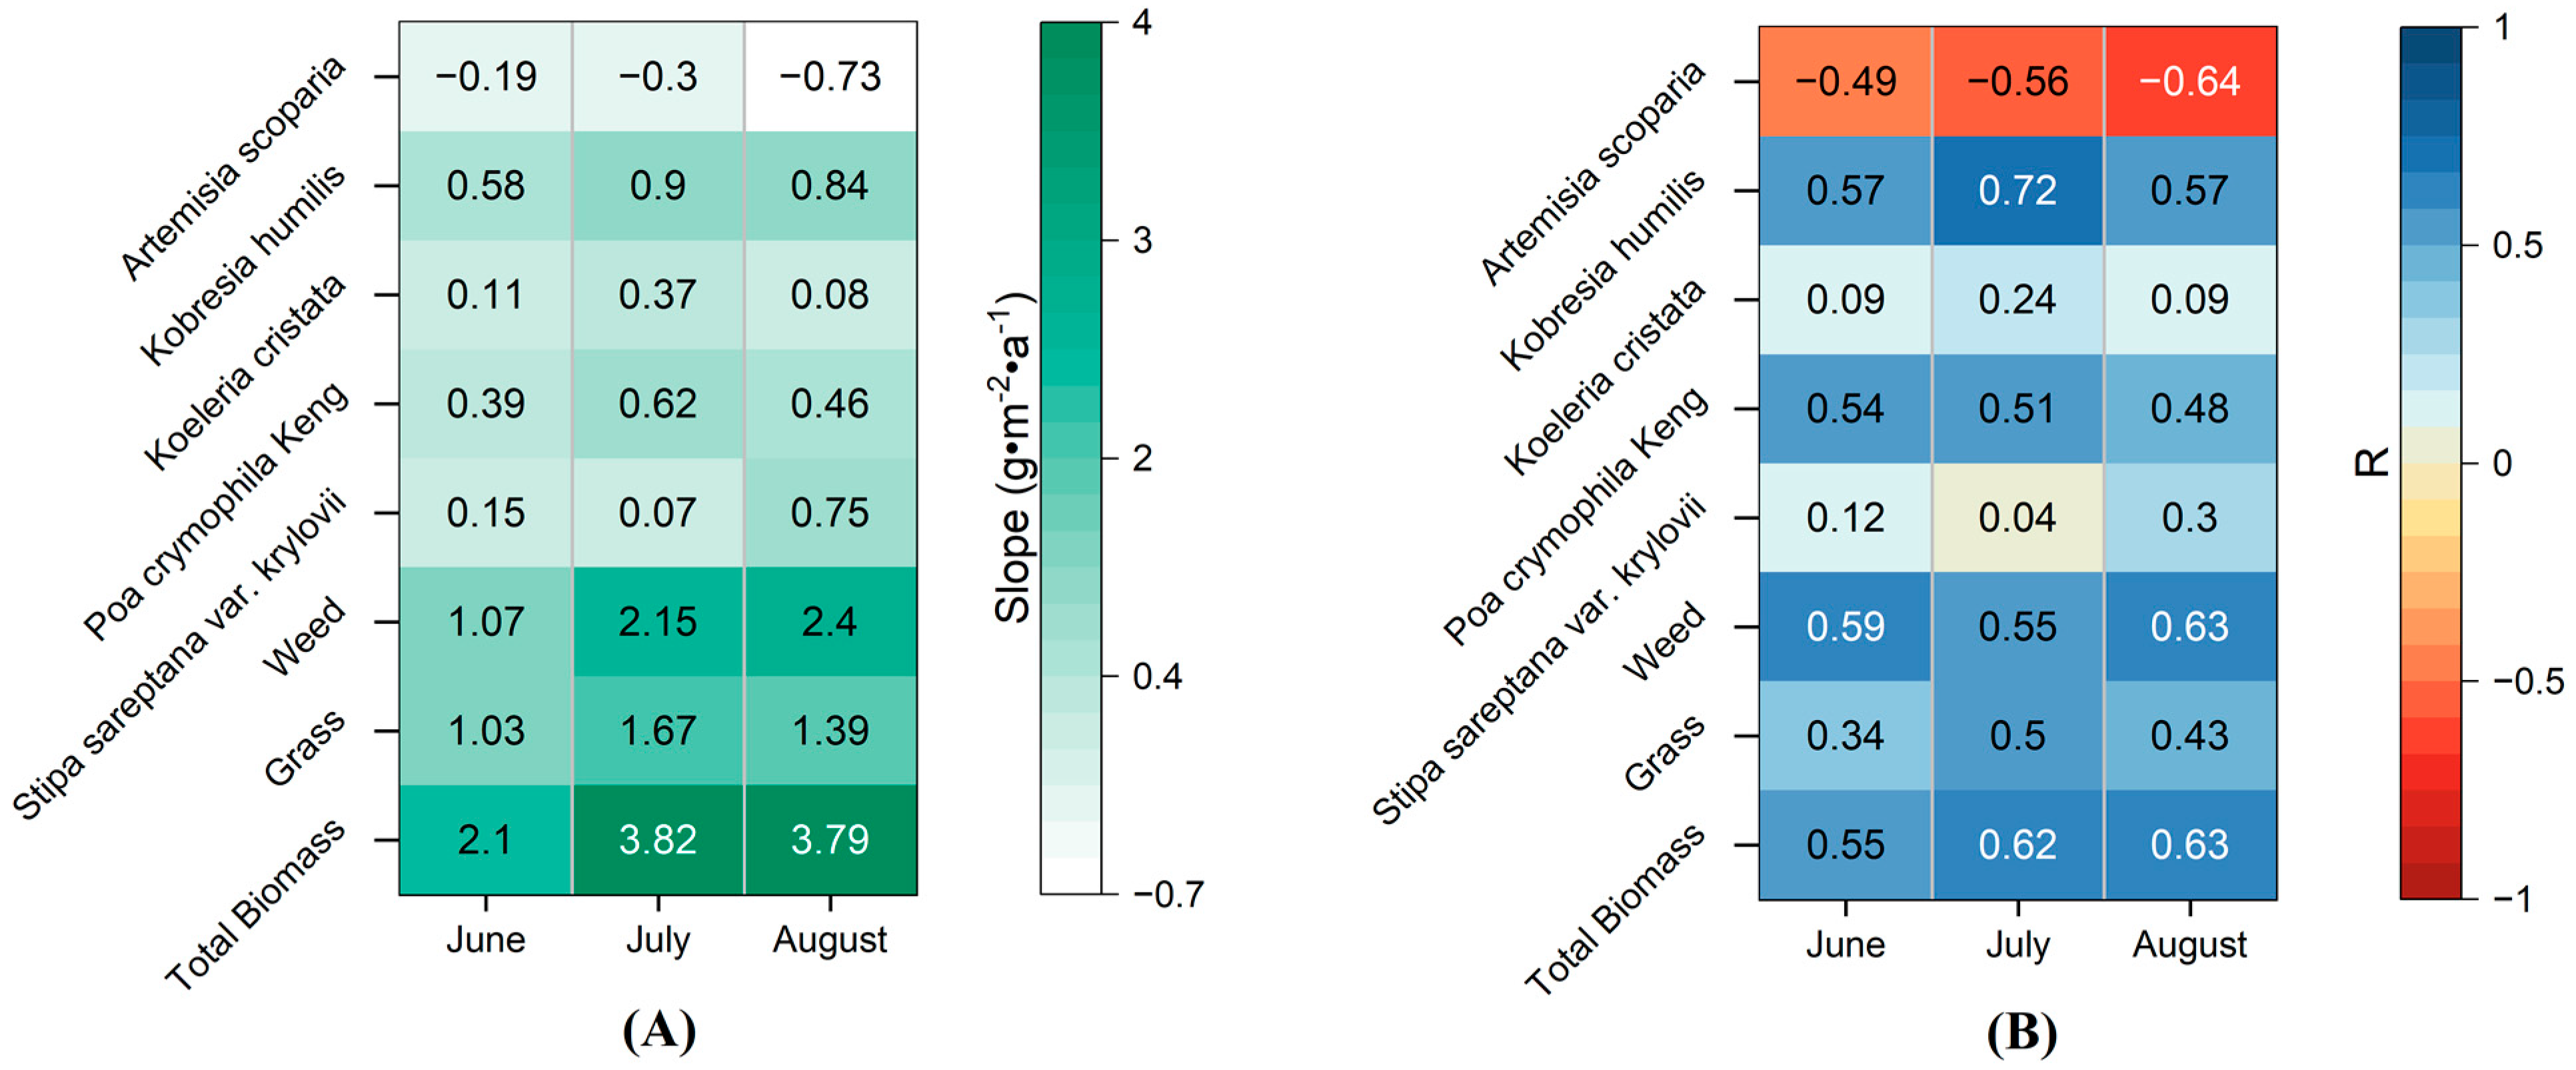
3.1. Variations in Aboveground Biomass of Different Species in Alpine Grassland

Based on observed AGB of different species, we analyzed trend variations of AGB during vigorous growth period (June, July, and August). In Figure 2, total aboveground biomass increased significantly in June (2.1 g·m−2·a−1, R = 0.55, p < 0.05), July (3.8 g·m−2·a−1, R = 0.62, p < 0.05), and August (3.8 g·m−2·a−1, R = 0.63, p < 0.05) during 1997–2011. Then, weed biomass showed more significant increases than grass biomass in Figure 2d-2f. Weed biomass significantly increased by 1.06 g·m−2·a−1 (R = 0.48, p < 0.1) in June, 2.15 g·m−2·a−1 (R = 0.55, p < 0.05) in July, and 2.40 g·m−2·a−1 (R = 0.63, p < 0.05) in August, while grass biomass showed a lower increased trend over three months. Furthermore, different species showed various trends. The percentages of Kobresia humilis and Poa crymophila Keng indicated an obvious increase, while Artemisia scoparia decreased, which were shown in the changes in vegetation species composition during 1997–2011. In general, aboveground biomass increased significantly in alpine grassland. Weed biomass indicated faster growth rates than grass. In addition, the vegetation species composition was changing during 1997–2011.
Furthermore, trends of AGB in different species were calculated to indicate the dynamic of vegetation species composition in Figure 3. Biomass of Kobresia humilis and Poa crymophila Keng indicated faster increase rates in three months. Kobresia humilis significantly increased by 0.58 g·m−2·a−1 (R = 0.57, p < 0.05) in June, 0.90 g·m−2·a−1 (R = 0.72, p < 0.01) in July, and 0.84 g·m−2·a−1 (R = 0.57, p < 0.05) in August. In addition, Poa crymophila Keng also showed significant increases with the rates of 0.39 g·m−2·a−1 (R = 0.54, p < 0.05) in June, 0.62 g·m−2·a−1 (R = 0.51, p < 0.05) in July, and 0.46 g·m−2·a−1 (R = 0.48, p < 0.1) in August. However, Stipa sareptana var. krylovii and Koeleria cristata with higher proportion (about 30% and 10%) showed weak increases in three months. Koeleria cristata weakly increased by 0.11 g·m−2·a−1 (R = 0.09) in June, 0.37 g·m−2·a−1 (R = 0.24) in July, and 0.08 g·m−2·a−1 (R = 0.09) in August. In addition, Stipa sareptana var. krylovii weakly increased by 0.15 g·m−2·a−1 (R = 0.12) in June, 0.07 g·m−2·a−1 (R = 0.04) in July, and 0.75 g·m−2·a−1 (R = 0.30) in August. In addition, Artemisia scoparia decreased significantly during the vigorous growth period. Above all, alpine vegetation species composition was obviously changing with rapid increases in Kobresia humilis and Poa crymophila Keng and decreases in Artemisia scoparia.

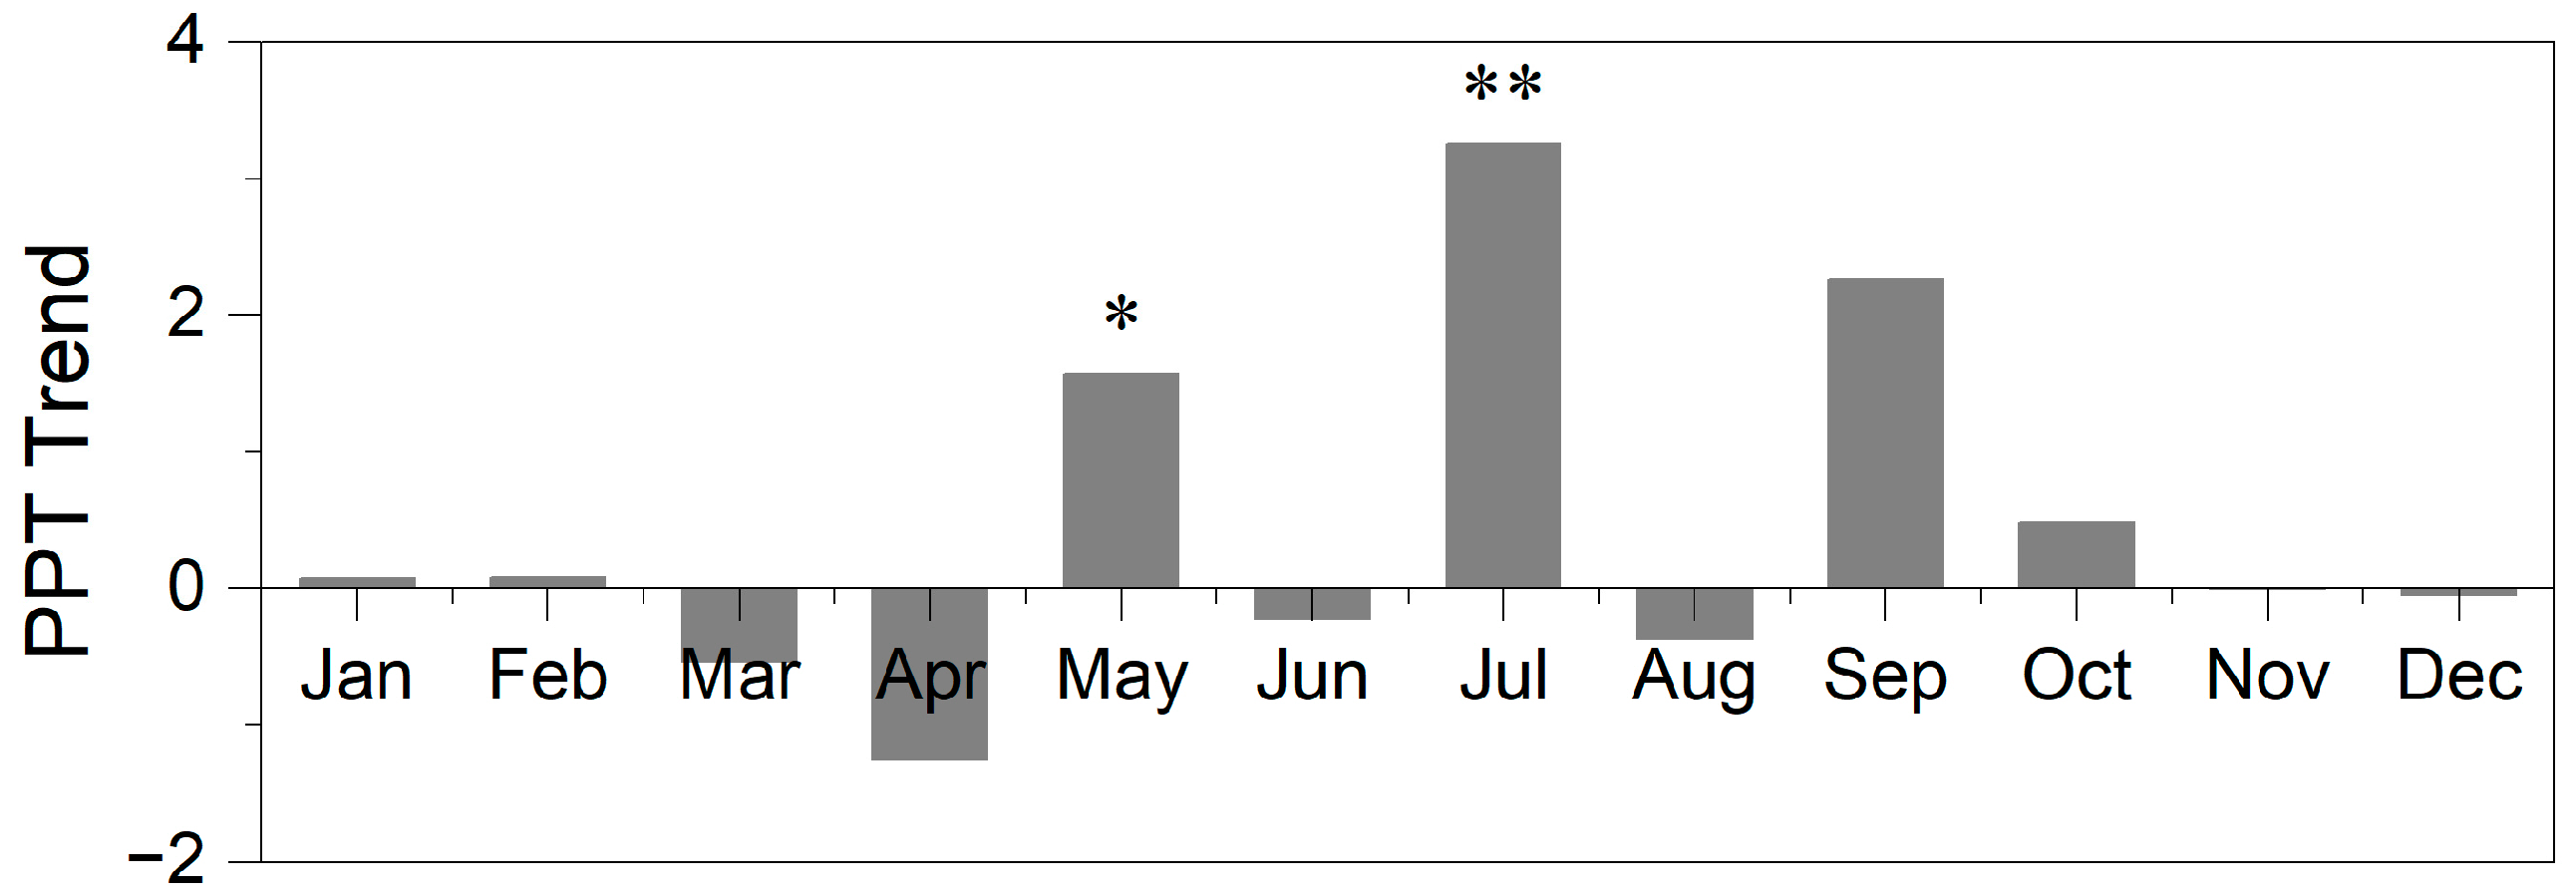
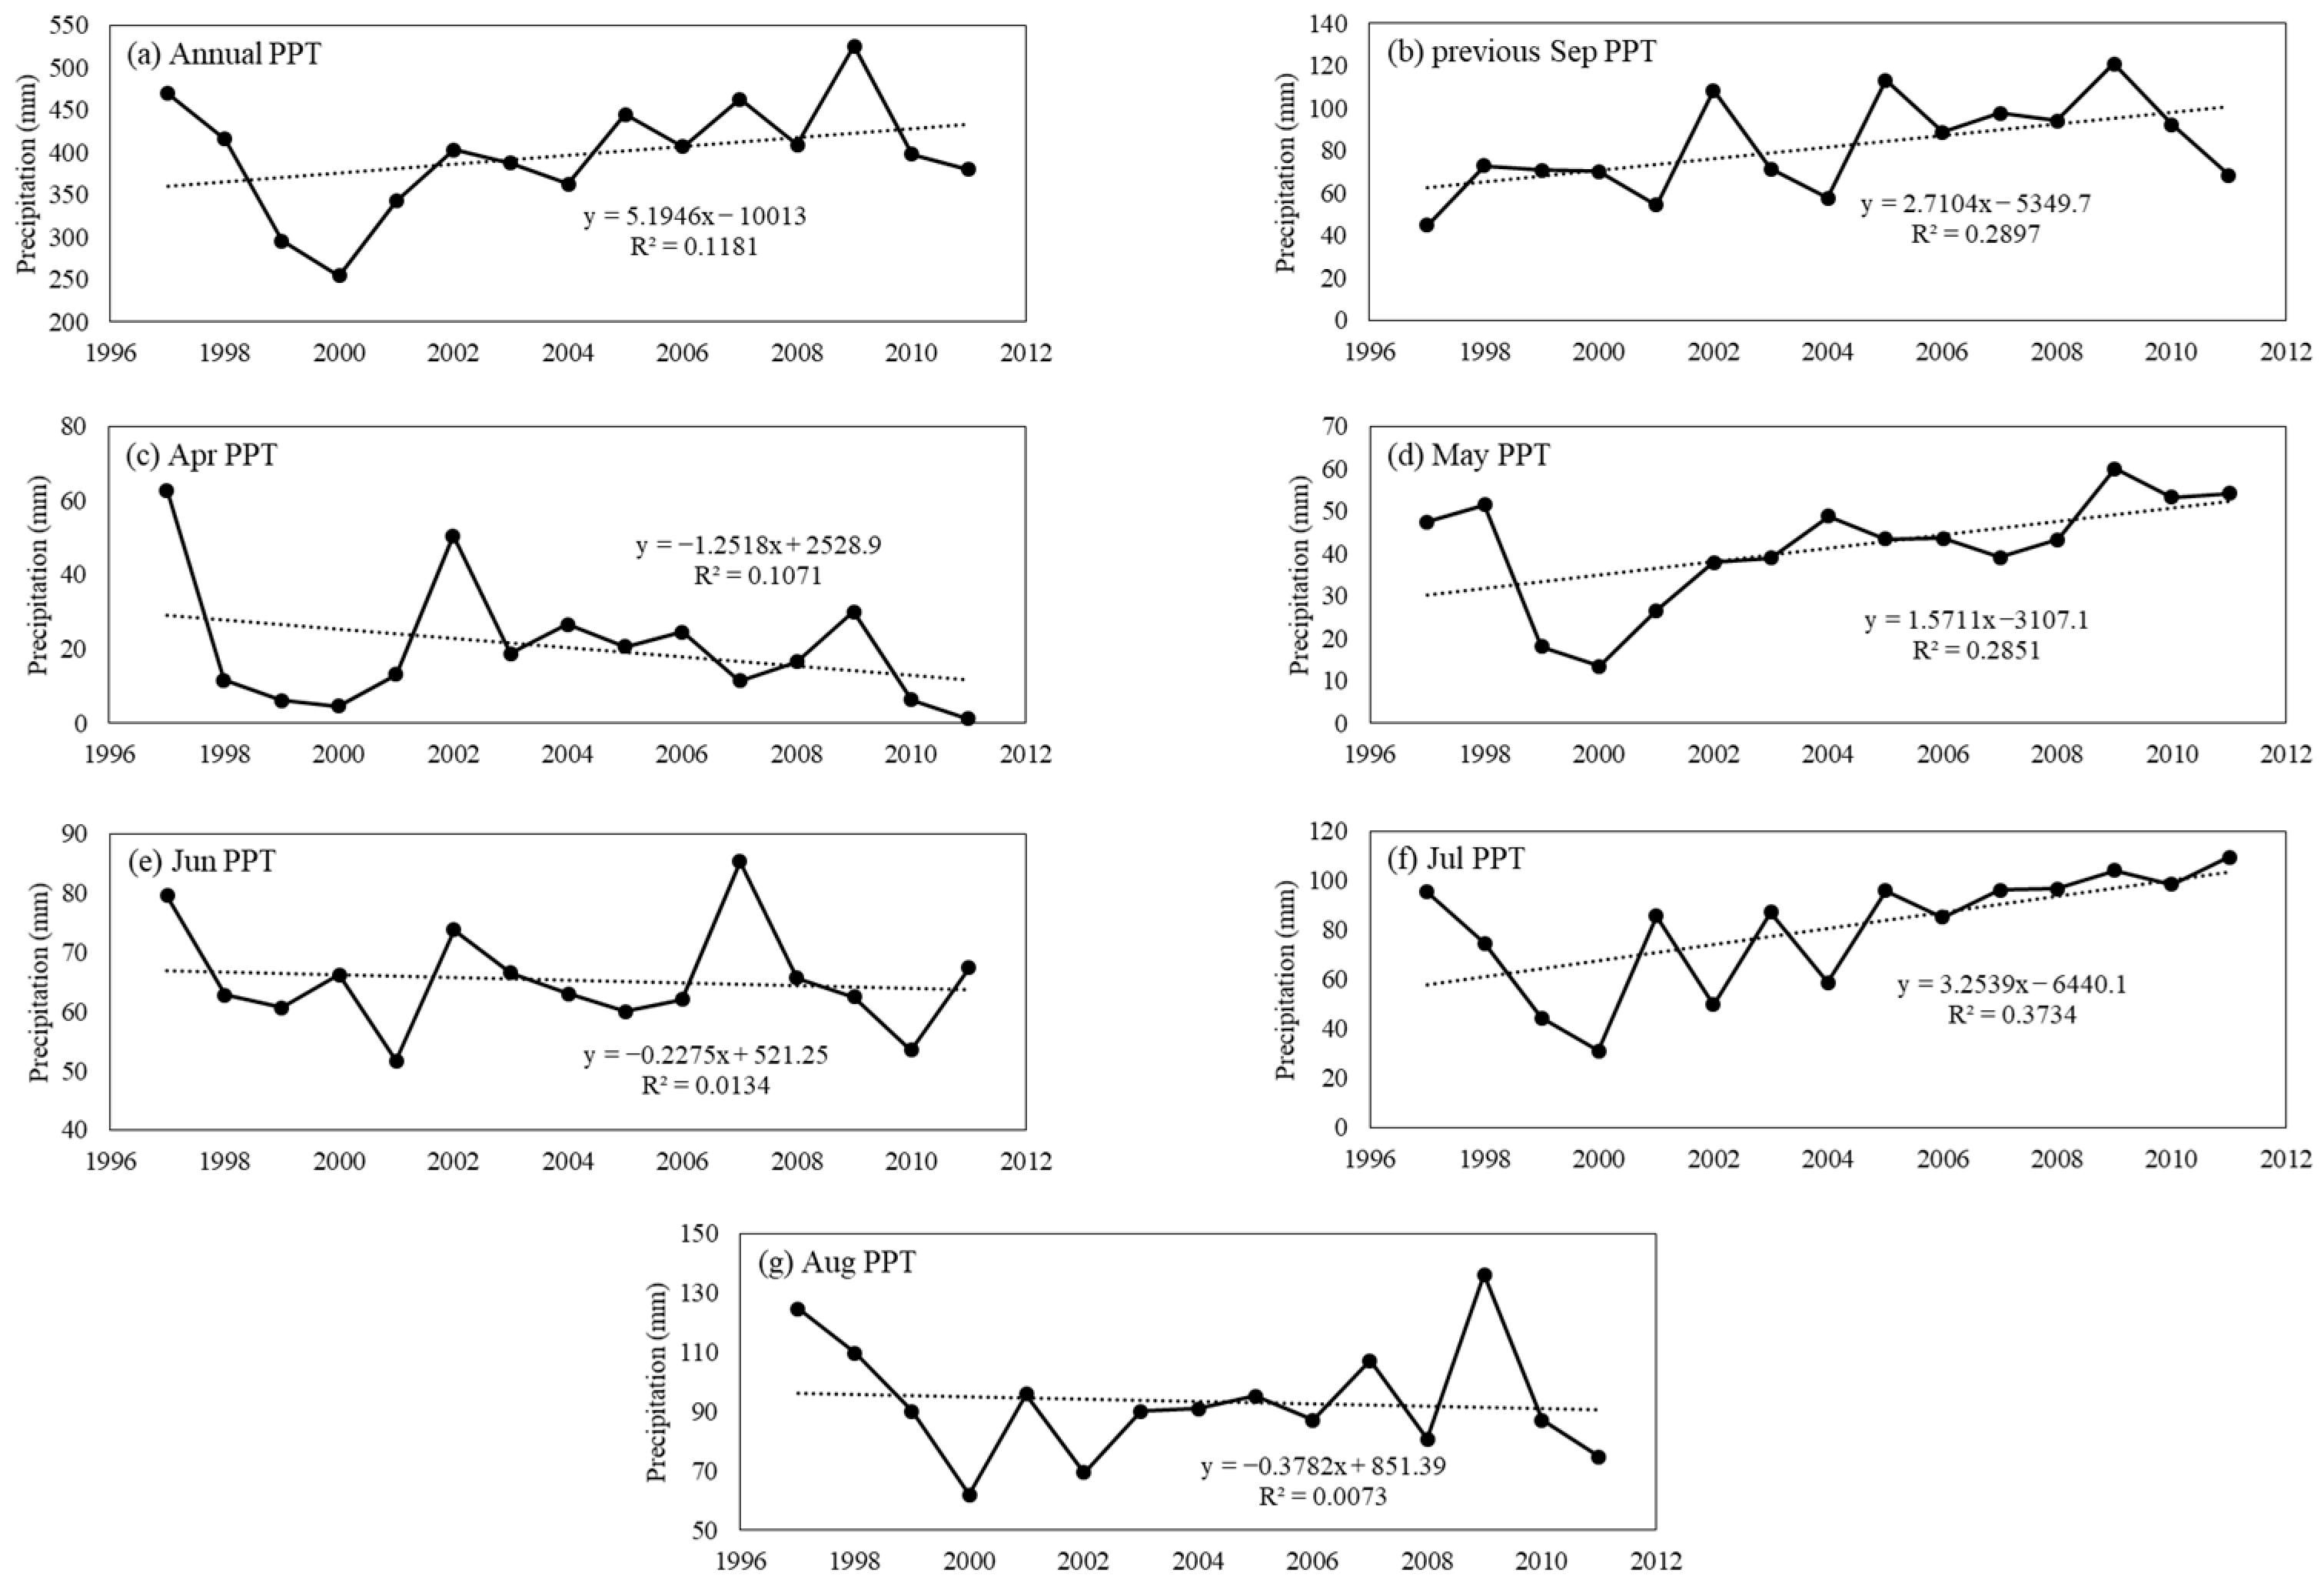
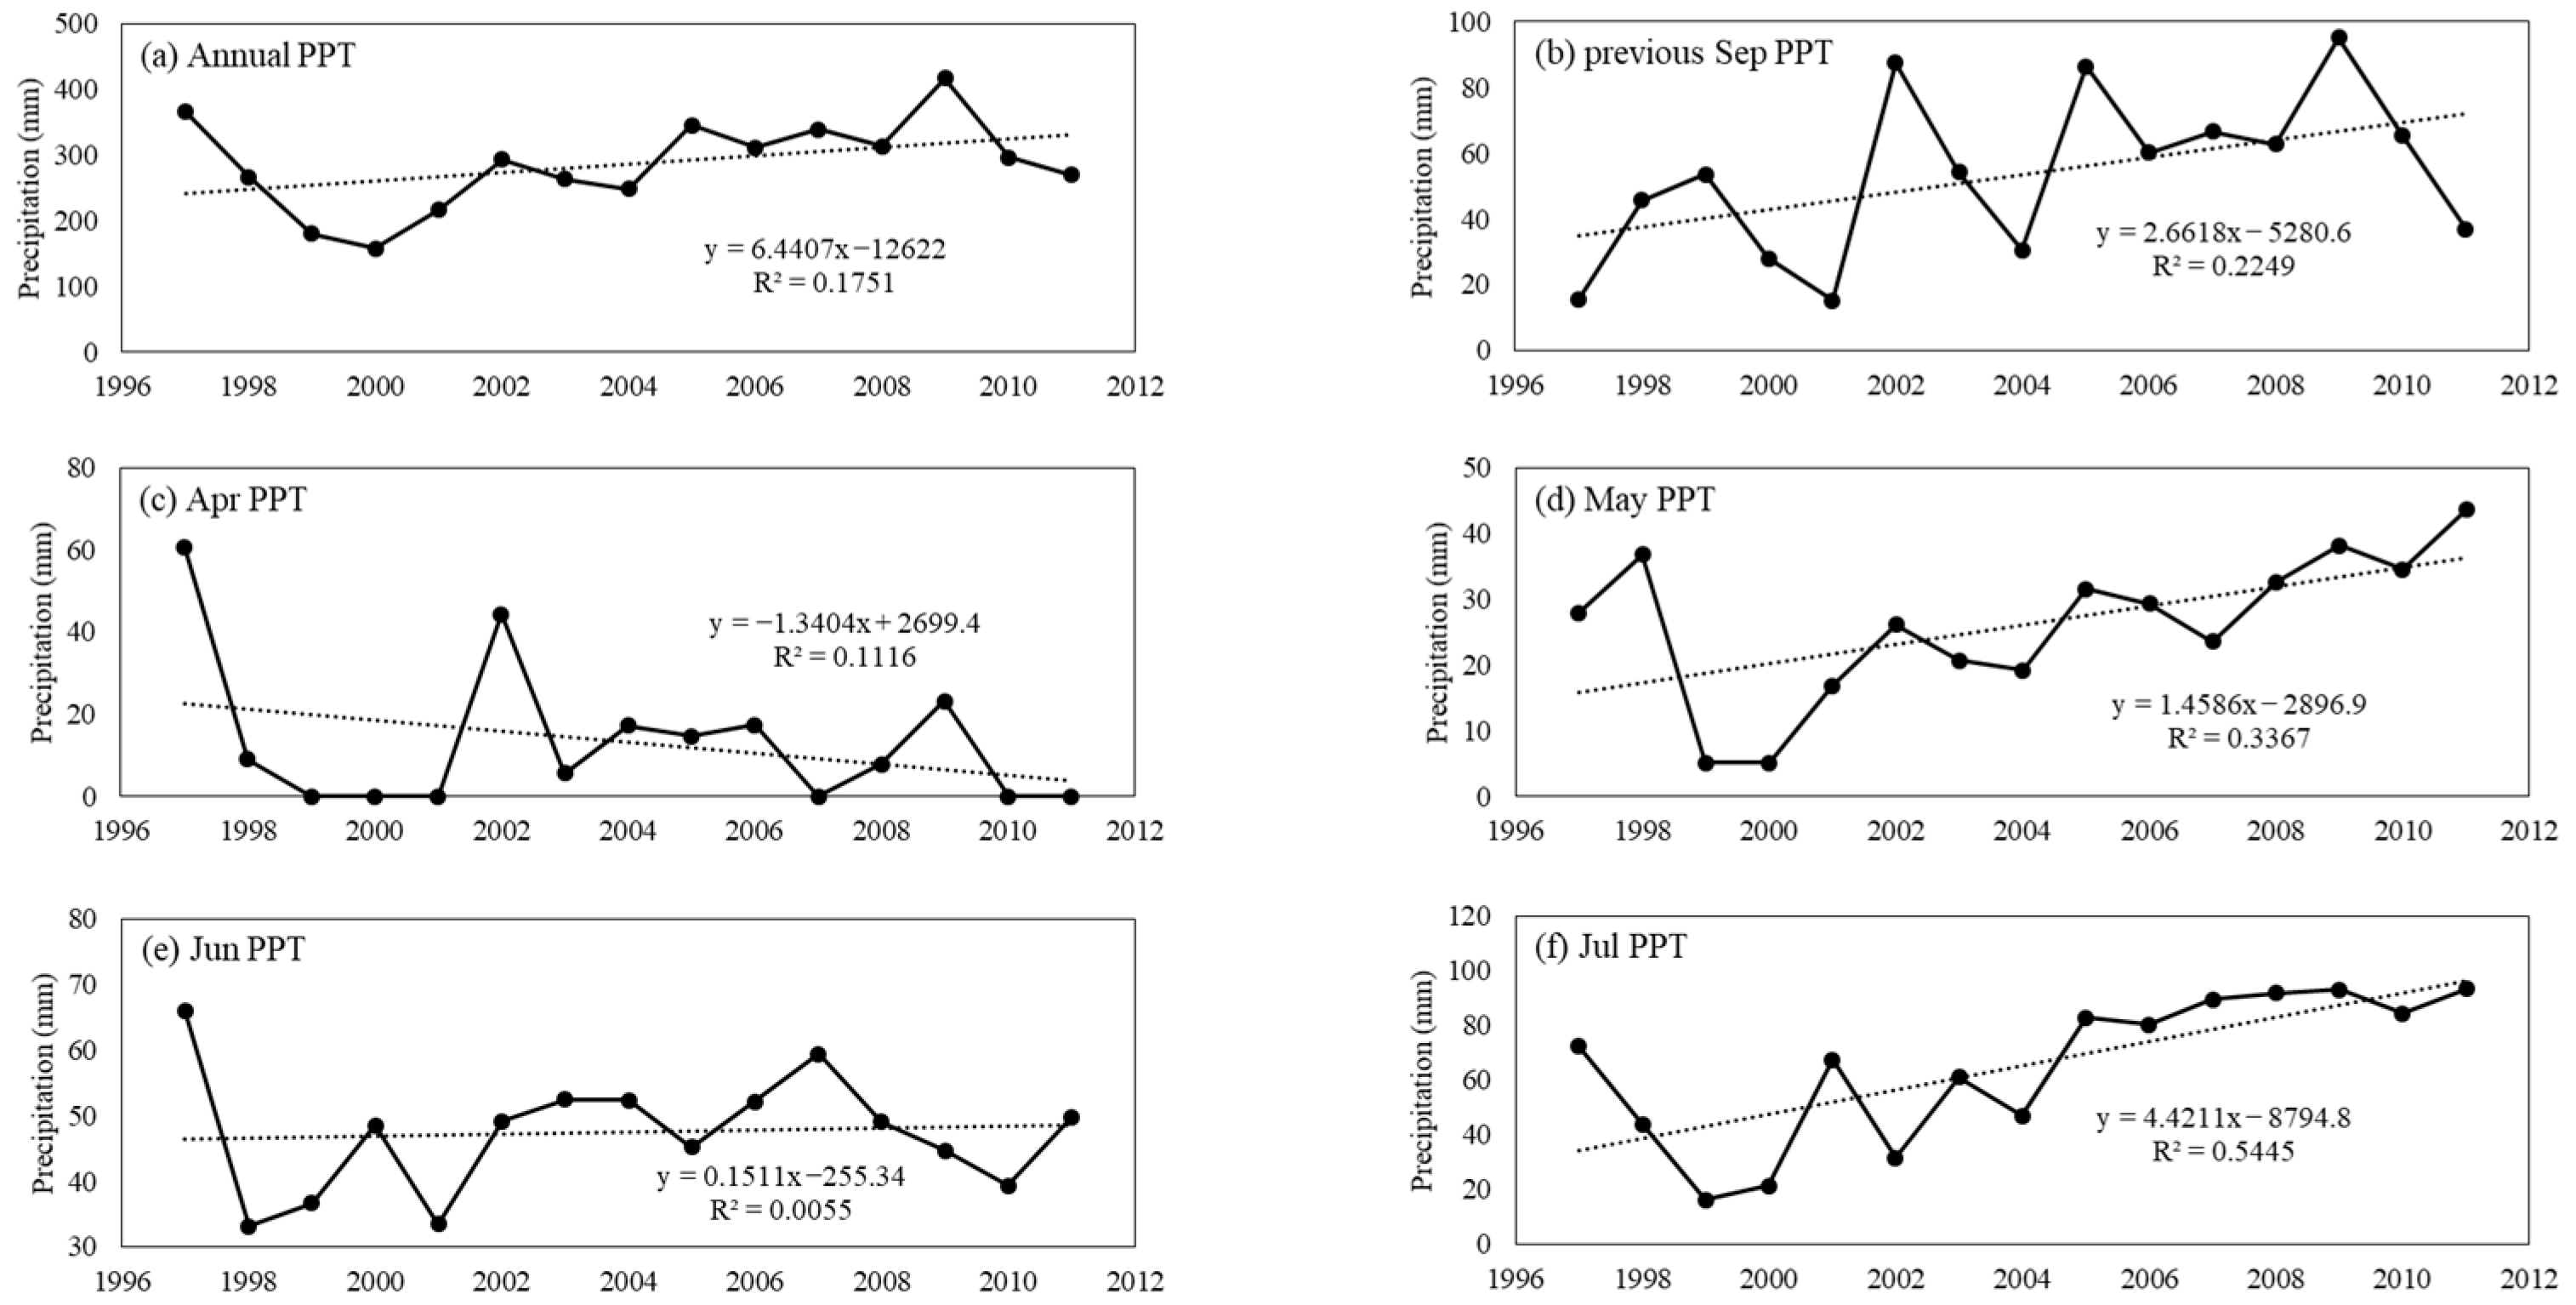
3.2. Response of Vegetation Biomass to Precipitation in Different Periods

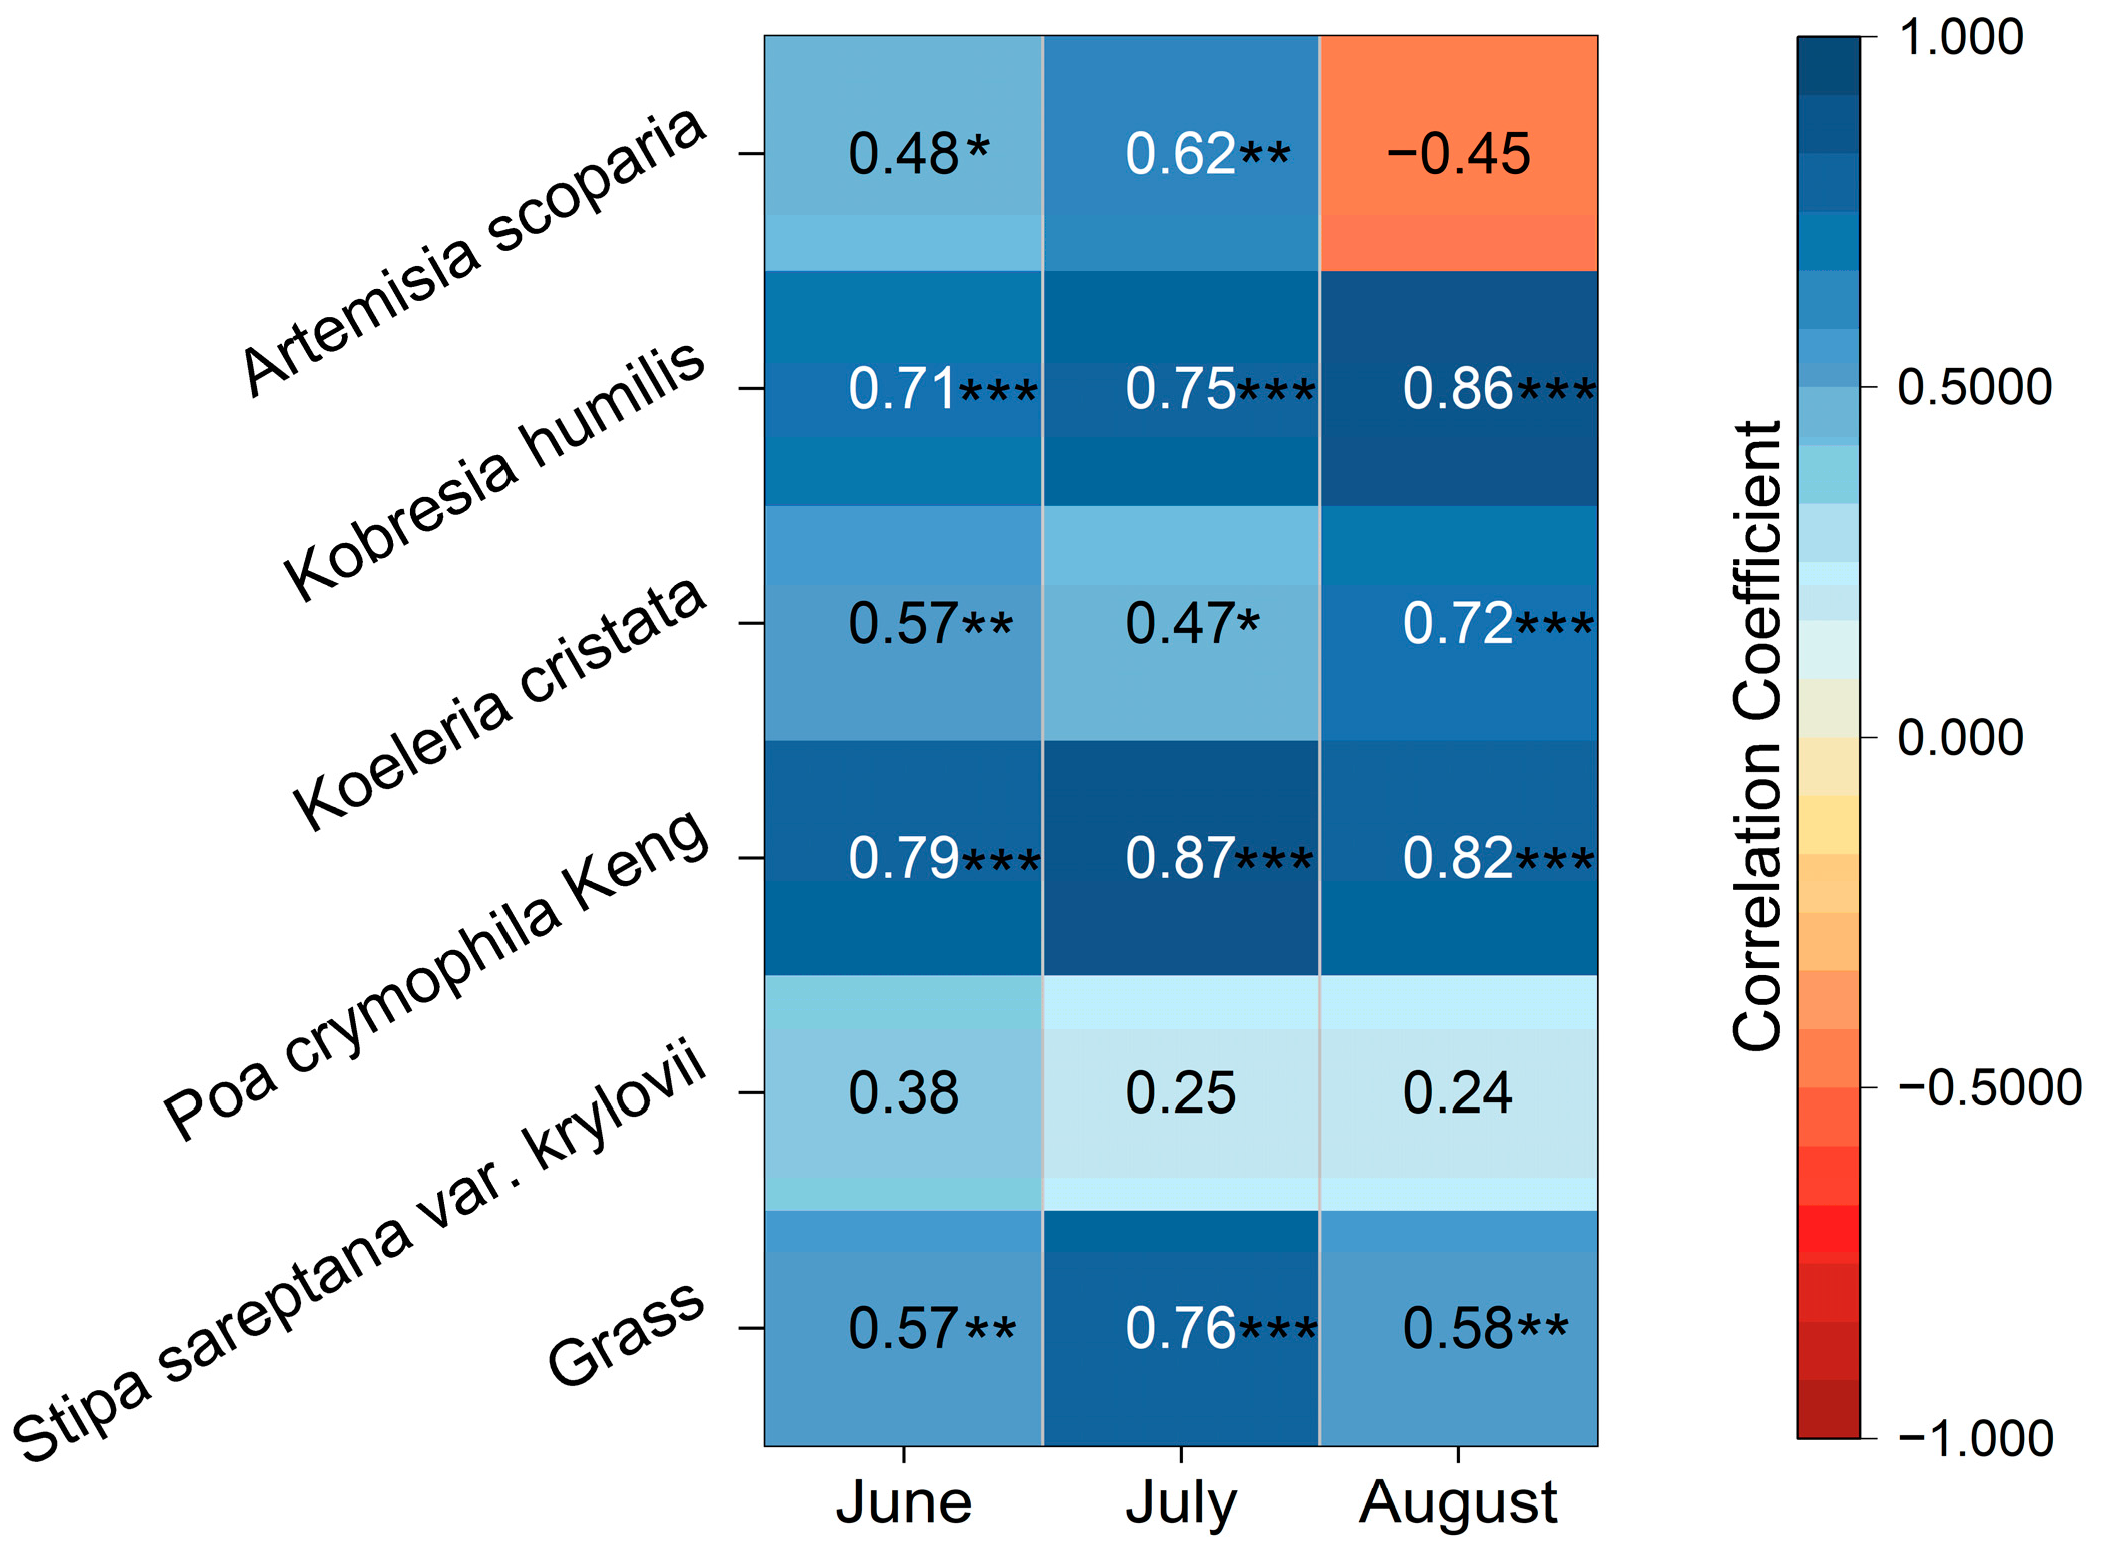
3.2.1. Correlation between Vegetation Biomass and Multi-Period Precipitation

In order to analyze the effects of precipitation patterns on vegetation biomass, we calculated the correlation coefficient between multi-species biomass and multi-period precipitation (shown in the Figure A1 and Figure A2 in the Appendix A). According to statistics in Figure 4, effective precipitation indicated stronger correlations with vegetation biomass than total precipitation generally. Grass biomass showed higher correlation coefficients with multi-period precipitation than weed biomass. In addition, precipitation had time-lag and cumulative effects on grass biomass. In detail, June grass biomass was significantly positively correlated with PPT_A_Sep, PPT_A_Sep_v, and PPT_p_Sep, accounting for 0.60 (p < 0.05), 0.55 (p < 0.05), and 0.50 (p < 0.05) during 1997–2011, respectively. July grass biomass was significantly positively correlated with PPT_ A2_v, PPT_ A3_v, and PPT_ A_Sep_v, accounting for 0.50 (p < 0.05), 0.50 (p < 0.05), 0.50 (p < 0.05), respectively. August grass biomass showed significantly positively correlations with PPT_ p1_v (0.55, p < 0.05) and PPT_ p1 (0.52, p < 0.05).
Furthermore, responses of biomass to multi-period precipitation factors were heterogeneous in different species. In June, Stipa sareptana var. krylovii was significantly positively correlated with PPT_p1 (0.51, p < 0.05). In addition, Poa crymophila Keng was significantly positively correlated with PPT_A_Sep_v (0.57, p < 0.05), PPT_A2_v (0.51, p < 0.05), PPT_p_Sep_v (0.58, p < 0.05), PPT_A_Sep (0.53, p < 0.05), and PPT_p_Sep (0.61, p < 0.05). Koeleria cristata was significantly positively correlated with PPT_A_Sep_v (0.50, p < 0.05) and PPT_A_Sep (0.59, p < 0.05). However, Kobresia humilis and Artemisia scoparia show weak correlation with all the precipitation factors. In July, Stipa sareptana var. krylovii and Artemisia scoparia did not show significant correlation with all the multi-period precipitation factors. On the contrary, Poa crymophila Keng was significantly positively (p < 0.05) correlated with all the multi-period effective precipitation factors except PPT_p1_v. Koeleria cristata was significantly positively correlated with PPT_A_Sep_v (0.56, p < 0.05), PPT_A3_v (0.54, p < 0.05), PPT_A2_v (0.55, p < 0.05), PPT_c_v (0.52, p < 0.05), PPT_A_Sep (0.56, p < 0.05), and PPT_A2 (0.56, p < 0.05). Kobresia humilis was significantly positively correlated with PPT_A3_v (0.51, p < 0.05) and PPT_c_v (0.50, p < 0.05). As for the statistics in August, Stipa sareptana var. krylovii and Kobresia humilis did not show significant correlation with all the multi-period precipitation factors. Poa crymophila Keng was significantly positively correlated with PPT_A_Sep_v (0.61, p < 0.05), PPT_A3_v (0.53, p < 0.05), PPT_A2_v (0.54, p < 0.05), PPT_p1_v (0.60, p < 0.05), PPT_A_Sep (0.52, p < 0.05), PPT_p_Sep (0.51, p < 0.05), and PPT_p1 (0.50, p < 0.05). In addition, Koeleria cristata was significantly positively correlated with most factors. In general, Poa crymophila Keng, Koeleria cristata, and Kobresia humilis showed stronger correlations with multi-period precipitation factors than Stipa sareptana var. krylovii and Artemisia scoparia. Precipitation in different periods had different effects on grass biomass.

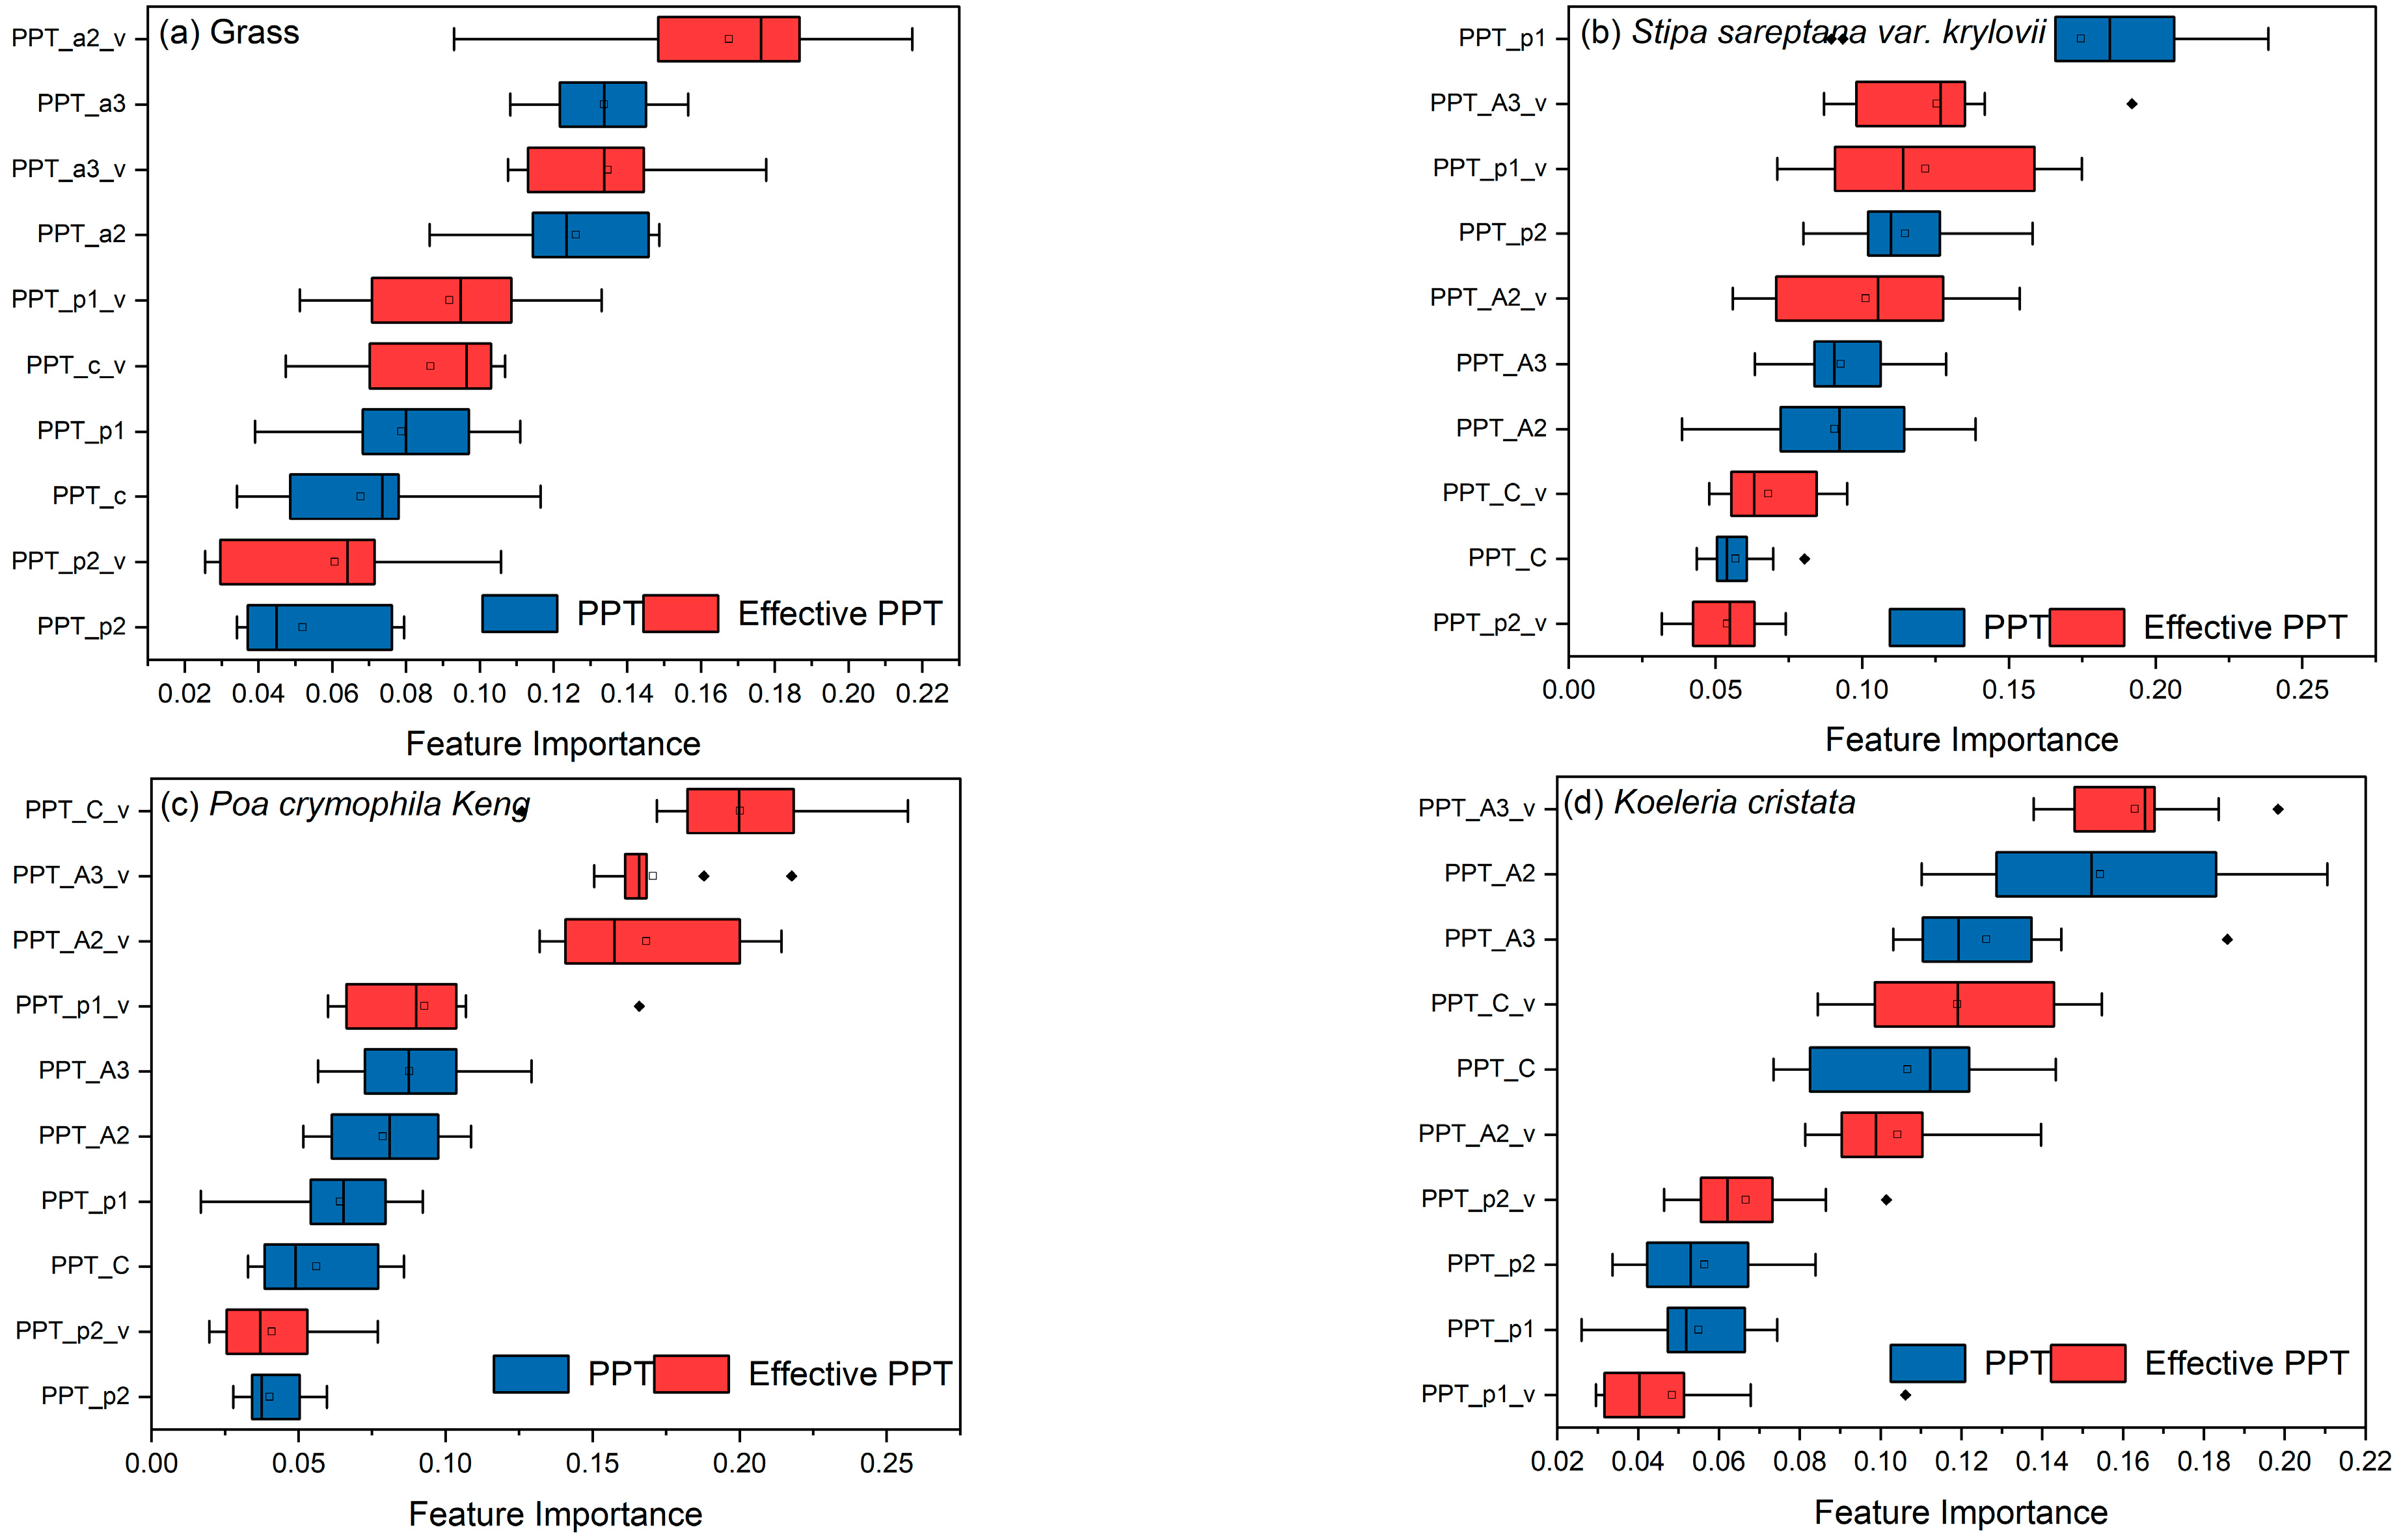
3.2.2. Contributions of Precipitation in Different Periods on Vegetation Biomass

To further quantify contributions of multi-period precipitation on grass biomass, the random forest algorithm was used to rank the importance of the influencing factors and to quantify the contribution of each precipitation factor. According to Random Forest feature, importance based on three-month datasets (Figure 5) of effective precipitation could explain 54.2% of grass biomass change, 47.0% of biomass change in Stipa sareptana var. krylovii, 67.3% of biomass change in Poa crymophila Keng, and 50.2% of biomass change in Koeleria cristata, which indicated that effective precipitation played more important roles in controlling the grass biomass change. On the one hand, precipitation in different periods had different contributions on grass biomass. For example, effective precipitation in previous and current month (PPT_p1_v and PPT_c_v) showed obviously higher contributions on grass biomass than that in the month before last (PPT_p2_v). On the other hand, precipitation in specific period showed different effects on biomass of different species. In detail, precipitation in current month dominated the biomass change in Poa crymophila Keng, but showed low contribution on the Stipa sareptana var. krylovii, and Koeleria cristata. In general, results of random forest analysis demonstrated the importance of effective precipitation on grass biomass and temporal heterogeneity of precipitation effects on vegetation.

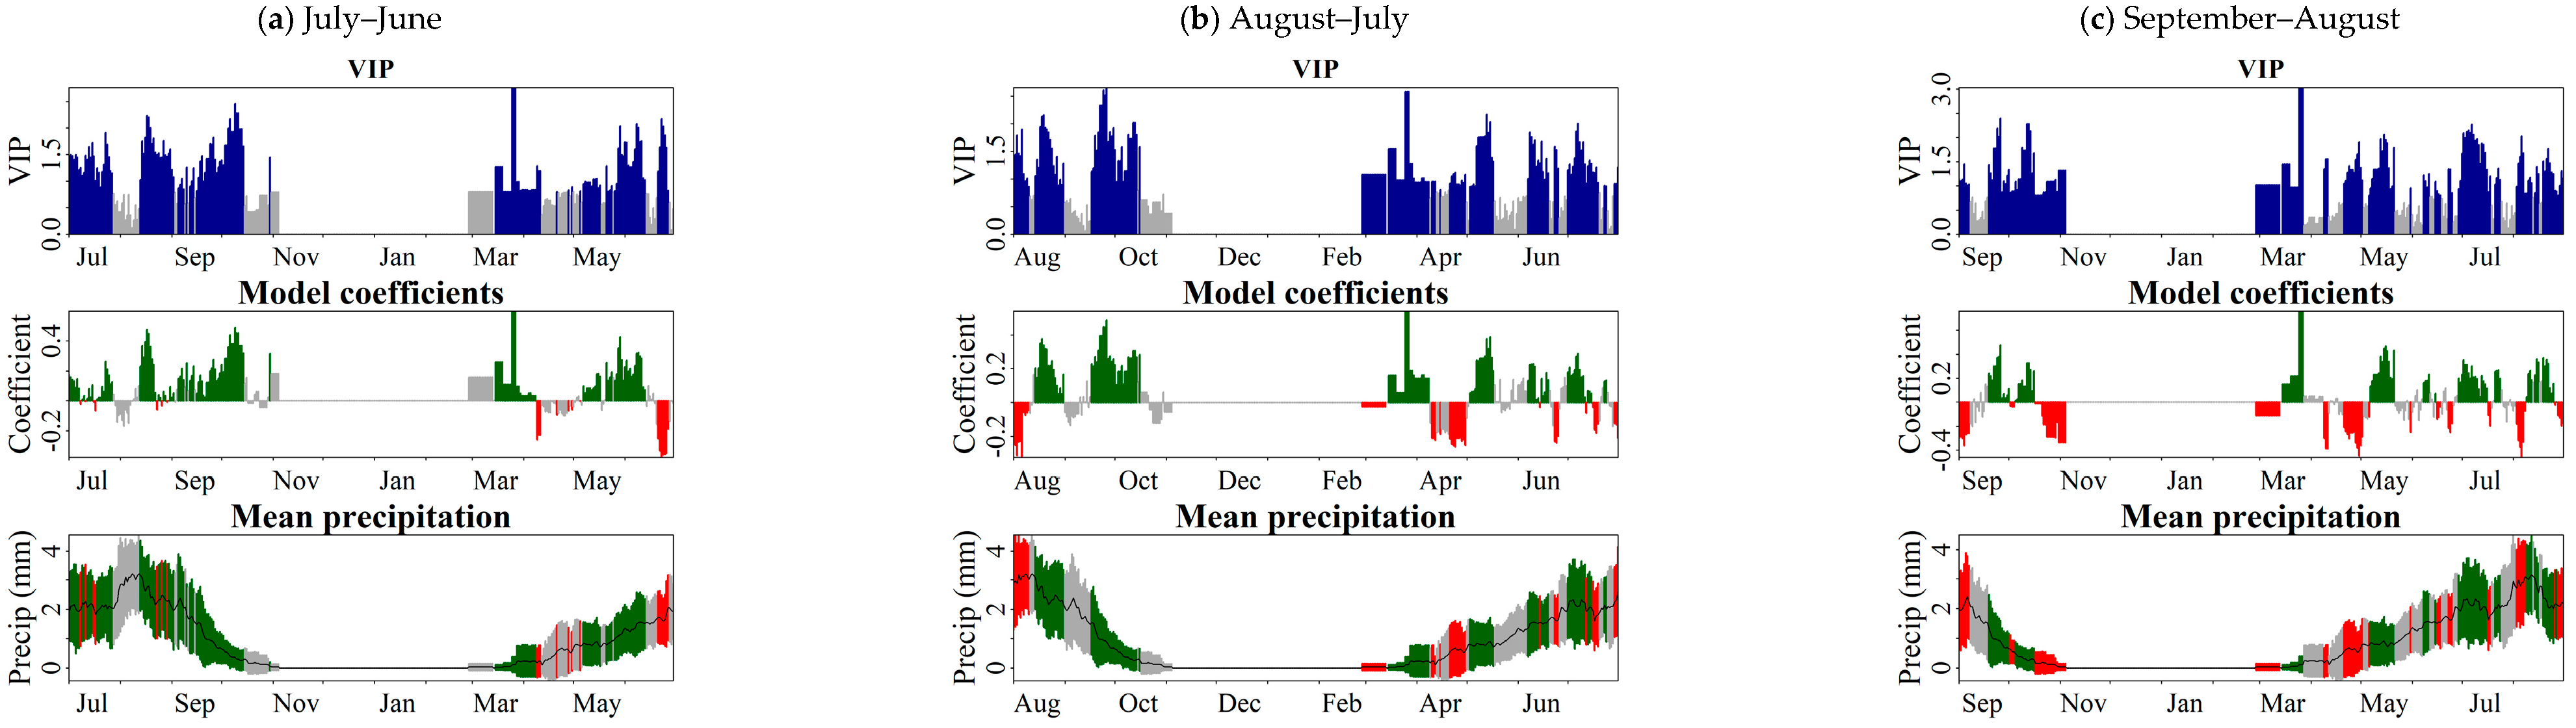
3.3. Crucial Periods of Effective Precipitation for Aboveground Biomass

In the above content, the effective precipitation in different periods of the year showed different effects on grass biomass. However, monthly or annual total precipitation were too coarse to use to study the responses of biomass to precipitation in different periods [49]. In order to deeply understand influence mechanism of altered precipitation patterns, we focused on response of multi-species biomass in the three months (June, July and August) to daily variations of effective precipitation during 1997–2011.
The 365 daily effective precipitation values were used as independent variables in the PLS regression. Low root mean squared error (RMSE) of 3.43 g·m−2 (June), 3.66 g·m−2 (July), and 2.47 g·m−2 (August) for the resulting PLS model indicated that the model was a good fit for the biomass data. Based on the VIP and standardized model coefficients of the PLS analysis, we found that effective precipitation in different periods had varied impacts on grass biomass (Figure 6). During 1 September to 14 October in the prior year, model coefficients for June biomass analysis (Figure 6a) were always positive and VIP values mostly exceeded 0.8, which showed that increase in precipitation in prior senescence period benefited variations of grass biomass in June. Between 7 May and 13 June, model coefficients were consistently positive, and VIP values were mostly important, which meant PPT in the early growing season indicated positive effects on grass biomass in the alpine grassland. As for July biomass (Figure 6b), model coefficients were mostly positive, and VIP values exceeded 0.8 during the prior 17 September to 16 October, 3 May to 17 May, 7 June to 19 June, and 1 July to 11 July, implying that increases in precipitation in these time periods benefited variations of grass biomass in July. In the analysis for August biomass (Figure 6c), we also found several periods, 19 September–16 October, 7 May–21 May, 29 June–24 July, and 9 August–25 August, when the model coefficients were mostly positive and VIP values exceeded 0.8. Moreover, very little precipitation between November and March indicated precipitation during the dormancy phase seemed to be of little importance for determining grassland AGB. Comparison of PLS analysis of effective precipitation and grass biomass in three months implied that prior senescence period and current growing season were generally two crucial periods of precipitation for vegetation growth in alpine grasslands.
In order to further understand temporal heterogeneity of precipitation effects on different species, PLS regression was used to analyze the crucial periods of precipitation for aboveground biomass of different species. Figure 7 showed the periods with positive model coefficients and VIP exceed 0.8. Based on the PLS analysis, we found that effective precipitation had different crucial periods (statistics from prior September to current month) for different species. In June, length of crucial periods of precipitation were 85 days for Stipa sareptana var. krylovii, 97 days for Poa crymophila Keng, 94 days for Koeleria cristata, 59 days for Kobresia humilis, and 46 days for Artemisia scoparia. For July biomass, the crucial periods accounted for 36 days for Stipa sareptana var. krylovii, 103 days for Poa crymophila Keng, 97 days for Koeleria cristata, 78 days for Kobresia humilis, and 63 days for Artemisia scoparia. The crucial periods of precipitation for August biomass accounted for 90 days for Stipa sareptana var. krylovii, 116 days for Poa crymophila Keng, 115 days for Koeleria cristata, 81 days for Kobresia humilis, and 34 days for Artemisia scoparia. In general, precipitation crucial periods for Poa crymophila Keng, Koeleria cristata, and Kobresia humilis were longer than other species. In addition, the current crucial period for Kobresia humilis started in May, relatively later than other species. In other words, crucial periods of effective precipitation appeared heterogeneous for different species, which meant that changes in precipitation patterns indicated varied influences on the grass biomass of different species.
Based on PLS analysis, we found the crucial periods of effective precipitation, when the daily precipitation significantly influenced grass biomass. Therefore, the crucial effective precipitation, cumulative amount of effective precipitation in crucial periods (shown in the Figure A3), could be a new precipitation indicator to explain the grass biomass variations well. In Figure 8, correlations between crucial effective precipitation and multi-species biomass in the three months were calculated to show the significant effects of the precipitation indicator on vegetation variations in alpine grasslands. For the total grass biomass, crucial effective precipitation was significantly positively correlated with grass biomass, accounting for 0.57 (p < 0.05) in June, 0.76 (p < 0.01) in July, and 0.58 (p < 0.05) in August. For different species, biomass of Poa crymophila Keng, Koeleria cristata, and Kobresia humilis showed stronger correlations with crucial effective precipitation than other species. Compared with the effects of effective precipitation in Figure 4, crucial effective precipitation exhibited significantly upgraded influences on the biomass. In general, the crucial effective precipitation could be a good climate indicator to explain vegetation variations in alpine grasslands.

4. Discussion

Under the influence of climate change and land use change, species composition in the alpine regions exhibited significant changes during past decades, such as shrub invasion in Aisa [51], dwarf pine colonization of alpine grasslands in central European mountains [52], grass species colonization of snowbed communities in the Swiss Alps [53], and increased species diversity in northeastern Iberian Peninsula [54]. In this research, vegetation species composition exhibited obvious variations during 1997–2011 in alpine grasslands. In Haibei station, the grassland biomes mainly contained five types of forage grasses and weeds, among which Stipa sareptana var. krylovii was the dominant species, accounting for 30% of biomass. However, the dominant species indicated weak change in biomass, leading to a significant decline, from 37% in the first three years to 27% in the last 3 years, in the proportion of total biomass. On the one hand, the weeds increased significantly, with faster growth rates than grass. The proportion of weeds increased from 35% in the first 3 years to 43% in the last 3 years. On the other hand, biomass of Kobresia humilis and Poa crymophila Keng indicated faster increase rates than other forages. Therefore, rapid increases in weeds, Kobresia humilis, and Poa crymophila Keng squeezed the living space of the dominant species, Stipa sareptana var. krylovii.
Effective precipitation had more important effects on vegetation than total precipitation in alpine grasslands. Numerous previous studies concluded that daily precipitation < 5 mm would not be considered effective in arid environments, as this amount precipitation would likely evaporate from surface before soaking into the ground [45]. In the present research, effective precipitation (>5 mm) indicated stronger correlations with multi-species biomass than total precipitation, which suggested that light precipitation (<5 mm) had no contribution to the increases in soil water content and vegetation biomass. For different species, Poa crymophila Keng, Koeleria cristata, and Kobresia humilis showed stronger relationships with effective precipitation than Stipa sareptana var. krylovii and Artemisia scoparia.
Environmental adaptation determined the vegetation species composition in alpine grasslands under climate change. In recent decades, climate change increased the frequency of extreme events [29,30,31]. As the main factor to determine the distribution of biological communities, accelerated climate variations had changed the adaptability and competitiveness of different species in the ecosystem [43]. Under the influences of climate change, longer growing seasons made grass species more competitive to invade the snowbeds in the Swiss Alps [53]. Accelerated snow melt and drier soil led to obvious changes in vegetation structure in Asian alpine regions [51]. According to the investigations on the growth characteristics of different species on the QTP, weeds, Kobresia humilis, and Poa crymophila Keng had stronger adaptability to climate change. In the present research, precipitation showed different trends in different months (Figure 9). May and July precipitation increased significantly, while April, June, and August precipitation decreased weakly during 1997–2011. Changing precipitation patterns had different effects on different species. Therefore, under the altered precipitation patterns, the forage species with strong adaptability to precipitation variations increased significantly, while the biomass of species with poor ecological adaptability changed weakly. With the intensification of climate variations, species with strong ecological adaptability would occupy more living space in the grassland ecosystem.
Precipitation had time-lag and cumulative effects on grass biomass. According to correlation analysis, grass biomass was significantly positively correlated with effective precipitation in two periods, the prior senescence period (September–October) and the previous month. In the prior senescence period, when the air temperature was always below freezing in alpine region after September, precipitation was frozen in soil, rather than taken up by dormant vegetation. After the dormancy period, when the temperature rose above zero degrees Celsius, frozen soil water thawed into liquid, which provided enough water content for vegetation growth in following growing season. An increase in precipitation during the prior senescence period meant more then enough soil water content, which could be made use of by vegetation in the following growing season. In addition, accumulations of effective precipitation in months always indicated stronger positive effects on biomass than that in a single month, which meant accumulative effective precipitation could better represent the soil water content and further affect the vegetation growth in the periods. Furthermore, effective precipitation in different months showed various contributions on grass biomass. The variations of biomass were mainly influenced by precipitation in previous September, May, July, while precipitation during the dormancy phase (previous November to March) seemed to be of little importance for determining grassland AGB. This was in line with the hypothesis that the impacts of precipitation variations on plant productivity might occur via variability in precipitation patterns [55,56,57,58]. In a word, effective precipitation in crucial periods could better explain vegetation variations in the alpine grasslands.
The crucial effective precipitation, the effective precipitation amounts in the crucial period, could be a new representative climatic indicator to explain vegetation variations in alpine grasslands. With the obvious change of precipitation patterns, the annual or monthly precipitation could no longer accurately describe the roles of precipitation on vegetation variations [49]. The distribution of effective precipitation within a year was critical to vegetation growth. Crucial effective precipitation, the effective precipitation amounts in the crucial periods, dominated the biomass change in the grassland. Furthermore, precipitation patterns indicated varied influences on grass biomass of different species in different aspects. First, Poa crymophila Keng, Koeleria cristata, and Kobresia humilis showed stronger relationships with precipitation amounts than Stipa sareptana var. krylovii and Artemisia scoparia. Then, crucial periods of effective precipitation appeared to influence heterogeneity for different species. In detail, precipitation crucial periods for Poa crymophila Keng, and Kobresia humilis were longer than other species. Therefore, biomass of Poa crymophila Keng, and Kobresia humilis showed stronger relationships with crucial effective precipitation than other species, which meant the three forages could better adapt to the changes of precipitation patterns. In general, crucial effective precipitation reflected the adaptability of species to the change of precipitation patterns. Precipitation patterns during 1997–2011 were more conducive to the growth of Poa crymophila Keng and Kobresia humilis, thereby changing the species composition in alpine grasslands. The new indicator of crucial effective precipitation could provide a new perspective for studying and predicting the species dynamics of alpine grassland.

5. Conclusions

Vegetation species composition exhibited obvious variations during 1997–2011 in the alpine grassland on the Qinghai–Tibet Plateau. Indeed, rapid increases in weeds, Kobresia humilis, and Poa crymophila Keng, with stronger environmental adaptability, squeezed the living space of the dominant species, Stipa sareptana var. krylovii. Meanwhile, effective precipitation had more important effects on vegetation biomass than total precipitation in alpine grasslands, which were heterogeneous in different precipitation periods. Therefore, the crucial effective precipitation, accounting the effective precipitation in crucial periods, could better explain vegetation biomass variations, which could be a new representative climatic indicator to accurately describe vegetation variations in alpine grasslands. In addition, crucial periods of effective precipitation appeared to influence heterogeneity for different vegetation species, which suggested the heterogeneous adaptability of species to the change of precipitation patterns. Precipitation patterns during 1997–2011 were more conducive to the growth of Poa crymophila Keng and Kobresia humilis, thereby changing the species composition in alpine grasslands. The coupling of biological environmental adaptability and abiotic crucial effective precipitation determined the variations of vegetation species composition. The new indicator of crucial effective precipitation could provide a new perspective for studying and predicting the species dynamics of alpine grasslands.

Author Contributions

Conceptualization, W.G.; methodology, W.G. and X.N.; software, X.N. and W.G.; formal analysis, X.N. and W.G.; validation, X.N., and T.L.; writing—original draft preparation, X.N. and W.G.; writing—review and editing, X.N., T.L., J.Z. and S.L.; supervision, W.G. and S.L.; project administration, W.G. and X.N.; funding acquisition, W.G. All authors have read and agreed to the published version of the manuscript.

Funding

This study was financially supported by the National Natural Science Foundation of China (42071124), the 2nd Tibetan Plateau Scientific Expedition and Research (2019QZKK0101), the State Key Laboratory of Loess and Quaternary Geology (SKLLQG1809), and the Fundamental Research Funds for the Central Universities (XZY012019008).

Institutional Review Board Statement

Not applicable.

Informed Consent Statement

Not applicable.

Data Availability Statement

No new data were created or analyzed in this study. Data sharing is not applicable to this article.

Conflicts of Interest

The authors declare no conflict of interest. The funders had no role in the design of the study; in the collection, analyses, or interpretation of data; in the writing of the manuscript; or in the decision to publish the results.

Appendix A

Figure A1. Trends of annual and monthly precipitation during 1997–2011. (a) Annual precipitation; (b) previous September precipitation; (c) April precipitation; (d) May precipitation; (e) June precipitation; (f) July precipitation; (g) August precipitation.
Forests 14 00047 g0a1
Figure A2. Trends of annual and monthly effective precipitation during 1997–2011. (a) Annual precipitation; (b) previous September precipitation; (c) April precipitation; (d) May precipitation; (e) June precipitation; (f) July precipitation; (g) August precipitation.
Forests 14 00047 g0a2aForests 14 00047 g0a2b
Figure A3. Variations of effective precipitation in crucial periods of different species during 1997–2011. (a) Poa crymophila Keng; (b) Koeleria cristata; (c) Kobresia humilis.
Forests 14 00047 g0a3

References

  1. Jiao, W.; Wang, L.; Smith, W.K.; Chang, Q.; Wang, H.; D’Odorico, P. Observed Increasing Water Constraint on Vegetation Growth over the Last Three Decades. Nat. Commun. 2021, 12, 3777. [Google Scholar] [CrossRef] [PubMed]
  2. Wang, S.; Zhang, Y.; Ju, W.; Chen, J.; Ciais, P.; Cescatti, A.; Sardans, J.; Janssens, I.; Wu, M.; Berry, J.; et al. Recent Global Decline of CO2 Fertilization Effects on Vegetation Photosynthesis. Science 2020, 370, 1295–1300. [Google Scholar] [CrossRef]
  3. Anderson, R.; Canadell, J.; Randerson, J.; Jackson, R.; Hungate, B.; Baldocchi, D.; Ban-Weiss, G.; Bonan, G.; Caldeira, K.; Cao, L.; et al. Biophysical Considerations in Forestry for Climate Protection. Front. Ecol. Environ. 2011, 9, 174–182. [Google Scholar] [CrossRef] [Green Version]
  4. Cramer, W.; Bondeau, A.; Woodward, F.I.; Prentice, I.C.; Betts, R.A.; Brovkin, V.; Cox, P.M.; Fisher, V.; Foley, J.A.; Friend, A.D.; et al. Global Response of Terrestrial Ecosystem Structure and Function to CO2 and Climate Change: Results from Six Dynamic Global Vegetation Models: Ecosystem dynamics, CO2 and climate change. Glob. Change Biol. 2001, 7, 357–373. [Google Scholar] [CrossRef] [Green Version]
  5. Nemani, R.R.; Keeling, C.D.; Hashimoto, H.; Jolly, W.M.; Piper, S.C.; Tucker, C.J.; Myneni, R.B.; Running, S.W. Climate-Driven Increases in Global Terrestrial Net Primary Production from 1982 to 1999. Science 2003, 300, 1560–1563. [Google Scholar] [CrossRef] [PubMed] [Green Version]
  6. Bardgett, R.D.; Bullock, J.M.; Lavorel, S.; Manning, P.; Schaffner, U.; Ostle, N.; Chomel, M.; Durigan, G.; Fry, E.L.; Johnson, D.; et al. Combatting Global Grassland Degradation. Nat. Rev. Earth Environ. 2021, 2, 720–735. [Google Scholar] [CrossRef]
  7. Shi, Y.; Wang, Y.; Ma, Y.; Ma, W.; Liang, C.; Flynn, D.F.B.; Schmid, B.; Fang, J.; He, J.-S. Field-Based Observations of Regional-Scale, Temporal Variation in Net Primary Production in Tibetan Alpine Grasslands. Biogeosciences 2014, 11, 2003–2016. [Google Scholar] [CrossRef] [Green Version]
  8. Silva, C.A.; Duncanson, L.; Hancock, S.; Neuenschwander, A.; Thomas, N.; Hofton, M.; Fatoyinbo, L.; Simard, M.; Marshak, C.Z.; Armston, J.; et al. Fusing Simulated GEDI, ICESat-2 and NISAR Data for Regional Aboveground Biomass Mapping. Remote Sens. Environ. 2021, 253, 112234. [Google Scholar] [CrossRef]
  9. Scurlock, J.M.O.; Johnson, K.; Olson, R.J. Estimating Net Primary Productivity from Grassland Biomass Dynamics Measurements: Net primary productivity of grasslands. Glob. Change Biol. 2002, 8, 736–753. [Google Scholar] [CrossRef] [Green Version]
  10. Lovell, J.T.; MacQueen, A.H.; Mamidi, S.; Bonnette, J.; Jenkins, J.; Napier, J.D.; Sreedasyam, A.; Healey, A.; Session, A.; Shu, S.; et al. Genomic Mechanisms of Climate Adaptation in Polyploid Bioenergy Switchgrass. Nature 2021, 590, 438–444. [Google Scholar] [CrossRef]
  11. Ma, Z.; Liu, H.; Mi, Z.; Zhang, Z.; Wang, Y.; Xu, W.; Jiang, L.; He, J.-S. Climate Warming Reduces the Temporal Stability of Plant Community Biomass Production. Nat. Commun. 2017, 8, 15378. [Google Scholar] [CrossRef] [PubMed] [Green Version]
  12. Knapp, A.; Smith, M. Interannual Variability in Net Primary Production and Precipitation—Response. Science 2001, 293, 1723. [Google Scholar]
  13. Knapp, A.K.; Smith, M.D. Variation Among Biomes in Temporal Dynamics of Aboveground Primary Production. Science 2001, 291, 481–484. [Google Scholar] [CrossRef] [PubMed] [Green Version]
  14. Liu, H.; Mi, Z.; Lin, L.; Wang, Y.; Zhang, Z.; Zhang, F.; Wang, H.; Liu, L.; Zhu, B.; Cao, G.; et al. Shifting Plant Species Composition in Response to Climate Change Stabilizes Grassland Primary Production. Proc. Natl. Acad. Sci. USA 2018, 115, 4051–4056. [Google Scholar] [CrossRef] [Green Version]
  15. Grime, J.P.; Brown, V.K.; Thompson, K.; Masters, G.J.; Hillier, S.H.; Clarke, I.P.; Askew, A.P.; Corker, D.; Kielty, J.P. The Response of Two Contrasting Limestone Grasslands to Simulated Climate Change. Science 2000, 289, 762–765. [Google Scholar] [CrossRef]
  16. Guo, Q.; Hu, Z.; Li, S.; Li, X.; Sun, X.; Yu, G. Spatial Variations in Aboveground Net Primary Productivity along a Climate Gradient in Eurasian Temperate Grassland: Effects of Mean Annual Precipitation and Its Seasonal Distribution. Glob. Change Biol. 2012, 18, 3624–3631. [Google Scholar] [CrossRef]
  17. Sala, O.E.; Gherardi, L.A.; Reichmann, L.; Jobbágy, E.; Peters, D. Legacies of Precipitation Fluctuations on Primary Production: Theory and Data Synthesis. Phil. Trans. R. Soc. B 2012, 367, 3135–3144. [Google Scholar] [CrossRef] [Green Version]
  18. Isbell, F.; Craven, D.; Connolly, J.; Loreau, M.; Schmid, B.; Beierkuhnlein, C.; Bezemer, T.M.; Bonin, C.; Bruelheide, H.; de Luca, E.; et al. Biodiversity Increases the Resistance of Ecosystem Productivity to Climate Extremes. Nature 2015, 526, 574–577. [Google Scholar] [CrossRef]
  19. Li, P.; Peng, C.; Wang, M.; Li, W.; Zhao, P.; Wang, K.; Yang, Y.; Zhu, Q. Quantification of the Response of Global Terrestrial Net Primary Production to Multifactor Global Change. Ecol. Indic. 2017, 76, 245–255. [Google Scholar] [CrossRef]
  20. Xia, M.; Jia, K.; Zhao, W.; Liu, S.; Wei, X.; Wang, B. Spatio-Temporal Changes of Ecological Vulnerability across the Qinghai-Tibetan Plateau. Ecol. Indic. 2021, 123, 107274. [Google Scholar] [CrossRef]
  21. Dong, S.; Shang, Z.; Gao, J.; Boone, R.B. Enhancing Sustainability of Grassland Ecosystems through Ecological Restoration and Grazing Management in an Era of Climate Change on Qinghai-Tibetan Plateau. Agric. Ecosyst. Environ. 2020, 287, 106684. [Google Scholar] [CrossRef]
  22. Gao, Y.; Zhou, X.; Wang, Q.; Wang, C.; Zhan, Z.; Chen, L.; Yan, J.; Qu, R. Vegetation Net Primary Productivity and Its Response to Climate Change during 2001–2008 in the Tibetan Plateau. Sci. Total Environ. 2013, 444, 356–362. [Google Scholar] [CrossRef] [PubMed]
  23. Huang, K.; Zhang, Y.; Zhu, J.; Liu, Y.; Zu, J.; Zhang, J. The Influences of Climate Change and Human Activities on Vegetation Dynamics in the Qinghai-Tibet Plateau. Remote Sens. 2016, 8, 876. [Google Scholar] [CrossRef] [Green Version]
  24. Fan, J.-W.; Shao, Q.-Q.; Liu, J.-Y.; Wang, J.-B.; Harris, W.; Chen, Z.-Q.; Zhong, H.-P.; Xu, X.-L.; Liu, R.-G. Assessment of Effects of Climate Change and Grazing Activity on Grassland Yield in the Three Rivers Headwaters Region of Qinghai–Tibet Plateau, China. Environ. Monit. Assess. 2010, 170, 571–584. [Google Scholar] [CrossRef] [PubMed]
  25. Xu, H.; Wang, X.; Zhang, X. Impacts of Climate Change and Human Activities on the Aboveground Production in Alpine Grasslands: A Case Study of the Source Region of the Yellow River, China. Arab. J. Geosci. 2017, 10, 17. [Google Scholar] [CrossRef]
  26. Xu, H.; Wang, X.; Zhang, X. Alpine Grasslands Response to Climatic Factors and Anthropogenic Activities on the Tibetan Plateau from 2000 to 2012. Ecol. Eng. 2016, 92, 251–259. [Google Scholar] [CrossRef]
  27. Gao, Q.; Li, Y.; Wan, Y.; Qin, X.; Jiangcun, W.; Liu, Y. Dynamics of Alpine Grassland NPP and Its Response to Climate Change in Northern Tibet. Clim. Change 2009, 97, 515–528. [Google Scholar] [CrossRef]
  28. Zhang, Y.; Zhang, C.; Wang, Z.; Chen, Y.; Gang, C.; An, R.; Li, J. Vegetation Dynamics and Its Driving Forces from Climate Change and Human Activities in the Three-River Source Region, China from 1982 to 2012. Sci. Total Environ. 2016, 563–564, 210–220. [Google Scholar] [CrossRef] [PubMed]
  29. Zhang, S.; Zhang, J.; Liang, S.; Liu, S.; Zhou, Y. A Perception of the Nexus “Resistance, Recovery, Resilience” of Vegetations Responded to Extreme Precipitation Pulses in Arid and Semi-Arid Regions: A Case Study of the Qilian Mountains Nature Reserve, China. Sci. Total Environ. 2022, 843, 157105. [Google Scholar] [CrossRef]
  30. Guo, Z.; Lou, W.; Sun, C.; He, B. Trend Changes of the Vegetation Activity in Northeastern East Asia and the Connections with Extreme Climate Indices. Remote Sens. 2022, 14, 3151. [Google Scholar] [CrossRef]
  31. Wang, L.; Hu, F.; Miao, Y.; Zhang, C.; Zhang, L.; Luo, M. Changes in Vegetation Dynamics and Relations with Extreme Climate on Multiple Time Scales in Guangxi, China. Remote Sens. 2022, 14, 2013. [Google Scholar] [CrossRef]
  32. Heisler-White, J.L.; Knapp, A.K.; Kelly, E.F. Increasing Precipitation Event Size Increases Aboveground Net Primary Productivity in a Semi-Arid Grassland. Oecologia 2008, 158, 129–140. [Google Scholar] [CrossRef] [PubMed]
  33. Guo, Q.; Hu, Z.; Li, S.; Yu, G.; Sun, X.; Zhang, L.; Mu, S.; Zhu, X.; Wang, Y.; Li, Y.; et al. Contrasting Responses of Gross Primary Productivity to Precipitation Events in a Water-Limited and a Temperature-Limited Grassland Ecosystem. Agric. For. Meteorol. 2015, 214–215, 169–177. [Google Scholar] [CrossRef]
  34. Parton, W.; Morgan, J.; Smith, D.; Del Grosso, S.; Prihodko, L.; LeCain, D.; Kelly, R.; Lutz, S. Impact of Precipitation Dynamics on Net Ecosystem Productivity. Glob. Change Biol. 2012, 18, 915–927. [Google Scholar] [CrossRef]
  35. Fernandes, V.M.C.; Machado de Lima, N.M.; Roush, D.; Rudgers, J.; Collins, S.L.; Garcia-Pichel, F. Exposure to Predicted Precipitation Patterns Decreases Population Size and Alters Community Structure of Cyanobacteria in Biological Soil Crusts from the Chihuahuan Desert: Changing Rainfall Effects on Soil Cyanobacteria. Environ. Microbiol. 2018, 20, 259–269. [Google Scholar] [CrossRef]
  36. Liu, W.J.; Li, L.F.; Biederman, J.A.; Hao, Y.B.; Zhang, H.; Kang, X.M.; Cui, X.Y.; Wang, Y.F.; Li, M.W.; Xu, Z.H.; et al. Repackaging Precipitation into Fewer, Larger Storms Reduces Ecosystem Exchanges of CO2 and H2O in a Semiarid Steppe. Agric. For. Meteorol. 2017, 247, 356–364. [Google Scholar] [CrossRef]
  37. Sun, Q.; Meyer, W.S.; Koerber, G.R.; Marschner, P. Prior Rainfall Pattern Determines Response of Net Ecosystem Carbon Exchange to a Large Rainfall Event in a Semi-Arid Woodland. Agric. Ecosyst. Environ. 2017, 247, 112–119. [Google Scholar] [CrossRef]
  38. Lehmann, J.; Coumou, D.; Frieler, K. Increased Record-Breaking Precipitation Events under Global Warming. Clim. Change 2015, 132, 501–515. [Google Scholar] [CrossRef]
  39. Spinoni, J.; Naumann, G.; Carrao, H.; Barbosa, P.; Vogt, J. World Drought Frequency, Duration, and Severity for 1951–2010: World drought climatologies for 1951–2010. Int. J. Climatol. 2014, 34, 2792–2804. [Google Scholar] [CrossRef] [Green Version]
  40. Siteur, K.; Eppinga, M.B.; Karssenberg, D.; Baudena, M.; Bierkens, M.F.P.; Rietkerk, M. How Will Increases in Rainfall Intensity Affect Semiarid Ecosystems? Water Resour. Res. 2014, 50, 5980–6001. [Google Scholar] [CrossRef] [Green Version]
  41. Zhang, D.-H.; Li, X.-R.; Zhang, F.; Zhang, Z.-S.; Chen, Y.-L. Effects of Rainfall Intensity and Intermittency on Woody Vegetation Cover and Deep Soil Moisture in Dryland Ecosystems. J. Hydrol. 2016, 543, 270–282. [Google Scholar] [CrossRef]
  42. Del Grosso, S.J.; Parton, W.J.; Derner, J.D.; Chen, M.; Tucker, C.J. Simple Models to Predict Grassland Ecosystem C Exchange and Actual Evapotranspiration Using NDVI and Environmental Variables. Agric. For. Meteorol. 2018, 249, 1–10. [Google Scholar] [CrossRef]
  43. Yu, L.; Li, K.; Tao, B.; Xu, M. Simulating and Assessing the Adaptability of Geographic Distribution of Vegetation to Climate Change in China. Prog. Geogr. 2010, 29, 1326–1332. [Google Scholar]
  44. Li, C.; Li, Q.; Zhao, L.; Ge, S.; Chen, D.; Dong, Q.; Zhao, X. Land-Use Effects on Organic and Inorganic Carbon Patterns in the Topsoil around Qinghai Lake Basin, Qinghai-Tibetan Plateau. Catena 2016, 147, 345–355. [Google Scholar] [CrossRef]
  45. Ali, M.; Mubarak, S. Effective Rainfall Calculation Methods for Field Crops: An Overview, Analysis and New Formulation. ARJA 2017, 7, 1–12. [Google Scholar] [CrossRef]
  46. Guo, L.; Dai, J.; Wang, M.; Xu, J.; Luedeling, E. Responses of Spring Phenology in Temperate Zone Trees to Climate Warming: A Case Study of Apricot Flowering in China. Agric. For. Meteorol. 2015, 201, 1–7. [Google Scholar] [CrossRef] [Green Version]
  47. Luedeling, E.; Gassner, A. Partial Least Squares Regression for Analyzing Walnut Phenology in California. Agric. For. Meteorol. 2012, 158–159, 43–52. [Google Scholar] [CrossRef]
  48. Yu, H.; Luedeling, E.; Xu, J. Winter and Spring Warming Result in Delayed Spring Phenology on the Tibetan Plateau. Proc. Natl. Acad. Sci. USA 2010, 107, 22151–22156. [Google Scholar] [CrossRef] [PubMed] [Green Version]
  49. Guo, L.; Cheng, J.; Luedeling, E.; Koerner, S.E.; He, J.-S.; Xu, J.; Gang, C.; Li, W.; Luo, R.; Peng, C. Critical Climate Periods for Grassland Productivity on China’s Loess Plateau. Agric. For. Meteorol. 2017, 233, 101–109. [Google Scholar] [CrossRef]
  50. Breiman, L. Random Forests. Mach. Learn. 2001, 45, 5–32. [Google Scholar] [CrossRef] [Green Version]
  51. Amagai, Y.; Kudo, G.; Sato, K. Changes in Alpine Plant Communities under Climate Change: Dynamics of Snow-Meadow Vegetation in Northern Japan over the Last 40 Years. Appl. Veg. Sci. 2018, 21, 561–571. [Google Scholar] [CrossRef]
  52. Zeidler, M.; Duchoslav, M.; Banaš, M.; Lešková, M. Impacts of Introduced Dwarf Pine (Pinus mugo) on the Diversity and Composition of Alpine Vegetation. Community Ecol. 2012, 13, 213–220. [Google Scholar] [CrossRef]
  53. Matteodo, M.; Ammann, K.; Verrecchia, E.P.; Vittoz, P. Snowbeds Are More Affected than Other Subalpine-Alpine Plant Communities by Climate Change in the Swiss Alps. Ecol. Evol. 2016, 6, 6969–6982. [Google Scholar] [CrossRef] [PubMed]
  54. Batllori, E.; Blanco-Moreno, J.M.; Ninot, J.M.; Gutiérrez, E.; Carrillo, E. Vegetation Patterns at the Alpine Treeline Ecotone: The Influence of Tree Cover on Abrupt Change in Species Composition of Alpine Communities. J. Veg. Sci. 2009, 20, 814–825. [Google Scholar] [CrossRef]
  55. Hsu, J.S.; Adler, P.B. Anticipating Changes in Variability of Grassland Production due to Increases in Interannual Precipitation Variability. Ecosphere 2014, 5, art58. [Google Scholar] [CrossRef]
  56. Knapp, A.K.; Fay, P.A.; Blair, J.M.; Collins, S.L.; Smith, M.D.; Carlisle, J.D.; Harper, C.W.; Danner, B.T.; Lett, M.S.; McCarron, J.K. Rainfall Variability, Carbon Cycling, and Plant Species Diversity in a Mesic Grassland. Science 2002, 298, 2202–2205. [Google Scholar] [CrossRef] [Green Version]
  57. Knapp, A.K.; Burns, C.E.; Fynn, R.W.S.; Kirkman, K.P.; Morris, C.D.; Smith, M.D. Convergence and Contingency in Production–Precipitation Relationships in North American and South African C4 Grasslands. Oecologia 2006, 149, 456–464. [Google Scholar] [CrossRef]
  58. Koerner, S.E.; Collins, S.L. Interactive Effects of Grazing, Drought, and Fire on Grassland Plant Communities in North America and South Africa. Ecology 2014, 95, 98–109. [Google Scholar] [CrossRef]
Figure 1. Study area and the location of grassland experimental station.
Forests 14 00047 g001
Figure 2. Variations of AGB in June, July, and August during 1997~2011, (ac): total biomass; (df): grass and weed; (gi): percentage of different species. Trends estimated by the least-squares linear regression are shown in the graphs.
Forests 14 00047 g002
Figure 3. Statistics of AGB variations in different species in different months during 1997–2011. (A) shows slope, while (B) shows R for AGB variations.
Forests 14 00047 g003
Figure 4. Correlations between multi-species AGB ((a): June AGB; (b): July AGB; (c): August AGB) and multi-period precipitation in Qinghai Lake region during 1997–2011. Multi-period precipitation factors: PPT_C/PPT_C_v: precipitation/effective precipitation in current month; PPT_p1/PPT_p1_v: precipitation/effective precipitation in previous month; PPT_p2/PPT_p2_v: precipitation/effective precipitation in the month before last; PPT_p_Sep/PPT_ p_Sep_v: precipitation/effective precipitation in previous September; PPT_A2/PPT_ A2_v: accumulation of precipitation/effective precipitation in last 2 months; PPT_A3/PPT_ A3_v: accumulation of precipitation/effective precipitation in last 3 months; PPT_A_Sep/PPT_A_Sep_v: accumulation of precipitation/effective precipitation from previous September to current month.
Forests 14 00047 g004
Figure 5. Random Forest Feature importance for Multi-species biomass ((a): Grass; (b): Stipa sareptana var. krylovii; (c): Poa crymophila Keng; (d): Koeleria cristata) during 1997–2011.
Forests 14 00047 g005
Figure 6. Results of Partial Least Squares (PLS) regression correlating grass biomass in 1997–2011 with 15-day running means of daily effective precipitation during (a) July–June, (b) August–July and (c) September–August. Blue bars indicate that VIP values are greater than 0.8, the threshold for variable importance. Red color means model coefficients are negative and important, while green color indicates important positive relationships between aboveground biomass and precipitation.
Forests 14 00047 g006
Figure 7. Results of Partial Least Squares (PLS) regression correlating biomass with daily effective precipitation during (a) July–June, (b) August–July and (c) September–August for different species. Gray bars show significant positive relationships between aboveground biomass and precipitation.
Forests 14 00047 g007
Figure 8. Correlations between multi-species AGB and effective precipitation during crucial periods. The *, **, and *** denote correlation required for significance at the 90%, 95%, and 99% levels, respectively.
Forests 14 00047 g008
Figure 9. Trends of precipitation (PPT) in different months during 1997–2011. * means significant change (p < 0.1), ** means significant change (p < 0.05).
Forests 14 00047 g009
Disclaimer/Publisher’s Note: The statements, opinions and data contained in all publications are solely those of the individual author(s) and contributor(s) and not of MDPI and/or the editor(s). MDPI and/or the editor(s) disclaim responsibility for any injury to people or property resulting from any ideas, methods, instructions or products referred to in the content.

