Article

Contrasting Soil Microbial Functional Potential for Phosphorus Cycling in Subtropical and Temperate Forests

1
Shaanxi Key Laboratory of Earth Surface System and Environmental Carrying Capacity, College of Urban and Environmental Science, Northwest University, Xi’an 710127, China
2
Biology Department, San Diego State University, San Diego, CA 92182, USA
3
State Key Laboratory of Soil Erosion and Dryland Farming on the Loess Plateau, Institute of Soil and Water Conservation, Chinese Academy of Sciences and Ministry of Water Resources, Xianyang 712100, China
4
The College of Life Sciences, Northwest University, Xi’an 710072, China
*
Author to whom correspondence should be addressed.
Forests 2022, 13(12), 2002; https://doi.org/10.3390/f13122002
Submission received: 22 September 2022 / Revised: 20 November 2022 / Accepted: 21 November 2022 / Published: 26 November 2022
(This article belongs to the Special Issue Nutrient Cycling in Forest Ecosystems under Environmental Changes)

Abstract

:
Microorganisms play important roles in phosphorus (P) cycling via their regulation of P uptake and transport, P mineralization and solubilization, and the mediation of P deficiency in forest biomes. However, the dynamics of microbial P functional genes and the underlying regulatory mechanisms in different forest biomes (e.g., temperate vs. subtropical) have yet to be sufficiently clarified. In this study, we applied a metagenomics approach to investigate changes in the abundance of three microbial P functional gene groups (P starvation response regulation genes, P uptake and transport genes, and P solubilization and mineralization genes) along a subtropical–temperate gradient of forest biomes (23° N–45° N) in China. Our results revealed that the abundances of P starvation response regulation genes in temperate forest biomes were significantly higher than those in the subtropics (p < 0.05), although not in the cases of the other two P functional gene types (p > 0.05). Moreover, in both temperate and subtropical forests, Acidobacteria, Actinobacteria, Proteobacteria, and Verrucomicrobia were identified as key phyla associated with P cycling; moreover, we found dominate species of Acidobacteria and Proteobacteria at genus level were higher in subtropical zones than that of temperate zones, in most cases. Furthermore, our results showed that significant correlation was found between P functional genes and microbial α-diversity along latitude gradient. Furthermore, in both forest biomes, microbial community α-diversity was significantly positively correlated with P starvation response regulation genes (p < 0.05), whereas α-diversity was significantly positively related to P uptake and transport genes in temperate forest biomes (p < 0.001), although not in subtropical forests (p > 0.05). In addition, we found that whereas soil substrates showed significant negative relationships with P solubilization and mineralization genes in temperate forest biomes (p < 0.05), this was not the case in subtropical forests. Collectively, these findings indicate that the responses of microbial P functional genes to the environmental variation in temperate forests are more sensitive than those in subtropical forests, thereby providing a theoretical foundation for further elucidation of the differential regulatory roles of these genes in different forest biomes.

1. Introduction

Phosphorus (P) is an essential macronutrient in forest biomes [1,2], which performs vital roles in plant growth and a diverse range of other metabolic processes [3]. However, the availability of P in soil solutions for biotic utilization is generally limiting, particularly in old highly weathered tropical forest soils [4,5]. Consequently, the dynamics of soil P can have pronounced effects on plant growth, and ultimately forest productivity [6]. Indeed, the findings of a recent study have indicated that the inclusion of P availability into the earth system models markedly enhances the accuracy of C cycle estimates [7]. Thus, gaining a sufficient understanding of the mechanisms associated with P dynamics remains a high priority.
P functional genes performs predominant roles in P cycling [8,9], with evidence indicating that microbial P cycling processes are mainly mediated by three main microbial gene groups [8,10,11], namely, P starvation response regulation, P uptake and transport, and P solubilization and mineralization genes. Among these, P solubilization and mineralization genes are typically the most common agents mediating the solubilization of mineral-bound inorganic P and mineralization of organic P [11]. The typical gene involved in solubilizing inorganic P is gcd, which coding for quinoprotein glucose dehydrogenase. The genes of phoD and phoA coding for alkaline phosphatase have high capacities to mineralize organic-P compounds [8]. The P uptake and transport genes encode the P uptake and transport system components responsible for microbial P assimilation and immobilization [12,13]. Genes, such as pst and pit, enable microbes to utilize and immobilize P more efficiently, and may compete for soil available P with plants [8,14]. P starvation response regulation genes enable microorganisms to utilize external P sources under P deficient conditions [8]. The genes of phoU, phoR, and phoB are involved in sensing environmental phosphate and controlling the expression of Pho regulon [15].
A notable finding with respect to P dynamics is that the responses of soil microbial genes to P cycling may differ among different forest types. For example, Wu et al. [16] have reported that in a temperate continental monsoon climate, a P solubilization strategy was observed in agricultural soils, whereas a P transporter strategy is more predominated in those areas undergoing reforestation. In this regard, most previous studies have focused on the role of specific genes, such as phoD, acpA, and gcd [17,18], or species of microbial phyla [19,20], in P cycling under controlled environmental conditions [8,21] or in a single forest type [22,23]. In contrast, given the extensive diversity and complexity of microbial communities and associated functional genes, the responses of microbial functional genes in different natural forest biomes have received comparatively limited attention [24]. Nevertheless, determining the genetic potential of soil microbes in P cycling represents an important step towards gaining a better understanding of the fundamental mechanisms of P biogeochemical processes.
To fill the gaps in our current knowledge regarding microbial P cycling in soil, we adopted a metagenome sequencing approach to investigate how and why soil microbial P cycling genes change along a subtropical–temperate forest transect (23° N–45° N) in China. The findings of the previous study conducted in a similar region (latitudinal transect 18° N–48° N in eastern China) have indicated that genes associated with key biogeochemical cycles, such as P cycling, are regulated to a significant extent by environmental variables that change along typical latitudinal biodiversity gradients [25]. We hypothesized that (1) there is a clear difference in the abundances of P functional genes between temperate and subtropical zones, and (2) that there are differences between temperate and subtropical zones with respect to the key drivers regulating soil microbial P functional genes. Consequently, we specifically sought (1) to investigate the abundance of P solubilization and mineralization, P uptake and transport, and P starvation response regulation genes in subtropical and temperate forest biomes, and (2) to determine those factors driving the regulation of microbial genetic potential for soil P cycling in these biomes.

2. Material and Methods

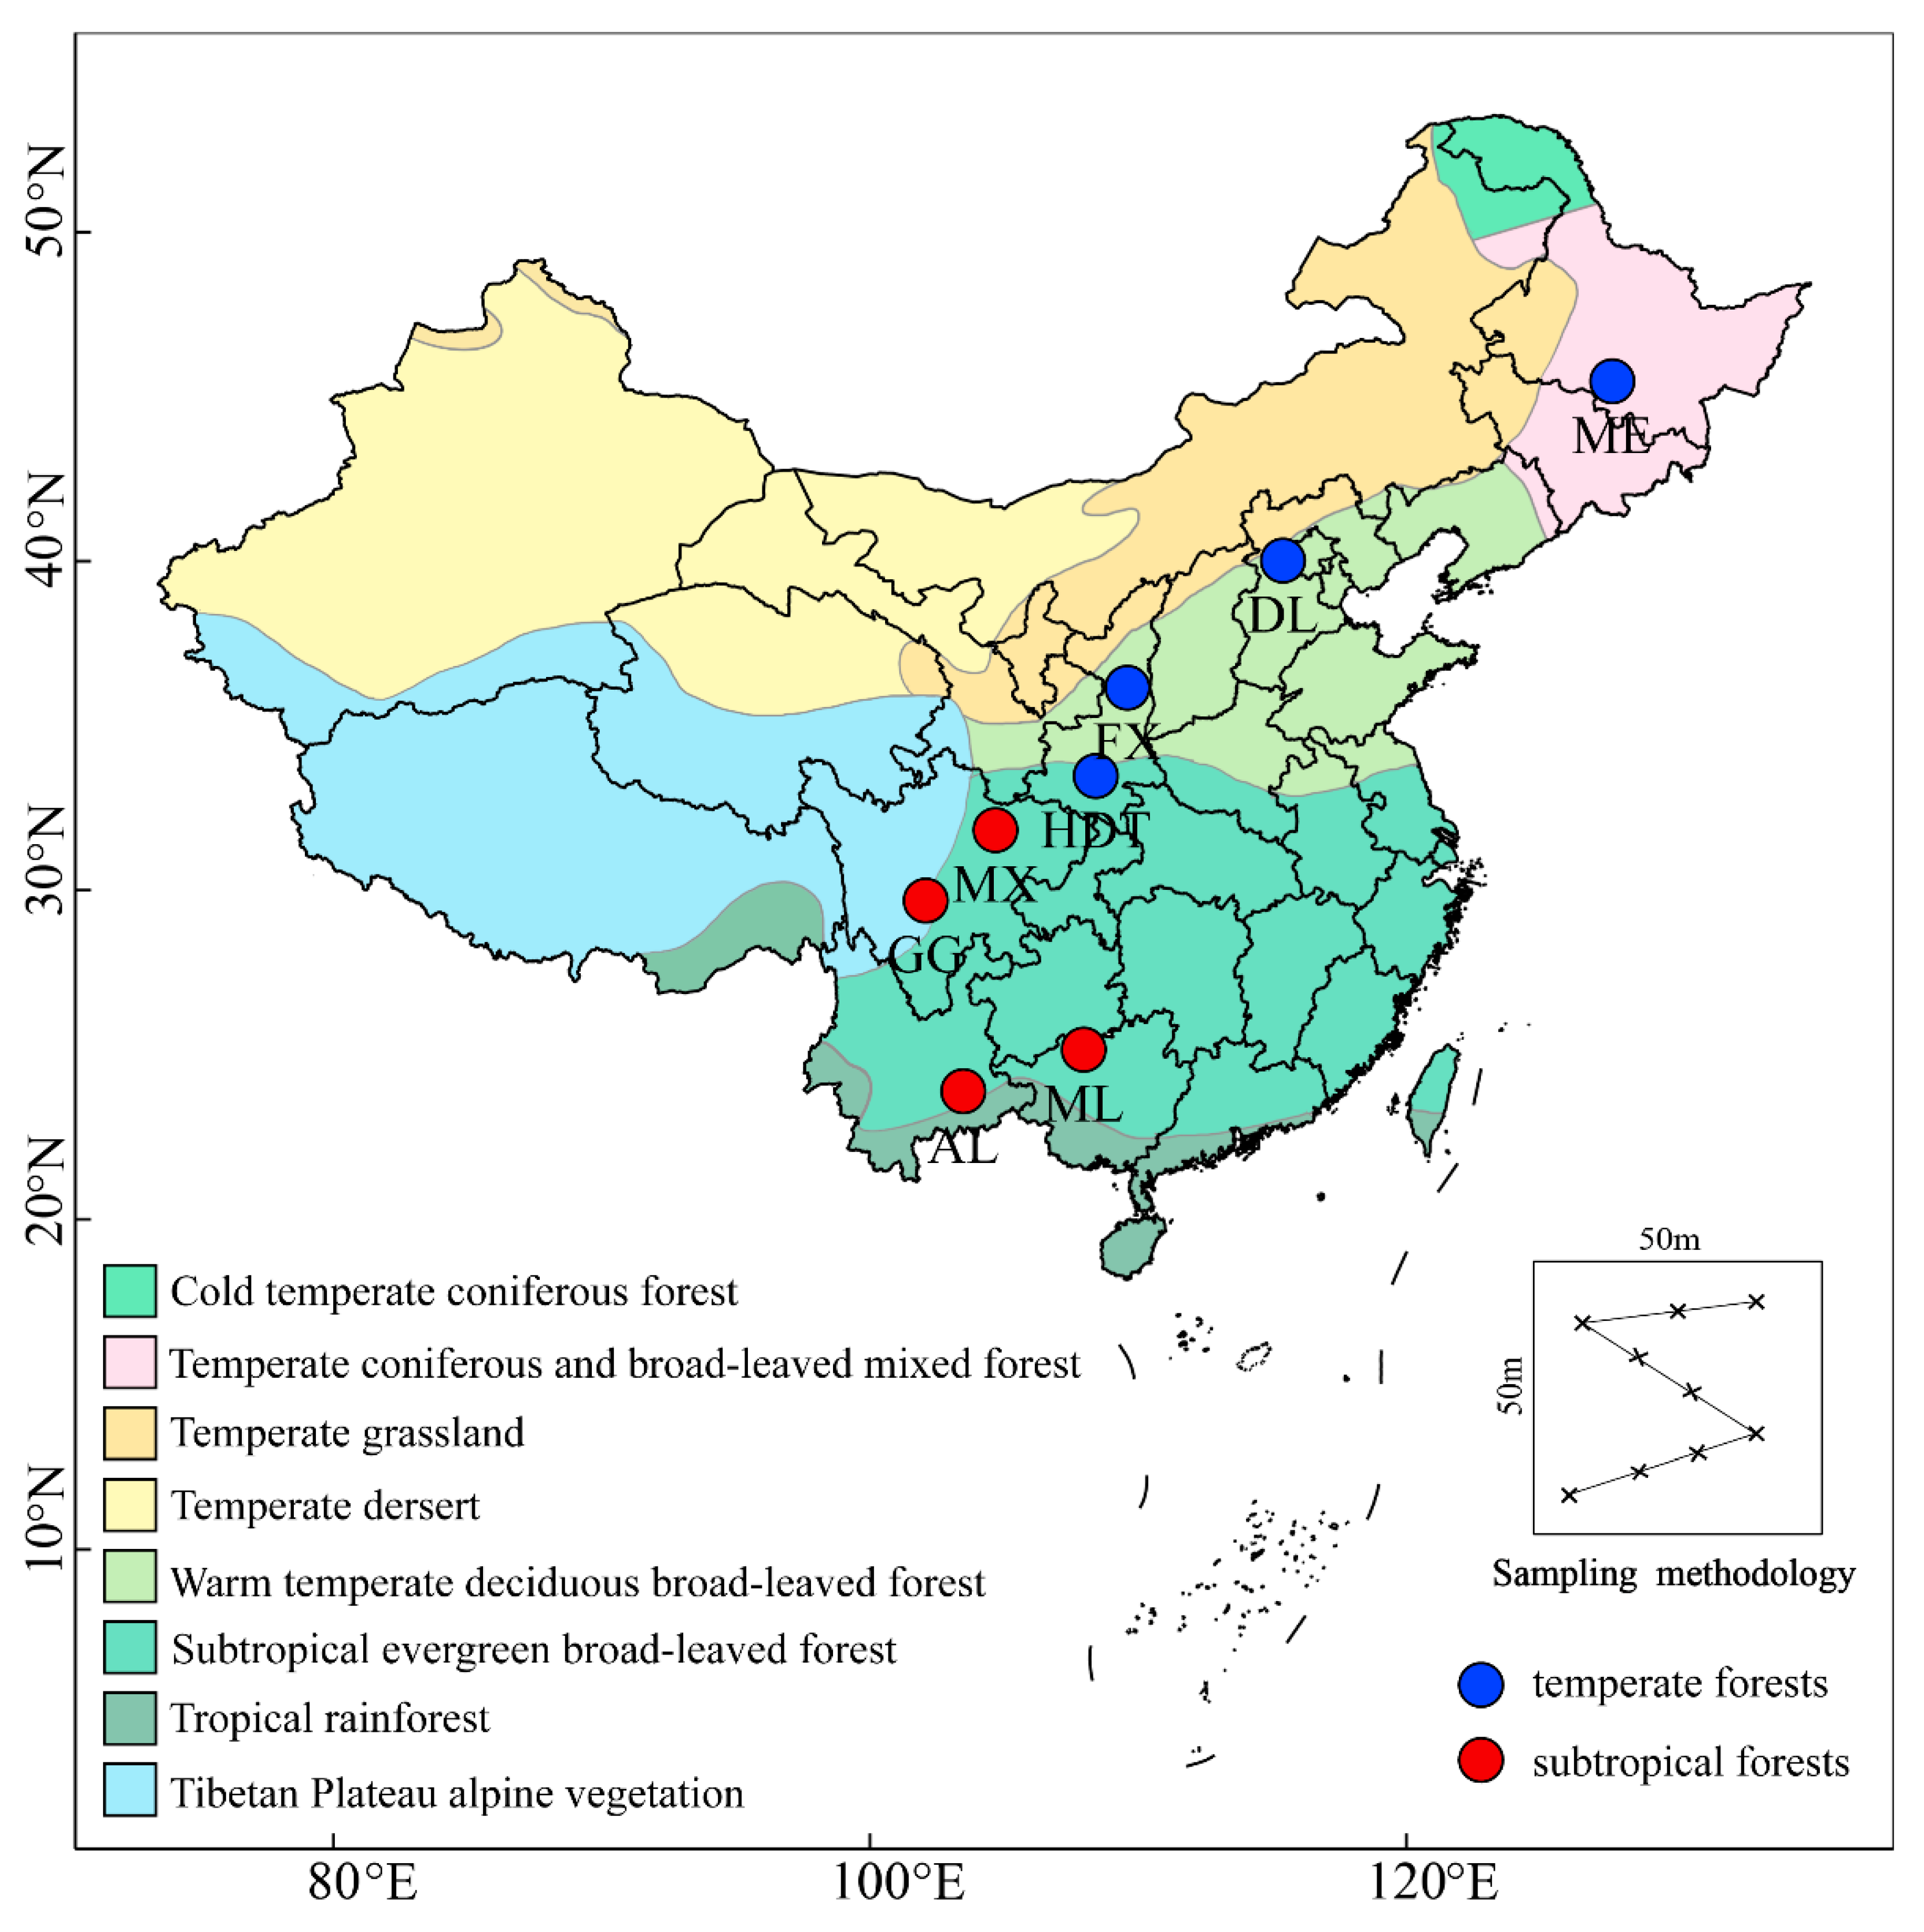
2.1. Sites and Soil Sampling

For the purposes of this study, we selected eight sites in relatively undisturbed forest biomes, running along a latitudinal gradient (23°87′–45°41′ N, 102°11′–127°71′ E) in China (Figure 1). Among these sites, those on Mount Maoer (ME) and Mount Dongling (DL) and in Fuxian (FX) and Huoditang (HDT) are located in a temperate zone, whereas those on Mounts Maoxian (MX), Gongga (GG), and Ailao (AL), and at Karst Mulun Station (ML) lie in a subtropical zone (Figure 1). For each site, we obtained relevant geographical (latitude, longitude, and elevation) and climatic (mean annual precipitation (MAP) and mean annual temperature (MAT)) information, the details of which are presented in Table S1.
In July and August 2019, we collected soil samples at selected sites in well-protected national nature reserves. For each of the eight assessed forests, we established three 50 m × 50 m sampling plots, each of which was further divided into nine subplots along an “S”-shaped route (Figure 1). Having initially removed the soil organic layer, we excavated soil cores to a depth of 10 cm from each subplot, and these nine cores were subsequently pooled to give a single composite sample for each of the three main plots. All samples were initially sieved through a 2-mm mesh to remove root and plant debris, and thereafter separated into two parts, one of which was stored in a freezer at −80 °C for subsequent DNA and RNA extraction, and the other was air-dried for soil physicochemical analyses.

2.2. Soil Physicochemical Analyses

Soil pH was measured using a PHS-3C pH meter (Shanghai Precision & Scientific Instrument, Shanghai, China), initially having homogenized a soil sample to yield a saturated colloid [26]. Soil bulk density (BD) was determined using the cutting ring method (100 cm3), and soil texture (i.e., sand, silt, and clay contents) was analyzed using a hydrometer [27]. The contents of soil organic carbon (SOC), total nitrogen (TN), and total phosphorus (TP) were determined following the procedures described by Zhang et al. [26]. Soil available phosphorus (AP) was extracted with NH4F-HCl solution and measured using a colorimetric method [28]. Details of the soil characteristics ascertained for all sites are presented in Table S1.

2.3. Microbial Community Analysis

For the purposes of shotgun metagenomic sequencing, we extracted DNA from soil samples (six replicate extractions for soil collected from each site). Aliquots (0.5 g) of fresh soil samples were used to extract soil DNA in triplicate using a FastDNA SPIN kit (MP Bio-medicals, Solon, OH, USA) following the manufacturer’s recommended protocol, with the quality and integrity of the extracted DNA being determined using a NanoDrop 2000 spectrophotometer [29]. Metagenome libraries were sequenced using an Illumina HiSeq 2000 sequencer, thereby generating a 150-bp paired-end reads at a high sequencing depth. Having removed reads that were aligned to the human genome, the lengths were trimmed using Sickle. All DNA sequencing can be found on the National Center for Biotechnology Information (NCBI) website.
Microbial (bacterial and fungal) abundances were determined based on real-time PCR analyses of bacterial 16S rRNA and fungal ITS-1 genes, using previously described methods [30]. Bacterial 16S rRNA and fungal ITS-1 copy numbers were quantified using Bio-Rad CFX Manager Software, and bacterial and fungal abundances were expressed in terms of log10 copy number·g−1 [31]. The ratio of fungal to bacterial abundance is hereafter denoted as F:B. Microbial alpha diversity (α-diversity, represented by Shannon index) and beta diversity (β-diversity, represented by the bray-distance) values were determined and calculated as previously described by Ren et al. [32]. Details pertaining to the microbial communities are shown in Table S1.

2.4. Metagenomics Analysis

The generated sequencing reads were initially filtered by removing the sequencing adapters and trimming the reads. Furthermore, to improve the reliability and quality of the subsequent analyses, we discarded low-quality trimmed reads of less than 50 bp in length or those containing N (ambiguous) bases [33]. The quality controlled-passed reads obtained for each sample were co-assembled using Megahit software v1.1.2 (https://hku-bal.github.io/megabox/, accessed on 8 August 2020) [34], thereby generating a database of larger contigs and scaffolds (see Supplementary Table S2 for assembly statistics). Gene prediction was performed by calling genes on each assembled contig (longer than 200 bp) using MetaGeneMark (http://exon.gatech.edu/GeneMark/metagenome, accessed on 8 August 2020), and calculating the per-base coverage depth across all contigs by mapping raw reads from each sample. For the purposes of further analysis, functional annotation and taxonomic assignment for each sample were performed with reference to the KEGG database, the details of which are presented Tables S3 and S4.

2.5. Statistical Analysis

For each of the eight assessed forest biomes, having initially ascertained the normality of residues and homogeneity of variance, data obtained for the abundance of P cycling genes, abundance of key phyla groups, soil physiochemical properties, and microbial communities were analyzed using a one-way variance (ANOVA) with LSD (L) and Duncan (D) tests. To identify the relative importance of the potential pathways and drivers mediating P functional genes in the temperate and subtropical forest biomes, we conducted partial least squares pathway modeling (PLS-PM). The PLS-PM approach was selected as this is based on a series of ordinary least square regressions, and consequently, has minimal dependence on sample size, a characteristic that was deemed necessary in this study. In this model, we included climate as an exogenous variable; soil environment, microbial community, and soil substrates were designated endogenous variables; and P functional genes were considered the response variable. MAT and MAP were used to represent climatic factors; additionally, pH, sand, silt, and clay contents, and BD were used to reflect the soil environment. Soil substrates included SOC, TN, TP, AP, C:N ratio, C:P ratio, and N:P ratio, and for microbial community, we included fungal abundance, bacterial abundance, F:B ratio, microbial α-diversity, and β-diversity. The internal factor collinearity within blocks was removed by controlling the variance inflation factor to <3. In each block, variables with load coefficients <0.7 were gradually removed based on the model application results. The overall quality of the model was assessed based goodness of fit coefficient (GoF) assessment [35]. The optimal explanatory variables used in the PLS-PM analysis were as follows: climate (MAT, MAP), soil environment (BD, pH), soil substrates (SOC, N:P ratio), and microbial community (α-diversity). After PLS-PM analysis, the predominant factors of each group were identified, then we performed variation partitioning analysis (VPA) to quantify the effects of each group of factors on the P functional genes across the temperate and subtropical forest biomes. A negative value in the variance explained for a group of factors was interpreted as zero, which indicated that the explanatory variables explained less variation than random normal variables. All the analyses were conducted using R statistical software v.4.0.2 by Robert Gentleman and Ross Ihaka (Auckland, New Zealand).

3. Results

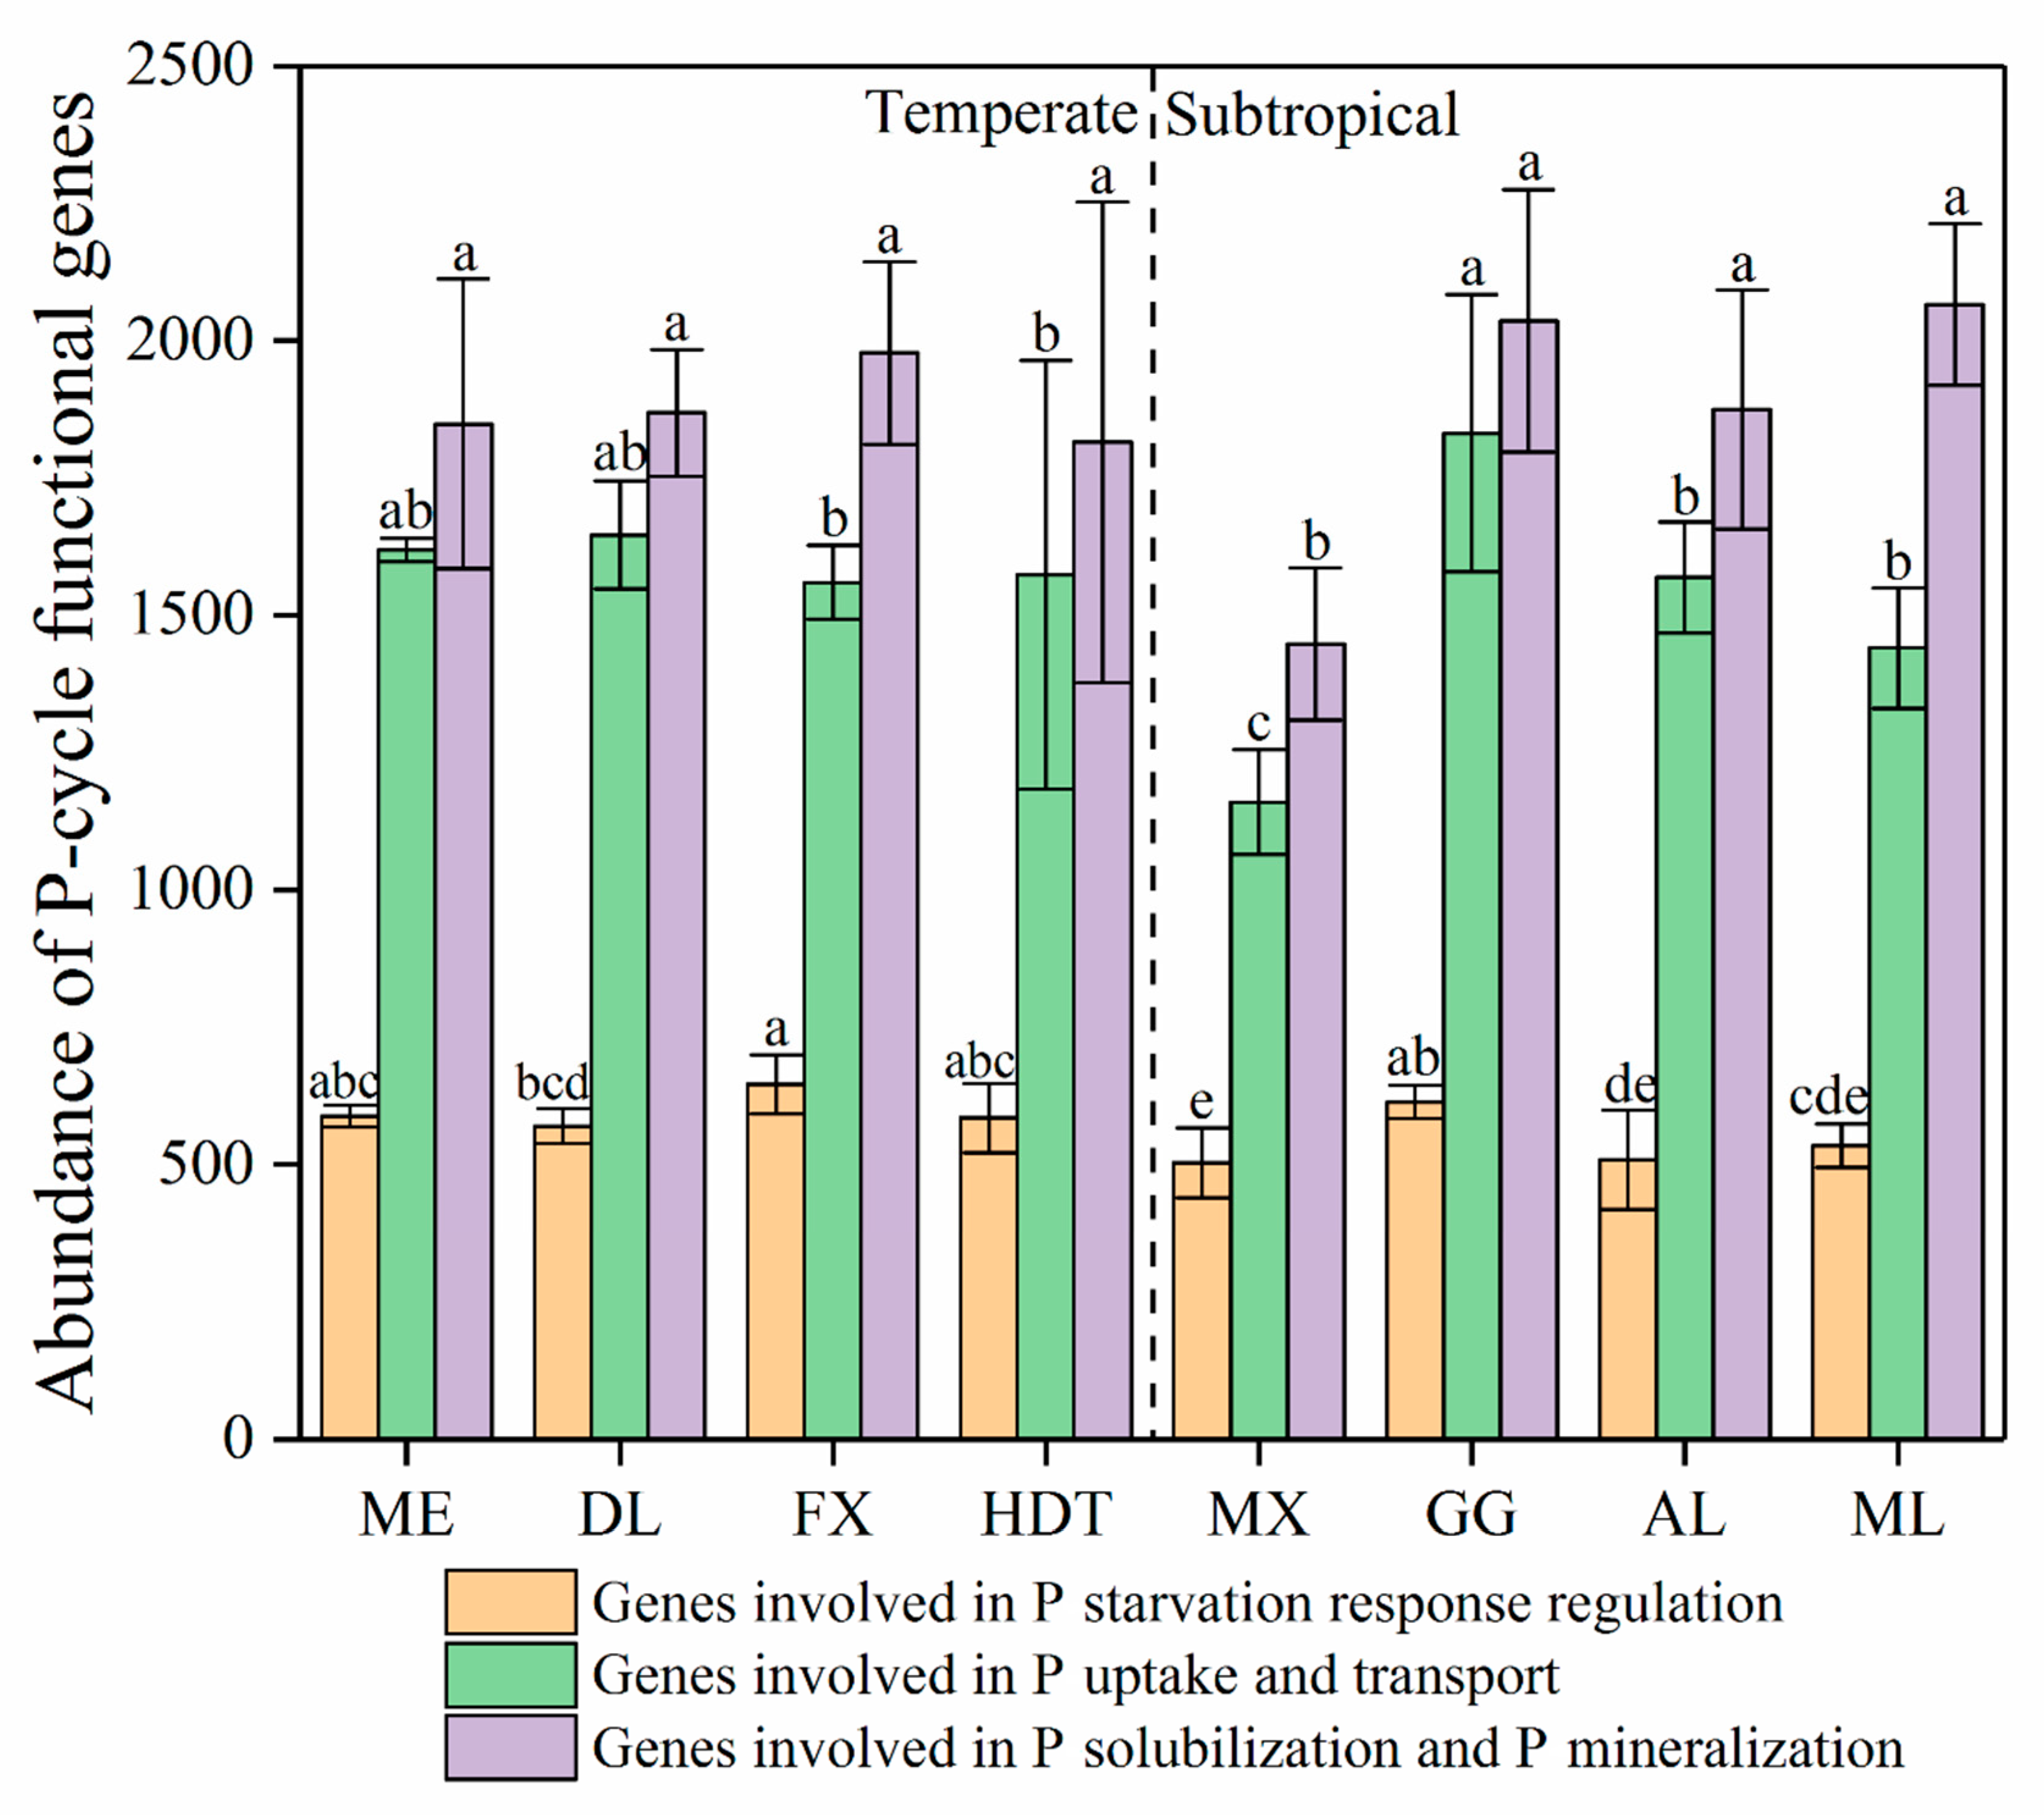
3.1. P Functional Genes in Temperate and Subtropical Zones

Our analyses of P functional genes revealed significant differences among forest biomes with respect to the abundance of P solubilization and mineralization, P uptake and transport, and P starvation response regulation genes (p < 0.05) (Figure 2, Table S4). Overall, we established the total abundance of P functional genes in temperate forests was 4.57% higher than that in subtropical forests (p > 0.05, Figure 2, Table S5). There is generally no significant difference in abundance of genes involved in P solubilization and mineralization and P uptake and transport between temperate and subtropical zones (p > 0.05, Figure 2, Table S5), but the average abundance of genes involved in P starvation response regulation in temperate regions was found to be 10.54% higher than that in subtropical regions (p < 0.05, Figure 2, Table S5). In addition, compared with other microbial phyla, we detected higher abundances of P cycle genes in Acidobacteria, Actinobacteria, Proteobacteria, and Verrucomicrobia (Table 1 and Table S6), whereas the abundances of genes involved in P solubilization and mineralization in Acidobacteria and the genes involved in P starvation response regulation in Proteobacteria were 37.97% and 30.32% higher in the subtropical zone than in the temperate zone, respectively (p < 0.05, Table 1). Furthermore, we also found dominate species of Acidobacteria and Proteobacteria at genus level were higher in subtropical zones than that of temperate zones in most of case (Table 2). For instance, the abundance of Candidatus Solibacter and Terriglobus (belong to Acidobacteria) encoding P solubilization and mineralization genes were higher 91.68% and 144.83% in subtropical zones than temperate zones, respectively (Table 2). The abundance of Bradyrhizobium (belong to Proteobacteria) encoding P starvation response regulation genes, P uptake and transport genes, and P solubilization and mineralization genes were higher 151.51%, 108.07%, and 98.80% in subtropical forests than temperate forest biomes, respectively (Table 2).

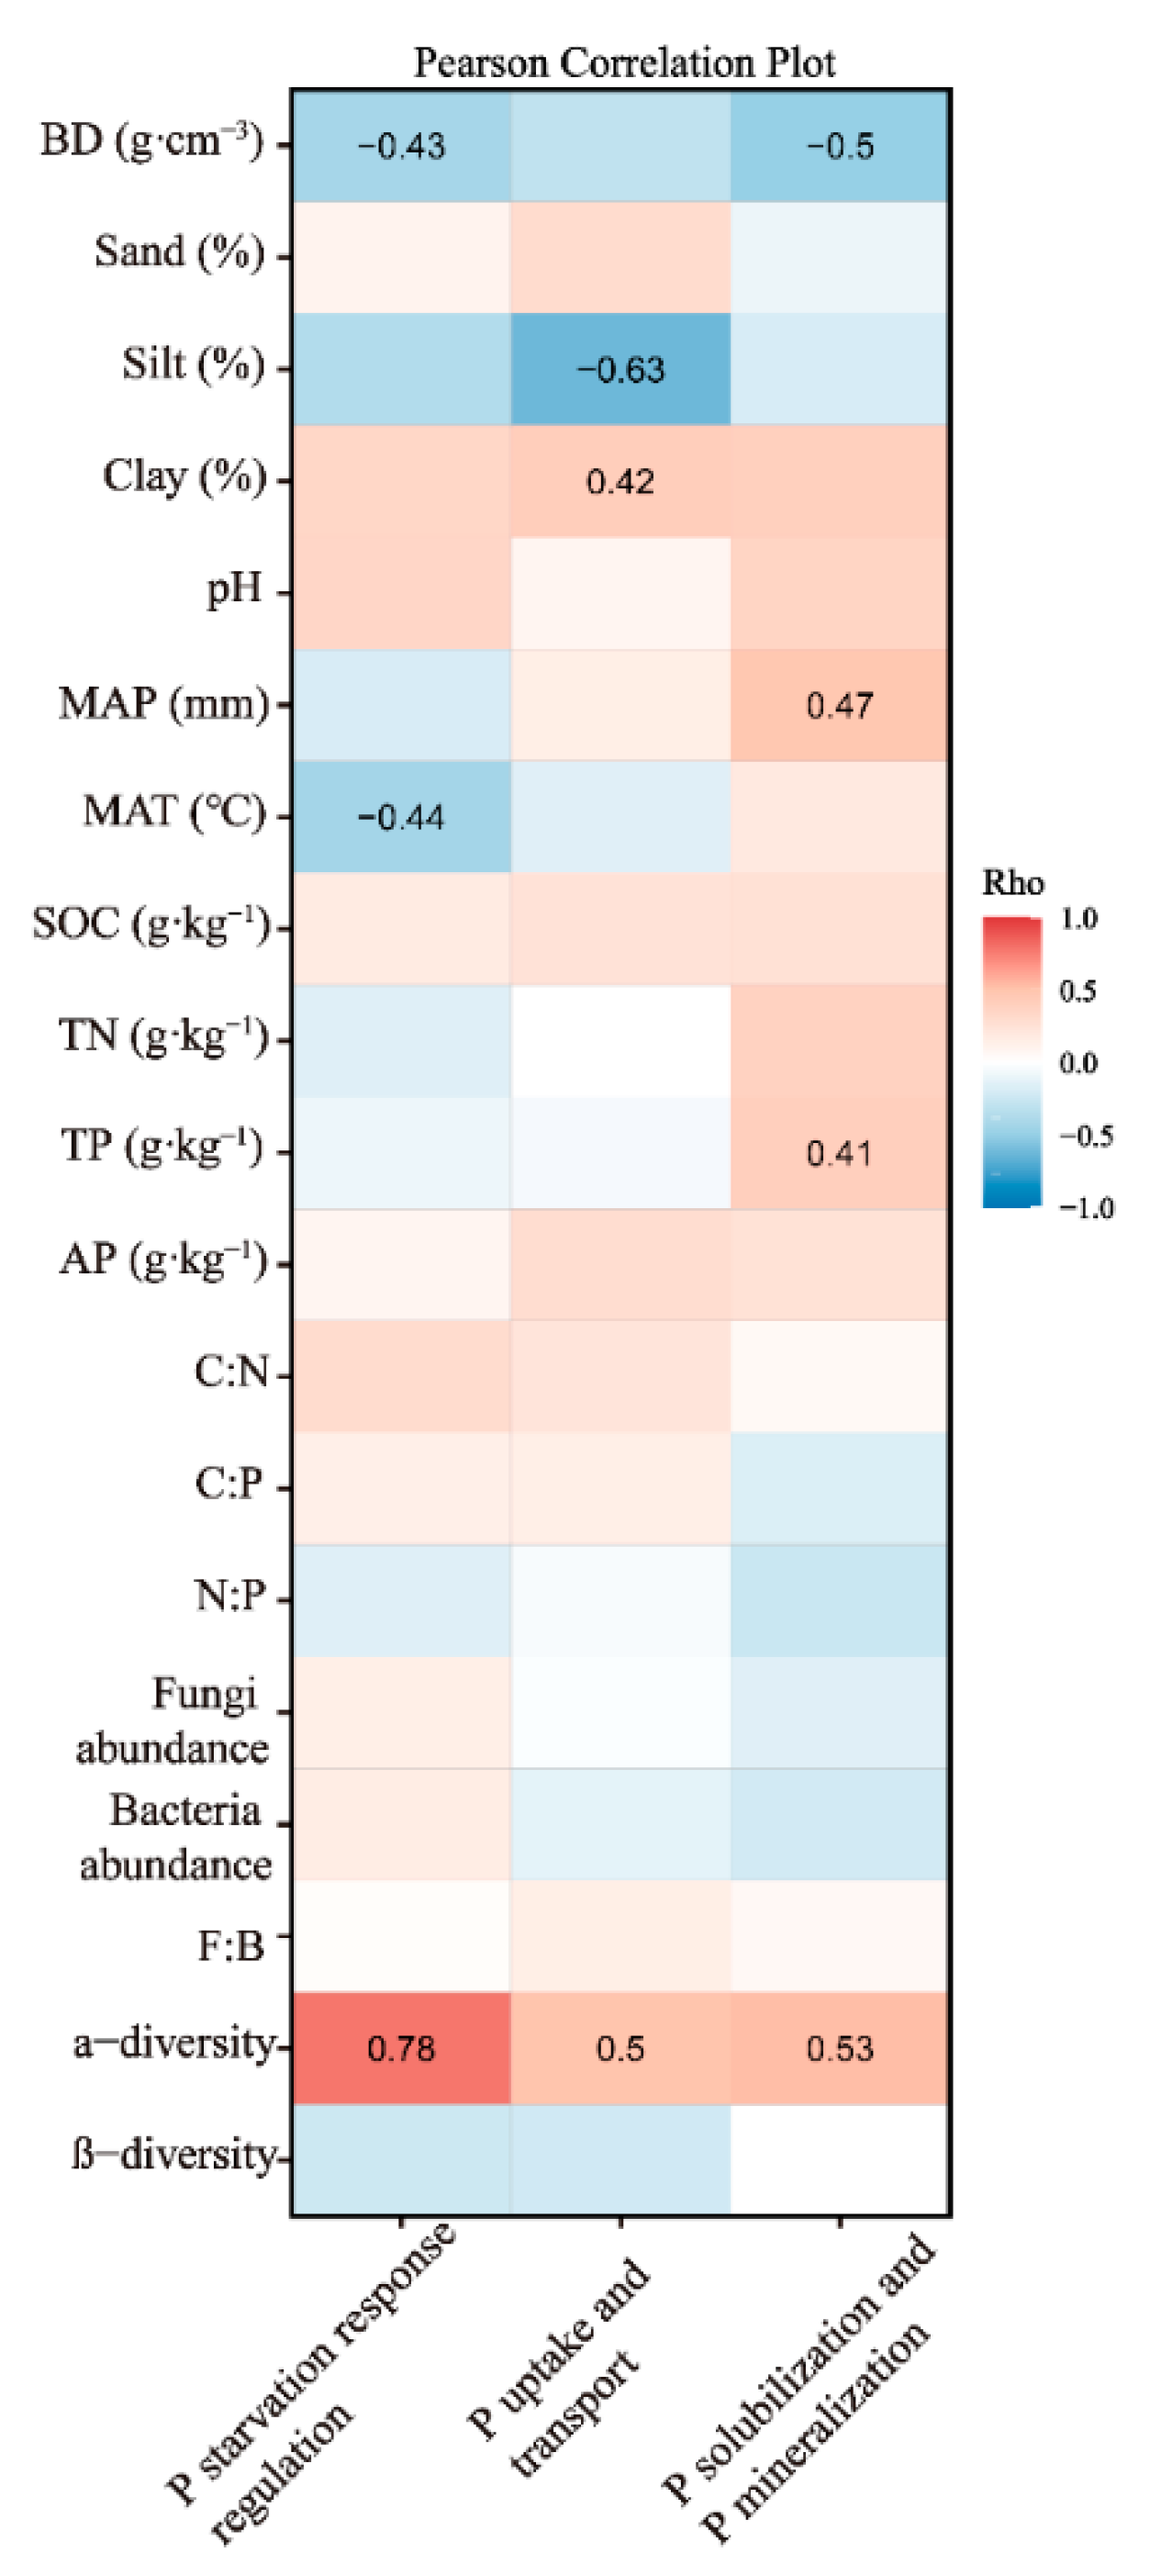
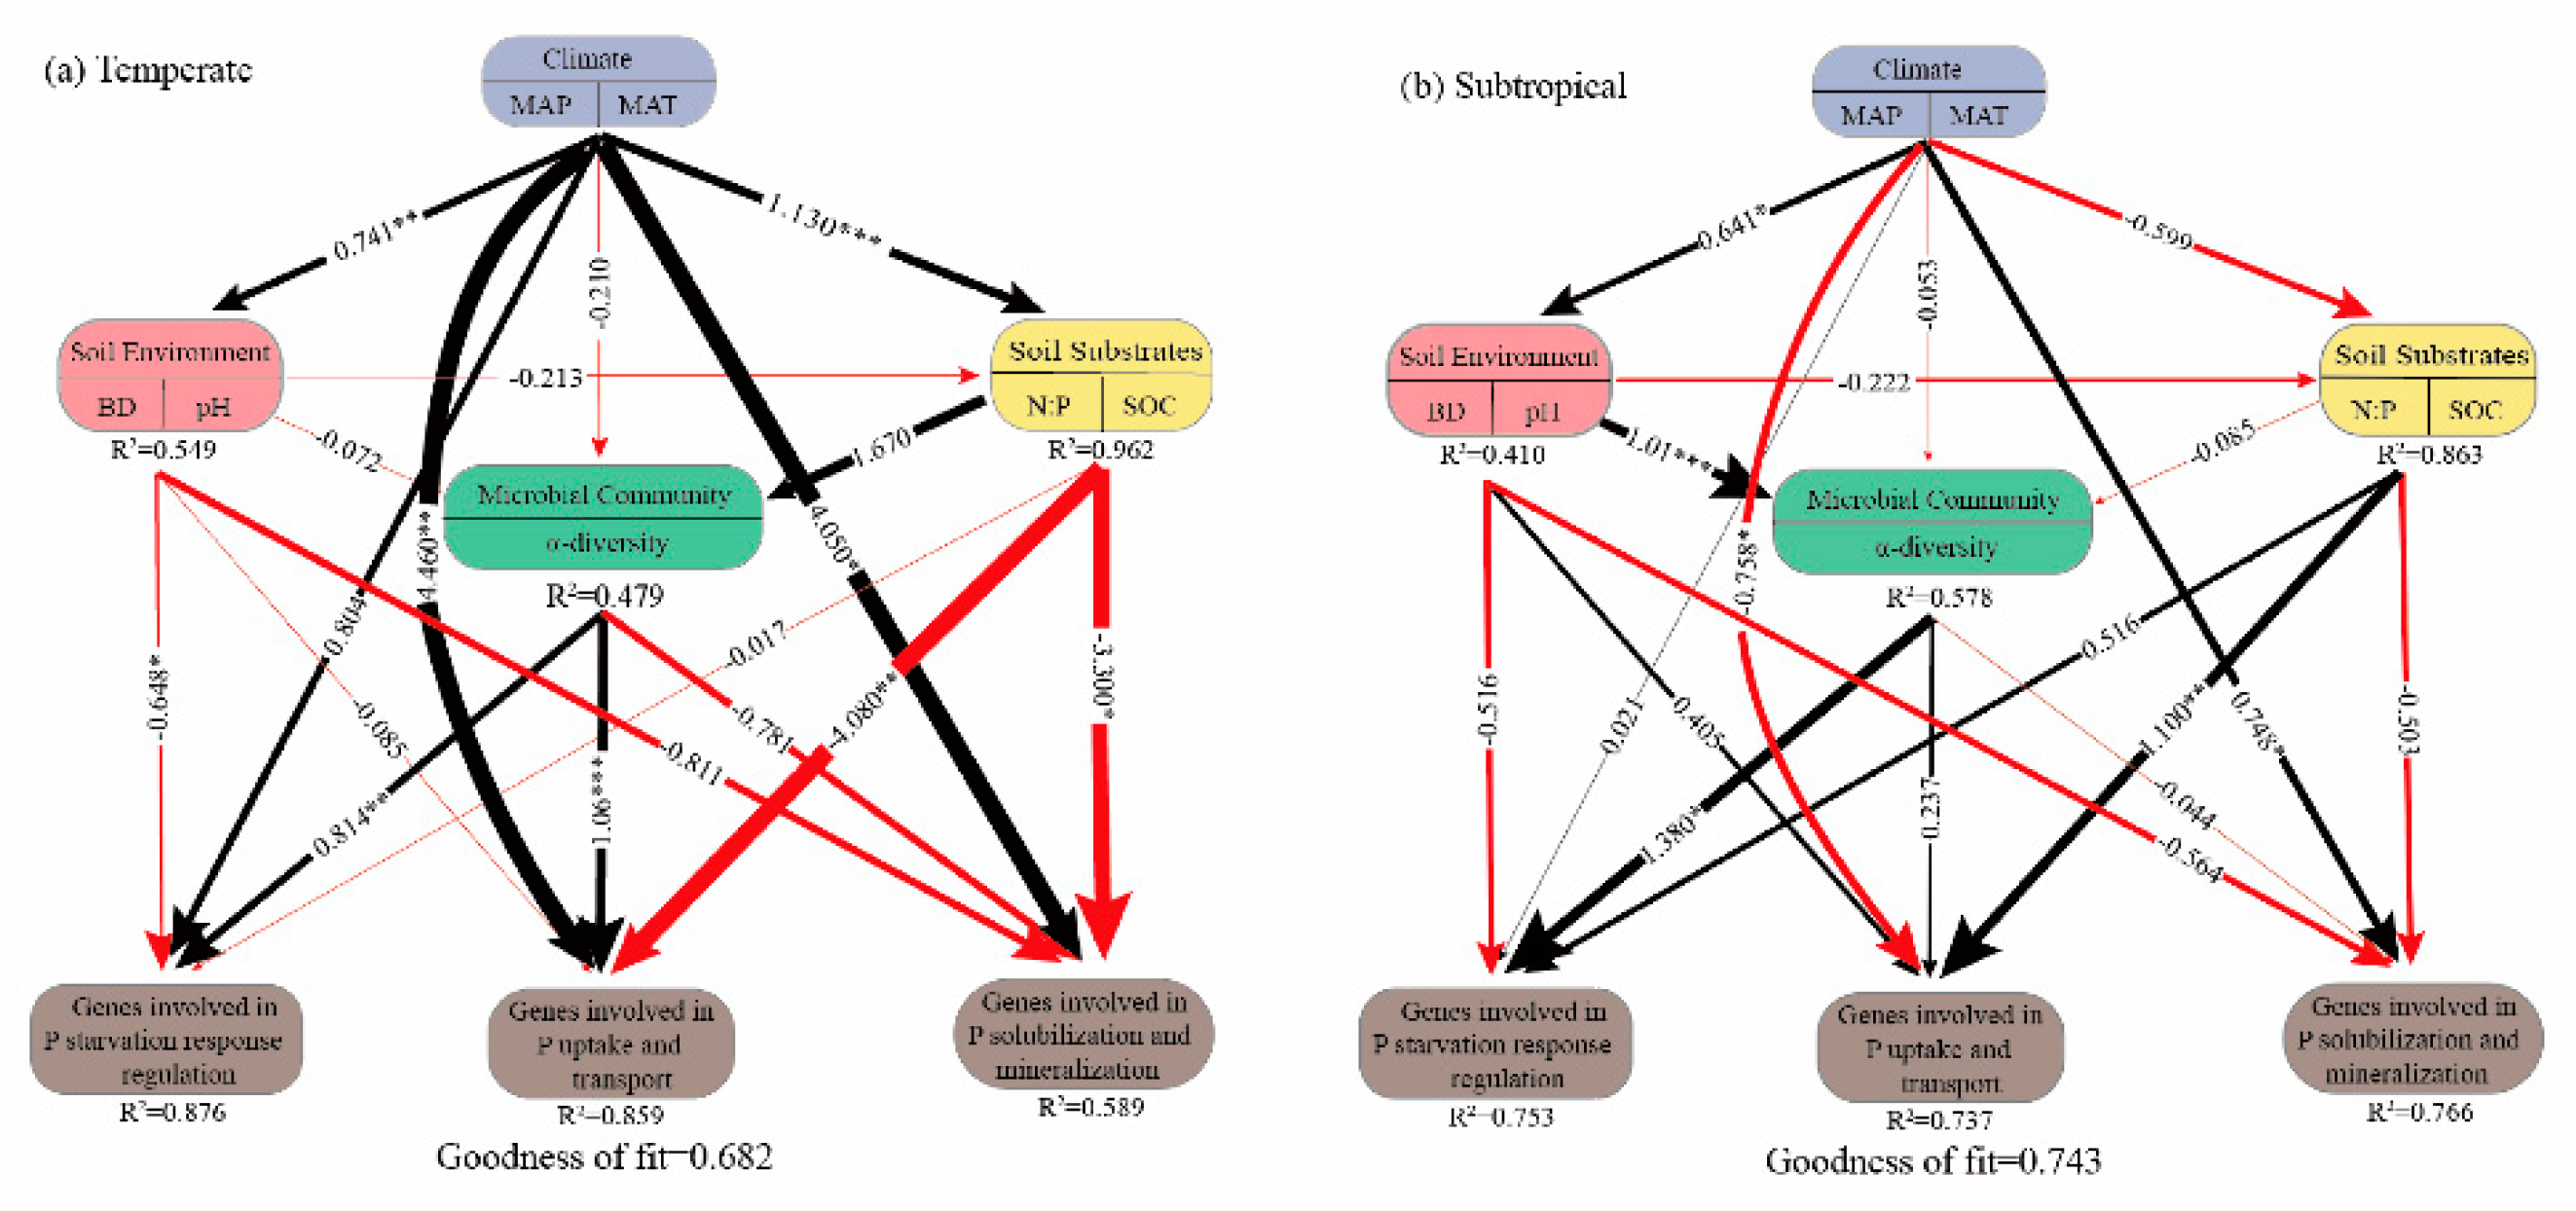
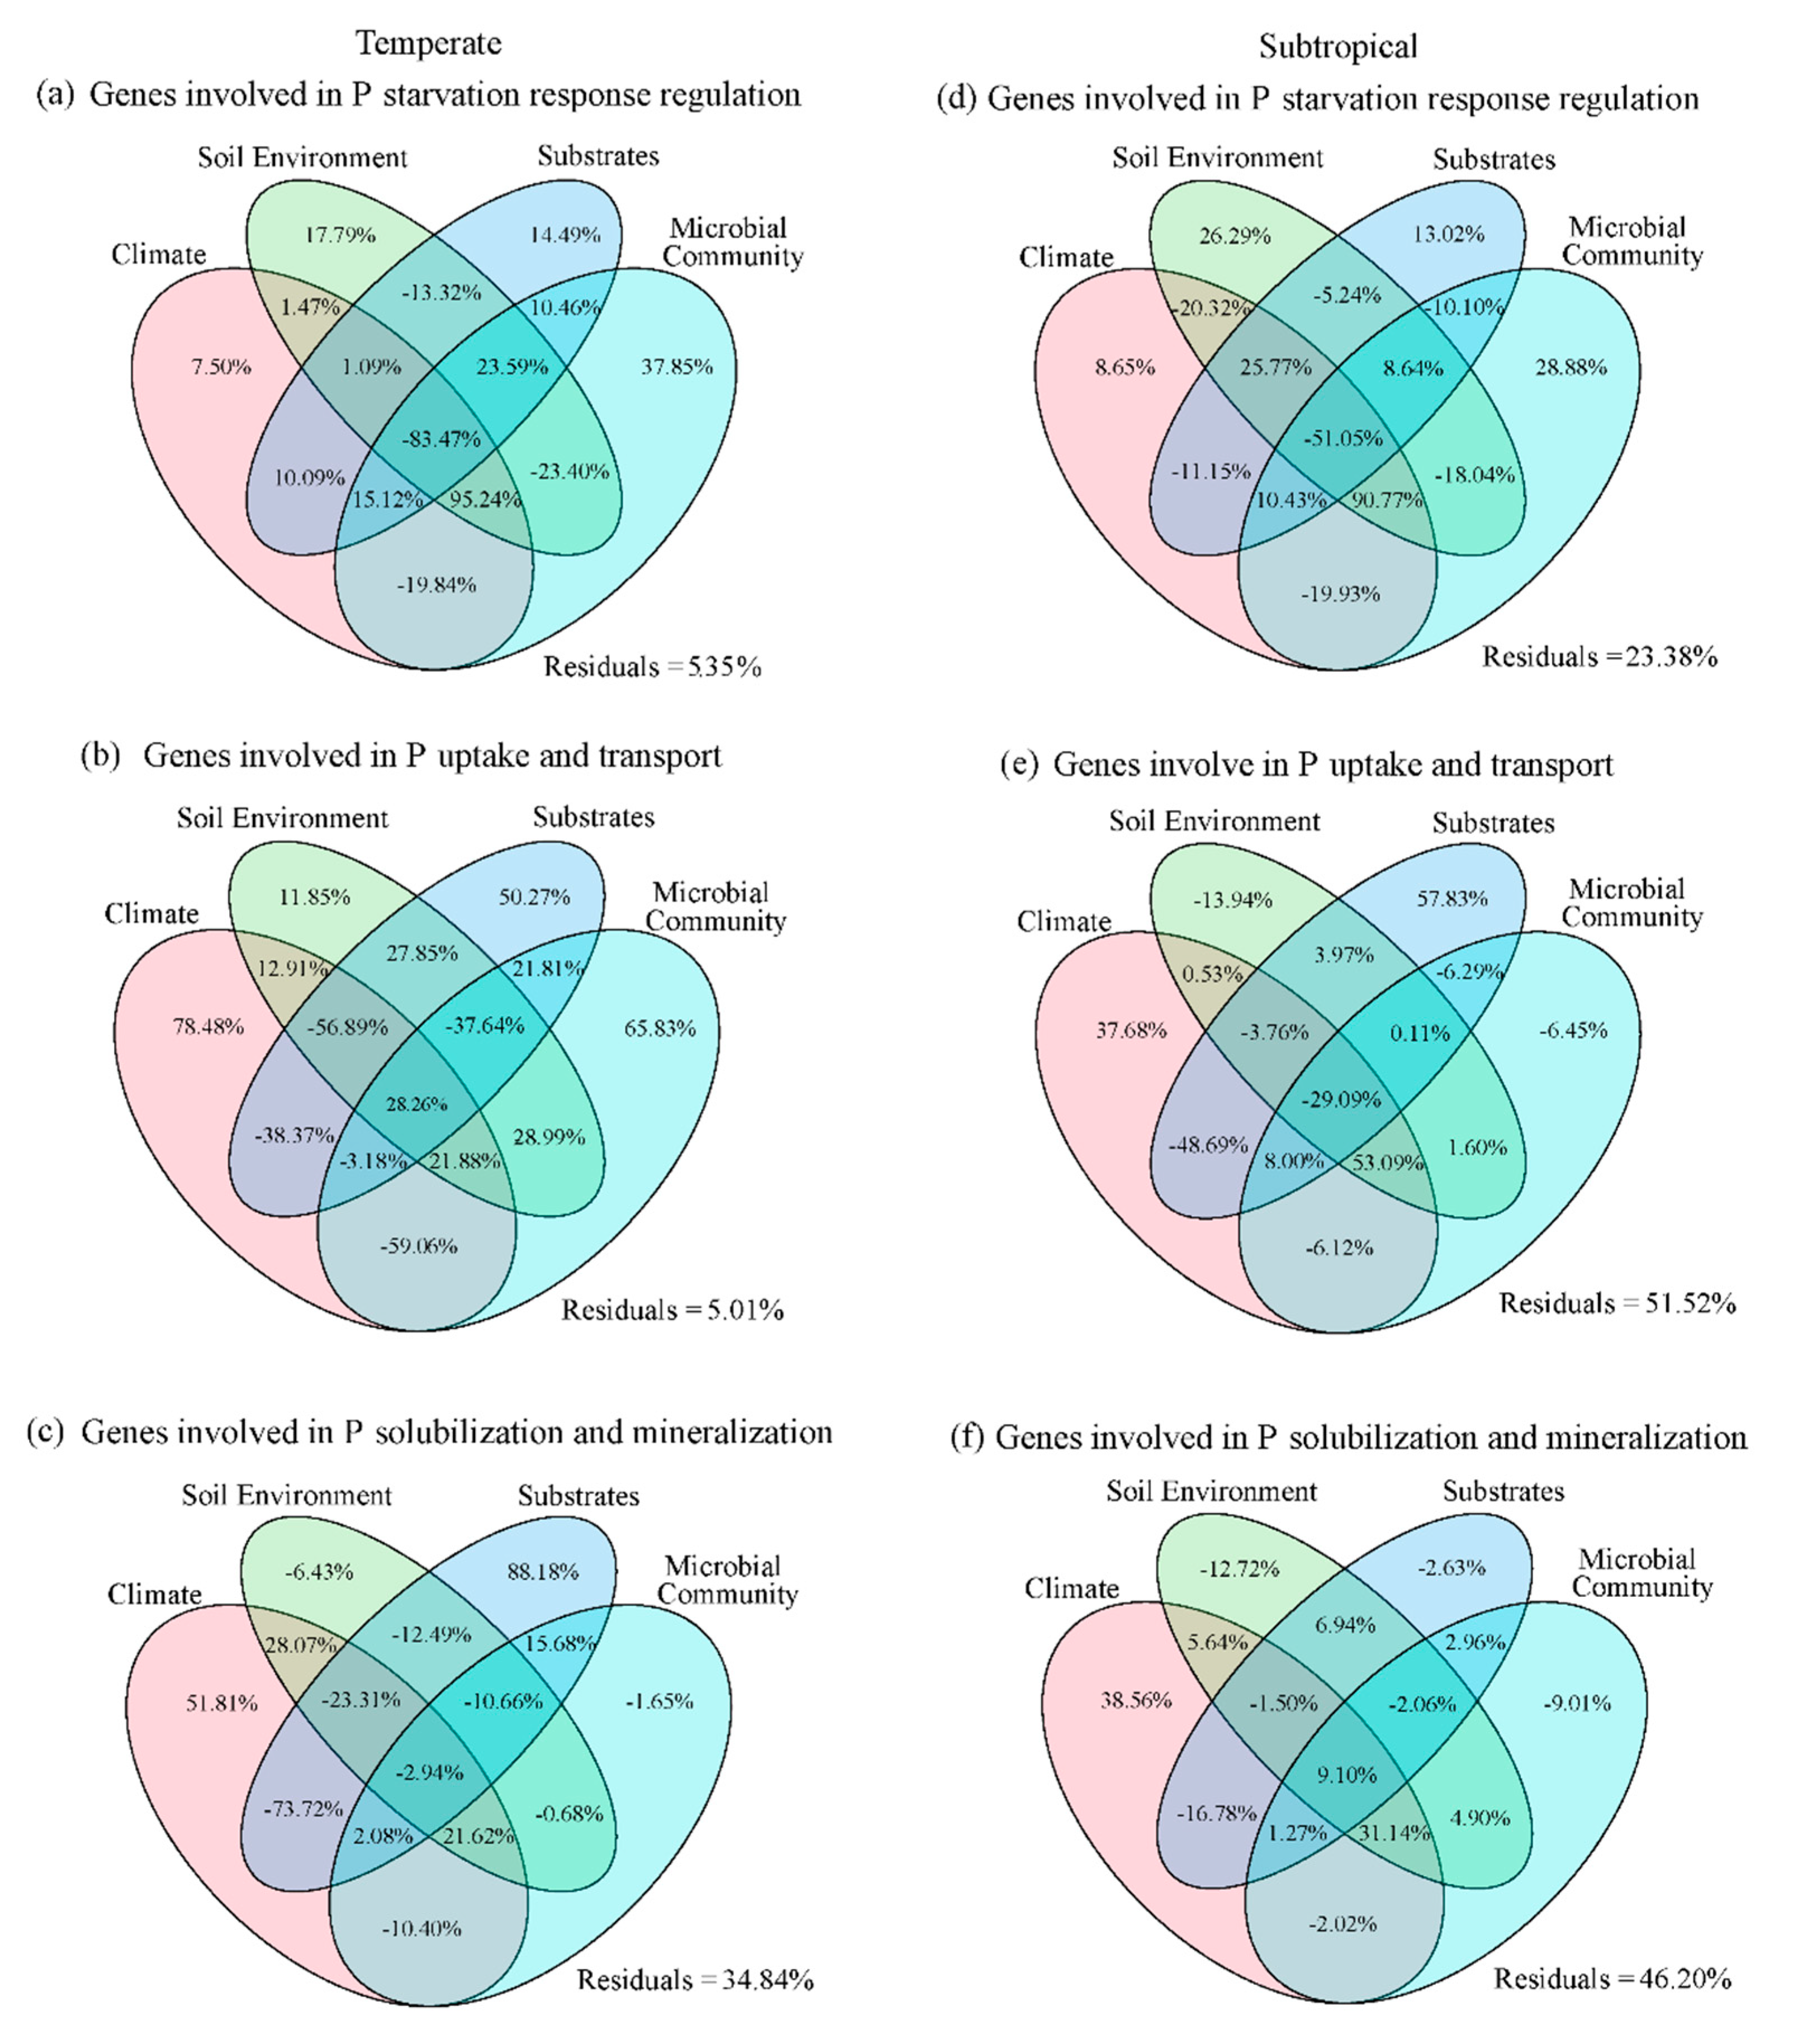
3.2. Factors Influencing P Functional Genes in the Temperate and Subtropical Zones

Our results showed that significant correlation was found between P functional genes and microbial α-diversity as a whole (Figure 3). However, different patterns were also found in grouped P functional genes, for example, significant correlation was found between P starvation response regulation genes and BD and MTA, while P uptake and transport genes correlated with silt and clay, and P solubilization and mineralization genes correlated with BD, MAP and TP (Figure 3). Additionally, PLS-PM revealed the predominant roles of climate, soil environment and substrates, and microbial community in determining the abundances of P functional genes (P starvation response regulation, P uptake and transport, and P solubilization and mineralization) in temperate and subtropical forests (Figure 4). In the cases of temperate forests, we found that the abundances of genes involved in P starvation response regulation were significantly positively correlated with microbial community (α-diversity) (p < 0.01), and significantly negatively correlated with soil environment (BD, pH) (p < 0.05, Figure 4a). Moreover, genes involved in P uptake and transport were most strongly positively affected by microbial community (p < 0.001), followed by climate (MAT, MAP) (p < 0.01), and were negatively affected by soil substrates (SOC, N:P ratio) (p < 0.01, Figure 4a). Comparatively, genes involved in P solubilization and mineralization were negatively correlated with soil substrates, and positively correlated with climate (p < 0.05, Figure 4a). In subtropical forest biomes, genes involved in P starvation response regulation showed significant positive association only with microbial community (p < 0.05, Figure 4b), whereas genes involved in P uptake and transport were significantly positively correlated with soil substrates (p < 0.01) and significantly negatively related to climate (p < 0.05, Figure 4b), and genes involved in P solubilization and mineralization were significantly positively affected only by climate (p < 0.05, Figure 4b).
VPA indicated that climate, soil environment and substrates, and microbial community explained 94.65%, 94.99%, and 65.16% of the variation in genes involved in P starvation response regulation, P uptake and transport, and P solubilization and mineralization across temperate forest biomes, respectively, and corresponding percentages of 76.62%, 48.48%, and 53.80% of the variations in these genes in subtropical forest biomes (Figure 5). In temperate forest biomes, microbial community was the most important diver, explaining 37.85% of the variation in genes involved in P starvation response regulation, followed by soil environment (17.79%) (Figure 5a). In contrast, genes involved in P uptake and transport were predominately influenced by climate (78.48%), and to a lesser extent by microbial community (65.83%) and soil substrates (50.27%) (Figure 5b), whereas genes involved in P solubilization and mineralization were primarily controlled by soil substrates (88.18%), followed by climate (51.81%) (Figure 5c). Comparatively, in subtropical forest biomes, microbial community explained 28.88% of the variations in genes involved in P starvation response regulation (Figure 5d), whereas soil substrates and climate explained 57.83% and 37.68% of the variations in P uptake and transport genes, respectively (Figure 5e), and 38.56% of the variations in P solubilization and mineralization genes was explained by climate (Figure 5f).

4. Discussion

4.1. P Functional Genes in Temperate and Subtropical Zones

Our results show that the abundances of P solubilization and mineralization genes, P uptake and transport genes, and P starvation response regulation genes significantly differs between forest biomes (Figure 2, Table S4). This is consistent with the findings of previous study that have indicated that the relative abundances of functional genes associated with P cycling differ significantly among forest types [36]. In this regard, it can be speculated that vegetation type has a pronounced influence on the structure of soil microbial communities [37], which in turn contributes to determining differences in P functional gene abundance [4] and soil P cycling potential [38] among forest types. However, it was beyond our expectation that, in contrast to the other two P functional gene groups, we found that the abundances of P starvation response regulation genes were significantly higher in temperate forests than in those of the subtropics (Figure 2, Table S5). We suspect this could be attributable to soil P availability, given that this has a pronounced influence on the abundance of P starvation response regulation genes, such as phoR and phoB [11,36]. Under low AP conditions, microorganisms obtain P by regulating those genes involved in P starvation response regulation, thereby enhancing the release of P, which thus contributes to the efficient utilization of alternative P sources [10]. Consistent with this assumption, we established that the AP fraction in temperate forest soils was significantly lower than that in soils characteristic of subtropical forest biomes (Table S1), thereby determining the higher abundance of microbial P starvation response regulation genes in temperate forest biomes. In this regard, it is conceivable that the low P concentrations detected in temperate forest soils are attributable to an unfavorable pH for facilitating P solubility and availability [39]. In low pH (<5) acidic soils, a majority of the P content is fixed within insoluble precipitates by Fe3+ and Al3+ [40], whereas in high pH (>7) alkaline soils, it is fixed by tricalcium ions, which limits availability for the biotic community [41]. Among the temperate soils analyzed in the present study, it is assumed that unfavorable pH values obtained for three of the sites examined (5.02, 6.9, and 8.1 for sites ME, DL, and FX, respectively) would be more likely to limit P availability compared with those soil in subtropical forests, for which the measured pH values were found to lie between 5.6 and 6.7 (Table S1).
Furthermore, we found that taxonomic assignments of genes highlighted the importance of microbes in the phyla Acidobacteria, Actinobacteria, Proteobacteria, and Verrucomicrobia with respect to soil microbial P turnover in both temperate and subtropical forest soils (Table 1 and Table S6), which is consistent with the findings of the previous study indicating that similar genes are frequently detected in the taxa of these four phyla in the forest soils [10]. It has also been established that the genomes of multiple species in a number of bacterial phyla, including Acidobacteria and Actinobacteria contain genes related to P acquisition in low-P soils [25,42]. For example, Acidobacteria have been found to harbor P solubilization and mineralization genes encoding quinoprotein glucose dehydrogenase (PQQGDH) and P uptake and transport genes encoding Pst transporter [10]. Similarly, we found that within the Acidobacteria dominant genus harbored higher abundance of P solubilization and mineralization genes than other genes in both temperature and subtropical forests, especially the genus of Candidatus Solibacter and Terriglobus (Table 2). Bacteria within the Proteobacteria orders Pseudomonadales and Rhizobiales have been characterized as efficient P solubilizers that have the capacity to access smaller and less recalcitrant pool of P in soils [42] on account of their suite of P mineralization and solubilization genes [43]. Consistent with this finding, the identified Bradyrhizobium genus, the branches of Rhizobiales contained higher abundance P solubilization and mineralization genes and P uptake and transport genes (Table 2). Moreover, the higher abundance of Acidobacteria and Proteobacteria at genus level were more often found in subtropical zones than that of temperate zones (Table 2), particularly the dominant genus harbored P solubilization and mineralization genes, such as Candidatus Solibacter (belong to Acidobacteria) and Bradyrhizobium (belong to Proteobacteria) (Table 2 and Table S1). This may mainly be caused by the different TP content between these two types of forest biomes [44]. A similar discrepancy was also observed regarding our group of P solubilization and mineralization genes, which increased with TP content along the eight forest biomes (Figure 2).

4.2. Factors Affecting Soil P Functional Genes in Temperate and Subtropical Zones

We found positive correlation between the microbial α-diversity and the genes involved in P starvation response regulation at eight forest biomes along the latitude (Figure 3). For both temperate and subtropical zones, our results confirmed the positive effect of the microbial community, particularly that of the microbial α-diversity, on genes related to P starvation response regulation (Figure 4 and Figure 5), which is consistent with the previous finding that have highlighted the significance of effective phosphate starvation inducible gene regulation by microbial communities in forest soils [10]. This significant response is potentially attributable to the following sequence of events. In forest biomes, microbial α-diversity has been established to be significantly correlated with changes in nutrient metrics, with soil C availability being shown to have a notable positive association with microbial α-diversity [45,46]. Increasing substrate availability (soil C) can potentially alleviate C limitation, thereby promoting a proliferation of microbial taxa [46], which in turn leads to N and/or P limitation in soils [47]. As a consequence of declining N and P availability, the activation of P starvation response regulation genes (mainly phoU, phoR, and phoB) [48] may enable the soil microbiota to exploit external or alternative P sources [11,20].
Our findings reveal a significantly positive relationship between microbial α-diversity and P uptake and transport genes in eight forest ecosystems along a set latitude (Figure 3). Furthermore, we found that this positive relationship was only showed in temperate forest biomes, not in subtropical forests (Figure 4 and Figure 5). This is consistent with the findings of the previous study indicating that soil microbes in temperate rainforests of New Zealand represent a major pool of biological P, due to the microbial immobilization of P [49]. We propose three possible explanations to account for these observations. The first of which is the functional coupling between P cycling gene groups [50]. Given the strong associations between those genes involved in P uptake and transport and P starvation response regulation in controlling the expression of genes encoding alkaline phosphatases [8,14], a tight coupling would be anticipated under the low-P conditions [8]. Second, the competition between soil microbes and plants would account for the positive relationship between P uptake and transport genes and microbial α-diversity in temperate forests, although not in the subtropics [51]. Under the low-P conditions in temperate forests, soil microbes and plants compete for the same P resources, which can be explained by the fact that to be available for plants use, solubilized organic P has to diffuse through the rhizosphere or mycorrhizosphere, and is subsequently subject to direct competition from microbes [14]. Third, in P limited conditions, plants rely on rhizosphere microbial members to facilitate P acquisition [52]. These microbes solubilize inorganic P, which is converted into organic forms within their cells via the P uptake and transport system [49]. Following cell death, this microbially sequestered P is released into the rhizosphere, and thereby made available for plant use [14].
Despite our findings suggesting that there is no significant relationship among soil substrates and P functional genes in forest ecosystems along a set latitude (Figure 3), different results were found in temperate forest biomes (Figure 4 and Figure 5). We found that the soil substrates (N:P, SOC) directly drive a significant proportion of the variation (88.18%) in P solubilization and mineralization genes in temperate forests (Figure 4 and Figure 5), we failed to detect a similar significant effect in subtropical forests (Figure 4), which we suspect could be attributable to differences in nutrient availability within the two ecosystem types. Soil microbes often have to contend with nutrient imbalances [53], under which conditions, N and P limitation would contribute to suppressing microbial growth [54]. In natural forest biomes, a considerable fraction of soil inorganic P is bound to metal cations or metal oxides in forms that cannot be directly utilized by either microbes or plants [55]. On exhaustion of the AP source, the resulting P deficient conditions may trigger a microbial response to P limitation mediated via the solubilization of inorganic P [52]. In the subtropics, elevated temperatures enhance microbial activity [56], hence microbial P turnover [49], which might thus contribute to enhancing P availability in subtropical forest biomes to a greater extent than in temperate forests. Consistently, our data indicate a relatively higher availability of P in subtropical than in temperate forests (Table S1).
Overall, the mechanism of P cycling driven by microbial P functional genes were different between temperate and subtropical forest biomes. The unfavorable pH and lower AP of the temperate forest soils than that of the subtropical forest soils resulted in a significant positive correlation of the microbial α-diversity with P starvation response regulation genes and P uptake and transport genes (Table S1, Figure 3 and Figure 4). In addition, soil substrates negatively correlated with P solubilization and mineralization genes in temperate forest soils, suggesting that the amount of solubilizing inorganic P contents exerts some contribution on AP concentration (Figure 4).

5. Conclusions

In this study, we adopted a metagenomics approach to undertake an in-depth continental-scale evaluation of mechanisms associated with the genetic potential of P cycling in soils of different climate zones. We established that the P starvation response regulation genes are more abundant in temperate forest biomes than in the subtropics. Moreover, we found the effects of climate, soil environment and substrates, and microbial community on P functional genes in temperate forests biomes to be of greater complexity than those in subtropical forests. In temperate forest biomes, the responses of P functional genes and P cycling systems to environmental variation were found to be more sensitive than those detected in subtropical forest biomes. These findings thus provide evidence to indicate that microbial P functional genes are characterized by differential responses among different forest biomes, thereby providing a basis for gaining a more comprehensive understanding of the roles of microbial P functional genes in regulating P cycling in forest biomes.

Supplementary Materials

The following supporting information can be downloaded at: https://www.mdpi.com/article/10.3390/f13122002/s1, Table S1: Main characteristics of the sampling sites along the subtropical-temperate forest biomes in China; Table S2: Summary of the metagenome sequencing of 24 composite samples across forest biomes; Table S3: Abundance of 40 phosphorus functional genes along latitude in China; Table S4: Changes in the abundance of three major classes of phosphorus functional genes along the subtropical-temperate forest biomes of China; Table S5: The average abundance of three major classes of phosphorus functional genes among temperate and subtropical forest biomes; Table S6: Abundance of phosphorus functional genes corresponding to phyla along the subtropical-temperate forest biomes of China.

Author Contributions

J.W. (Jun Wang) conceived the project. S.Z. and Y.L. contributed to data analysis. J.W. (Jieying Wang) contributed to plot figure. Y.G. and F.Z. interpreted the results. S.Z., Y.L. and L.H. wrote the manuscript with assistances of all other coauthors. All authors have read and agreed to the published version of the manuscript.

Funding

This work was financially supported by the Chinese Academy of Sciences “Light of West China” Program for Introduced Talent in the West, the National Natural Science Foundation of China (Grant No. 31570440, 31270484), and the Key International Scientific and Technological Cooperation and Exchange Project of Shaanxi Province, China (Grant No. 2020KWZ-010).

Data Availability Statement

No applicable.

Conflicts of Interest

The authors declare that they have no known competing financial interests or personal relationships that could have appeared to influence the work reported in this paper.

References

  1. Pastore, G.; Kernchen, S.; Spohn, M. Microbial solubilization of silicon and phosphorus from bedrock in relation to abundance of phosphorus-solubilizing bacteria in temperate forest soils. Soil Biol. Biochem. 2020, 151, 108050. [Google Scholar] [CrossRef]
  2. Zhang, Y.W.; Guo, Y.P.; Tang, Z.Y.; Feng, Y.H.; Zhu, X.R.; Xu, W.T.; Bai, Y.F.; Zhou, G.Y.; Xie, Z.Q.; Fang, J.Y. Patterns of nitrogen and phosphorus pools in terrestrial ecosystems in China. Earth Syst. Sci. Data 2021, 13, 5337–5351. [Google Scholar] [CrossRef]
  3. Powers, S.; Mirsky, E.; Bandaranayake, A.; Thavarajah, P.; Shipe, E.; Bridges, W.; Thavarajah, D. Field pea (Pisum sativum L.) shows genetic variation in phosphorus use efficiency in different P environments. Sci. Rep. 2020, 10, 18940. [Google Scholar] [CrossRef]
  4. Tian, J.; Dungait, J.A.J.; Lu, X.K.; Yang, Y.F.; Hartley, I.P.; Zhang, W.; Mo, J.M.; Yu, G.R.; Zhou, J.Z.; Kuzyakov, Y. Long-term nitrogen addition modifies microbial composition and functions for slow carbon cycling and increased sequestration in tropical forest soil. Glob. Change Biol. 2019, 25, 3267–3281. [Google Scholar] [CrossRef] [PubMed] [Green Version]
  5. Kavka, M.; Majcherczyk, A.; Kues, U.; Polle, A. Phylogeny, tissue-specific expression, and activities of root-secreted purple acid phosphatases for P uptake from ATP in P starved poplar. Plant Sci. 2021, 307, 110906. [Google Scholar] [CrossRef] [PubMed]
  6. Bechtaoui, N.; Rabiu, M.K.; Raklami, A.; Oufdou, K.; Hafidi, M.; Jemo, M. Phosphate-dependent regulation of growth and stresses management in plants. Front. Plant Sci. 2021, 12, 679916. [Google Scholar] [CrossRef]
  7. Fleischer, K.; Rammig, A.; De Kauwe, M.G.; Walker, A.P.; Domingues, T.F.; Fuchslueger, L.; Garcia, S.; Goll, D.S.; Grandis, A.; Jiang, M.K.; et al. Amazon forest response to CO2 fertilization dependent on plant phosphorus acquisition. Nat. Geosci. 2019, 12, 736–741. [Google Scholar] [CrossRef] [Green Version]
  8. Dai, Z.M.; Liu, G.F.; Chen, H.H.; Chen, C.R.; Wang, J.K.; Ai, S.Y.; Wei, D.; Li, D.M.; Ma, B.; Tang, C.X.; et al. Long-term nutrient inputs shift soil microbial functional profiles of phosphorus cycling in diverse agroecosystems. Isme J. 2020, 14, 757–770. [Google Scholar] [CrossRef] [Green Version]
  9. Wang, Y.F.; Li, X.Z.; Datta, R.H.; Chen, J.; Du, Y.Z.; Du, D.L. Key factors shaping prokaryotic communities in subtropical forest soils. Appl. Soil Ecol. 2022, 169, 104162. [Google Scholar] [CrossRef]
  10. Bergkemper, F.; Scholer, A.; Engel, M.; Lang, F.; Kruger, J.; Schloter, M.; Schulz, S. Phosphorus depletion in forest soils shapes bacterial communities towards phosphorus recycling systems. Environ. Microbiol. 2016, 18, 1988–2000. [Google Scholar] [CrossRef]
  11. Li, M.; Hao, Y.B.; Yan, Z.Q.; Kang, E.Z.; Wang, J.Z.; Zhang, K.R.; Li, Y.; Wu, H.D.; Kang, X.M. Long-term degradation from marshes into meadows shifts microbial functional diversity of soil phosphorus cycling in an alpine wetland of the Tibetan Plateau. Land Degrad. Dev. 2022, 33, 628–637. [Google Scholar] [CrossRef]
  12. Oliverio, A.M.; Bissett, A.; McGuire, K.; Saltonstall, K.; Turner, B.L.; Fierer, N. The role of phosphorus limitation in shaping soil bacterial communities and their metabolic capabilities. Mbio 2020, 11, e01718-20. [Google Scholar] [CrossRef]
  13. Rawat, P.; Das, S.; Shankhdhar, D.; Shankhdhar, S.C. Phosphate-solubilizing microorganisms: Mechanism and their role in phosphate solubilizing and uptake. J. Soil Sci. Plant Nutr. 2021, 21, 49–68. [Google Scholar] [CrossRef]
  14. Richardson, A.E.; Simpson, R.J. Soil microorganisms mediating phosphorus availability update on microbial phosphorus. Plant Physiol. 2011, 156, 989–996. [Google Scholar] [CrossRef] [PubMed] [Green Version]
  15. Lee, S.J.; Park, Y.S.; Kim, S.J.; Lee, B.J.; Suh, S.W. Crystal structure of PhoU from Pseudomonas aeruginosa, a negative regulator of the Pho regulon. J. Struct. Biol. 2014, 188, 22–29. [Google Scholar] [CrossRef]
  16. Wu, X.J.; Rensing, C.; Han, D.F.; Xiao, K.Q.; Dai, Y.X.; Tang, Z.X.; Liesack, W.; Peng, J.J.; Cui, Z.L.; Zhang, F.S. Genome-Resolved Metagenomics Reveals Distinct Phosphorus Acquisition Strategies between Soil Microbiomes. Msystems 2022, 7, e01107-21. [Google Scholar] [CrossRef]
  17. Wei, X.M.; Hu, Y.J.; Cai, G.; Yao, H.Y.; Ye, J.; Sun, Q.; Veresoglou, S.D.; Li, Y.Y.; Zhu, Z.K.; Guggenberger, G.; et al. Organic phosphorus availability shapes the diversity of phoD-harboring bacteria in agricultural soil. Soil Biol. Biochem. 2021, 161, 108364. [Google Scholar] [CrossRef]
  18. Siegenthaler, M.B.; Ramoneda, J.; Frossard, E.; Meszaros, E. Microbial community responses to phosphorus and nitrogen inputs in the organic soil horizons of two contrasting temperate beech forests. Appl. Soil Ecol. 2022, 172, 104357. [Google Scholar] [CrossRef]
  19. Alori, E.T.; Glick, B.R.; Babalola, O.O. Microbial phosphorus solubilization and its potential for use in sustainable agriculture. Front. Microbiol. 2017, 8, 971. [Google Scholar] [CrossRef] [PubMed] [Green Version]
  20. Liang, J.L.; Liu, J.; Jia, P.; Yang, T.T.; Zeng, Q.W.; Zhang, S.C.; Liao, B.; Shu, W.S.; Li, J.T. Novel phosphate-solubilizing bacteria enhance soil phosphorus cycling following ecological restoration of land degraded by mining. Isme J. 2020, 14, 1600–1613. [Google Scholar] [CrossRef] [PubMed]
  21. Yan, Y.; Sun, X.T.; Sun, F.W.; Zhao, Y.A.; Sun, W.; Guo, J.X.; Zhang, T. Sensitivity of soil fungal and bacterial community compositions to nitrogen and phosphorus additions in a temperate meadow. Plant Soil 2022, 471, 477–490. [Google Scholar] [CrossRef]
  22. Li, J.B.; Xie, T.; Zhu, H.; Zhou, J.; Li, C.N.; Xiong, W.J.; Xu, L.; Wu, Y.H.; He, Z.L.; Li, X.Z. Alkaline phosphatase activity mediates soil organic phosphorus mineralization in a subalpine forest ecosystem. Geoderma 2021, 404, 115376. [Google Scholar] [CrossRef]
  23. Wang, F.; Zhang, Y.; Xia, Y.; Cui, Z.B.; Cao, C.Y. Soil microbial community succession based on PhoD and Gcd genes along a chronosequence of sand-fixation forest. Forests 2021, 12, 1707. [Google Scholar] [CrossRef]
  24. LeBrun, E.S.; King, R.S.; Back, J.A.; Kang, S. A metagenome-based investigation of gene relationships for non-substrate-associated microbial phosphorus cycling in the water column of streams and rivers. Microb. Ecol. 2018, 76, 856–865. [Google Scholar] [CrossRef] [PubMed]
  25. Ma, B.; Stirling, E.; Liu, Y.H.; Zhao, K.K.; Zhou, J.Z.; Singh, B.K.; Tang, C.X.; Dahlgren, R.A.; Xu, J.M. Soil biogeochemical cycle couplings inferred from a function-taxon network. Research 2021, 7102769. [Google Scholar] [CrossRef] [PubMed]
  26. Zhang, C.; Xue, S.; Liu, G.B.; Song, Z.L. A comparison of soil qualities of different revegetation types in the Loess Plateau, China. Plant Soil 2011, 347, 163–178. [Google Scholar] [CrossRef]
  27. Bouyoucos, G.J. Hydrometer method improved for making particle size analyses of soils. Agron. J. 1962, 54, 464–465. [Google Scholar] [CrossRef]
  28. Bray, R.H.; Kurtz, L.T. Determination of total, organic, and available forms of phosphorus in soils. Soil Sci. 1945, 59, 39–45. [Google Scholar] [CrossRef]
  29. Ren, C.J.; Zhang, X.Y.; Zhang, S.H.; Wang, J.Y.; Xu, M.P.; Guo, Y.X.; Wang, J.; Han, X.H.; Zhao, F.Z.; Yang, G.H.; et al. Altered microbial CAZyme families indicated dead biomass decomposition following afforestation. Soil Biol. Biochem. 2021, 160, 108362. [Google Scholar] [CrossRef]
  30. Ren, C.J.; Chen, J.; Deng, J.; Zhao, F.Z.; Han, X.H.; Yang, G.H.; Tong, X.G.; Feng, Y.Z.; Shelton, S.; Ren, G.X. Response of microbial diversity to C:N:P stoichiometry in fine root and microbial biomass following afforestation. Biol. Fertil. Soils 2017, 53, 457–468. [Google Scholar] [CrossRef]
  31. Cheeke, T.E.; Phillips, R.P.; Brzostek, E.R.; Rosling, A.; Bever, J.D.; Fransson, P. Dominant mycorrhizal association of trees alters carbon and nutrient cycling by selecting for microbial groups with distinct enzyme function. New Phytol. 2017, 214, 432–442. [Google Scholar] [CrossRef] [Green Version]
  32. Ren, C.J.; Zhou, Z.H.; Guo, Y.X.; Yang, G.H.; Zhao, F.Z.; Wei, G.H.; Han, X.H.; Feng, L.; Feng, Y.Z.; Ren, G.X. Contrasting patterns of microbial community and enzyme activity between rhizosphere and bulk soil along an elevation gradient. Catena 2021, 196, 104921. [Google Scholar] [CrossRef]
  33. Zhang, X.M.; Johnston, E.R.; Barberan, A.; Ren, Y.; Lu, X.T.; Han, X.G. Decreased plant productivity resulting from plant group removal experiment constrains soil microbial functional diversity. Glob. Change Biol. 2017, 23, 4318–4332. [Google Scholar] [CrossRef] [PubMed]
  34. Li, D.H.; Liu, C.M.; Luo, R.B.; Sadakane, K.; Lam, T.W. MEGAHIT: An ultra-fast single-node solution for large and complex metagenomics assembly via succinct de Bruijn graph. Bioinformatics 2015, 31, 1674–1676. [Google Scholar] [CrossRef] [Green Version]
  35. Henseler, J.; Hubona, G.; Ray, P.A. Using PLS path modeling in new technology research: Updated guidelines. Ind. Manag. Data Syst. 2016, 116, 2–20. [Google Scholar] [CrossRef]
  36. Cheng, J.M.; Han, Z.J.; Cong, J.; Yu, J.J.; Zhou, J.Z.; Zhao, M.X.; Zhang, Y.G. Edaphic variables are better indicators of soil microbial functional structure than plant-related ones in subtropical broad-leaved forests. Sci. Total Environ. 2021, 773, 145630. [Google Scholar] [CrossRef]
  37. Chu, H.Y.; Neufeld, J.D.; Walker, V.K.; Grogan, P. The influence of vegetation type on the dominant soil bacteria, archaea, and fungi in a low arctic tundra landscape. Soil Sci. Soc. Am. J. 2011, 75, 1756–1765. [Google Scholar] [CrossRef] [Green Version]
  38. Hu, Y.G.; Zhang, Z.S.; Huang, L.; Qi, Q.; Liu, L.C.; Zhao, Y.; Wang, Z.R.; Zhou, H.K.; Lv, X.Y.; Mao, Z.C.; et al. Shifts in soil microbial community functional gene structure across a 61-year desert revegetation chronosequence. Geoderma 2019, 347, 126–134. [Google Scholar] [CrossRef]
  39. Prathap, V.; Kumar, A.; Maheshwari, C.; Tyagi, A. Phosphorus homeostasis: Acquisition, sensing, and long-distance signaling in plants. Mol. Biol. Rep. 2022, 49, 8071–8086. [Google Scholar] [CrossRef] [PubMed]
  40. Maranguit, D.; Guillaume, T.; Kuzyakov, Y. Effects of flooding on phosphorus and iron mobilization in highly weathered soils under different land-use types: Short-term effects and mechanisms. Catena 2017, 158, 161–170. [Google Scholar] [CrossRef]
  41. Billah, M.; Khan, M.; Bano, A.; Ul Hassan, T.; Munir, A.; Gurmani, A.R. Phosphorus and phosphate solubilizing bacteria: Keys for sustainable agriculture. Geomicrobiol. J. 2019, 36, 904–916. [Google Scholar] [CrossRef]
  42. Mason, L.M.; Eagar, A.; Patel, P.; Blackwood, C.B.; DeForest, J.L. Potential microbial bioindicators of phosphorus mining in a temperate deciduous forest. J. Appl. Microbiol. 2021, 130, 109–122. [Google Scholar] [CrossRef] [PubMed]
  43. Gai, X.; Li, S.C.; Zhang, X.P.; Bian, F.Y.; Yang, C.A.B.; Zhong, Z.K. Changes in soil phosphorus availability and associated microbial properties after chicken farming in Lei bamboo (Phyllostachys praecox) forest ecosystems. Land Degrad. Dev. 2021, 32, 3008–3022. [Google Scholar] [CrossRef]
  44. Yi, X.Y.; Ning, C.; Feng, S.L.; Gao, H.Q.; Zhao, J.L.; Liao, J.Y.; Peng, Y.H.; Zhao, S.Q.; Liu, S.G. Urbanization-induced environmental changes strongly affect wetland soil bacterial community composition and diversity. Environ. Res. Lett. 2022, 17, 014027. [Google Scholar] [CrossRef]
  45. Louis, B.P.; Maron, P.A.; Menasseri-Aubry, S.; Sarr, A.; Leveque, J.; Mathieu, O.; Jolivet, C.; Leterme, P.; Viaud, V. Microbial diversity indexes can explain soil carbon dynamics as a function of carbon source. PLoS ONE 2016, 11, e0161251. [Google Scholar] [CrossRef] [Green Version]
  46. Custer, G.F.; Diepen, L. Plant invasion has limited impact on ssoil microbial α-diversity: A meta-analysis. Diversity 2020, 12, 112. [Google Scholar] [CrossRef] [Green Version]
  47. Du, Z.G.; Wang, J.W.; Zhou, G.Y.; Bai, S.H.; Zhou, L.Y.; Fu, Y.L.; Wang, C.K.; Wang, H.M.; Yu, G.R.; Zhou, X.H. Differential effects of nitrogen vs. phosphorus limitation on terrestrial carbon storage in two subtropical forests: A bayesian approach. Sci. Total Environ. 2021, 795, 148485. [Google Scholar] [CrossRef] [PubMed]
  48. Torres-Rodriguez, J.V.; Salazar-Vidal, M.N.; Chavez Montes, R.A.; Massange-Sanchez, J.A.; Gillmor, C.S.; Sawers, R.J.H. Low nitrogen availability inhibits the phosphorus starvation response in maize (Zea mays ssp. mays L.). BMC Plant Biol. 2021, 21, 259. [Google Scholar] [CrossRef] [PubMed]
  49. Turner, B.L.; Lambers, H.; Condron, L.M.; Cramer, M.D.; Leake, J.R.; Richardson, A.E.; Smith, S.E. Soil microbial biomass and the fate of phosphorus during long-term ecosystem development. Plant Soil 2013, 367, 225–234. [Google Scholar] [CrossRef]
  50. Zhou, R.J.; Hou, D.W.; Zeng, S.Z.; Wei, D.D.; Yu, L.F.; Bao, S.C.; Weng, S.P.; He, J.G.; Huang, Z.J. Sedimentary nitrogen and sulfur reduction functional-couplings interplay with the microbial community of anthropogenic shrimp culture pond ecosystem. Front. Microbiol. 2022, 13, 830777. [Google Scholar] [CrossRef]
  51. Wu, J.W.; Liang, J.L.; Bjorn, L.O.; Li, J.T.; Shu, W.S.; Wang, Y.T. Phosphorus-arsenic interaction in the ‘soil-plant-microbe’ system and its influence on arsenic pollution. Sci. Total Environ. 2022, 802, 149796. [Google Scholar] [CrossRef]
  52. Bledsoe, R.B.; Goodwillie, C.; Peralta, A.L. Long-term nutrient enrichment of an oligotroph-dominated wetland increases bacterial diversity in bulk soils and plant rhizospheres. Msphere 2020, 5, e00035-20. [Google Scholar] [CrossRef] [PubMed]
  53. Mooshammer, M.; Wanek, W.; Zechmeister-Boltenstern, S.; Richter, A. Stoichiometric imbalances between terrestrial decomposer communities and their resources: Mechanisms and implications of microbial adaptations to their resources. Front. Microbiol. 2014, 5, 22. [Google Scholar] [CrossRef] [PubMed] [Green Version]
  54. Luo, L.; Wu, R.N.; Meng, H.; Li, X.Y.; Gu, J.D. Seasonal and spatial variations in diversity and abundance of bacterial laccase-like genes in sediments of a subtropical mangrove ecosystem. Int. Biodeterior. Biodegrad. 2016, 114, 260–267. [Google Scholar] [CrossRef]
  55. Mise, K.; Koyama, Y.; Matsumoto, A.; Fujita, K.; Kunito, T.; Senoo, K.; Otsuka, S. Pectin drives microbial phosphorus solubilization in soil: Evidence from isolation-based and community-scale approaches. Eur. J. Soil Biol. 2020, 97, 103169. [Google Scholar] [CrossRef]
  56. Hacket-Pain, A.J.; Ascoli, D.; Vacchiano, G.; Biondi, F.; Cavin, L.; Conedera, M.; Drobyshev, I.; Linan, I.D.; Friend, A.D.; Grabner, M.; et al. Climatically controlled reproduction drives interannual growth variability in a temperate tree species. Ecol. Lett. 2018, 21, 1833–1844. [Google Scholar] [CrossRef] [PubMed]
Figure 1. Distribution of sampling sites along the subtropical–temperate forest biomes of China. The abbreviations of sampling sites from north to south are as follows: ME, ME, and Maoer mountain; DL and Dongling mountain; FX and Fuxian; HDT Huoditang; MX and Maoxian; GG and Gongga mountain; AL and Ailao mountain; ML and Karst Mulan Station.
Forests 13 02002 g001
Figure 2. Variation in the abundance of P functional genes among the subtropical–temperate forest biomes in China. The 40 phosphorus functional genes were grouped into three main categories (P starvation response and regulation, P uptake and transport, P solubilization and mineralization) and the three categories of phosphorus genes varied in forests biomes. The abbreviations of sampling sites from north to south are as follows: ME, Maoer mountain; DL, Dongling mountain; FX, Fuxian; HDT Huoditang; MX, Maoxian; GG, Gongga mountain; AL, Ailao mountain; ML, Karst Mulan Station. Values presented are means ± SD (n = 3). Different letters above error bars indicate significant difference at p < 0.05 for the same gene category using LSD (L) and Duncan (D) tests.
Forests 13 02002 g002
Figure 3. Relationships among factors and the P functional genes at eight forest biomes along the latitude.
Forests 13 02002 g003
Figure 4. Partial least squares regression (PLS-PM) modeling variables effects on phosphorus functional genes in temperate and subtropical forest biomes. Partial least squares regression analysis was conducted for direct and indirect effects of biotic and abiotic factors on phosphorus functional genes. Single-headed arrows indicate the hypothesized direction of causation. Black solid and red solid arrows indicate positive and negative relationships, respectively. Dashed arrows indicate insignificant relationship (p ≥ 0.05). The arrow width is proportional to the strength of the relationship. Double-layer rectangles represent the component of biotic and abiotic factors to phosphorus cycle functional genes. The climate includes MAP and MAT; the soil substrates include the SOC and N/P ratio; soil environment represents BD and pH; microbial community (α-diversity). The numbers adjacent to the arrows are the standardized path coefficients. * p < 0.05, ** p < 0.01, and *** p < 0.001. The GoF values were 0.682 in temperate zones and 0.743 in subtropics in abundance of phosphorus functional genes.
Forests 13 02002 g004
Figure 5. Relative contributions of climate, soil substrates, soil environment, and microbial community to the abundance of phosphorus functional genes in temperate and subtropical forest biomes. Variation partitioning analysis was conducted to identify the variance in the abundance of phosphorus functional genes by these four groups of biotic and abiotic factors. Ellipses represent the different groups of factors (climate, soil substrates, soil environment, and microbial community). Numbers represents the variation partitioned by different sections.
Forests 13 02002 g005
Table 1. The average abundance of phosphorus functional genes of Acidobacteria, Actinobacteria, Proteobacteria, and Verrucomicrobia between temperate and subtropical forest biomes.
PhylaTemperate Forest BiomesSubtropical Forest Biomes
P Starvation Response RegulationP Uptake and TransportP Solubilization and MineralizationP Starvation Response RegulationP Uptake and TransportP Solubilization and Mineralization
Acidobacteria312.08 ± 132.98 c981.67 ± 378.20 b2731.58 ± 298.35 a*287.42 ± 45.53 C1261.08 ± 131.38 B3768.83 ± 251.88 A*
Actinobacteria182.08 ± 14.06 c954.75 ± 42.00 a247.92 ± 27.48 b127.75 ± 35.32 B776.75 ± 119.54 A228.00 ± 43.39 B
Proteobacteria590.08 ± 40.31 c*3586.58 ± 261.20 a1403.83 ± 109.03 b769.00 ± 90.93 C*4856.33 ± 838.79 A2146.00 ± 568.13 B
Verrucomicrobia167.25 ± 63.96 b694.08 ± 221.41 a188.50 ± 70.74 b112.17 ± 15.15 B425.08 ± 50.20 A121.33 ± 25.27 B
Different small letters after numbers indicate differences at the 0.05 level of the abundance of P functional genes in the temperate forest biomes; different capital letters after numbers indicate differences at the 0.05 level of the abundance of P functional genes in the subtropical forest biomes; * indicates the differences at 0.05 level of the abundance of P functional genes between temperate and subtropical forest biomes.
Table 2. Abundance of phosphorus functional genes corresponding to dominant genus (the top 10) of Actinobacteria and Proteobacteria along the subtropical-temperate forest biomes of China.
PhylaGenusTemperature Forest BiomesSubtropical Forest Biomes
P Starvation Response RegulationP Uptake and TransportP Solubilization and MineralizationP Starvation Response RegulationP Uptake and TransportP Solubilization and Mineralization
AcidobacteriaCandidatus Solibacter1.67 ± 1.250529 ± 48.4222.33 ± 14.6101014 ± 75.75
Acidobacterium19.67 ± 8.7378 ± 26.42295.67 ± 118.4210 ± 5.061.33 ± 23.33120.67 ± 39.20
Candidatus Sulfopaludibacter1.33 ± 1.252.33 ± 1.25185.67 ± 29.8552.33 ± 32.3610.67 ± 4.92185 ± 113.93
Luteitalea9 ± 4.324.67.1.2546 ± 5.17.33 ± 6.187.67 ± 4.6455.67 ± 29.80
Edaphobacter08 ± 2.1616.33 ± 6.18026.33 ± 9.0147.67 ± 58.63
Terriglobus0029 ± 9.270071 ± 12.33
Granulicella06.33 ± 4.508.33 ± 4.030105.67 ± 45.7131.67 ± 8.7
Occallatibacter0023.67 ± 19.940030.33 ± 15.69
Candidatus Koribacter0017.33 ± 16.780029.33 ± 8.22
Acidipila0.66 ± 0.941.33 ± 1.254.33 ± 3.300.33 ± 0.472 ± 1.4123.33 ± 10.65
ProteobacteriaBradyrhizobium188.33 ± 28.791590.33 ± 303.471609.67 ± 261.41473.67 ± 85.343309 ± 930.053200 ± 853.32
Rhodoplanes71 ± 6.48533 ± 76.54135.67 ± 23.68117.33 ± 27.88950.67 ± 195.21406.67 ± 162.39
Sphingomonas109.33 ± 18.87314.67 ± 105.09203.67 ± 32.06124.33 ± 73.30323.33 ± 176.36308.67 ± 82.70
Pseudolabrys107.33 ± 10.78247.67 ± 53.5141.33 ± 18.55223.33 ± 40.84416.67 ± 61.6779.67 ± 18.80
Mesorhizobium13 ± 4.90181 ± 38.7991 ± 9.2710.33 ± 4.92264 ± 42.55104.67 ± 32.27
Rhodopseudomonas19.67 ± 2.49164 ± 24.4950 ± 10.4242 ± 10.61225.67 ± 53.3998.67 ± 25.04
Variibacter22 ± 9.93156 ± 25.819.67 ± 3.0119.33 ± 6.94115 ± 36.0816.67 ± 7.41
Bosea2.67 ± 1.70152.33 ± 24.429.67 ± 2.050.67 ± 0.94195 ± 29.809.33 ± 0.47
Enhydrobacter14.33 ± 5.2593 ± 4.9016.67 ± 4.5030 ± 4.55218.67 ± 29.2337 ± 5.89
Afipia26.67 ± 4.1978.67 ± 8.6596 ± 9.4121 ± 2.94127 ± 35.36138 ± 49.61
Publisher’s Note: MDPI stays neutral with regard to jurisdictional claims in published maps and institutional affiliations.

