Article

Trade-Offs between Economic Gains and Carbon Stocks across a Range of Management Alternatives in Boreal Forests

1
State Key Laboratory of Biocontrol, School of Ecology, Sun Yat-sen University, Guangzhou 510275, China
2
Faculty of Natural Resources Management, Lakehead University, 955 Oliver Road, Thunder Bay, ON P7B 5E1, Canada
*
Author to whom correspondence should be addressed.
Forests 2022, 13(11), 1777; https://doi.org/10.3390/f13111777
Submission received: 24 September 2022 / Revised: 23 October 2022 / Accepted: 25 October 2022 / Published: 27 October 2022
(This article belongs to the Special Issue Nutrient Cycling in Forest Ecosystems under Environmental Changes)

Abstract

:
Boreal forests, storing approximately half of the global forest carbon (C), are key to the global C cycle and climate regulation. The sustainability of C stocks is adversely impacted by forest management. However, the economic gain–C stock relationship across forest management alternatives and diverse C pools remain unclear. Using empirical data, we examined the relationships between economic gains and total ecosystem C in response to the changes in rotation age and overstorey composition in boreal forests. We found that total ecosystem C increased initially, reached a maximum, and declined thereafter with increasing economic gains. The relationships between economic gains and C stocks of live biomass, deadwood, forest floor, and mineral soil followed similar trends with total ecosystem C. Path analysis showed that both rotation age and overstorey composition simultaneously drove economic gains and C stocks that led to their trade-off relationship. We further indicated that maximum economic gains (USD 5000/ha) could lead to approximately 40% loss of total ecosystem C, while the maximum total ecosystem C (320 Mg/ha) could be attained when giving up 50% of economic gains. These results provide broad guides for forest managers and decision-makers towards balancing economic and C objectives in forest management by integrating into a forest carbon market.

1. Introduction

Forest ecosystem provides a multitude of ecological functions and services for economic, ecological, and social objectives to human society [1]. Maximizing economic gains is an important forestry objective; however, forest management also requires conserving or improving other ecological functions and services [2], including carbon (C) storage, to mitigate the rising atmospheric CO2-induced global warming [3]. Studies that investigate trade-offs between economic gains and ecological functions are urgently needed to inform policy-makers [4,5]. Forest management alternatives that maximize economic gains (mainly contributed by live aboveground tree biomass) usually result in reduced in situ C stocks in the short run [6,7], but their long-term effects are poorly understood. Previous studies assessing the economic gain–C stock relationships have mainly focused on aboveground C using simulations at the landscape level [7,8,9,10,11,12]. However, the empirical evidence for the relationship between economic gains and C stock of the total ecosystem and the contribution of individual C pools is lacking for sustainable forest management, particularly for boreal forests where a large proportion of ecosystem C is stored in the soil [13,14]. This knowledge gap is troubling because the selection of optimum management options with limited losses of C storage capacity requires an in-depth understanding of the economic gain–C stock relationship.
Boreal forests store approximately half of the global forest C, which is the key to the global C cycle and climate regulation [13]. Management alternatives, including different rotation age and overstorey composition goals, determine both economic gains [15] and C stocks [16]. For example, as biomass increases with rotation age, the choice of rotation age is important to the economic value of the forest products [17,18]. Long rotations may increase the economic gains of the harvest, but an excessive long rotation may result in increased tree mortality [19] and decreased live aboveground biomass [16], reducing the economic gains. Meanwhile, rotation age also affects C stock, but with different trends among diverse C pools [16]. Total live biomass C increases with age, peaks at a canopy transition stage, then declines with the increasing dominance of less productive late-successional species [20]. Although deadwood C does not change notably until late successional stages, both forest floor and mineral soil C typically increase with stand development but with different magnitudes [16].
In boreal forests, overstorey species composition—controlled by natural or artificial regeneration methods at the stand initiation—influences both economic gains from wood harvest [15] and C stocks [16]. For example, products made from coniferous wood usually have higher market values in the Canadian forest sector than those manufactured from broadleaved species such as trembling aspen and white birch [15]. On the other hand, the higher productivity of broadleaf trees and input of soil organic C from both above- and belowground make broadleaved stands on average higher in total ecosystem C than mixedwood and coniferous stands [21]. However, compared with broadleaved stands, coniferous stands may have higher forest floor C at intermediate stand ages due to increasing shade-tolerant, bryophyte species in the understory [22], and mixedwood may have higher mineral soil C at the late successional stage due to the positive contribution of species diversity on fine root productivity [23,24]. Despite the separate advances made in understanding the influences of stand age and overstorey composition on C stocks [16] and economic gains [15], it remains unclear how the choices of rotation age and overstorey composition affect economic gains and C stocks simultaneously.
This study aims to examine the relationships between economic gains from wood harvest and total ecosystem C as well as the C stocks of total live biomass, total deadwood, forest floor, and mineral soil in response to the changes in rotation age and overstorey compositional types in the boreal forests of Canada. Specifically, we address: (i) how the relationships (trade-offs or synergies) between economic gains and C stocks vary with rotation age and overstorey composition across a variety of carbon pools; and how the choices of rotation age and overstorey composition simultaneously affect the economic gains and C stocks.

2. Methods

2.1. Study Area and Chronosequence Data

Our study is located in the boreal forest region, nearly 150 km north of Thunder Bay, Ontario, Canada, between 49°44′ to 49°65′ N and 89°16′ to 90°13′ W. The characteristics of the region include warm summers and cold, snowy winters. The closest meteorological station in Cameron Falls, Ontario, Canada, has recorded that the mean annual temperature is 1.9 °C and mean annual precipitation is 824.8 mm [25]. Dominant tree species, in order from least to most shade tolerant, include jack pine (Pinus banksiana Lamb.), trembling aspen (Populus tremuloides Michx.), white birch (Betula papyrifera Marsh), black spruce (Picea mariana (Mill) B.S.P.), white spruce (Picea glauca (Moench) Voss), and balsam fir (Abies balsamea (L.) Mill.). Due to the Wisconsinan glaciation, soil was deposited in the region approximately 9500 years ago. The prevalent natural disturbance in our study area is a stand-replacing wildfire, with an average fire-return interval of approximately 100 years, in a mosaic of stand ages in the area [26]. During the past 40 years, commercial logging with full-tree harvest methods has been practiced in our study area [26,27].
We used a replicated chronosequence (i.e., 8, 34, 99, 147 and 210-years since stand-replacing fire), representing the stand initiation, stem exclusion, early canopy transition, late canopy transition, and dynamic gap stages of boreal forest development, respectively [28]. Within each age class, we sampled three compositional types (broadleaf-dominated, conifer-dominated, and mixedwood). We replicated each combination of age and overstorey type three times, resulting in a total of 45 sample stands (Table S1). To ensure that the samples were interspersed to minimize spatial autocorrelation, stands were allocated several kilometers apart from each other [29].
Within each of the selected stands, we randomly established 0.04 ha (11.28 m radius) circular plot, which was located >50 m from the forest edge. For young (8-year-old) stands, we counted the tree stems by species. For older stands, we measured the diameter at breast height (DBH) for all trees. We determined the entire ecosystem C by measuring all individual pools [16].
We defined overstorey type based on the percentage of broadleaf and conifer tree species using stem density for 8-year-old stands and basal area for older stands. Broadleaved and coniferous stands had >65% broadleaved or coniferous tree species, respectively, while all other stands were classified as mixedwood stands [30]. Stand age was quantified as time since last stand-replacing fire. Detailed fire records were available for stands younger than 70 years old [26]. Stand age for older stands was determined through ring counts by coring three dominant/co-dominant trees of each tree species inside or near the plot.

2.2. Carbon Stocks

As described in detail by Gao et al. [16], the amount of C stored in the pools of total live biomass (live aboveground and live belowground), total deadwood (snags, down woody debris, and stumps), forest floor (organic soil horizons), and mineral soil was determined for all 45 sample stands of different stand ages and compositional types. In brief, total ecosystem C was the sum of all pools. Total live biomass C was the amount of C stored in all living tissues (i.e., stem, branches, twigs, foliage, and coarse and fine roots of all vegetation strata). Total deadwood C included aboveground deadwood and belowground deadwood C comprising of leaf litter, dead wood, and dead root. Total aboveground tree biomass and tree coarse root biomass were converted to C using locally developed C concentrations estimated by Gao et al. [31]. The C content of aboveground understory vegetation was calculated as 45% of dry mass [32]. Belowground medium and fine root C content were similarly assumed to be 45% of dry biomass. The C content of aboveground deadwood and belowground deadwood was assumed to be 50% of dry necromass, whereas C content of dead medium and fine roots was assumed as 45% of dry necromass [33]. All live biomass and deadwood C pools were scaled up to Mg C ha−1. The determination of forest floor C and mineral soil C has been previously described in detail [30]. In brief, ten soil cores were randomly collected in each of the 45 stands using a Dutch soil auger. Soil cores were separated by forest floor (that is, the fibric and humus layers) and two mineral soil layers according to mineral soil depth, that is, M1 (0–15 cm) and M2 (15–30 cm). Total C for each sample was determined by the flash dynamic combustion method and converted to Mg C ha−1 following the method described by Wairiu and Lal [34]. All carbon stocks were calculated in the year of 2016.
We used regression analysis to determine empirical relationships between stand age (i.e., 8, 34, 99, 147, and 210 years) and the C stocks of total live biomass, total deadwood, forest floor, and mineral soil. Then C stocks at varying rotation ages (i.e., 50, 75, 80, 85, 90, 95, 100, and 125 years) were estimated based on the established regression equations. Alternative sets of rotation ages were projected based on the common practices in the study region: 50-year as the ecologically and biologically acceptable rotation, 75-year as the operational rotation age under tenure (i.e., assigned to forest companies for potential harvest), 100-year as recommended by law in Ontario, and 125-year as the maximum volume accumulation with optimal ecological benefits in boreal forests [35]. We also extended rotation ages that varied by 5-year intervals between 75- to 100-year, rotation ages of 80, 85, 90, and 95 years, because economic returns are highly sensitive to rotation ages.

2.3. Forest Management Alternatives

In order to facilitate a trade-off analysis, a series of alternative management scenarios were developed to explore the impact of varying rotation age and overstorey composition on the economic gain–C stocks relationship. Forest Vegetation Simulator (FVSOntario) was used to project gross total volume for economic gains of each forest management alternative at various rotation ages (i.e., 50, 75, 80, 85, 90, 95, 100, 125-year) based on current size and calibrated values of empirical stand conditions [36]. Existing inventory conditions of 34-year-old stands were used to project volumes to rotation ages of 50, 75, 80, 85, 90, and 95 years, while empirical data from 99-year stands were used to project volume to rotation ages of 100 and 125 years in FVSOntario. We used rotation age for the economic gains and trade-off analysis, while stand age was used to describe the plot data. We used the proportion of conifer tree species (i.e., jack pine, white spruce, black spruce, and balsam fir) as a continuous variable to represent overstorey composition in each empirical case and simulated stands expressed as a percentage of the total basal area. Intensive forest management generally resulted in a higher amount of conifer tree species in the overstorey [15].

2.4. Economic Gains

We used two methods to calculate the economic gains. In the first method, the profit of each forest management alternative was calculated by subtracting the present costs from present benefits (see Chen et al. [15] for details). We made the assumption that the prices of forest products and costs of silviculture, harvesting, processing, transportation, and “all-in” delivered costs (i.e., production, shipping, distribution, and administrative expenses) were constant and also co-occurred in the same year of 2016. This assumption was necessary because costs and benefits will both change over time. Honer’s equations permitted the calculation of the gross total volume of stands in each management alternative [37]:
G T V t = 0.0043891 × D 2 ( 1 0.04365 × b 2 ) 2 ( c 1 + 0.3048 × c 2 / H )
where: GTVt = gross total volume (m3), D = diameter at breast height (1.3 m) outside bark (cm), H = total tree height (m), b2, c1 and c2 = species-specific regression coefficients.
Net merchantable volume based on a wood fiber recovery factor of Full-Tree to Roadside Tree-Length-to-Mill harvest method (i.e., 82.1%) was calculated by converting the gross total volume [38]. The present costs from present benefits of the six forest product assortments (i.e., lumber, softwood market pulp, hardwood market pulp, newsprint, hog fuel, and pellets) produced per hectare were substrated to calculate the profit for each forest management alternative within each empirical or simulated stand age. Specifically, the mathematical expression in Equation (2) was used to calculate profit, which can be viewed as an expression of a profit maximization problem defined in simultaneous management scenarios.
a i j k = 1 n P a i j k = a i j = 1 n R a i j a i j k = 1 n C a i j k
where: P = profits, R = revenues, C = costs, a = rotation ages, i = harvest methods (i.e., FTTL, FT-SW, CTL), j = product types (i.e., lumber, softwood market pulp, newsprint, hog fuel, pellet, and hardwood market pulp), k = cost types (i.e., harvest costs, transportation costs, production costs, and silvicultural costs), which are all in 2016. We, therefore, did not use discount rates in our calculations of profit in our first method.
Since discount rates may affect economic gains, in the second method, we used 4% as the discount rate to calculate the net present value (NPV) as the economic gains. We chose 4% as the discount rate because it is commonly used to calculate the NPV [39,40]. Our analysis of the discount rate is as follows.
N P V = t = 0 n B C 1 + r n
where: NPV = net present value (USD), B = benefit (USD), C = cost (USD), r = discount rate, n = number of time periods. We note that results using both methods were qualitatively similar (trade-off relationships were identified).

2.5. Statistical Trade-Off Analysis

We used simple or polynomial regression to examine the effect of profit/NPV on total ecosystem C stocks as well as individual C pools across overstorey compositional types. We also examined the bivariate relationships between other pairs of variables (rotation age, overstorey composition, C stocks, and profit) using simple linear or quadratic polynomial regression. The most parsimonious model was chosen as having the lowest value of the Akaike Information Criterion (AIC) [41]. The assumption of normality and homogeneity were tested by using Shapiro–Wilk’s test and Bartlett’s test, respectively. If normality or homogeneity was not achieved, data were bootstrapped using the estimates of regression coefficients by using the ‘boot’ package in R with 4999 iterations to generate 95% confidence intervals (CIs) [42]. We used path analysis to link multivariate relationships between rotation age, overstorey composition, profit, and C stocks for the total ecosystem and individual C pools. The path analysis was applied using the lavaan package [43]. All analysis was conducted in R version 3.5.0 [44].

3. Results

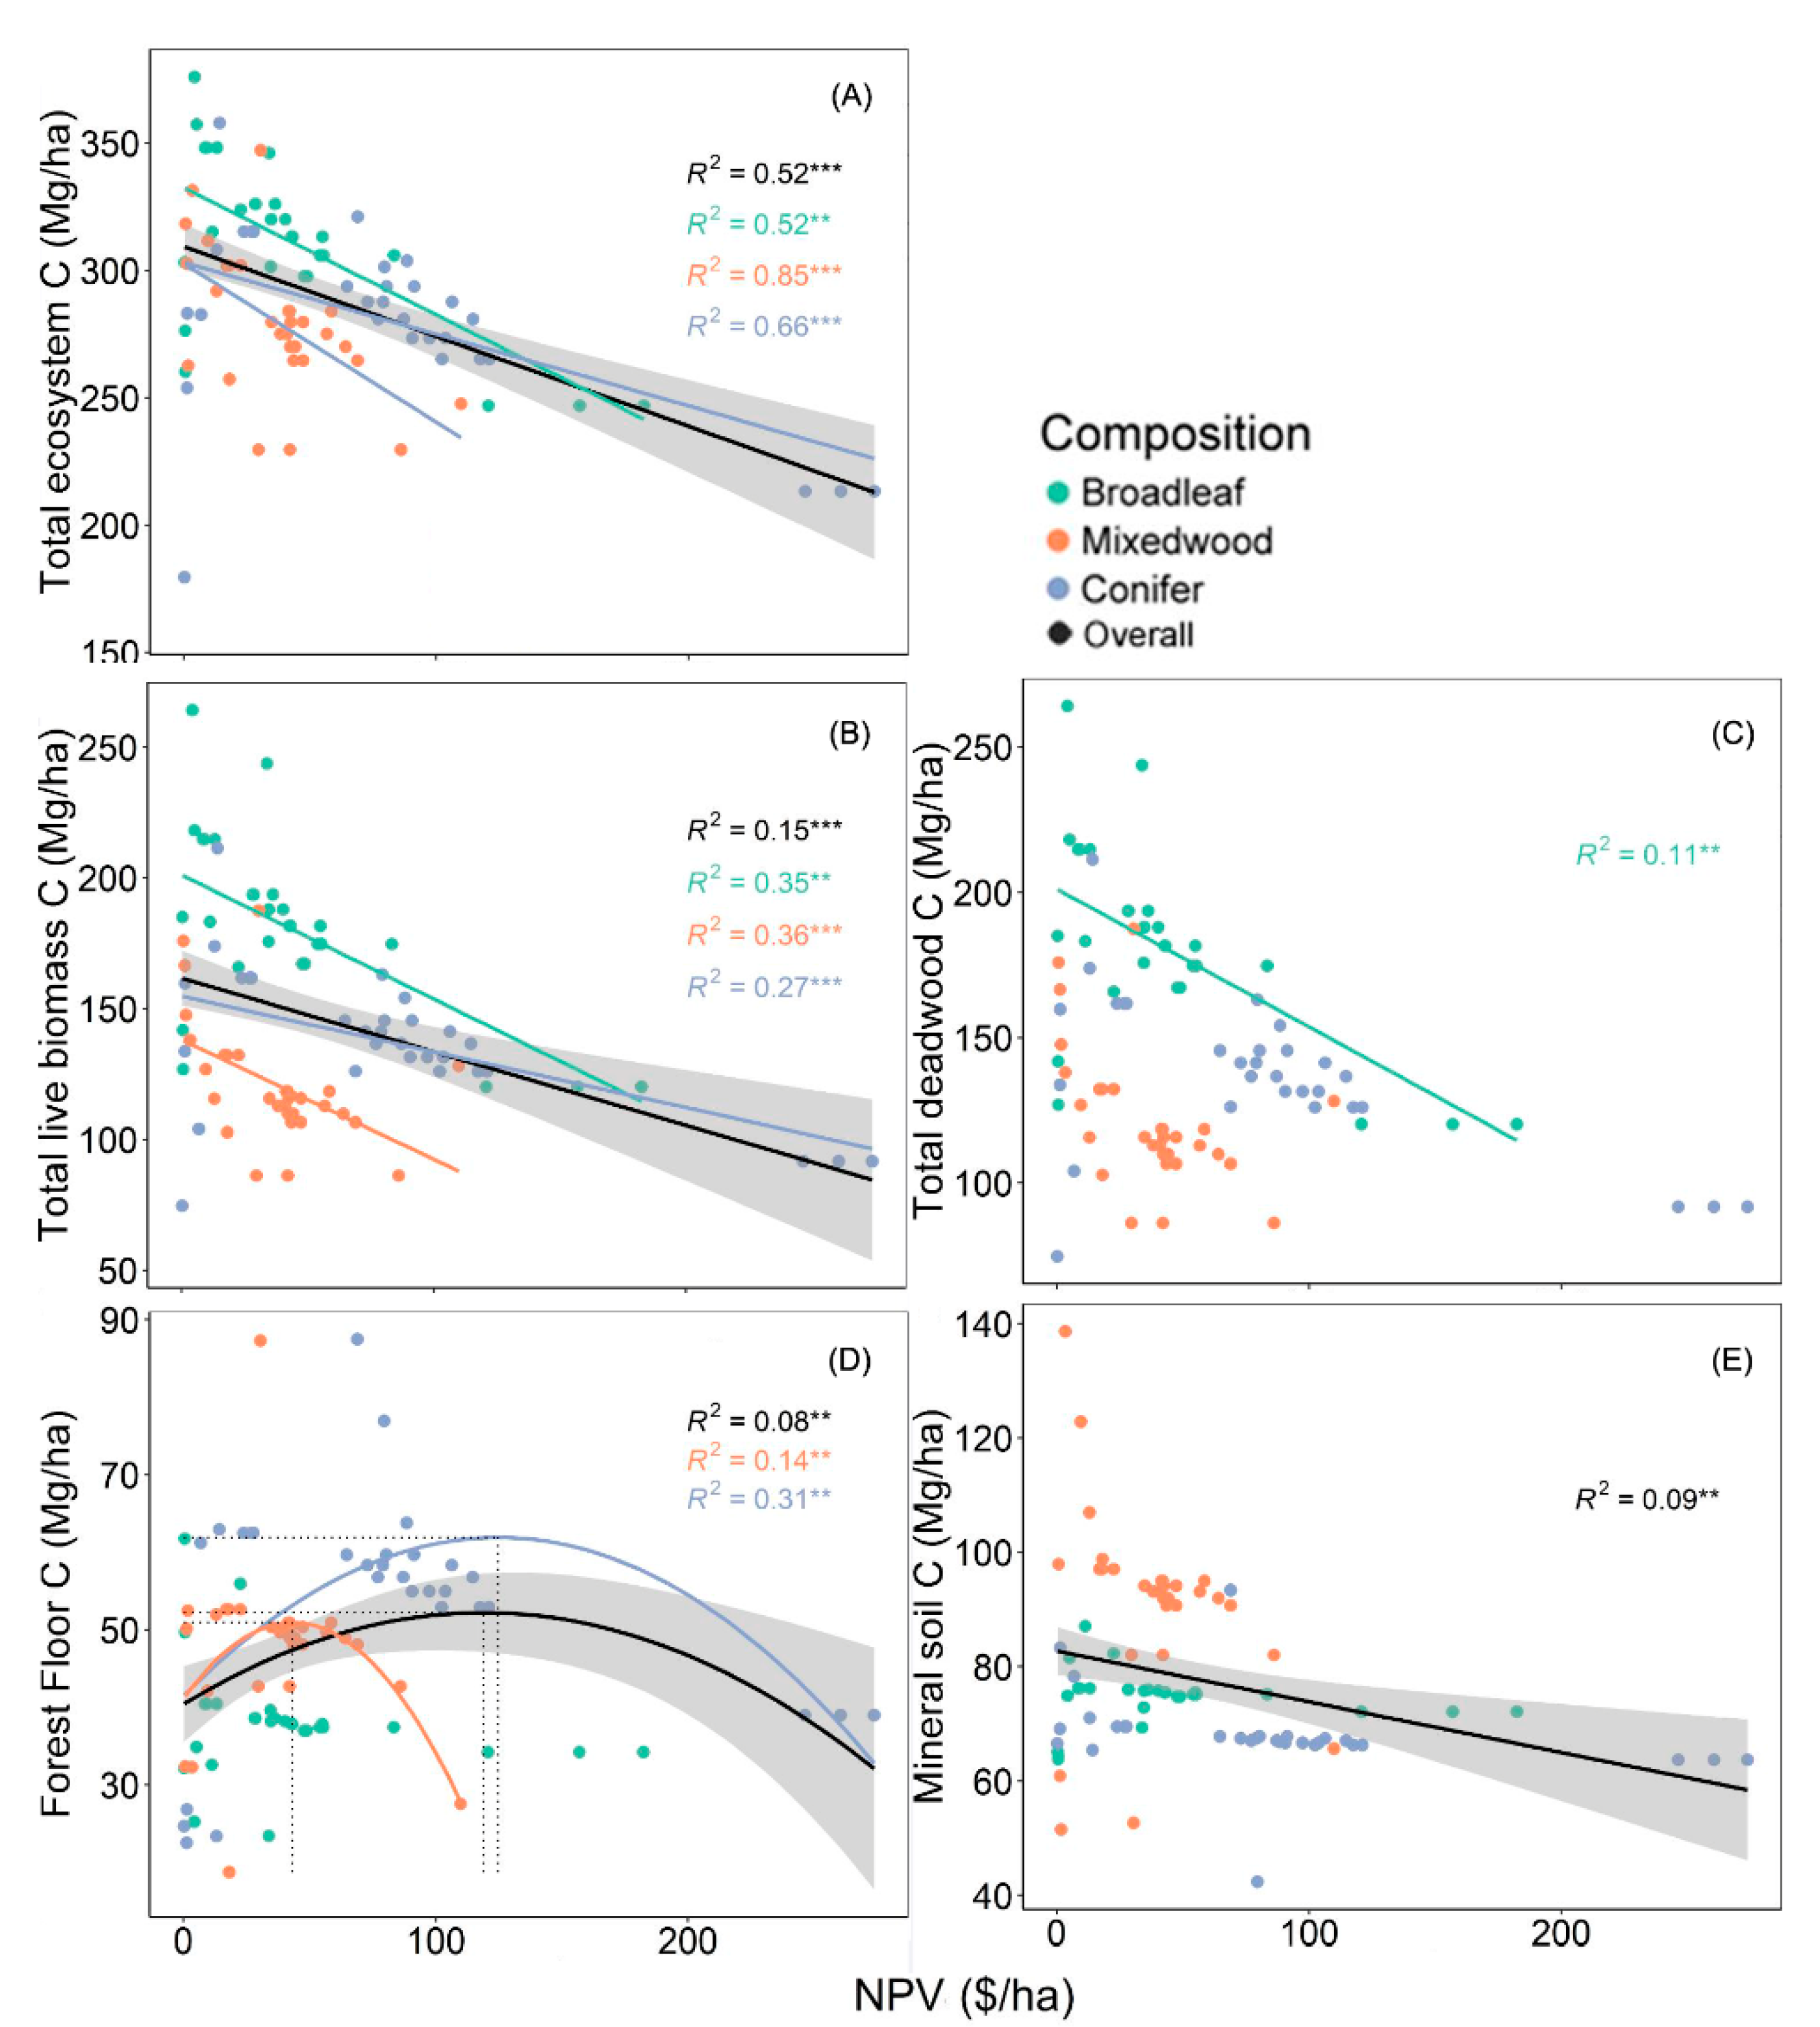
3.1. Relationship between Economic Gains and Carbon Stocks

Across all overstorey composition types and rotation ages, total ecosystem C had a hump-shaped response to profit (p < 0.001; Table S2), total ecosystem C reached a peak of 320 Mg/ha at a profit of USD 2500/ha and decreased thereafter with the increasing of profit (Figure 1A). With the maximum profit at USD 5000/ha, approximately 60% of the maximum total ecosystem C (190 Mg/ha) was attained (Figure 1A). Total ecosystem C peaked at different levels of profit among overstorey types (Figure 1A). Total ecosystem C peaked at 350 Mg/ha with a USD 1600/ha profit for the broadleaved stands, at 330 Mg/ha with a profit of USD 2600/ha in mixedwood stands, and at 310 Mg/ha with a profit of USD 3400/ha in coniferous stands.
Similar to total forest ecosystem C, profit had hump-shaped relationships with the overall C stocks of individual C pools of total live biomass, total deadwood, forest floor, and mineral soil (Figure 1B–E; Table S2). When averaged over all compositional types, trade-off curves showed total live biomass C, total deadwood C, forest floor C, and mineral soil C were maximized at 170 Mg/ha, 21 Mg/ha, 53 Mg/ha, and 80 Mg/ha with profits of USD 2600/ha, USD 2200/ha, USD 2300/ha, and USD 1600/ha, respectively. While the relationships between individual C pools and profit were predominantly hump-shaped, total deadwood C and mineral soil C increased linearly with increased profit in coniferous stands.
Since we only make forest management decisions after the minimum ecologically and biologically acceptable rotation age of 50 years, we used simple or polynomial regression to examine the effect of NPV on C stocks of the total ecosystem as well as individual C pools across overstorey compositional types after 50 years. We found a strong trade-off relationship between NPV and total ecosystem C (p < 0.001) across all overstorey composition types and rotation ages above 50 years (Figure 2A). NPV negatively affected total live biomass C across all overstorey composition types, total deadwood C in broadleaved stands, and overall mineral soil C, while NPV had hump-shaped relationships with forest floor C pool in mixedwood and coniferous stands (Figure 2B–E).

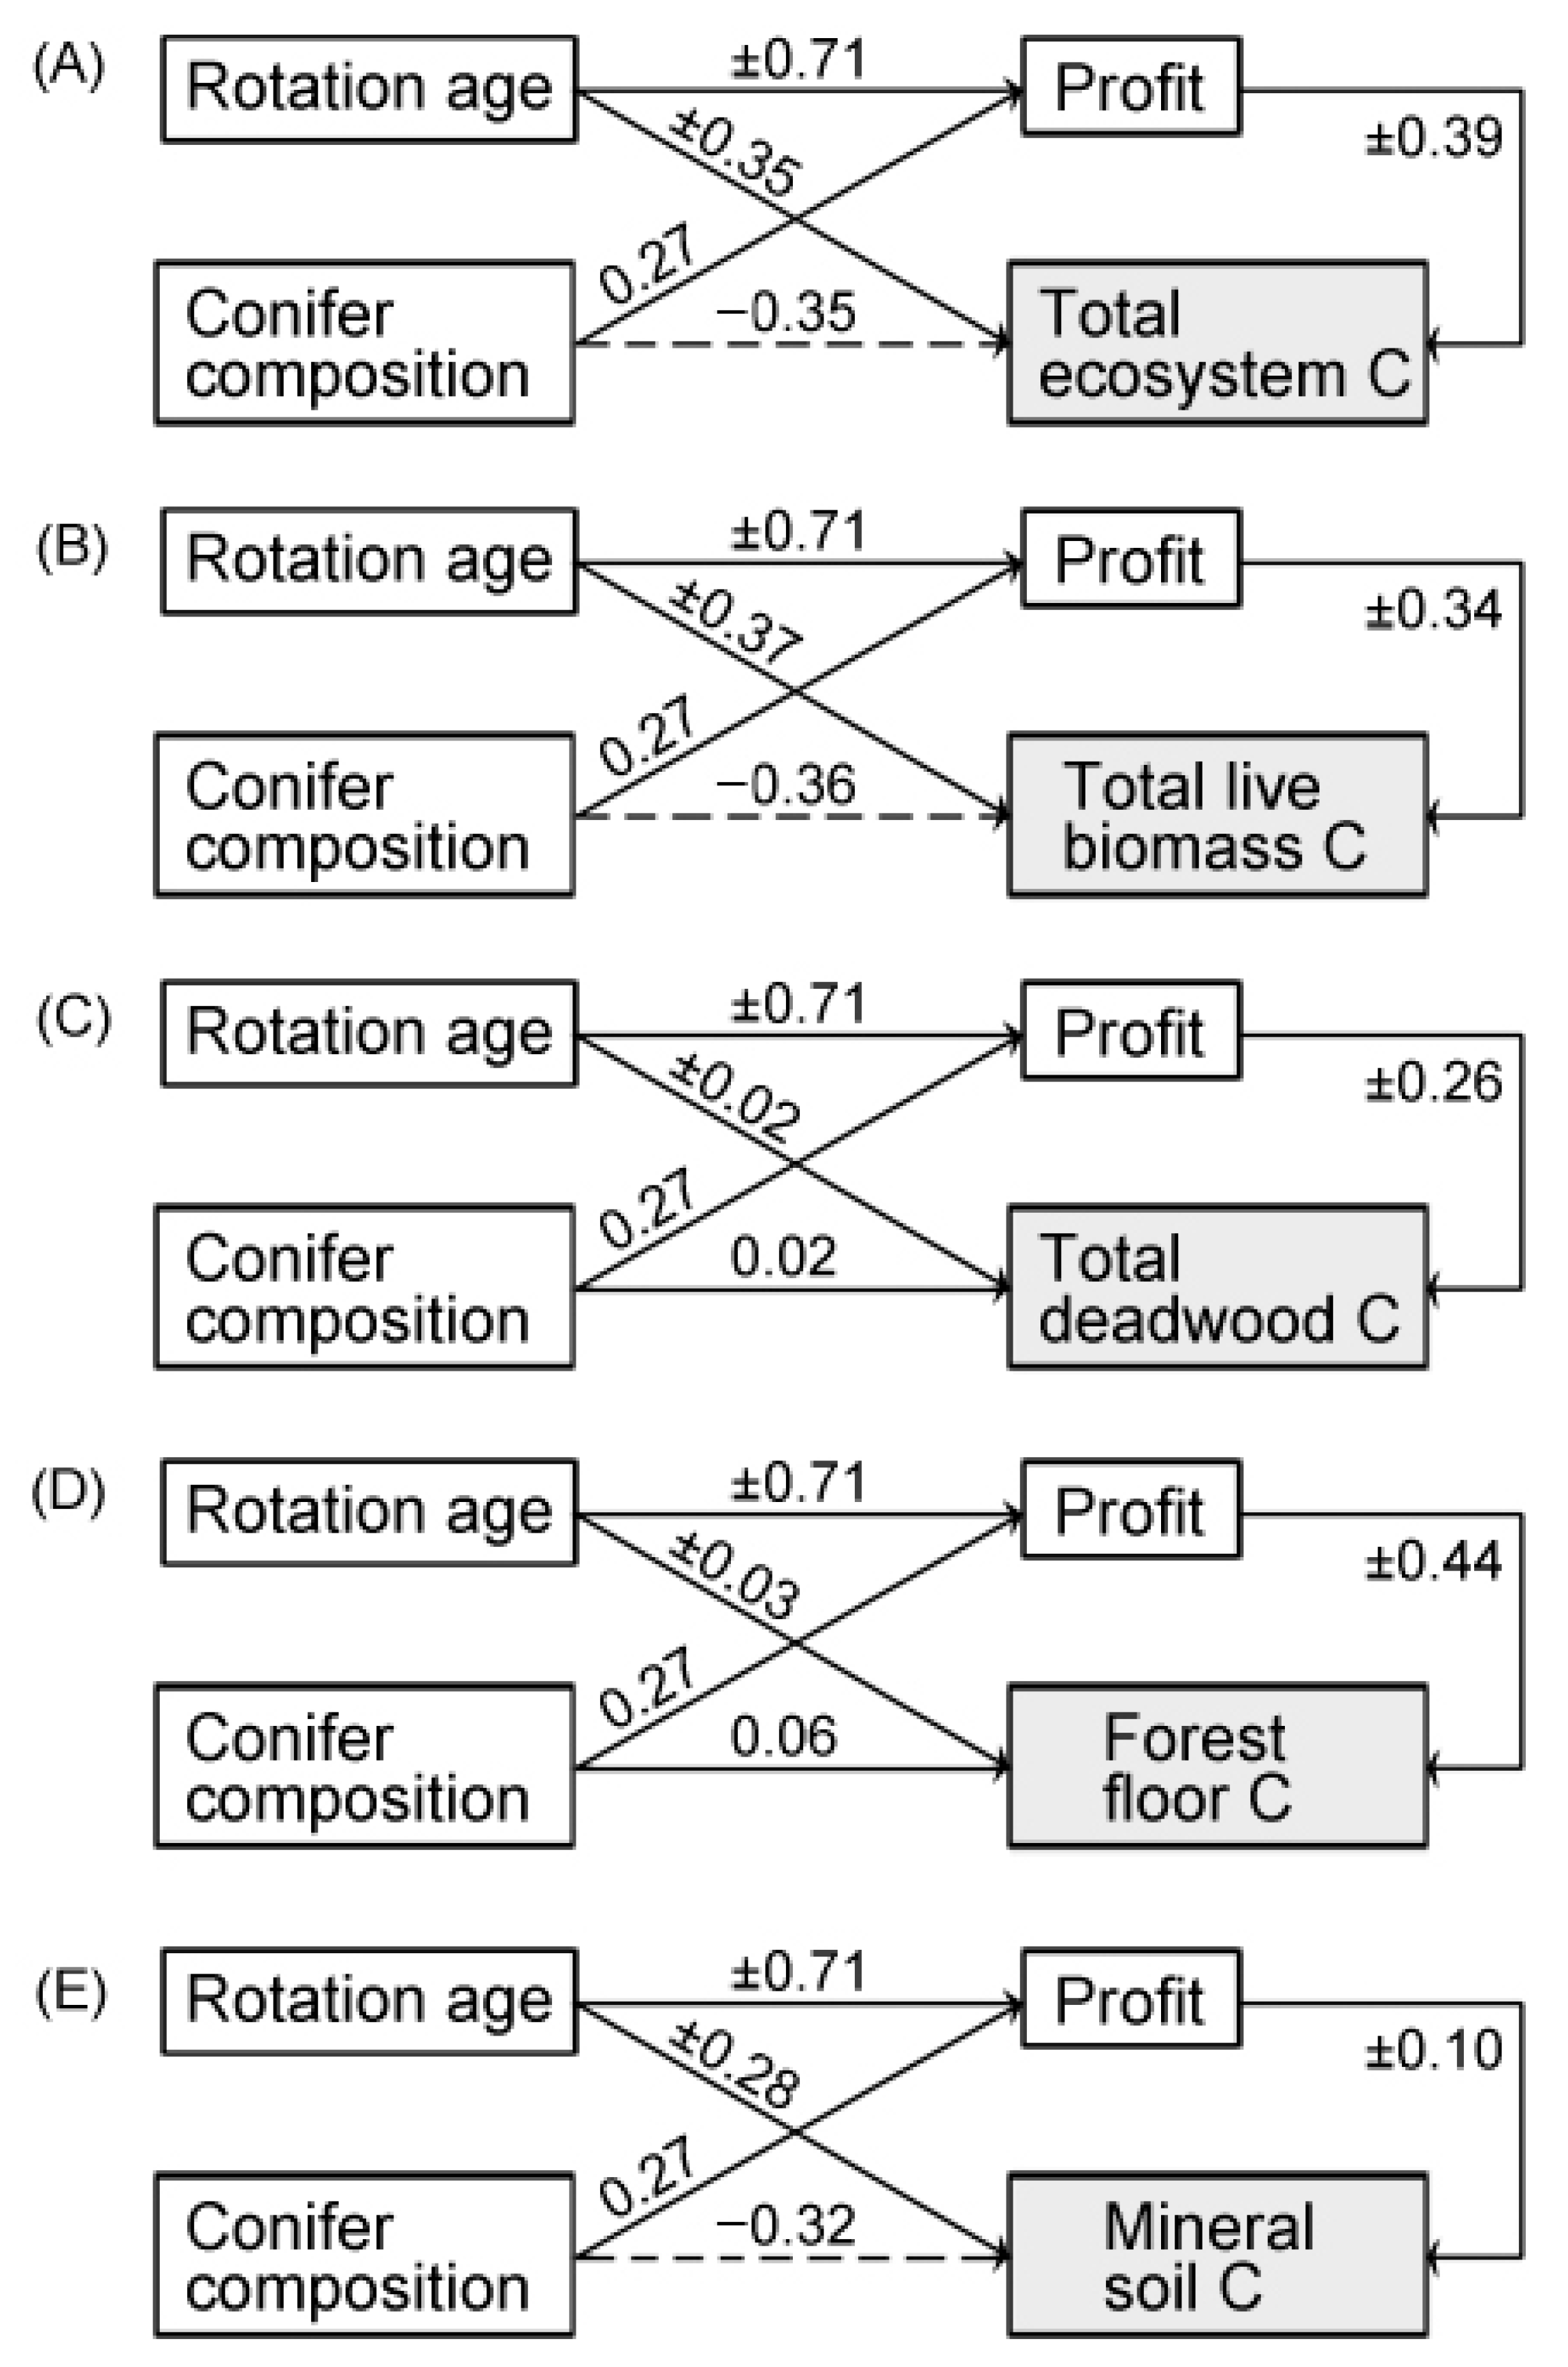
3.2. Effects of Forest Management Alternatives on Economic Gains and Carbon Stocks

Path analysis showed that rotation age initially affected profit positively but negatively thereafter, as indicated by the standardized quadratic coefficient (r = ±0.71) (Figure 3). Similarly, rotation age positively affected total ecosystem C initially but negatively thereafter (r = ±0.35) (Figure 3A). Increasing conifer composition had a positive direct effect on profit (r = 0.27) but a negative direct effect on total ecosystem C (r = −0.35) (Figure 3A), primarily resulting from a negative association between total ecosystem C and conifer composition (Figure S1). The effects of rotation age and conifer composition on profit led to a quadratic effect of profit on total ecosystem C (r = ±0.39). When analyzed by overstorey compositional type, profit increased linearly with rotation age for mixedwoods but reached the maximums at approximately 125 and 175 years for coniferous and broadleaved stands, respectively (Figure S2). Because NPV is highly affected by the discount rate, NPV reached a maximum between 50–75 years, decreased until 125 years, increased again around 175 years, and decreased thereafter (Figure S3).
For individual C pools, rotation age quadratically affected total live biomass C (r = ±0.37), total deadwood C (r = ±0.02), forest floor C (r = ±0.03), and mineral soil C (r = ±0.28). Increasing conifer composition had positive direct effects on total deadwood C (r = 0.02) and forest floor C (r = 0.06), but negative direct effects on total live biomass C (r = −0.36) and mineral soil C (r = −0.32) (Figure 3B–E). The analysis of bivariate relationships confirmed these path coefficients (Figure S1). Similarly, C stocks of all C pools were affected by profit quadratically, resulting from the effects of rotation age and conifer composition on the relationship between profit and the total live biomass C, total deadwood C, forest floor C, and mineral soil C.

4. Discussion

This analysis, to our knowledge, is the first to empirically evaluate the relationship between economic gains and C stocks in response to forest management alternatives across diverse C pools in forest ecosystems. We found a hump-shaped relationship between economic gains and total ecosystem C and live biomass C. Extraction of the maximum economic gain (USD 5000/ha) could lead to approximately 40% loss from the maximum total ecosystem C while giving up 50% of the economic gain to USD 2500/ha, the maximum total ecosystem C (320 Mg/ha) could be attained. These trade-off results are consistent with those of previous simulation studies [4,6,45]. The initial synergic phase can be attributable to the fact that the increasing total live biomass C simultaneously affect total ecosystem C and economic gains with the increases in stand ages and changes in overstorey compositions. However, extended rotation age can lead to reduced live biomass due to increasing longevity-driven tree mortality [19] and compositional shifts from more productive early-successional species to less productive late-successional species [28,46,47]. On the other hand, late-successional coniferous species had higher economic gains due to their higher market values [15], while early-successional broadleaved species had higher total ecosystem C because of their higher productivity [21,48,49]. The reduced total ecosystem C and live biomass C at high levels of economic gains (Figure 1) are therefore attributed to their contrasting responses to extended rotation age and changes in overstorey composition, leading to the trade-offs.
We also found hump-shaped relationships between economic gains and the C pools of deadwood, forest floor, and mineral soil, with the exceptions of deadwood C and mineral soil C in coniferous stands. At low levels of economic gains, the synergic relationships between economic gains and the C pools of deadwood, forest floor, and mineral soil are attributable to simultaneous increases in live biomass and its feedback to dead C pools with stand development following a stand-replacing disturbance in boreal forests [50]. During canopy breakup at the canopy transition stage, live biomass loss takes place sooner than increased forest floor and soil organic matter decomposition [51]. Moreover, coniferous stands with higher economic gains, however, have less forest floor than broadleaved stands due to the slow-decomposing needle leaf litter [52]. Conversely, broadleaved and mixedwood stands support a higher density and diversity of understory vegetation with a higher turnover rate [22]. These divergent responses to coniferous composition and stand aging between economic gains and the C pools of deadwood, forest floor, and mineral soil lead to their trade-offs at the high levels of economic gains.
As coniferous stands age, their increasingly shade-tolerant bryophyte species and slow decomposition rates of deadwood and aboveground litterfall could lead to the accumulation of deadwood C [53,54,55]. As a major source of soil organic C, the slower decomposition rates of fine coniferous roots may also contribute to its higher mineral soil C [56,57]. In the meantime, economic gains tend to increase with stand aging in coniferous stands [15]. These simultaneous increases in deadwood and mineral soil C pools and economic gains following stand development in the coniferous stands are attributable to their synergic relationships.
Our results showed that the choices of forest management alternatives affected the economic gain–C stock relationships, and it is difficult to achieve the highest levels of economic gains and C stocks simultaneously. This result is consistent with a previous study demonstrating that forest management aiming for all-encompassing objectives is not possible [11]. Different overstorey types have different slopes and intercepts—broadleaf seems to be the best option for NPV–C stock relationships, but this does not mean the broadleaf shall be used everywhere because conifers support unique biodiversity that broadleaf can not. If the objective of forest management is to maximize economic gains from wood harvest, coniferous or mixedwood stands with intermediate rotation ages are recommended, with approximately 60% of the total peak ecosystem C. If the forest management objective is to maximize total ecosystem C while maintaining an economically viable management regime, mixedwood stands with intermediate ages are recommended, but approximately 50% of the maximum economic gains have to be given up. Moreover, promoting broadleaved stands could maximize total ecosystem C at an earlier rotation age with low economic gains, and mixedwood stands could provide higher total ecosystem C with intermediate economic gains, whereas managing for coniferous stands with intermediate to long rotations is an optimal management option that provides both higher C stocks and economic gains among all the alternatives. Managing economic gain–C stock relationships can help avoid undesirable trade-offs while enhancing their synergies [58,59]. Silvicultural operations such as site preparation, planning or seeding, tending, and thinning are manipulated to different intensities in renewing the forest and achieving different forest compositions [60,61]. However, only thinnings are not traditionally applied in the management alternatives, particularly in the natural boreal forest, to control economic gains. Negative externalities of wood harvest could be integrated into the profit maximization framework by a Pigouvian tax/subsidy or by creating a forest carbon market. These results provide broad guides for forest managers and decision-makers towards “win-win” scenarios for economic gains and C stocks in boreal forests.
We acknowledge that our interpretation has some limitations. Firstly, because economic gains are sensitive to the discount rate; therefore, the economic gain–C stock relationship also changes with the discount rate. Our additional analysis by accounting for the discount rate (Figure 2) reached a similar trade-off conclusion with the profit–C stock relationship. Secondly, the results of our study may be influenced by the effect of the small sample size of the stands where plots were measured in the empirical analysis. Finally, optimizing economic and C objectives, in particular, by promoting broadleaved or coniferous stands, could be detrimental to other ecological objectives, for example, with respect to biodiversity [62]. Therefore, further research into trade-offs investigating multiple ecological objectives, including habitat functions and supporting services, regulation functions and regulating services, and information functions and cultural services, should be simultaneously examined, as suggested previously [63].

5. Conclusions

Based on empirical data of economic gains and diverse C pools in boreal forests across a range of forest management alternatives, our findings offer new insights into the economic gain–C stock relationships for sustainable forest management. We found hump-shaped trade-off relationships between economic gains and total ecosystem C and the C pools of total live biomass, deadwood, forest floor, and mineral soil. Maximizing potential economic extraction can result in trade-offs with C stocks, but it is possible to optimize economic and C objectives by promoting coniferous stands with intermediate rotation ages. Our findings can help forest policy-makers and managers to formulate policies towards “win-win” scenarios for economic gains and C stocks in boreal forests.

Supplementary Materials

The following supporting information can be downloaded at: https://www.mdpi.com/article/10.3390/f13111777/s1, Table S1: Characteristics of the 45 sample stands in the boreal forests of Ontario, Canada; Table S2: The relationships between total ecosystem carbon, total live biomass carbon, total deadwood carbon, forest floor carbon, mineral soil carbon and profit for overall and individual overstorey compositions; Figure S1: Trends in total ecosystem carbon (C), total live biomass C, total deadwood C, forest floor C and mineral soil C with rotation age and overstorey compositions. The lines indicate smooth functions of the best model fit for the long-term trends using general additive models (GAM). Solid lines represent statistically significant trends while dashed lines show the insignificant trends. Shaded regions are the approximate 95% confidence intervals. Adjusted R2 values indicate the model fit. Significant differences (α = 0.05). Significant codes (p-value): 0 ‘***’, 0.001 ‘**’, 0.01 ‘*’; Figure S2: Trends in changing profits with rotation ages and overstorey compositions. The lines indicate smooth functions of the best model fit for the long-term trends using general additive models (GAM). Shaded regions are the approximate 95% confidence intervals. Adjusted R2 values indicate the model fit. Significant differences (α = 0.05). Significant codes (p-value): 0 ‘***’, 0.001 ‘**’, 0.01 ‘*’; Figure S3: Trends in changing the net present value (NPV) with rotation ages and overstorey compositions. The lines indicate smooth functions of the best model fit for the long-term trends using general additive models (GAM). Shaded regions are the approximate 95% confidence intervals. Adjusted R2 values indicate the model fit. Significant differences (α = 0.05). Significant codes (p-value): 0 ‘***’, 0.001 ‘**’, 0.01 ‘*’.

Author Contributions

S.C., Z.M. and H.Y.H.C. designed the study. S.C. and Z.M. collected data. S.C. and Z.M. analyzed the data. S.C., C.S., H.Y.H.C., Z.M. and H.C. wrote interactively through multiple rounds of revisions. All authors have read and agreed to the published version of the manuscript.

Funding

This research was funded by Natural Sciences Engineering Research Council of Canada (RGPIN-2014-04181, STPGP428641, and STPGP 506284), National Natural Science Foundation of China (32101272) and Young Teachers Team Project of Fundamental Research Funds for the Central Universities, Sun Yat-sen University (Project no. 22qntd2702).

Data Availability Statement

Data available in a publicly accessible repository. The data presented in this study are openly available in FigShare at https://doi.org/10.6084/m9.figshare.21400839, accessed on 23 September 2022.

Acknowledgments

We thank Eric Bryan Searle for assisting with data analysis.

Conflicts of Interest

The authors declare no conflict of interest.

References

  1. Anonymous; Millennium Ecosystem Assessment. Ecosystems and Human Well-Being: Biodiversity Synthesis. Ecol. Manag. Restor. 2005, 6, 226–227. [Google Scholar]
  2. Duncker, P.S.; Raulund-Rasmussen, K.; Gundersen, P.; Katzensteiner, K.; De Jong, J.; Ravn, H.P.; Smith, M.; Eckmuellner, O.; Spiecker, H. How Forest Management Affects Ecosystem Services, Including Timber Production and Economic Return: Synergies and Trade-Offs. Ecol. Soc. 2012, 17, 50. [Google Scholar] [CrossRef] [Green Version]
  3. Houghton, R.A. Balancing the Global Carbon Budget. Annu. Rev. Earth Planet. Sci. 2007, 35, 313–347. [Google Scholar] [CrossRef] [Green Version]
  4. Trivino, M.; Juutinen, A.; Mazziotta, A.; Miettinen, K.; Podkopaev, D.; Reunanen, P.; Monkkonen, M. Managing a Boreal Forest Landscape for Providing Timber, Storing and Sequestering Carbon. Ecosyst. Serv. 2015, 14, 179–189. [Google Scholar] [CrossRef]
  5. Strengbom, J.; Axelsson, E.P.; Lundmark, T.; Nordin, A. Trade-Offs in the Multi-Use Potential of Managed Boreal Forests. J. Appl. Ecol. 2018, 55, 958–966. [Google Scholar] [CrossRef]
  6. Schwenk, W.S.; Donovan, T.M.; Keeton, W.S.; Nunery, J.S. Carbon Storage, Timber Production, and Biodiversity: Comparing Ecosystem Services with Multi-Criteria Decision Analysis. Ecol. Appl. 2012, 22, 1612–1627. [Google Scholar] [CrossRef]
  7. Kline, J.D.; Harmon, M.E.; Spies, T.A.; Morzillo, A.T.; Pabst, R.J.; McComb, B.C.; Schnekenburger, F.; Olsen, K.A.; Csuti, B.; Vogeler, J.C. Evaluating Carbon Storage, Timber Harvest, and Habitat Possibilities for a Western Cascades (USA) Forest Landscape. Ecol. Appl. 2016, 26, 2044–2059. [Google Scholar] [CrossRef]
  8. Kang, H.; Seely, B.; Wang, G.; Innes, J.; Zheng, D.; Chen, P.; Wang, T.; Li, Q. Evaluating Management Tradeoffs between Economic Fiber Production and Other Ecosystem Services in a Chinese-Fir Dominated Forest Plantation in Fujian Province. Sci. Total Environ. 2016, 557, 80–90. [Google Scholar] [CrossRef]
  9. Seidl, R.; Rammer, W.; Jaeger, D.; Currie, W.S.; Lexer, M.J. Assessing Trade-Offs between Carbon Sequestration and Timber Production within a Framework of Multi-Purpose Forestry in Austria. For. Ecol. Manag. 2007, 248, 64–79. [Google Scholar] [CrossRef]
  10. Rana, E.; Thwaites, R.; Luck, G. Trade-Offs and Synergies between Carbon, Forest Diversity and Forest Products in Nepal Community Forests. Environ. Conserv. 2017, 44, 5–13. [Google Scholar] [CrossRef] [Green Version]
  11. Trivino, M.; Pohjanmies, T.; Mazziotta, A.; Juutinen, A.; Podkopaev, D.; Le Tortorec, E.; Monkkonen, M. Optimizing Management to Enhance Multifunctionality in a Boreal Forest Landscape. J. Appl. Ecol. 2017, 54, 61–70. [Google Scholar] [CrossRef]
  12. Lagergren, F.; Jonsson, A.M. Ecosystem Model Analysis of Multi-Use Forestry in a Changing Climate. Ecosyst. Serv. 2017, 26, 209–224. [Google Scholar] [CrossRef]
  13. Dixon, R.K.; Brown, S.; Houghton, R.A.; Solomon, A.M.; Trexler, M.C.; Wisniewski, J. Carbon Pools and Flux of Global Forest Ecosystems. Science 1994, 263, 185–190. [Google Scholar] [CrossRef] [PubMed]
  14. Pan, Y.; Birdsey, R.A.; Fang, J.; Houghton, R.; Kauppi, P.E.; Kurz, W.A.; Phillips, O.L.; Shvidenko, A.; Lewis, S.L.; Canadell, J.G.; et al. A Large and Persistent Carbon Sink in the World’s Forests. Science 2011, 333, 988–993. [Google Scholar] [CrossRef] [PubMed] [Green Version]
  15. Chen, S.; Shahi, C.; Chen, H.Y.H.; McLaren, B. Economic Analysis of Forest Management Alternatives: Compositional Objectives, Rotation Ages, and Harvest Methods in Boreal Forests. For. Policy Econ. 2017, 85, 124–134. [Google Scholar] [CrossRef]
  16. Gao, B.; Taylor, A.R.; Searle, E.B.; Kumar, P.; Ma, Z.; Hume, A.M.; Chen, H.Y.H. Carbon Storage Declines in Old Boreal Forests Irrespective of Succession Pathway. Ecosystems 2018, 21, 1168–1182. [Google Scholar] [CrossRef]
  17. Liski, J.; Pussinen, A.; Pingoud, K.; MskipSs, R.; Karjalainen, T. Which Rotation Length Is Favourable to Carbon Sequestration? Can. J. For. Res. 2001, 31, 2004–2013. [Google Scholar] [CrossRef]
  18. Nakajima, T.; Shiraishi, N.; Kanomata, H.; Matsumoto, M. A Method to Maximise Forest Profitability through Optimal Rotation Period Selection under Various Economic, Site and Silvicultural Conditions. N. Z. J. For. Sci. 2017, 47, 4. [Google Scholar] [CrossRef] [Green Version]
  19. Luo, Y.; Chen, H.Y.H. Competition, Species Interaction and Ageing Control Tree Mortality in Boreal Forests. J. Ecol. 2011, 99, 1470–1480. [Google Scholar] [CrossRef]
  20. Seedre, M.; Chen, H.Y.H. Carbon Dynamics of Aboveground Live Vegetation of Boreal Mixedwoods after Wildfire and Clear-Cutting. Can. J. For. Res. 2010, 40, 1862–1869. [Google Scholar] [CrossRef]
  21. Laganiere, J.; Cavard, X.; Brassard, B.W.; Pare, D.; Bergeron, Y.; Chen, H.Y.H. The Influence of Boreal Tree Species Mixtures on Ecosystem Carbon Storage and Fluxes. For. Ecol. Manag. 2015, 354, 119–129. [Google Scholar] [CrossRef]
  22. Hart, S.A.; Chen, H.Y.H. Fire, Logging, and Overstory Affect Understory Abundance, Diversity, and Composition in Boreal Forest. Ecol. Monogr. 2008, 78, 123–140. [Google Scholar] [CrossRef]
  23. Ma, Z.; Chen, H.Y.H. Effects of Species Diversity on Fine Root Productivity Increase with Stand Development and Associated Mechanisms in a Boreal Forest. J. Ecol. 2017, 105, 237–245. [Google Scholar] [CrossRef]
  24. Ma, Z.; Chen, H.Y.H.; Kumar, P.; Gao, B. Species Mixture Increases Production Partitioning to Belowground in a Natural Boreal Forest. For. Ecol. Manag. 2019, 432, 667–674. [Google Scholar] [CrossRef]
  25. Environment Canada. Canadian Climate Normals 1981–2010. 2016. Available online: http://climate.weatheroffice.gc.ca/climate_normals/index_e.html (accessed on 1 February 2018).
  26. Senici, D.; Chen, H.Y.H.; Bergeron, Y.; Cyr, D. Spatiotemporal Variations of Fire Frequency in Central Boreal Forest. Ecosystems 2010, 13, 1227–1238. [Google Scholar] [CrossRef]
  27. Shrestha, B.M.; Chen, H.Y.H. Effects of Stand Age, Wildfire and Clearcut Harvesting on Forest Floor in Boreal Mixedwood Forests. Plant Soil 2010, 336, 267–277. [Google Scholar] [CrossRef]
  28. Chen, H.Y.H.; Popadiouk, R.V. Dynamics of North American Boreal Mixedwoods. Environ. Rev. 2002, 10, 137–166. [Google Scholar] [CrossRef]
  29. Legendre, P.; Legendre, L. Numerical Ecology; Elsevier Science, B.V.: Amsterdam, The Netherlands, 1998. [Google Scholar]
  30. Hume, A.; Chen, H.Y.H.; Taylor, A.R.; Kayahara, G.J.; Man, R. Soil C:N:P Dynamics During Secondary Succession Following Fire in the Boreal Forest of Central Canada. For. Ecol. Manag. 2016, 369, 1–9. [Google Scholar] [CrossRef]
  31. Gao, B.; Taylor, A.R.; Chen, H.Y.H.; Wang, J. Variation in Total and Volatile Carbon Concentration among the Major Tree Species of the Boreal Forest. For. Ecol. Manag. 2016, 375, 191–199. [Google Scholar] [CrossRef]
  32. Intergovernmental Panel on Climate Change (IPCC). Climate Change 2013: The Physical Science Basis. Contribution of Working Group I to the Fifth Assessment Report of the Intergovernmental Panel on Climate Change; Intergovernmental Panel on Climate Change: Geneva, Switzerland, 2013.
  33. Garrett, L.G.; Kimberley, M.O.; Oliver, G.R.; Pearce, S.H.; Beets, P.N. Decomposition of Coarse Woody Roots and Branches in Managed Pinus Radiata Plantations in New Zealand—A Time Series Approach. For. Ecol. Manag. 2012, 269, 116–123. [Google Scholar] [CrossRef]
  34. Wairiu, M.; Lal, R. Soil Organic Carbon in Relation to Cultivation and Topsoil Removal on Sloping Lands of Kolombangara, Solomon Islands. Soil Tillage Res. 2003, 70, 19–27. [Google Scholar] [CrossRef]
  35. Willcocks, A.J.; Bell, F.W.; Williams, J.; Duinker, P.N. A Crop-Planning Process for Northern Ontario Forests: Planning Process for Northern Ontario Forests; Ministry of Natural Resources, Northwestern Ontario Forest Technology Development Unit: Thunder Bay, ON, Canada, 1997. [Google Scholar]
  36. Woods, M.E.; Robinson, D.C.E. Development of Fvsontario: A Forest Vegetation Simulator Variant and Application Software for Ontario. In Proceedings of the 3rd Forest Vegetation Simulator Conference, Fort Collins, CO, USA, 13–15 February 2007. [Google Scholar]
  37. Honer, T.G. Metric Timber Tables for the Commercial Tree Species of Central and Eastern Canada; Environment Canada: Fredericton, NB, Canada; Canadian Forestry Service: Fredericton, NB, Canada; Maritimes Forest Research Centre: Fredericton, NB, Canada, 1983.
  38. Ride, K.R. An Investigation of Wood Fibre Recovery and Related Economics of Four Harvesting Systems Common to Northwestern Ontario; National Library of Canada: Ottawa, ON, Canada, 2001. [Google Scholar]
  39. Guo, J.H.; Cameron, J.H.; Tol, R.S.J.; Anthoff, D. Discounting and the Social Cost of Carbon: A Closer Look at Uncertainty. Environ. Sci. Policy 2006, 9, 205–216. [Google Scholar] [CrossRef]
  40. Kumar, P.; Brondiízio, E.; Elmqvist, T.; Gatzweiler, F.; Gowdy, J.; de Groot, D.; Muradian, R.; Pascual, U.; Reyers, B.; Smith, R. Key Messages and Linkages with National and Local Policies: The Economics of Ecosystems and Biodiversity. Ecologic and Economic Foundations; Earthscan: London UK; Washington, DC, USA, 2010. [Google Scholar]
  41. Burnham, K.P.; Anderson, D.R. Model Selection and Multi-Model Inference: A Practical Information-Theoretic Approach; Springer: New York, NY, USA, 2002. [Google Scholar]
  42. Adams, D.C.; Gurevitch, J.; Rosenberg, M.S. Resampling Tests for Meta-Analysis of Ecological Data. Ecology 1997, 78, 1277–1283. [Google Scholar] [CrossRef]
  43. Rosseel, Y. Lavaan: An R Package for Structural Equation Modeling. J. Stat. Softw. 2012, 48, 1–36. [Google Scholar] [CrossRef] [Green Version]
  44. R Core Team. R: A Language and Environment for Statistical Computing; R Core Team: Vienna, Austria, 2013. [Google Scholar]
  45. Pyorala, P.; Peltola, H.; Strandman, H.; Antti, K.; Antti, A.; Jylha, K.; Kellomaki, S. Effects of Management on Economic Profitability of Forest Biomass Production and Carbon Neutrality of Bioenergy Use in Norway Spruce Stands under the Changing Climate. Bioenergy Res. 2014, 7, 279–294. [Google Scholar] [CrossRef]
  46. Taylor, A.R.; Seedre, M.; Brassard, B.W.; Chen, H.Y.H. Decline in Net Ecosystem Productivity Following Canopy Transition to Late-Succession Forests. Ecosystems 2014, 17, 778–791. [Google Scholar] [CrossRef]
  47. Pare, D.; Bergeron, Y. Above-Ground Biomass Accumulation Along a 230-Year Chronosequence in the Southern Portion of the Canadian Boreal Forest. J. Ecol. 1995, 83, 1001–1007. [Google Scholar] [CrossRef]
  48. Augusto, L.; De Schrijver, A.; Vesterdal, L.; Smolander, A.; Prescott, C.; Ranger, J. Influences of Evergreen Gymnosperm and Deciduous Angiosperm Tree Species on the Functioning of Temperate and Boreal Forests. Biol. Rev. 2015, 90, 444–466. [Google Scholar] [CrossRef] [PubMed]
  49. Hart, S.A.; Chen, H.Y.H. Understory Vegetation Dynamics of North American Boreal Forests. Crit. Rev. Plant Sci. 2006, 25, 381–397. [Google Scholar] [CrossRef]
  50. Seedre, M.; Shrestha, B.M.; Chen, H.Y.H.; Colombo, S.; Jogiste, K. Carbon Dynamics of North American Boreal Forest after Stand Replacing Wildfire and Clearcut Logging. J. For. Res. 2011, 16, 168–183. [Google Scholar] [CrossRef]
  51. Laganiere, J.; Pare, D.; Bergeron, Y.; Chen, H.Y.H. The Effect of Boreal Forest Composition on Soil Respiration Is Mediated through Variations in Soil Temperature and C Quality. Soil Biol. Biochem. 2012, 53, 18–27. [Google Scholar] [CrossRef]
  52. Laganiere, J.; Pare, D.; Bergeron, Y.; Chen, H.Y.H.; Brassard, B.W.; Cavard, X. Stability of Soil Carbon Stocks Varies with Forest Composition in the Canadian Boreal Biome. Ecosystems 2013, 16, 852–865. [Google Scholar] [CrossRef]
  53. Lang, S.I.; Cornelissen, J.H.C.; Klahn, T.; van Logtestijn, R.S.P.; Broekman, R.; Schweikert, W.; Aerts, R. An Experimental Comparison of Chemical Traits and Litter Decomposition Rates in a Diverse Range of Subarctic Bryophyte, Lichen and Vascular Plant Species. J. Ecol. 2009, 97, 886–900. [Google Scholar] [CrossRef]
  54. Brassard, B.W.; Chen, H.Y.H. Effects of Forest Type and Disturbance on Diversity of Coarse Woody Debris in Boreal Forest. Ecosystems 2008, 11, 1078–1090. [Google Scholar] [CrossRef]
  55. Shorohova, E.; Kapitsa, E.; Kazartsev, I.; Romashkin, I.; Polevoi, A.; Kushnevskaya, H. Tree Species Traits Are the Predominant Control on the Decomposition Rate of Tree Log Bark in a Mesic Old-Growth Boreal Forest. For. Ecol. Manag. 2016, 377, 36–45. [Google Scholar] [CrossRef]
  56. Silver, W.L.; Miya, R.K. Global Patterns in Root Decomposition: Comparisons of Climate and Litter Quality Effects. Oecologia 2001, 129, 407–419. [Google Scholar] [CrossRef]
  57. Ma, Z.; Chen, H.Y.H. Positive Species Mixture Effects on Fine Root Turnover and Mortality in Natural Boreal Forests. Soil Biol. Biochem. 2018, 121, 130–137. [Google Scholar] [CrossRef]
  58. Bennett, E.M.; Peterson, G.D.; Gordon, L.J. Understanding Relationships among Multiple Ecosystem Services. Ecol. Lett. 2009, 12, 1394–1404. [Google Scholar] [CrossRef] [PubMed]
  59. van der Plas, F.; Ratcliffe, S.; Ruiz-Benito, P.; Scherer-Lorenzen, M.; Verheyen, K.; Wirth, C.; Zavala, M.A.; Ampoorter, E.; Baeten, L.; Barbaro, L.; et al. Continental Mapping of Forest Ecosystem Functions Reveals a High but Unrealised Potential for Forest Multifunctionality. Ecol. Lett. 2018, 21, 31–42. [Google Scholar] [CrossRef] [PubMed] [Green Version]
  60. Fu, S.; Bell, F.W.; Chen, H.Y.H. Long-Term Effects of Intensive Silvicultural Practices on Productivity, Composition, and Structure of Northern Temperate and Boreal Plantations in Ontario, Canada. For. Ecol. Manag. 2007, 241, 115–126. [Google Scholar] [CrossRef]
  61. Bell, F.W.; Parton, J.; Stocker, N.; Joyce, D.; Reid, D.; Wester, M.; Stinson, A.; Kayahara, G.; Towill, B. Developing a Silvicultural Framework and Definitions for Use in Forest Management Planning and Practice. For. Chron. 2008, 84, 678–693. [Google Scholar] [CrossRef]
  62. Chen, S.; Shahi, C.; Chen, H.Y.H.; Kumar, P.; Ma, Z.; McLaren, B. Trade-Offs and Synergies between Economic Gains and Plant Diversity across a Range of Management Alternatives in Boreal Forests. Ecol. Econ. 2018, 151, 162–172. [Google Scholar] [CrossRef]
  63. Chen, S.; Shahi, C.; Chen, H.Y.H. Economic and Ecological Trade-Off Analysis of Forest Ecosystems: Options for Boreal Forests. Environ. Rev. 2016, 24, 348–361. [Google Scholar] [CrossRef]
Figure 1. Trends in (A) total ecosystem C, (B) total live biomass C, (C) total deadwood C, (D) forest floor C and (E) mineral soil C with profit and in relation to overstorey compositions. Adjusted R2 values are based on linear or polynomial regressions. Black lines with the shaded region are estimated mean and 95% confidence intervals. Significant differences (α = 0.05). Significant codes (p-value): 0 ‘***’, 0.001 ‘**’, 0.01 ‘*’.
Forests 13 01777 g001
Figure 2. Trends in (A) total ecosystem C, (B) total live biomass C, (C) total deadwood C, (D) forest floor C and (E) mineral soil C with net present value (NPV) and in relation to overstorey compositions and rotation ages above 50 years. Adjusted R2 values are based on linear or polynomial regressions. Black lines with the shaded region are estimated mean and 95% confidence intervals. Significant differences (α = 0.05). Significant codes (p-value): 0 ‘***’, 0.001 ‘**’.
Forests 13 01777 g002
Figure 3. Path models showing multivariate relationships between forest management alternatives, profit and (A) total ecosystem carbon C, (B) total live biomass C, (C) total deadwood C, (D) forest floor C and (E) mineral soil C. Solid lines represent statistically significant positive paths, while dashed lines show the significant negative path. The coefficients are standardized for each casual path. The path coefficient marked with ‘±’ indicates a quadratic relationship.
Forests 13 01777 g003
Publisher’s Note: MDPI stays neutral with regard to jurisdictional claims in published maps and institutional affiliations.

