Article

Effects of Particle Dimension and Constituent Proportions on Internal Bond Strength of Ultra-Low-Density Hemp Hurd Particleboard

School of Ecosystem and Forest Sciences, Faculty of Science, The University of Melbourne, Parkville, VIC 3010, Australia
*
Authors to whom correspondence should be addressed.
Forests 2022, 13(11), 1967; https://doi.org/10.3390/f13111967
Submission received: 30 October 2022 / Revised: 14 November 2022 / Accepted: 15 November 2022 / Published: 21 November 2022
(This article belongs to the Section Wood Science and Forest Products)

Abstract

:
The recent legalisation of hemp seeds for human consumption has revitalised the cultivation of hemp in Australia. This provides opportunities for the valorisation of the stem’s residual xylemic core (hemp hurd). This study investigated the effect of particle dimension and constituent proportions on the internal bond strength (IB) of single-layer, ultra-low-density hemp hurd particleboard (ULHPB) with densities between 219 to 304 kg/m3. Particle size distributions (PSD) and granulometry assessments were conducted on three particle size classes (fine (F), medium (M), coarse (C)) based on digital image analysis using ImageJ. Subsequently, four particle size mixes (100% C, 100% M, 50/50% CM, 25/50/25% CMF) were considered for the ULHPB manufacture with bio-epoxy (EPX), phenol resorcinol formaldehyde (PRF) and emulsifiable methylene diphenyl diisocyanate (MDI) adhesives, respectively. The effect of particle loading and adhesive content varied significantly per adhesive type. Internal bond (IB) performance increased in most ULHPB comprising coarse particles and declined with the addition of smaller particle sizes. The granulometry assessment showed the smallest mean elongation amongst particles in the coarse PSD. The IB results confirmed a strong interdependence of particle size and constituent proportions and indicated that various MDI-ULHPB variants can surpass the minimum IB strength requirement of 0.30 MPa stipulated for standard particleboard (>12–22 mm) in AS/NZS 1859.1. Utilising residual hemp biomass as an alternative, renewable lignocellulosic feedstock in the manufacture of engineered lightweight panel products is a key principle of circular economy and an environmentally friendly strategy to address the increasing resource scarcity in the wood-based panel industry.

Graphical Abstract

1. Introduction

Engineered wood-based panels (EWBPs) are widely used in mass furniture production and building materials for interior spaces. Increasing consumer demands for ready-to-assemble and flat-pack DIY furniture shape efforts to reduce the weight of furniture components [1]. Benefits of low-density EWBPs for manufacturers, designers and consumers include easier handling, better strength-to-weight ratio (enhanced designs), lower costs for raw materials and transportation, and better resource efficiency [2,3]. The decline of sustainable timber resources and rising demand for wood fibre has raised concerns about supply deficits and disruptions to the global timber trade [4,5,6]. A fast-growing wood energy sector [3,7,8] and increasing awareness of the adverse effects of forest degradation and deforestation [9,10] exacerbate competition over declining resources. The challenge to meet future demands motivates the investigation of agricultural and vegetal by-products as alternative sources of lignocellulosic fibre. The stalks of many crop plants are often considered as residual biomass with no purpose after the harvest. However, long bast fibre bundles from the outer part of the stalk (phloem) and even the softer inner tissue (parenchyma, xylem) provide material rich in cellulose and lignin. Including unused biomass in the development of novel composites and lightweight EWBPs is a key component of the circular economy concept and an important strategy towards the sustainable use of finite natural resources [11]. The apparent resource scarcity is also reflected by the continual increase of wood raw materials costs. Together with adhesives, wood chips now contribute significantly towards the total production costs of EWBPs [12]. Increasing the use of post-consumer wood and sourcing non-wood raw materials such as hemp to produce EWPBs therefore constitute not only real actions against climate change but might offer manufacturers a viable economic alternative in the future.
Choices for the successful cultivation of large-scale agricultural monocrops are often governed by socio-economic considerations with fewer concerns given to environmental compatibility. Montford and Small [13] developed a set of criteria for the evaluation of comparative biodiversity-friendliness between two hemp varieties (oilseed and fibre) and major monocrops (e.g., cereal grains, sugar cane, potato, sunflower, cotton, rapeseed, soybean, tobacco). Acknowledging the complexity of such an assessment, they suggested that oilseed and fibre hemp were superior to most monocrops in limiting damage to biodiversity. A study by the European Environment Agency identified hemp as a high-ranking crop measured against environmental indicators such as nutrition depletion, pesticides requirements, soil compaction and agro-biodiversity [14]. In Australia, changes to the Food Standards Code recently legalised the sale of industrial hemp seeds and oil in food products for human consumption [15]. According to Gordon and Broderick [16] this ruling increased the total seed crop area in Australia from less than 400 ha in 2017 to over 2500 ha in 2018. At present, the Australian fibre hemp industry remains small, scattered, and lacks coherent post-harvest and downstream processing infrastructures. However, the explicit focus on the dietary and nutraceutical aspects of hemp, ignores the potential for valorisation of residual biomass from the stalk and pure fibre cultivation. Less than 10% fibre varieties were grown in Victoria in 2021 [17] and no post-processing of seed stalks was yet reported despite an estimated biomass of 3–5 t/ha [16]. Despite its current absenteeism, hemp bast fibres remain in high esteem as a highly versatile material. Their broad application in the textile, fabrics and cordage industries prior to synthetics is well documented. Excellent tensile strength and stiffness properties have gained hemp bast fibres more attention recently as an environmentally friendly alternative to petroleum-based equivalents in fibre reinforced composites [18,19]. The ligneous inner core (hurd) comprises the largest fraction of the hemp stem with 40 to 60% by mass [20]. Historically, hemp hurd has been derived as a by-product of the bast fibre industry and applied as animal bedding, spill absorbent, and soil amendment. Hemp hurd has lately become a sought-after constituent in the development of ‘hempcrete’, a sustainable lightweight alternative to cementitious binders and wall renders [21,
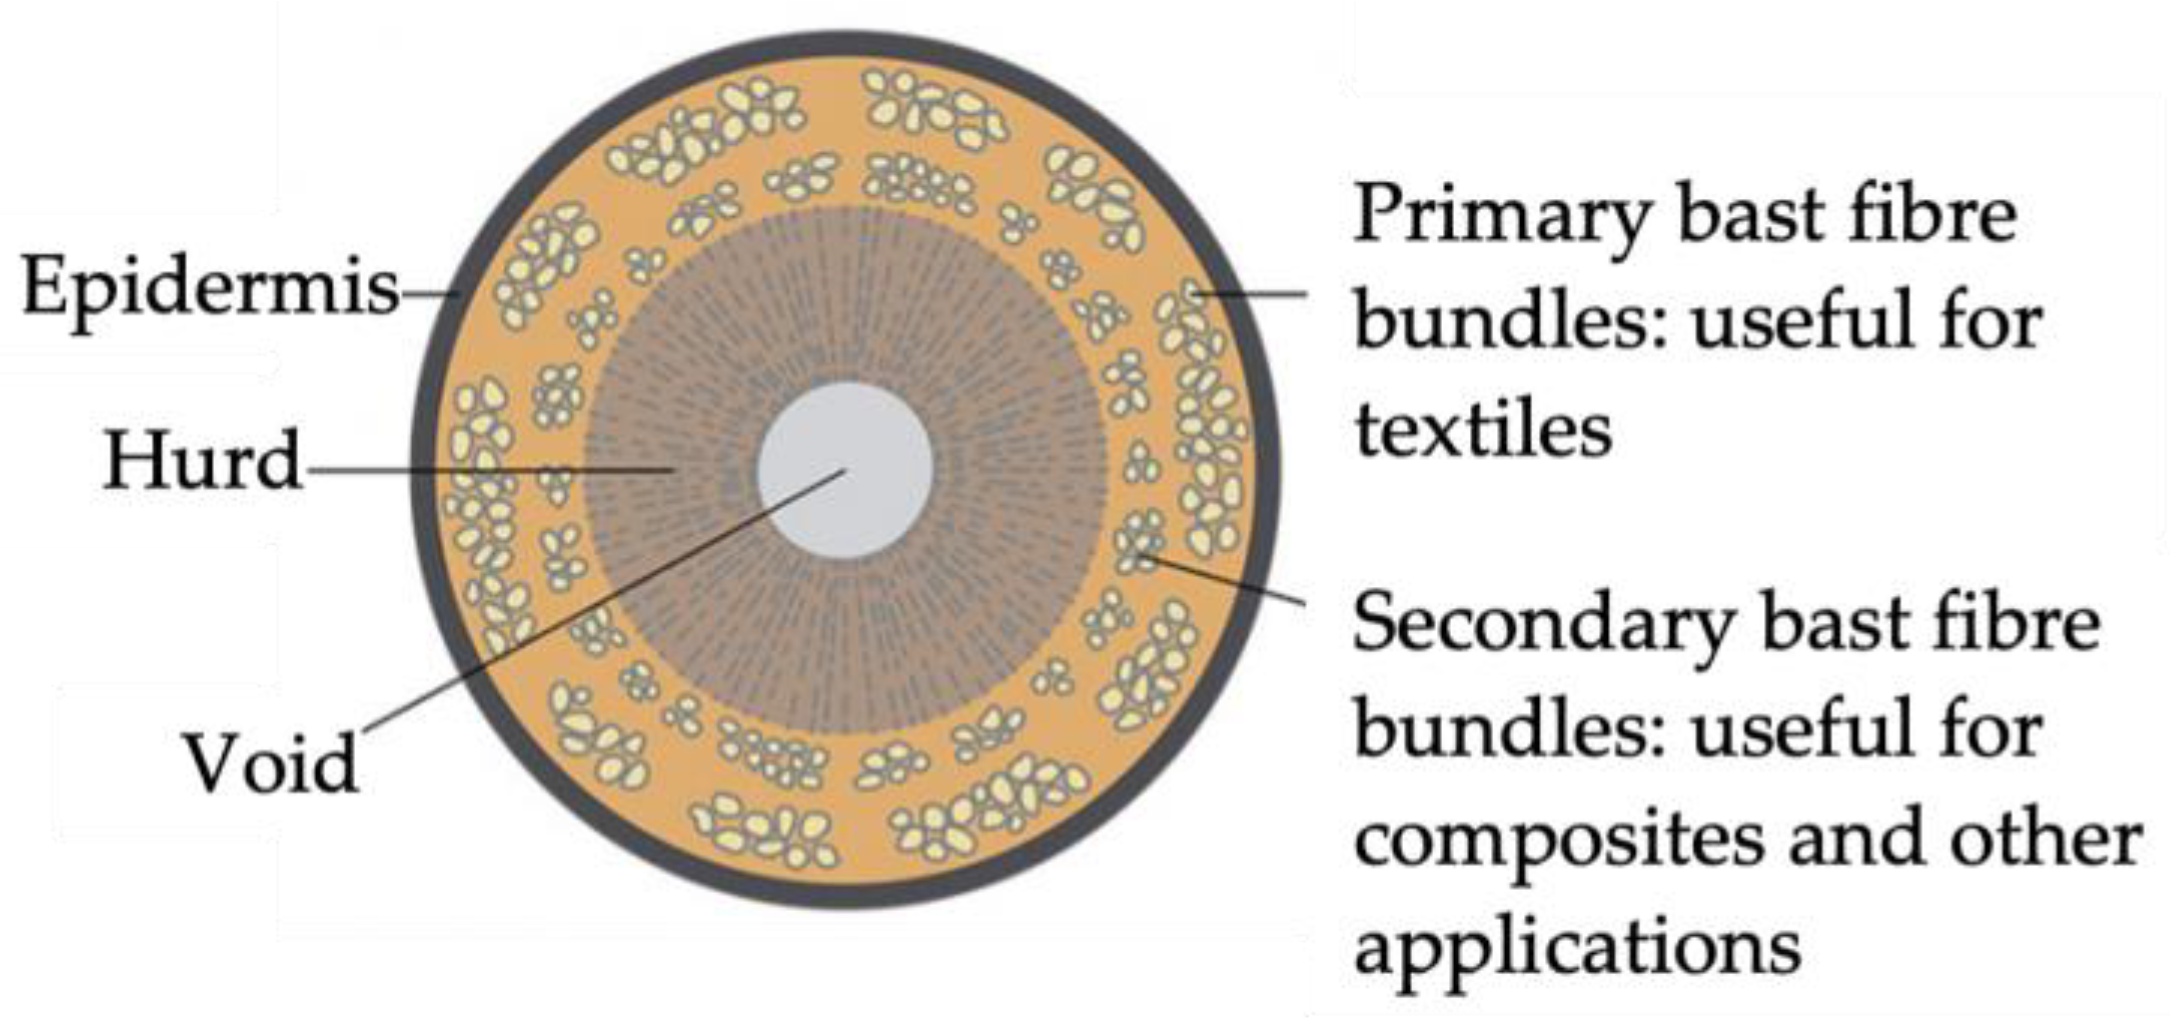
22]. The chemical resemblance to softwood, low relative density, and short fibre length have also encouraged various studies into hemp hurd as a constituent in lightweight composite panels. The essential primary components of a hemp stalk are depicted in Figure 1.
Flax shive and hemp hurd were characterised and used by Sam-Brew and Smith [24] to produce 3-layer lightweight particleboard (500–620 kg/m3) with 2.5 % and 5% polymeric diphenyl methane diisocyanate (pMDI) adhesive, respectively. The authors found lower bulk densities and higher aspect ratios of both materials compared with commercial wood (spruce, fir and pine). Longer and narrower flax and hemp particles resulted in 60% higher modulus of elasticity (MOE) and bending strength (MOR) results. All panels with 2.5% pMDI exceeded the minimum IB requirement of 0.45 MPa for medium density PB stipulated by the American National Standards Institute (ANSI). Using hemp hurd resulted in significantly higher IB results compared to the flax and wood equivalents. The use of 5% pMDI generated the highest IB values in the wood PB. The authors concluded that shorter and finer wood particles created better packing efficiency (particle contact) and consequently greater IB strength. Balducci et al. [8] examined agricultural plants, i.e., hemp (Cannabis sativa L.), sunflower (Helianthus annuus L.), topinambur (Helianthus tuberosus L.), maize (Zea mays L.), and miscanthus (Miscanthus sinensis 'Giganteus') as possible constituents for lightweight PB (400 kg/m3) intended for the furniture industry. Details of pressing parameters, initial moisture content (MC) of the raw material and particle geometries were not reported. However, the authors referred to the ‘chip-like’ and ‘cubical’ hemp particle geometry and commented on its low-density. Most single-layer PB failed to meet the EN 312 requirements for type P2 PB (0.35 MPa) except for topinambur (0.36 MPa). Schöpper et al. [7] manufactured 3-layer PB with densities of 450 kg/m3 and 550 kg/m3 from hemp particles (hurd and leaves) and 10% UF resin. The boards comprised fine particles in the surface layers (20% of total particle amount) and coarse particles in the core layer (60% of total particle amount). However, the particle sizes were not specified. Integrated woven hemp fabrics increased IB strength and allowed meeting EN requirements for both panel densities. The authors acknowledged the essential contribution of particle configuration and suggested optimising the particle sizing and milling process for improved mechanical properties of hemp PB with reduced density. The effect of homogeneity and particle geometries on the properties of kenaf (Hibiscus cannabinus L.) and rubberwood (Hevea brasiliensis Müll.Arg) PB was assessed by Juliana et al. [25]. Particles were blended with 10% UF resin targeting a density of 700 kg/m3. A particle geometry analysis was performed on two-particle size categories (0.5–1 mm and 1–2 mm), each with 100 particles to identify aspect ratios and particle shape classes. The authors concluded that the greater density of rubberwood and slender particle shapes led to superior IB results. Low IB results, they suggested, were caused by greater hydrophilicity of kenaf core (uneven resin distribution) and poor resin penetration of kenaf bast particles (waxy cuticle layer). Li et al. [26] examined the influence of particle size categories and adhesive type on the properties of PB from rice straw (Oryza sativa L.). Panels targeting 700 kg/m3 were prepared from different particle sizes (sieve openings of 1.59, 3.18, 6.35, 12.70, 19.05 and 25.40 mm) with UF and pMDI adhesive, respectively. The authors observed significantly higher results in pMDI PB and an IB increase with decreasing particles size previously observed by Pizzi [27]. They suggested that unsplit rice particles found in smaller particle sizes categories enhanced inter-particle bonding (lack of inorganic substances). Conversely, PB manufactured from the smallest particle size group produced lower IB results. The authors contributed the smaller particles’ greater specific surface to weaker bonding as less resin per unit area was available. They concluded further that pMDI was more successful in the wetting and penetration of the hydrophobic straw particle surfaces compared to water based UF resin. Kawai and Sasaki [28] compared PB (100–900 kg/m3) with uniform particle dimensions from timber species with various densities (200–700 kg/m3) at different compression ratios (CR; board density divided by raw material density). IB of mixed species PB they concluded, was essentially governed by the tensile strength of the low-density species once sufficient adhesive strength was achieved. They recommended a minimum CR of 0.7 to 0.8 as the lower practical limit for PB manufacture. In low-density PB (400 kg/m3) from controlled particle geometries of Lauan (Shorea spp.) they observed greater IB values with increasing particle thickness and decreasing particle length and width. Assuming that adhesive content per unit area increases significantly with greater particle thickness, they confirmed a proportional relationship between IB strength and particle thickness. The comparison of isocyanate resin content on Lauan PB (400 kg/m3 and 600 kg/m3) showed greater IB strength for all PB with greater adhesive content. However, the effect was greater in the high-density variants, confirming the authors suggestion that more adhesive needed to be supported by sufficient contact area between particles to significantly increase IB strength.
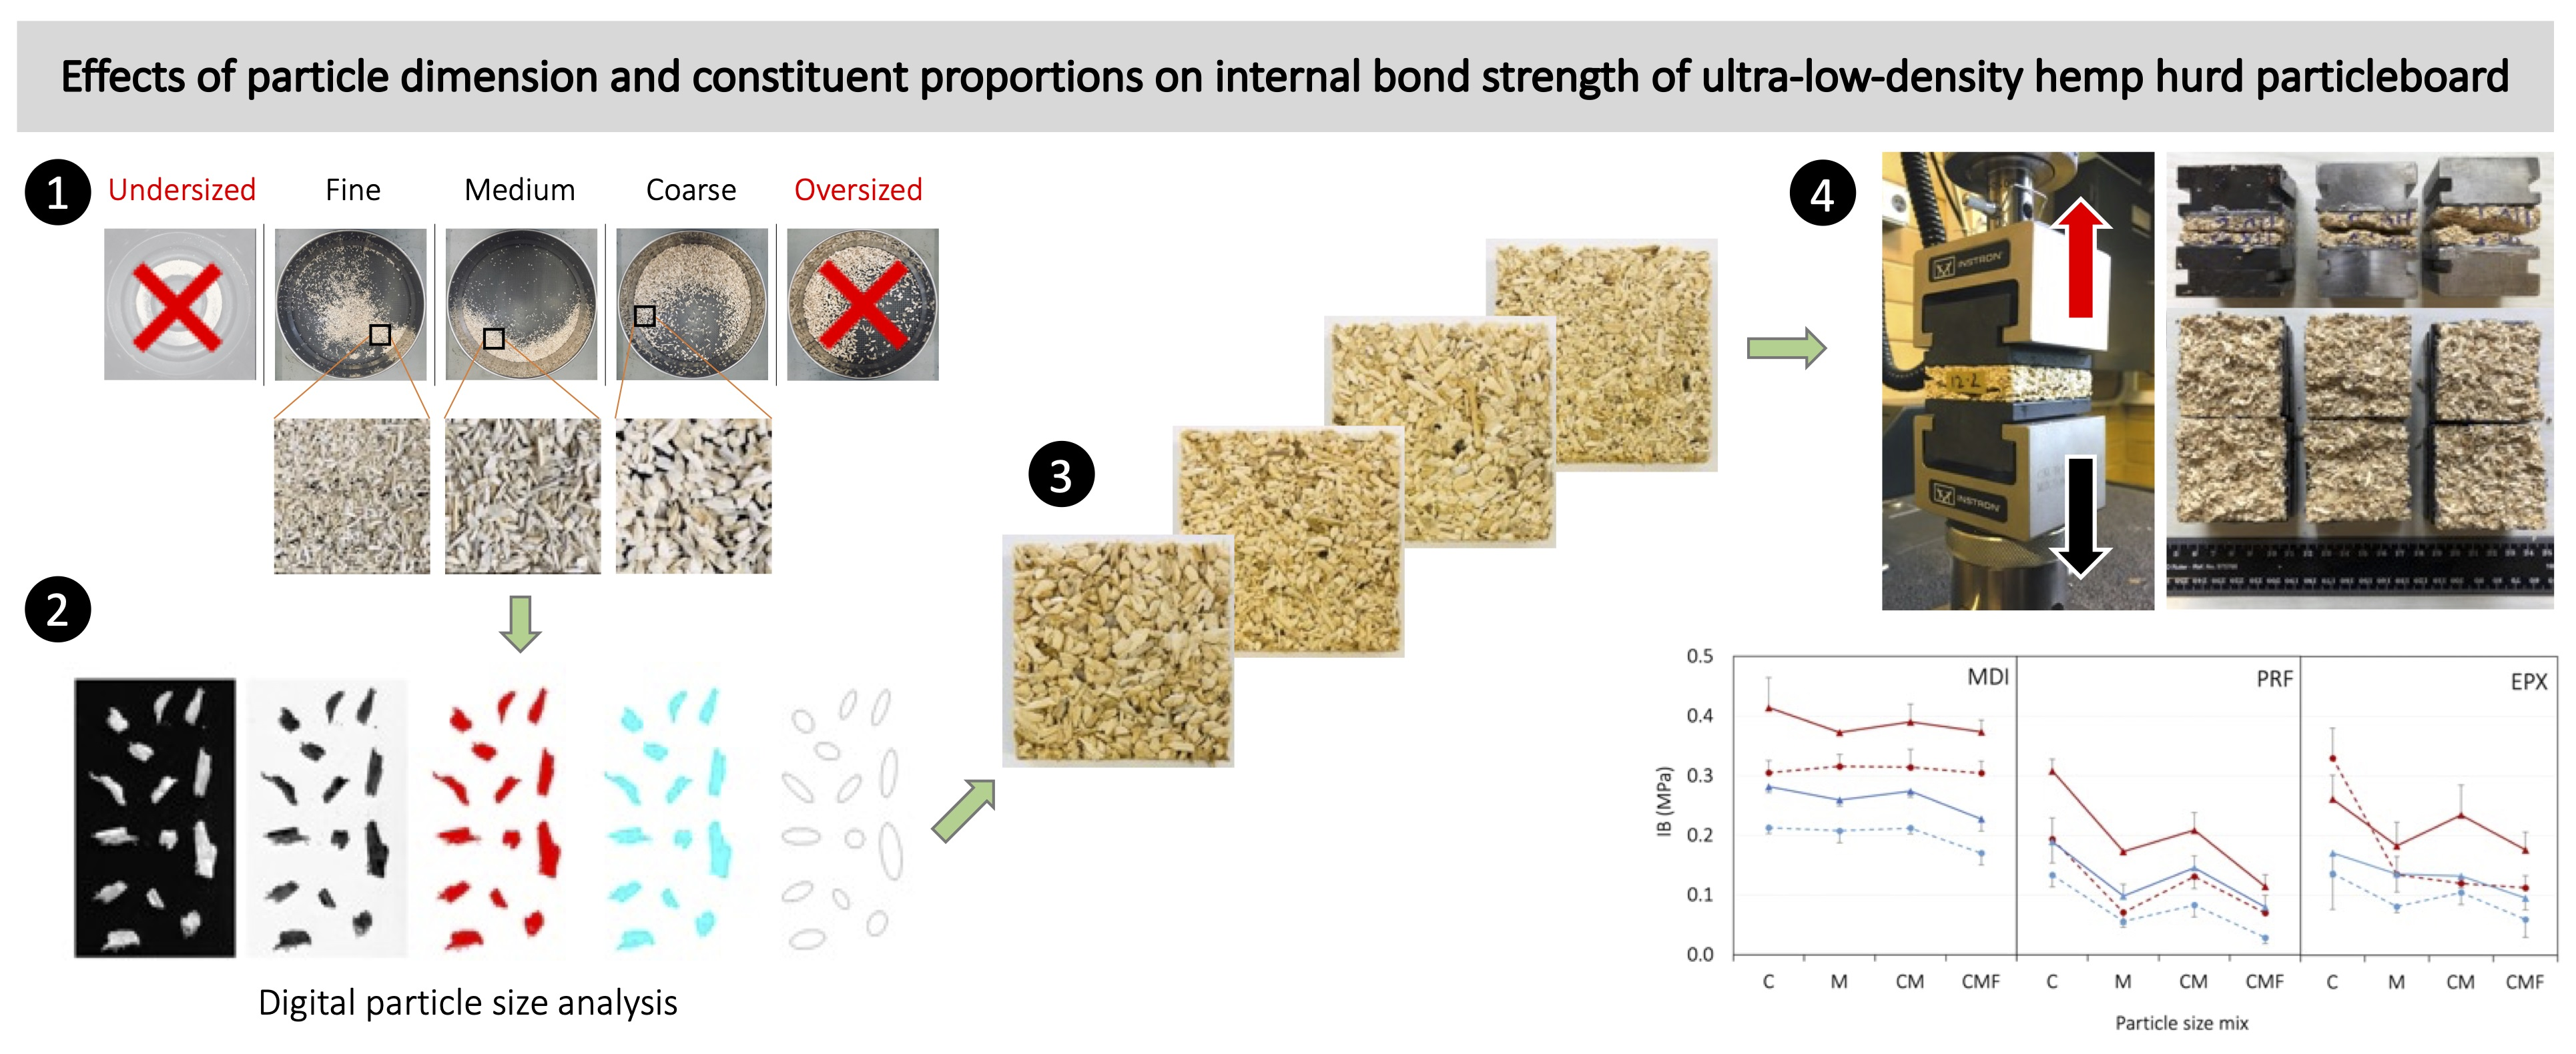
The literature cited illustrates the complex interactions of processing variables and their effects across various bio-aggregate composite panels. Compression ratio and particle dimension are critical for sufficient particle contact and glue utilisation and, consequently, the formation of effective bonds. Most research on granulometry has either been conducted using wood-based materials, small sample sizes, or neglected altogether. The impact of granulometry of agricultural by-products such as hemp hurd for composite panels is therefore not comprehensively investigated. Such data would be essential in properly evaluating and optimising the performance of agri-fibres for composite panels as the resource can be drastically different from wood. The characterisation of panel constituents and processing variables is therefore a fundamental step in assessing the potential of low-density hemp hurd particleboard (ULHPB) as, e.g., core layers in lightweight composite panels for ready-to-assemble furniture and cabinetry, furnishing components (e.g., particle core doors) and non-load bearing decorative or acoustic wall and ceiling panels. This study investigated the effects of particle dimension and constituent proportions on the IB performance of single layer ULHPB manufactured with Australian hemp hurd. The results provided a first understanding of permissible adhesive ratios, favourable particle size combinations and compression ratios related to performance characteristics.

2. Materials and Methods

2.1. Materials

Mechanically decorticated hemp hurd chips (Cannabis sativa, ‘Frog One’) were obtained from the Gippsland region in Victoria, Australia. The chips were rinsed under running tap water at 20 °C to remove impurities, dried at 75 °C for 6 h and finally conditioned at 23 °C and 65% relative humidity (RH) until no further weight change occurred (EMC). All subsequent processing steps involved hemp material conditioned to EMC. Several types of ULHPB were manufactured using 3 different adhesives: (i) an emulsifiable methylene-diphenyl-diisocyanate adhesive (MDI, SUPRASEC® 1041); (ii) a liquid phenol-resorcinol-formaldehyde (PRF) with paraformaldehyde hardener adhesive system (Jowat® 950.80 and 950.85); and (iii) a bisphenol-A free bio-epoxy resin precursor (77% bio content) with diamine hardener. Selected adhesive properties are shown in Table 1.

2.2. Preliminary Work

One hundred (100) g of cleaned hemp chips ranging from 10 to 55 mm in length were ground in a cutting mill (Fritsch Pulverisette 15, Idar-Oberstein, Germany) equipped with perforated sieve inserts of 2, 4, 6, and 8 mm, respectively. The furnish of each sieve insert was screened by means of mechanical shaking (Vibro Veyor, Melbourne, Australia) for 2 min through stacked 300 mm diameter stainless steel laboratory sieves (ISO 3310-1) with mesh apertures of 0.6, 1, 2, and 4 mm. The mass of the particles left on each mesh was recorded and expressed as a percentage of total weight. This identified the sieve insert perforation producing optimal ratios of particle size categories (PSC) required for the ULHPB manufacture. Particles passing the 0.6 mm mesh and particles left on the 4 mm mesh were deemed too small and too coarse, respectively, and excluded from the study. Subsequently, three PSCs (Figure 2) were considered for the manufacture of particleboard from 4 particle size mixes (PSM) as shown in Table 2: (1) homogeneous with 100% coarse (C); (2) homogeneous with 100% medium (M); (3) mixed with 50% coarse and 50% medium (CM); and (4) mixed with 25% coarse, 50% medium and 25% fine (CMF).
The bulk density for each PSC was determined as described by Amziane et al. [20]. Bulk densities were calculated from Equation (1).
ρ b = M b / V b
where   ρ b is the bulk density of the PSC (kg/m3), M b the PSC mass (kg) and V b the PSC volume (m3).
The air-dry density (ADD) was calculated to express the raw material density. ADD was derived from the measurements of 15 large hemp chips using the water replacement method. The mass of each chip was first determined uncoated and again after being sealed with paraffin wax. All measurements were conducted with hemp chips at EMC and water at 20 °C. ADD was calculated from Equation (2).
ρ A D D = M c / V c
where   ρ ADD is the hemp chip air-dry density (kg/m3), M c the uncoated chip mass (kg) and V c the uncoated chip volume (m3).
The compression ratio (CR) was determined by dividing the panel density with the raw material density. The panel density was calculated from the mass of the unresinated particle mix (furnish) to provide equitable values amongst panel variants using Equation (3).
C R = ( M P / V P )   / ρ A D D
where CR is the compression ratio per panel, M P is the panel furnish mass (kg), V P is the finished panel volume (m3).
Epoxy and PRF panels measuring 285 × 208 × 12 mm3 were fabricated to establish 2 particle loadings and 2 adhesive contents (i.e., low and high) for the scale-up trial. Particle loadings trialled were based on the uncompacted furnish mass at EMC (bulk density) required to produce a 12 mm thick panel (100%) and successively increased to 150%, 200% and 250%. Adhesive contents were calculated as a mass fraction (wt%) based on the respective particle loading mass per panel. Epoxy and PRF were both applied at 15 wt% and 20 wt% and an additional trial was conducted with epoxy at 10 wt%. Each adhesive was poured into a mixing vessel with furnish and blended manually for 3 min. The resinated mix was then transferred into a wooden mould, manually levelled and pre-compacted for 60 s at 0.42 MPa using a hydraulic hand operated 25-ton laboratory press (Dake model 944226, Grand Haven, MI, USA). To produce the preliminary panels a lid with a spacer leaving a 12 mm gap at bottom was inserted into the mould and compressed to 1.41 MPa target pressure. Both epoxy and PRF panels, respectively, were left in the press overnight and removed after 17 h. The first PRF panels were prepared with 150% particle loading and 15 wt% and 20 wt% adhesive, respectively. Irrespective of adhesive content, removal from the casting frame without destruction was challenging and precise specimen dimensions could not be realised during machining with a table saw. A 10 wt% adhesive content in the lower density epoxy panels proved equally unsuccessful and was not further investigated. Particle loadings were subsequently increased to 200% and 250% in the second batch for both adhesives and presented satisfactory cohesion (visual assessment) and machinability. Adhesive contents identified for the scale-up manufacture reflected that sufficient particle cohesion was to be achieved without disproportionate use of adhesive (resin efficiency). Consequently, 200% (low) and 250% (high) particle loadings and 15 w% (low) and 20 wt% (high) adhesive contents were chosen for the manufacture of epoxy and PRF panels in the scale up trial.
Preliminary MDI panels measuring 285 × 208 × 12 mm3 were manufactured to determine processing parameters, i.e., adhesive contents, spray gun settings for effective adhesive atomising and rate of heat transfer into the particle mat. The furnish for the MDI panels was resinated within 90 s by upending a sealed vessel while the MDI was atomised at 0.21 MPa using a top mount gravity spray gun (2.8 mm aperture). The resinated mixture was first transferred into a casting frame attached to an aluminium mould and manually levelled. The mat was then pre-compacted for 60 s at 0.42 MPa in the laboratory press at ambient temperature. After removal of the casting frame, the mat was covered with an aluminium caul plate, inserted into the press again and consolidated inside the aluminium mould. Thermocouples trials at 190 °C platen temperature recorded an average heat transfer of 8 min to the centre of the mat. Consequently, each MDI panel remained in the press for 15 min at a target pressure of 1.41 MPa. Adopting the established particle loadings, MDI panels presented good cohesion and machinability at 3 wt% and 6 wt% adhesive contents based on furnish mass at EMC.
The principle idea was a maximal reduction of hemp hurd to the point where sufficient particle contact and machinable ULHPB could be produced. However, combinations of PSCs and adhesive contents contributed uniquely towards the mass of each ULHPB variant. The theoretical panel density range at 12% MC was consequently calculated as 228 kg/m3 (MDI with coarse/medium/fine particles and low particle loading and adhesive content) to 331 kg/m3 (PRF/EPX with medium particles and high particle loading and adhesive content).

2.3. Scale Up

2.3.1. Image Analysis and Granulometry Evaluation

Following the methodology described by Picandet [29], 1 kg of furnish per PSC was reduced by quartering to approximately 5 g, respectively. The particles from each sample were manually arranged on the surface of a standard flatbed scanner to prevent intersecting. An 8-bit grayscale image was taken of each arrangement at 600 dpi against a black background and stored as tag image file format (TIFF). This process was repeated for each PSC until the complete sample was captured. Image processing and measurements were conducted with the open-source software ImageJ (Ver. 2.0.0-rc-69/1.52p). Particle areas were isolated from the background via colour thresholding prior to binarizing the image. Two iterations of an enhancing opening algorithm were applied to eliminate solitary fibres and the effect of outcrops caused by attached fibres. The minimum detection area was set to 0.29 mm2 to exclude dust. Each image was manually assessed for acceptable particle segregation and deficient particle selections were excluded from further analysis.
The description of complex objects can be achieved by approximation with recognised geometric shapes [29,30]. In the case of hemp particles, a fitted ellipse was adjusted to match the projected area and centre of gravity of a corresponding particle. The radii of the resulting ellipse were used to define particle length and width. Particle dimensions were measured, and shape descriptors calculated using the particle analysis tool and the shape filter plugin in ImageJ [31]. Equating with a fitted ellipse is a useful approach for solid (convex) shapes and provides robust width approximations even in the presence of fibrous outcrops and protuberances observed in many bio-aggregates [29]. However, complex particles become more concave and less solid, which reduces the representation accuracy through an ellipse. Following Picandet [29], the effect on the particle size distribution (PSD) by rejection of particles with solidity (S) values of <0.50, <0.63 and <0.75, respectively, was calculated. A small percentage of particles lost through solidity filtering was deemed acceptable to increase representation accuracy. Subsequently, only particles with S > 0.75 were considered for the granulometry evaluation. Estimated mass distributions by particle length and width were calculated for each of the three PSCs based on the individual particle area and the assumption of proportionality of particle width to average thickness and uniform density of the material [29].

2.3.2. Preparation of the Panels

The panel manufacture was carried out following the methodology developed for the preliminary panels except for the replacement of the wooden moulds with aluminium equivalent for all adhesives. Consequently, four epoxy panels in separate aluminium moulds were prepared concurrently to maximise efficiency. Mandated by the cure kinetics of the epoxy (cold setting) the 17 h press time remained. Whilst PRF adhesives cure well at room temperatures, higher temperatures accelerate the chemical reaction between resin and hardener [32]. Thermocouples recorded a 5 min heat transfer to the centre of the mat at 80 °C. PRF panels were subsequently pressed for 15 min to comply with an 8 min pressure duration for glue line temperatures at 80 °C [32]. A summary of the fabrication parameters is presented in Table 3.

2.3.3. Panel Variants

The design and notation of the ULHPB variants is presented in Table 4 and an overview of the panel compositions is shown in Figure 3. Sixteen distinctive variants per adhesive type were manufactured, comprising 4 particle size mixes (PSM), and 2 particle loadings and 2 adhesive contents. Three replicates per variant were manufactured for a total of 144 panels in this study. The use of aluminium moulds and coherent manufacturing methodology ensured consistent panel dimensions of 285 mm × 208 mm and a target thickness of 12 mm.

2.3.4. Specimen Preparation and Assessment

Eight (8) thickness measurements were taken 25 mm from the panel perimeter after removal from the press (adjustment to room temperature observed for PRF and MDI panels) (Figure 4a). Subsequent measurements of identical positions were recorded to calculate set recovery. A quality indicator for sufficient bonding between particles is the measurement of tensile strength perpendicular to the plane of the panel. This mechanical strength test is referred to as internal bond strength (IB) and was the retained method for performance assessment of the ULHPB for this study. Specimen machining, preparation and IB strength testing were conducted in accordance with AS/NZS 4266.1 [33]. Three IB specimen (50 mm × 50 mm) were obtained from each panel as depicted in Figure 4b. Prior to the assemblage, the weight and volume of each specimen were recorded to determine the density at the time of testing and density variations within the panel. A universal testing machine (Instron Model 5569, Norwood, MA, USA) was used to conduct IB testing at a loading speed of 1 mm/min.

2.3.5. Differences between Group Means Using Statistical Analysis

The data were analysed for possible differences of group means using the Analysis of Variance test (ANOVA) with the statistical software package Minitab (Version 19.2020.2.0). A mixed effects model and a Fisher pairwise comparison test ( α = 0.05) were used to evaluate the effects of panel parameters, i.e., particle size mix, particle loading and adhesive content on the IB strengths of the ULHPB. The fixed factors included the panel parameters, and the panel identification number was used as the random factor. Fundamental differences (i.e., application, curing kinetics) warranted the separate evaluation of each adhesive type.

2.3.6. Compliance Assessment

AS/NZS 1859.1 [34] stipulates requirements for IB properties intended for quality assessment. Compliance is assessed by the comparison of 5-percentile IB values (L5%) of the test material with the lower specification limit tabulated in the standard. L5% values are based on individual IB panel means and were calculated from Equation (4).
  L 5 % = x = k s x ¯  
where L 5 %   is the lower 5-percentile comparison value of the sample (MPa), x = is the grand mean (MPa), k is the factor used in the calculation of the upper and lower 5-percentile values (ASNZS 4622.1 Appendix A; Table A1; k = 2.195), s x ¯ is the estimate of the standard deviation between panel means.

3. Results and Discussion

3.1. Granulometry Evaluation

Each particle scan was assessed for deficient particle selections during image processing, as shown in Figure 5. With some voluminous particles, the particle surface opposite the scanner’s glass platen protruded into the field of vision as blurry sections, which increased the area represented by the particle being analysed. These sections fell outside the threshold setting and were manually identified and removed. Secondly, the coarse PSC contains larger quantities of particles from the outer part of the stem with residual bast fibres still attached. These fibres were often identified by ImageJ as smaller separate areas (islands) and were manually identified and removed to maintain only accurate area selections of the rigid, voluminous part of the particle. Further comminution separates the smaller particles from most of these fibres which often agglomerate on the mesh surfaces during the sieving process. With most of the fibres removed during size reduction, the medium and fine PSC show substantially fewer residual fibres. Between the 3 PSCs, coarse contained the most voluminous particles and had the highest percentage removed (4.6%) followed by substantially lower percentages for medium (1.3%) and fine (1.0%) as shown in Table 5. The separation of highly porous hemp chips into smaller aggregates naturally follows the direction of capillaries and cells oriented longitudinally along the stem axis. This produces woody hemp particles with predominantly elongated shapes and the representation of their projected areas through ellipses is appropriate. However, the final particle shape is also influenced by equipment type and configuration during the comminution process. Tearing and shredding motions can equally produce particles shapes with high concavity for which the approximation with an ellipse is less accurate. Solidity thresholds were used to filter out particle shapes unsuitable for representation through an ellipse. Table 5 shows only a marginally greater loss at 5.9 % in the coarse PSC and little difference between medium and fine PSCs at 4.7 % and 4.8 %, respectively, at the highest threshold setting of S > 0.75. The rejection of such small percentages was deemed acceptable towards the overall improvement of particle representation through the image analysis process. Consequently, only particles with S > 0.75 were considered for further evaluation and the combined rejection of particles per PSC followed coarse (10.5%) > medium (6.0%) > fine (5.5%).
The PSDs for each particle size category are presented as estimated mass (M%) distributions in Figure 6. The distribution by mass recognizes the proportionally greater impact larger particles can have on material properties. Particle length and especially particle elongation are thought to influence particle orientation and arrangement (e.g., packing efficiency) in the finished product and are often associated with the anisotropy of a material [29]. It follows that weighting the influence of, e.g., elongation by particle mass is most appropriate for hemp particleboard. To understand the particle dimensions in more detail, 3 distinct ranges per PSD were identified and assessed separately. The ranges were chosen based on the most dramatic change of slope occurring for most PSDs at the lowest (<D20) and the largest (>D80) 20 %, respectively. The distribution parameters for the lower range (<D20), the bulk (D20–D80) and the upper range (>D80) are presented in Table 6. Minimum particle widths recorded in each PSDs measured 0.24 mm for both coarse and medium and 0.23 mm for fines. Similarly, minimum particle lengths for coarse, medium, and fine were 0.69 mm, 0.68 mm, and 0.63 mm, respectively. Maximum particle width measured 5.34 mm, 3.45 mm, and 1.77 mm for coarse, medium and fines, respectively. Maximum particle length for coarse, medium, and fine was measured at 15.20 mm, 16.25 mm, and 10.05 mm.
The smallest difference of mean particle elongation was observed in the lower range (<D20) of each PSD with 1.93, 2.03 and 2.01 for coarse, medium, and fine, respectively. The mean elongation increased in the bulk range (D20–D80) to 2.07, 2.34 and 2.42 and again in the upper range (>D80) to 2.59, 3.00 and 3.42 for coarse, medium, and fine, respectively. The mean elongation increased from lower to bulk to the upper range following fine > medium > coarse PSD. Compared to the bulk range, particles within the lower range of the fine PSD were on average 17% less elongated and 42% more elongated in the upper range. For the medium PSD this was 13% and 28%, respectively. The coarse PSD had the least variation of mean elongation with particles in the lower range 7% less elongated and 25% more elongated in the upper range. The maximum values confirmed that sieve apertures predominantly regulated particle width and were less effective in controlling the particle length. The highest particle length of 16.25 mm, for example, was recorded in the medium and not the coarse PSD. The similarity and presence of the smallest particle dimensions across all PSDs confirmed that complete particle separation was not achieved via mechanical screening for 2 min. Particle characterisation of bio-aggregates based on sieve apertures alone does, therefore, not suffice to describe the heterogeneity of the PSD. Differences in mean particle elongation were marginal in the lower ranges of all PSDs and increased rapidly with material finesse. The highest mean elongations were recorded in the bulk range and upper range of the fine particle PSD.

3.2. Density and Compression Ratio

The average bulk density per particle size category (PSC) are presented in Figure 7a. Coarse and medium PSCs showed nearly identical bulk densities of 110.2 and 110.4 kg/m3, respectively. Higher material finesse led to a 7.5% lower bulk density of 102.0 kg/m3 and was similarly reported for Frog One fines by Delhomme et al. [35]. Other studies point to the void formation and poorer packing efficiency and report lower bulk densities for larger particle sizes [36,37]. However, the definition of ‘fine/small’ and ‘coarse/large’ differs widely across studies and are insufficient terms without additional information on actual particle dimensions. Assuming uniform air-dry density and porosity across particles in each PSC in this study, the shape of the hemp particles appears to adversely influence the packing efficiency of the fine PSC. This is consistent with the results of the granulometry evaluation, which confirmed that the fine PSC contained the most elongated particles.
The average air-dry density (ADD) of hemp variety Frog One and selected commercial timber species is presented in Figure 7b. The ADD of Frog One (231 kg/m3) was approximately 60% lower than radiata pine (Pinus radiata D.Don) and 65% higher than balsa wood (Ochroma pyramidale Urb. [38]. The most comparable timber species was paulownia (Paulownia tomentosa (Thunb.) Steud.), with an ADD of 280 kg/m3 [39]. The results confirmed Frog One as a low-density lignocellulosic material. Lighter material is generally preferred for particleboard production as sufficient particle contact (compression) can be realised without an excessive rise of panel mass.
The compression ratios (CR) of the finished panels and specimen densities are presented in Table 7. The mean CRs of MDI, PRF and epoxy panels with high particle loading were 1.17, 1.18 and 1.08, respectively (high CR). Panels with lower particle loading had CRs of 0.95, 0.96 and 0.92 for MDI, PRF and epoxy, respectively (low CR). Consistently lower CRs and higher variation amongst epoxy panel replicates were caused by greater panel expansions and thickness variations as CRs were calculated using finished panel volumes. Manufactured at room temperature, epoxy panels did not experience the plasticizing effect of heat during the manufacture resulting in the highest set-recovery. The CRs of the finished panels with high particle loading were in the range of 1.3 and 1.2–1.6 as recommended for standard particleboard [40,41]. The CRs of panels with low particle loadings were slightly higher than the practical minimum of 0.7–0.8. for low-density particleboard manufactured with isocyanate adhesive as suggested by Kawai and Sasaki [28]. Specimen density was calculated at EMC (23 °C and 65 RH) prior to testing. Variations between panel equivalents were expected and reflected the additional weight (adhesive content) of the binders in the finished product. However, density variations between panel replicates increased following Epoxy > PRF > MDI. No apparent pattern could be attributed to neither the particle sizes nor particle loadings or adhesive contents for any adhesive type. It is likely that the high set-recovery of the epoxy panels exacerbated the effect of suboptimal adhesive distribution (pour-and-blend application) leading to higher density variations amongst the epoxy specimens.

3.3. Internal Bond Strength

Each adhesive type was assessed independently in response to inherent differences in application and pressing methodologies (i.e., atomisation, pressing temperature and duration). The p-values for the tests of fixed effects, i.e., particle size mix, particle loading, and adhesive content, are given in Table 8. The statistical analysis demonstrated a very significant interaction (p-value < 0.005) of the fixed factors on IB strength for all adhesive types. However, fixed factor combinations only had a significant effect on some epoxy panels.
IB strengths increased for most panel variants in the presence of coarse particles and declined with the addition of smaller particle sizes. Particle loading and adhesive content affected the panel variants differently and varied per adhesive type. MDI panels achieved generally greater IB strengths compared to most PRF and epoxy equivalents. The results are summarised and examined separately for each adhesive type. IB strength as a function of particle size mix is presented in Figure 8. The Fisher comparison tests for mean IB strength per adhesive type are provided as Table A1, Table A2 and Table A3, respectively, in Appendix A.

3.3.1. MDI

IB strength followed a statistically significant hierarchy for most particle size mixes (PSM) of variant categories HH > HL > LH > LL (Figure 8, left). IB values declined with the addition of smaller particle sizes in most panels. However, the differences were rarely significant and the effect of PSM on IB strengths varied slightly within each variant category. C-HH panels realised the maximum at 0.41 MPa and marked the highest IB result in the entire study. The gradual reduction of coarse particles led to 0.39 MPa and 0.37 MPa for CM and both CMF and M panels, respectively. PSM-M was significantly different from C-HH. The PSM did not affect IB significantly amongst the HL variants. M-HL and CM-HL recorded 0.31 MPa and C-HL and CMF-HL were 0.30 MPa, respectively. Similarly, coarse particles did not lead to significant higher IB values amongst the low compression ratio (CR) variants LH and LL. C-LH, CM-LH and M-LH recorded 0.28, 0.27, 0.26 MPa, respectively. C-LL and CM-LL recorded 0.21 MPa and M-LL was 0.20 MPa, respectively. However, the addition of fines reduced the IB strength significantly in both categories. CMF-LH recorded 0.23 MPa and CMF-LL was 0.17 MPa which marked the minimum IB strength for panels manufactured with MDI. Higher CRs governed the IB strength in MDI panels and were more influential than adhesive content. However, more adhesive led to higher IB values in both low and high CR panels. The addition of fines (CMF) had no significant effect on IB strength amongst high CR panels but was significant in low CR panels.

3.3.2. PRF

Maximum IB strength was realised in C-HH panels at 0.31 MPa. The minimum was recorded in CMF-LL panels at 0.03 MPa which marked the lowest IB value in the entire study. IB strength followed a hierarchy for most particle size mixes (PSM) of variant categories HH > LH > HL > LL (Figure 8, centre). In every variant category PSM-C resulted in the highest IB values followed by PSM-CM. The addition of smaller particles in M and CMF panels often lowered the IB significantly. The starkest contrast was observed in HH panels. Each PSM led to significantly different IB strength within the variant category and related panel equivalents. HH panels followed C > CM > M > CMF at 0.31, 0.21, 0.17 and 0.11 MPa, respectively. Coarse particles also led to superior IB strengths in C and CM panels of LH, HL and LL variants. The presence of smaller particles sizes in M and CMF panels led to lower IB results. However, both M and CMF were equally detrimental to the IB values. LH, HL and LL panels followed C > CM > M > CMF. The similarities between LH and HL panels validated that higher compression ratios must be complemented with sufficient adhesive for significant effects. The PRF adhesive was not atomised, and the adhesive distribution relied predominantly on the transfer of adhesive between resinated and neat particles in the mixing vessel. Naturally, larger particles with greater surface areas would have a higher chance of exposure and were resinated more evenly. Smaller particles often agglomerated into excessively resinated clusters which rendered adhesive unavailable for uniform distribution.

3.3.3. Epoxy

IB strengths of epoxy panels followed a different hierarchy compared to the MDI and PRF panels (Figure 8, right). PSM-C resulted in the highest and CMF in the lowest IB values amongst all variant categories. The effect of M and CM varied and led to stark differences in IB strengths amongst the variant categories LH and HL. HH variants followed C > CM > M > CMF at 0.26, 0.23, 0.18 and 0.17, respectively. The superior effect of coarse particles in C and CM panels was evident but only significant between C and CMF panels. HL variants showed no significant difference between M > CM > CMF at 0.13, 0.12 and 0.11 MPa, respectively. However, C-HL panels realised 0.33 MPa and marked the maximum IB strength for epoxy panels. LH variants were C > M > CM > CMF at 0.17, 0.13, 0.13, 0.09 MPa with a statistical difference between C and CMF. LL variants follow C > CM > M > CMF at 0.13, 0.10, 0.08 and 0.06 MPa, respectively with a statistical difference between C and CMF panels. CMF-LL panels marked the minimum IB strength recorded for epoxy panels. While not statistically different, the maximum IB strength was realised in C-HL panels instead of the C-HH variants as observed in MDI and PRF panels. The adverse effect of higher epoxy concentrations on the IB strength suggests that the maximum IB strength was limited by the tensile strength of the epoxy in the case of C-HH panels. While epoxy systems are known to form strong bonds, they can also be quite brittle. The CRs of all epoxy panels were consistently lower compared to equivalent panels manufactured with PRF and MDI. The CR depends on panel density which was consistently lower in epoxy panels as a result of greater thickness variation and set recovery values. This was likely caused by the epoxy cold-pressing manufacture as particles did not experience any plasticisation. However, the CR of the C-HL panels was 4.6% higher (1.13) compared to the average CR of other epoxy-high CR variants (1.08). This was likely attributable to variations during the panel manufacture. The compounding effect of higher densification and tensile strength of the epoxy adhesive might explain the spike of IB strength in C-HL variant. Greater thickness variations also led to less significant differences between M and CM panels within variant categories. However, the addition of fines consistently lowered IB strength. Like PRF, epoxy adhesive was not atomized, and the adhesive transfer relied on interparticle contact, which ultimately favoured larger particle surface areas.

3.3.4. Comparison with AS/NZ 1859.1 Requirements

The lower specification limit of L5% values for standard particleboard (use in dry conditions) in a nominal thickness range of >12.0 to 22.0 mm is 0.30 MPa. IB strength and corresponding L5% values of the ULHPB are given in Table 9 and a graphical summary is presented in Figure 9. HH panel variants manufactured with MDI exceeded the specification limits irrespective of PSM. L5% values followed M-HH > (0.36 MPa) > CM-HH and CMF-HH (0.32 MPa) > C-HH (0.31 MPa). This contrasted our previous observations that suggested greater IB strengths were achieved with increased particle size. However, L5% calculations are susceptible to variations between panels ( s x ¯   ) and PSM-C panels recorded the highest grand mean x = of 0.41 MPa accompanied by the largest s x ¯   of 0.05. The second highest x = (0.39 MPa) and s x ¯   (0.03) were recorded for CM panels. The addition of coarse particles increased IB strength concomitantly with s x ¯ which reduced the absolute L5% values of these MDI variants. M panels had a substantially lower s x ¯   (0.00) and emerged as the variant with the most superior L5% of all MDI-ULHPB. Only PRF C-HH (0.31 MPa) and epoxy C-HL (0.33 MPa) recorded initial IB strengths high enough to meet the 0.30 MPa limit. However, s x ¯   of 0.02 and 0.05 reduced each L5% to 0.27 MPa and 0.20 MPa, respectively. Consequently, all PRF and epoxy variants failed to meet the lower specification limit.

3.3.5. Discussion

PSM-C comprised the most favourable particle size distribution and led to superior IB results across all adhesive types and most panel variants. Particles in PSM-C recorded the smallest elongation and were more voluminous (thick and short), which is thought to improve IB strength [28,42]. Smaller particle sizes in the mix might have filled interparticle voids to some extent and facilitated greater particle contact. However, interparticle gaps in PSM-C panels remained and caused greater variations (standard deviation) between panels means. This adversely affected panels with initially high IB strengths and reduced their 5-percentile values below the AS/NZS 1859.1 requirement of 0.30 MPa. Equally, medium (M) and fine particles (F) resulted in lower IB strengths for most ULHPB. These observations were contrasted by previous research that reported higher IB strengths with the addition of fines [40,43,44]. These studies supported the notion that smaller particles facilitate superior inter-particle contact and mat consolidation. However, the results of the IB strength of ULHPB confirmed that higher ratios of smaller particles sizes led to lower IB values [26,42].
MDI panels achieved superior IB results compared to PRF and epoxy equivalents. The advantage of MDI was particularly evident in panels comprising medium and fine particles. M-LL and CMF-LL panels realised the lowest IB results across all adhesive types. PRF and variants achieved 0.05 MPa and 0.03 MPa and epoxy recorded 0.08 MPa and 0.06 MPa, respectively. MDI equivalents resulted in 0.21 MPa and 0.17 MPa, respectively. The specific particle surface area in the mat increased with the admixture of smaller particles at equal particle loading. It is assumed that atomising MDI at high-pressure led to greater consistency of adhesive coverage compared to the ‘pour-and-blend’ application of PRF and epoxy adhesives. Consequently, larger proportions of successfully resinated particle surfaces in the mat comprise small-sized particles and facilitate stronger bonding. MDI panels were, therefore, less reliant on the influence of larger particle sizes.
MDI-HL panels with no discernible impact of PSM still produced panels with superior IB strength compared to LH equivalents. The same effect was evident in PRF and epoxy panels. This confirmed that greater panel densification can compensate for lower adhesive content to some extent if the adhesive is well distributed. Additionally, auto-adhesion during the hot-pressing stage at 190 °C might have further contributed to the superiority of MDI panels. Pressing temperature is the most essential parameter to auto-adhesion, which is considered a key principle in the manufacture of binderless panels [45]. The process is complex but generally relies on thermal softening of chemical components in the raw material (e.g., lignin, hemicelluloses) and subsequent solidification, which forms durable bonds [46]. Compression of lignocellulosic material for experimental binderless PB typically occurs between 110 °C and <200 °C [45,47,48]. Some studies also investigate pre-treatment mechanisms (e.g., chemical, enzymatic) to enhance the raw material self-binding capacity and panel performance improvements [49,50,51]. However, the effects of temperature on chemical changes in ULHPB and influence of pre-treatments on the hemp hurd were not investigated in this paper.
Most mechanical properties are proportionally linked to material density (e.g., bending strength, impact strength, screw withdrawal resistance). Additionally, lower raw material density and larger interparticle voids in low-density panels can affect machinability and panel characteristics (brittleness, rough edging) and might require remedial and supportive materials (e.g., edge sealing, bracings, laminates) for use in service. Future work should test the performance of bending strength, stiffness, screw withdrawal strength, water absorption, thickness swelling and sound transmission loss to ratify the potential and functionality of ULHPB as constituents in lightweight composite panels.
The authors acknowledge that only a single hemp variety (Frog One) was investigated in this study and that mat forming and resinating procedures to manufacture laboratory-scale panels differed from industrial practices. Considering a sensible consumption of raw materials however, our approach allowed the timely exploration of a multitude of factor combinations impossible to achieve at large. It is acknowledged that hemp variety, agronomy and processing parameters significantly influence hurd characteristics and forthcoming work should investigate these differences between diverse hemp sources. A chemical analysis of the hurd is also recommended to understand (i) the influence of the hemp properties on the curing reaction and (ii) thermally induced modifications of the particle surface and its functional groups during heat exposure in the press.

4. Conclusions

  • The study identified optimal constituent and parameter combinations that allowed certain ULHPB variants to surpass IB minimum requirements (AS/NZS 1859.1).
  • The granulometry assessment showed the smallest mean elongation and least variation of particle width and length amongst particles in the coarse PSD.
  • Irrespective of adhesive type, greater IB values were recorded in panels manufactured with the coarse particle size mix. However, the presence of coarse particles tends to increase variations between panel means (interparticle gaps) which decreases the 5-percentile value (specification limit of AS/NZS 1859.1).
  • All MDI panels manufactured with the highest particle loading and adhesive content (HH) exceeded the 0.30 MPa limit irrespective of PSM. MDI variant M-HH achieved the highest 5-percentile value. All epoxy and PRF panels failed to meet the IB quality requirements.
  • MDI achieved superior IB strengths in the presence of smaller particles sizes and low particle loading and adhesive contents. It is likely that atomisation of the adhesive led to a more consistent distribution amongst the particles.
  • Commercial PB often comprises distinct layers and much higher densities (compression ratio) which makes them mechanically superior to ULHPB. The requirements for conventional PB stipulated in AS/NZS 1859.1 were only used as a reference framework for this study. Certain components (e.g., furniture parts, wall panelling) are not subject to the same performance limits and could provide possible applications for ULHPB not meeting the standard’s thresholds. Surface lamination of ULHPB cores further expands the possible application range and implies a substantial improvement in mechanical properties.
  • Utilising residual hemp biomass as an alternative, renewable lignocellulosic feedstock in the manufacture of engineered lightweight panel products is a key principle of circular economy and an environmentally friendly strategy to address the increasing resource scarcity in the wood-based panel industry.

Author Contributions

Conceptualization, J.F., B.B. and B.O.; methodology, J.F.; software, J.F.; validation, J.F., B.B. and B.O.; formal analysis, J.F.; investigation, J.F.; resources, B.B. and B.O.; data curation, J.F.; writing—original draft preparation, J.F.; writing—review and editing, J.F., B.B. and B.O.; visualization, J.F.; supervision, B.B. and B.O.; project administration, J.F., B.B. and B.O.; funding acquisition, B.O. and B.B. All authors have read and agreed to the published version of the manuscript.

Funding

This research was funded by the Australian Government through the Australian Centre for International Agricultural Research (ACIAR) program, Project No. FST/2016/151.

Data Availability Statement

Not applicable.

Acknowledgments

The authors acknowledge the support of Darren Christie (Australian Hemp Manufacturing Company, VIC) for providing the industrial hemp hurd. We also acknowledge Sean Steed (Change Climate, SA), Shane Deveraux (Jowat Adhesives, NSW) and Travis McCallum and Brant Maitland (Huntsman Polyurethanes, VIC) for the donation of adhesive and technical support.

Conflicts of Interest

The authors declare no conflict of interest. The funders had no role in the design of the study; in the collection, analyses, or interpretation of data; in the writing of the manuscript; or in the decision to publish the results.

Appendix A

Table A1. Fisher LSD grouping information at 95% confidence level of MDI-ULHPB.
Particle Size MixParticle LoadingAdhesive ContentMean IB (MPa)Grouping *
CHighHigh0.41A
CMHighHigh0.39AB
CMFHighHigh0.37AB
MHighHigh0.37 B
MHighLow0.31 C
CMHighLow0.31 C
CHighLow0.30 CD
CMFHighLow0.30 CD
CLowHigh0.28 CDE
CMLowHigh0.27 DE
MLowHigh0.26 EF
CMFLowHigh0.23 FG
CLowLow0.21 G
CMLowLow0.21 G
MLowLow0.20 G
CMFLowLow0.17 H
* Means that do not share a letter are significantly different. Mean IB calculated from 3 specimen per panel (N = 9), C = 100% coarse, M = 100% medium, CM = 50% coarse and 50% medium, CMF = 25% coarse, 50% medium, 25% fine.
Table A2. Fisher LSD grouping information at 95% confidence level of PRF-ULHPB.
Particle Size MixParticle LoadingAdhesive ContentMean IB (MPa)Grouping *
CHighHigh0.31A
CMHighHigh0.21 B ^
CHighLow0.20 BC
CLowHigh0.19 BC
MHighHigh0.17 CD
CMLowHigh0.14 DE
CLowLow0.14 DE
CMHighLow0.13 DE
CMFHighHigh0.11 EF
MLowHigh0.09 FG
CMLowLow0.08 G
CMFLowHigh0.08 G
CMFHighLow0.07 GH
MHighLow0.07 GH
MLowLow0.05 H
CMFLowLow0.03 I
* Means that do not share a letter are significantly different. Mean IB calculated from 3 specimen per panel (N = 9), ^ Premature specimen failure (N = 8), C = 100% coarse, M = 100% medium, CM = 50% coarse and 50% medium, CMF = 25% coarse, 50% medium, 25% fine.
Table A3. Fisher LSD grouping information at 95% confidence level of epoxy-ULHPB.
Particle Size MixParticle LoadingAdhesive ContentMean IB (MPa)Grouping *
CHighLow0.33A
CHighHigh0.26AB
CMHighHigh0.23 BC
MHighHigh0.18 CD
CMFHighHigh0.17 CD
CLowHigh0.17 DE
MLowHigh0.13 DEF
CLowLow0.13 DEF
MHighLow0.13 DEF
CMLowHigh0.13 DEF
CMHighLow0.12 EFG
CMFHighLow0.11 FG
CMLowLow0.10 FG
CMFLowHigh0.09 FGH
MLowLow0.08 GH
CMFLowLow0.06 H
* Means that do not share a letter are significantly different. Mean IB calculated from 3 specimen per panel (N = 9), C = 100% coarse, M = 100% medium, CM = 50% coarse and 50% medium, CMF = 25% coarse, 50% medium, 25% fine.

References

  1. Khojasteh-Khosro, S.; Shalbafan, A.; Thoemen, H. Consumer behavior assessment regarding lightweight furniture as an environmentally-friendly product. Wood Mater. Sci. Eng. 2020, 17, 192–201. [Google Scholar] [CrossRef]
  2. Khojasteh-Khosro, S.; Shalbafan, A.; Thoemen, H. Preferences of furniture manufacturers for using lightweight wood-based panels as eco-friendly products. Eur. J. Wood Wood Prod. 2020, 78, 593–603. [Google Scholar] [CrossRef]
  3. Burnett, M.P.; Kharazipour, A. Mechanical behaviour of a lightweight, three-layered sandwich panel based on the raw material maize. Holzforschung 2017, 72, 65–70. [Google Scholar] [CrossRef]
  4. MIDWAY. Annual Report. 2019. Available online: https://www.midwaylimited.com.au/investor-center/#reports (accessed on 19 May 2020).
  5. UNECE. Forest Products Annual Market Review. 2020. Available online: https://unece.org/forests/publications/forest-products-annual-market-review-2019-2020 (accessed on 16 December 2020).
  6. de Carvalho Araújo, C.K.; Salvador, R.; Moro Piekarski, C.; Sokulski, C.C.; de Francisco, A.C.; de Carvalho Araújo Camargo, S.K. Circular Economy Practices on Wood Panels: A Bibliographic Analysis. Sustainability 2019, 11, 1057. [Google Scholar] [CrossRef] [Green Version]
  7. Schöpper, C.; Kharazipour, A.; Bohn, C. Production of innovative hemp based three-layered particleboards with reduced raw densities and low formaldehyde emissions. Int. J. Mater. Prod. Technol. 2009, 36, 358–371. [Google Scholar] [CrossRef]
  8. Balducci, F.; Harper, C.; Meinlschmidt, P.; Dix, B.; Sanasi, A. Development of innovative particleboard panels. Drv. Ind. 2008, 59, 131–136. [Google Scholar]
  9. ABARES. Australia’s State of the Forests Report. 2018. Available online: https://www.agriculture.gov.au/abares/forestsaustralia/sofr/sofr-2018 (accessed on 17 April 2020).
  10. FAO. Module: Reducing Forest Degradation. 2018. Available online: http://www.fao.org/sustainable-forest-management/toolbox/modules/reducing-forest-degradation/basic-knowledge/en/ (accessed on 17 April 2020).
  11. Pędzik, M.; Janiszewska, D.; Rogoziński, T. Alternative lignocellulosic raw materials in particleboard production: A review. Ind. Crops Prod. 2021, 174, 114162. [Google Scholar] [CrossRef]
  12. Lee, S.H.; Lum, W.C.; Boon, J.G.; Kristak, L.; Antov, P.; Pędzik, M.; Rogoziński, T.; Taghiyari, H.R.; Lubis, M.A.R.; Fatriasari, W.; et al. Particleboard from agricultural biomass and recycled wood waste: A review. J. Mater. Res. Technol. 2022, 20, 4630–4658. [Google Scholar] [CrossRef]
  13. Montford, S.; Small, E. A comparison of the biodiversity friendliness of crops with special reference to hemp (Cannabis sativa L.). J. Intern. Hemp. Assoc. 1999, 56, 53–63. [Google Scholar]
  14. Petersen, J.-E.; Elbersen, B.; Wiesenthal, T.; Feehan, J.; Eppler, U. Estimating the Environmentally Compatible Bioenergy Potential from Agriculture; European Environment Agency: Copenhagen, Denmark, 2007; Available online: https://www.eea.europa.eu/publications/technical_report_2007_12 (accessed on 21 April 2020).
  15. Food Regulation Australia. Communiqué of outcomes from the Australia and New Zealand Ministerial Forum. In Proceedings of the Food Regulation Meeting, Adelaide, Australia, 28 April 2017; Available online: https://foodregulation.gov.au/internet/fr/publishing.nsf/Content/forum-communique-2017-April (accessed on 22 April 2020).
  16. Gordon, S.; Broderick, R. A comparative analysis of cotton and hemp production in Australia. In The Australian Cottongrower (December 2019–January 2020); Greenmount Press: East Toowoomba, QLD, Australia, 2020; Available online: https://www.cottongrower.com.au/magazine/Vol40-No7 (accessed on 23 April 2020).
  17. Herbertson, S.; University of Melbourne, Melbourne, Australia. Personal Communication, 2021.
  18. Pervaiz, M.; Sain, M. Carbon storage potential in natural fiber composites. Resour. Conserv. Recycl. 2003, 39, 325–340. [Google Scholar] [CrossRef]
  19. Shahzad, A. Hemp fiber and its composites—A review. J. Compos. Mater. 2012, 46, 973–986. [Google Scholar] [CrossRef]
  20. Amziane, S.; Collet, F.; Lawrence, M.; Magniont, C.; Picandet, V.; Sonebi, M. Recommendation of the RILEM TC 236-BBM: Characterisation testing of hemp shiv to determine the initial water content, water absorption, dry density, particle size distribution and thermal conductivity. Mater. Struct. 2017, 50, 167. [Google Scholar] [CrossRef]
  21. Jami, T.; Rawtani, D.; Agrawal, Y.K. Hemp concrete: Carbon-negative construction. Emerg. Mater. Res. 2016, 5, 240–247. [Google Scholar] [CrossRef]
  22. Kristombu Baduge, S.; Mendis, P.; San Nicolas, R.; Nguyen, K.; Hajimohammadi, A. Performance of lightweight hemp concrete with alkali-activated cenosphere binders exposed to elevated temperature. Constr. Build. Mater. 2019, 224, 158–172. [Google Scholar] [CrossRef]
  23. Open Source Ecology. Hemp Stalk Anatomy. 2021. Available online: https://wiki.opensourceecology.org/wiki/File:Hemp_stalk_anatomy.png (accessed on 9 December 2021).
  24. Sam-Brew, S.; Smith, G.D. Flax Shive and Hemp Hurd Residues as Alternative Raw Material for Particleboard Production. BioResources 2017, 12, 5715–5735. [Google Scholar] [CrossRef] [Green Version]
  25. Juliana, A.H.; Paridah, M.T.; Rahim, S.; Nor Azowa, I.; Anwar, U.M.K. Properties of particleboard made from kenaf (Hibiscus cannabinus L.) as function of particle geometry. Mater. Des. 2012, 34, 406–411. [Google Scholar] [CrossRef]
  26. Li, X.; Cai, Z.; Winandy, J.E.; Basta, A.H. Selected properties of particleboard panels manufactured from rice straws of different geometries. Bioresour. Technol. 2010, 101, 4662–4666. [Google Scholar] [CrossRef]
  27. Pizzi, A. Chapter 15. Wood and Fiber Panels Technology. In Lignocellulosic Fibers and Wood Handbook: Renewable Materials for Today’s Environment; Belgacem, M.N., Pizzi, A., Eds.; John Wiley & Sons: Hoboken, NJ, USA, 2016. [Google Scholar]
  28. Kawai, S.; Sasaki, H. Low-Density Particleboard. In Recent Research on Wood and Wood-Based Materials; Shiraishi, N., Kajita, H., Norimoto, M., Eds.; Elsevier: Amsterdam, The Netherlands, 1993; pp. 33–41. [Google Scholar] [CrossRef]
  29. Picandet, V. Characterization of Plant-Based Aggregates. In Bio-Aggregate-Based Building Materials; Amziane, S., Arnaud, L., Challamel, N., Eds.; John Wiley & Sons, Inc.: Hoboken, NJ, USA, 2013. [Google Scholar] [CrossRef]
  30. Igathinathane, C.; Pordesimo, L.O.; Columbus, E.P.; Batchelor, W.; Methuku, S.R. Shape identification and particles size distribution from basic shape parameters using ImageJ. Comput. Electron. Agric. 2008, 63, 168–182. [Google Scholar] [CrossRef]
  31. Wagner, T.; Lipinski, H.-G. IJBlob: An ImageJ Library for Connected Component Analysis and Shape Analysis. J. Open Res. Softw. 2013, 1, e6. [Google Scholar] [CrossRef] [Green Version]
  32. Jowat. Technical Datasheet (950.80 PRF Resin and 950.85 Hardener); Jowat Universal Adhesives: Ingleburn, Australia, 2016. [Google Scholar]
  33. AS/NZS 4266.1; Reconstituted Wood-Based Panels—Methods of Testing. Part 1: Base Panels. SAI Global: Sydney, Australia, 2017.
  34. AS/NZS 1859.1; Reconstituted Wood-Based Panels—Specifications. Part 1: Particleboard. SAI Global: Sydney, Australia, 2017.
  35. Delhomme, F.; Hajimohammadi, A.; Almeida, A.; Jiang, C.; Moreau, D.; Gan, Y.; Wang, X.; Castel, A. Physical properties of Australian hurd used as aggregate for hemp concrete. Mater. Today Commun. 2020, 24, 100986. [Google Scholar] [CrossRef]
  36. Nguyen, D.V.; Nguyen, T.T.H.; Kubota, S.; Suzuki, S. Effects of size and type of raw material on temperature and vapour pressure behaviour of wood-based panels during hot-pressing. Wood Mater. Sci. Eng. 2021. [Google Scholar] [CrossRef]
  37. Zamarian, E.H.C.; Iwakiri, S.; Trianoski, R.; Albuquerque, C.E.C.d. Production of Particleboard from Discarded Furniture. Rev. Árvore 2018, 41, e410407. [Google Scholar] [CrossRef]
  38. Woodsolutions. 2021. Available online: https://www.woodsolutions.com.au/wood-species (accessed on 22 September 2021).
  39. WoodDatabase. 2021. Available online: https://www.wood-database.com/wood-filter/ (accessed on 22 September 2021).
  40. Maloney, T.M. Modern Particleboard & Dry-Process Fiberboard Manufacturing; Miller Freeman: San Francisco, CA, USA, 1977. [Google Scholar]
  41. Suchsland, O. An analysis of the particleboard process. Mich. State Univ. Agric. Exp. Sta. Bull. 1959, 42, 350–372. [Google Scholar]
  42. Sackey, E.K.; Semple, K.E.; Oh, S.W.; Smith, G.D. Improving core bond strength of particleboard through particle size redistribution. Wood Fiber Sci. 2008, 40, 214–224. [Google Scholar]
  43. Cosereanu, C.N.; Brenci, L.-M.N.G.; Zeleniuc, O.I.; Fotin, A.N. Effect of Particle Size and Geometry on the Performance of Single-layer and Three-layer Particleboard Made from Sunflower Seed Husks. BioResources 2014, 10, 1127–1136. [Google Scholar] [CrossRef] [Green Version]
  44. Nemli, G. Effects of some manufacturing factors on the properties of particleboard manufactured from alder (Alnus glutinosa subsp. Barbata) Turk. J. Agric. For. 2003, 27, 99–104. [Google Scholar]
  45. Zhang, D.; Zhang, A.; Xue, L. A review of preparation of binderless fiberboards and its self-bonding mechanism. Wood Sci. Technol. 2015, 49, 661–679. [Google Scholar] [CrossRef]
  46. Gedara, A.K.A.; Chianella, I.; Endrino, J.L.; Zhang, Q. Adhesiveless Bonding of Wood—A Review with a Focus on Wood Welding. BioResources 2021, 16, 6448–6470. [Google Scholar] [CrossRef]
  47. Mahieu, A.; Alix, S.; Leblanc, N. Properties of particleboards made of agricultural by-products with a classical binder or self-bound. Ind. Crops Prod. 2019, 130, 371–379. [Google Scholar] [CrossRef]
  48. Ferrandez-Villena, M.; Ferrandez-Garcia, C.E.; Garcia-Ortuno, T.; Ferrandez-Garcia, A.; Ferrandez-Garcia, M.T. The Influence of Processing and Particle Size on Binderless Particleboards Made from Arundo donax L. Rhizome. Polymers 2020, 12, 696. [Google Scholar] [CrossRef] [Green Version]
  49. Widsten, P.; Kandelbauer, A. Adhesion improvement of lignocellulosic products by enzymatic pre-treatment. Biotechnol. Adv. 2008, 26, 379–386. [Google Scholar] [CrossRef] [PubMed]
  50. Bekhta, P.; Korkut, S.; Hiziroglu, S. Effect of Pretreatment of Raw Material on Properties of Particleboard Panels Made from Wheat Straw. BiorResources 2013, 8, 4766–4774. [Google Scholar] [CrossRef] [Green Version]
  51. Väisänen, T.; Batello, P.; Lappalainen, R.; Tomppo, L. Modification of hemp fibers (Cannabis sativa L.) for composite applications. Ind. Crops Prod. 2018, 111, 422–429. [Google Scholar] [CrossRef]
Figure 1. Schematic depiction of hemp stalk cross-section (adapted from: [23]).
Forests 13 01967 g001
Figure 2. Particle size categories of hemp hurd furnish considered for the panel manufacture: fine (≥0.6 to 1 mm) (a), medium (≥1 to 2 mm) (b) and coarse (≥2 to 4 mm) (c).
Forests 13 01967 g002
Figure 3. Overview of panel compositions by means of IB specimen. (Only high particle loading and high adhesive content specimen depicted).
Forests 13 01967 g003
Figure 4. Measurement locations of panel thickness (positions 1 to 8 indicated) (a) and schematic IB specimen sampling per panel (b).
Forests 13 01967 g004
Figure 5. Disjointed areas (islands) (a) and incomplete particle selection (b) led to the rejection of some voluminous particles in ImageJ.
Forests 13 01967 g005
Figure 6. Estimated mass distribution per particle size category for particle width (red) and length (black) at logarithmic scale. Blue lines indicate D20 and D80 and mark the separation of each PSD into three distinct ranges (<D20; D20–D80; >D80) for individual observation.
Forests 13 01967 g006
Figure 7. Average bulk density per particle size category obtained through three repeated measurements (a); average air-dry density (ADD) of Frog One hemp (15 specimen) compared to average ADD values of commercial timbers. Data obtained from [38] and * [39] (b). Error bars indicate standard deviations.
Forests 13 01967 g007
Figure 8. IB strength of panel variants as a function of particle size mix. C = 100% coarse, M = 100% medium, CM = 50% coarse and 50% medium, CMF = 25% coarse, 50% medium, 25% fine, HH = High particle loading and high adhesive content; HL = High particle loading and low adhesive content; LH = Low particle loading and high adhesive content; LL = Low particle loading and low adhesive content.
Forests 13 01967 g008
Figure 9. Comparison of 5-percentile values between panel variants of MDI, PRF and Epoxy ULHPB.
Forests 13 01967 g009
Table 1. Selected properties of MDI, PRF and epoxy adhesive.
Properties at 25 °CMDIPRFEpoxy
ResinHardenerResinHardener
Appearancedark-brown liquidred-brown liquidbrown powdercolourless liquidcolourless liquid
Mixed ratio (% by wt)n/a802077.222.8
Viscosity (cP)180–370400–700n/a750–85015–20
Mixed viscosity (cP)n/a3000–5000150–250
Specific gravity (g/cm3)1.24n/an/a1.24–1.250.92–0.95
EEW 1/AHEW 2 (g/eq)n/an/a 145–14642–43
Solids content (%)n/a48–54n/a100
% NCO 329.5n/an/a
pHn/a9.4–9.66.0–8.0
1 EEW = Epoxy equivalent weight, 2 AHEW = Amine hydrogen equivalent weight, 3 NCO = isocyanate group.
Table 2. Particle size categories and proportions in the panel variants.
Particle Size CategoryParticles Retained On:Particle Size Mix Configuration (%)
Tyler Mesh No.Mesh Aperture (mm)CMCMCMF
Oversize540000
Coarse (C) 9210005025
Medium (M) 16101005050
Fine (F)280.600025
Undersizepan<0.60000
Table 3. Ultra-low-density hemp particleboard fabrication parameters.
Adhesive ApplicationPressing Parameters
TypeApplication MethodMixing Duration (s)Pressure (MPa)Temperature (°C)Duration (h)
MDIatomised901.411900.25
PRFpour-and-blend180800.25
Epoxypour-and-blend180ambient17.0
Table 4. Design and notation of ultra-low-density hemp particleboard variants per adhesive type (one of three replicates depicted).
Particle Size MixMDIPRFEpoxyLabel
Particle Loading (%)Adhesive Content (%)Particle Loading (%)Adhesive Content (%)Particle Loading (%)Adhesive Content (%)
C20032001520015C-LL
C20062002020020C-LH
C25032501525015C-HL
C25062502025020C-HH
M20032001520015M-LL
M20062002020020M-LH
M25032501525015M-HL
M25062502025020M-HH
CM20032001520015CM-LL
CM20062002020020CM-LH
CM25032501525015CM-HL
CM25062502025020CM-HH
CMF20032001520015CMF-LL
CMF20062002020020CMF-LH
CMF25032501525015CMF-HL
CMF25062502025020CMF-HH
C = 100% coarse, M = 100% medium, CM = 50% coarse and 50% medium, CMF = 25% coarse, 50% medium, 25% fine, LL = Low particle loading and low adhesive content, LH = Low particle loading and high adhesive content, HL = High particle loading and low adhesive content, HH = High particle loading and high adhesive content.
Table 5. Gradual refinement of particle counts in preparation for the granulometry evaluation.
PSCParticles Scanned (N)Particles Rejected in ImageJ (%)Particles Considered for Filtering (N)Particles Rejected (%) at Solidity (S)Combined Particle Rejection at S > 0.75 (%)Considered for Evaluation at
S > 0.75 (N)
>0.50>0.63>0.75
Coarse19884.618960.31.45.910.51785
Medium83931.382820.10.94.76.07893
Fine83731.082900.21.24.85.87889
Table 6. Properties of estimated mass particle size distributions (PSD) per range and granulometry.
OrientationVariableCoarseMediumFine
Particle width (mm)<D20 Max2.411.420.72
<D20 Min0.240.240.23
<D20 Mean1.831.100.58
<D20 SD0.590.240.10
D20–D80 Max3.462.141.04
D20–D80 Min2.411.420.72
D20–D80 Mean2.831.720.85
D20–D80 SD0.280.200.09
>D80 Max5.343.451.77
>D80 Min3.472.141.04
>D80 Mean3.872.321.13
>D80 SD0.370.160.09
Particle length (mm)<D20 Max4.763.051.50
<D20 Min0.690.680.63
<D20 Mean3.522.241.18
<D20 SD1.070.510.20
D20–D80 Max8.345.763.08
D20–D80 Min4.673.051.50
D20–D80 Mean5.864.032.05
D20–D80 SD0.920.710.41
>D80 Max15.2016.2510.05
>D80 Min8.445.763.09
>D80 Mean10.016.953.88
>D80 SD1.341.260.88
Mean elongation (Ɛ)<D20 1.932.032.01
D20–D80 2.072.342.42
>D80 2.593.003.42
Δℇ to D20–D80 (%)<D20−7−13−17
>D80 252842
Ranges: D20: lower range, D20–D80: bulk range, D80: upper range, ɛ is the arithmetic mean elongation.
Table 7. Compression ratios of ultra-low-density hemp particleboard and resulting IB specimen densities per variant and adhesive type.
Variant Compression Ratio *Specimen Density (kg/m3) **
MDIPRFEpoxyMDIPRFEpoxy
C-HH1.17 (0.01)1.18 (0.00)1.08 (0.04)278 (10)308 (11)295 (12)
M-HH1.18 (0.00)1.18 (0.00) 1.09 (0.02)279 (10) 302 (10)298 (6)
CM-HH1.18 (0.00)1.18 (0.00)1.08 (0.04)279 (10) 303 (10)293 (19)
CMF-HH1.16 (0.00)1.16 (0.00)1.06 (0.04)278 (7)294 (9)290 (13)
C-HL1.17 (0.00)1.18 (0.00)1.13 (0.04)267 (9) 293 (10)298 (17)
M-HL1.18 (0.00)1.18 (0.00)1.08 (0.01)271 (9)286 (11)278 (7)
CM-HL1.17 (0.01) 1.19 (0.01)1.05 (0.01)268 (10)292 (8)265 (7)
CMF-HL1.16 (0.00)1.16 (0.00)1.08 (0.03)264 (9) 277 (12)276 (21)
C-LH0.95 (0.00)0.95 (0.00)0.93 (0.02)223 (8)243 (7)250 (21)
M-LH0.96 (0.00)0.96 (0.00)0.92 (0.01)223 (8) 233 (10)256 (12)
CM-LH0.95 (0.00)0.96 (0.00)0.92 (0.02)221 (10) 241 (11)244 (12)
CMF-LH0.94 (0.00)0.94 (0.00)0.92 (0.02)217 (9) 228 (15)243 (19)
C-LL0.95 (0.00)0.96 (0.00)0.92 (0.05)214 (5) 233 (7)227 (18)
M-LL0.95 (0.00)0.96 (0.00)0.93 (0.02)213 (9)222 (13)232 (18)
CM-LL0.95 (0.00)0.96 (0.00)0.93 (0.02)213 (9) 227 (9)235 (15)
CMF-LL0.94 (0.00)0.94 (0.00)0.92 (0.03)210 (7)218 (7)224 (21)
C = 100% coarse; M = 100% medium; CM = 50% coarse and 50% medium; CMF = 25% coarse, 50% medium, 25% fine, HH = High particle loading and high adhesive content; HL = High particle loading and low adhesive content; LH = Low particle loading and high adhesive content; LL = Low particle loading and low adhesive content, * Compression ratio calculated as average of three panels at EMC, ** Specimen density calculated as average of n = 9, Standard deviation in parenthesis.
Table 8. Test of fixed effects of internal bond strength of MDI, PRF and epoxy ULHPB.
EffectMDIPRFEpoxy
p-ValueF-Valuep-ValueF-Valuep-ValueF-Value
Particle size mix0.001 *7.160.000 *85.400.000 *24.02
Particle loading0.000 *402.370.000 *80.730.000 *67.35
Adhesive content0.000 *137.670.000 *126.750.000 *21.62
Particle size mix x Particle loading0.0912.350.6150.610.0582.77
Particle size mix x Adhesive content0.3611.110.8010.330.032 *3.31
Particle loading x Adhesive content0.9820.000.2311.490.8750.03
Particle size mix x Particle loading x Adhesive content0.7840.360.1022.250.041 *3.08
* Significant at < 0.05 probability level.
Table 9. IB results and corresponding 5-percentile comparison values of MDI, PRF and epoxy ULHPB.
Particle Size MixParticle LoadingAdhesive ContentMDIPRFEpoxy
x = s x ¯   L5% x =   s x ¯     L5% x =   s x ¯     L5%
CHighHigh0.410.050.310.310.020.270.260.040.17
CHighLow0.310.020.250.190.040.110.330.050.20
CLowHigh0.280.010.260.190.040.110.170.040.08
CLowLow0.210.010.200.130.020.090.140.060.01
MHighHigh0.370.000.360.170.000.160.180.040.09
MHighLow0.320.020.270.070.020.030.140.030.07
MLowHigh0.260.010.230.100.020.050.140.030.06
MLowLow0.210.020.160.060.010.040.080.010.07
CMHighHigh0.390.030.320.210.030.130.230.050.13
CMHighLow0.310.020.270.130.020.080.120.010.10
CMLowHigh0.270.010.250.150.020.100.130.020.09
CMLowLow0.210.010.180.080.020.040.110.020.05
CMFHighHigh0.370.020.320.110.020.080.180.030.12
CMFHighLow0.300.020.250.070.000.060.110.020.07
CMFLowHigh0.230.020.180.080.020.040.100.020.04
CMFLowLow0.170.020.130.030.010.010.060.030.00
L 5 %   is the lower 5-percentile comparison value of the sample (MPa), x = is the arithmetic mean of all measurements obtained from a sample (MPa), s x ¯ is the estimated standard deviation between panel means.
Publisher’s Note: MDPI stays neutral with regard to jurisdictional claims in published maps and institutional affiliations.

