Article

Calibration of Thermal Dissipation Probes for Xylem Sap Flow in the Wood of a Diffuse-Porous and a Conifer Species under Cyclic Heating

1
Key Laboratory of Tree Breeding and Cultivation, National Forestry and Grassland Administration, Research Institute of Forestry, Chinese Academy of Forestry, Beijing 100091, China
2
Collaborative Innovation Center of Sustainable Forestry in Southern China, Nanjing Forest University, Nanjing 210037, China
3
College of Forestry, Hebei Agricultural University, Baoding 071000, China
4
Hebei Agricultural University, Baoding 071000, China
5
Institute of Desertification Studies, Chinese Academy of Forestry, Beijing 100091, China
*
Author to whom correspondence should be addressed.
Forests 2022, 13(11), 1964; https://doi.org/10.3390/f13111964
Submission received: 25 October 2022 / Revised: 15 November 2022 / Accepted: 17 November 2022 / Published: 21 November 2022
(This article belongs to the Special Issue Sap Flow Measurements—A Tool To Talk with Trees)

Abstract

:
The most popular sap flow measurement technique uses thermal dissipation probes. Differences in wood characteristics and the natural temperature gradient between probes have affected the accuracy and applicability of the sap flow equation. In addition, the continued heat of the probe can also cause thermal damage to tree tissue. The objectives of this study were to use cyclic heating and calibrate the probes with two species: Pinus bungeana Zucc. And Salix matsudana Koidz., two typical diffuse-porous species. This experiment evaluated a thermal dissipation probe in three heating modes: continuous heating, 10 min heating and 50 min cooling (10/50), and 30 min heating and 30 min cooling (30/30). The heating modes were evaluated on two species. Temperature differences between the heating needle and the control needle under different heating modes and transpiration water consumption (whole-tree weighing method) were observed simultaneously. The sap flow estimation equation under cyclic heating mode was established by analyzing the relationship between the sap flow rate and the values obtained from whole-tree weighing. The results showed that the original equation underestimated sap flow rate of P. bungeana and S. matsudana by 67% and 60%. Under the cyclic heating modes, the modified equations were different from the original equation, and their accuracy was improved. After verification, the corrected equations [Fd = 0.0264K0.738 (P. bungeana, 30/30, R2 = 0.67), Fd = 0.0722K1.113(S. matsudana, 30/30, R2 = 0.60), Fd is the sap flow density, K is temperature coefficient] reduced the influence of the natural temperature gradient on the estimation of sap flow rate, thereby significantly improving the accuracy of sap flow rate estimation. The resulting equation may be more suitable for actual field observations of sap flow in the two tested species. The cyclic heating mode has the potential to measure plant transpiration for extended periods in the field.

1. Introduction

Transpiration is a complex water movement process in the soil-plant-atmosphere continuum. Accurate measurement of vegetation transpiration is of great significance for understanding the water cycle of terrestrial ecosystems and its response to climate change. In order to accurately calculate vegetation water use efficiency and transpiration water consumption, researchers have proposed a variety of measurement methods. Sap flow is the process of water transport in the sapwood of the stem, and is considered to be useful for estimating tree transpiration. Sap flow measurement techniques mainly include the heat pulse method [1], the heat balance method [2], and the thermal dissipation method (TDM) [3]. Compared with the other two thermal technologies, TDM has the advantages of being a common principle, having simple operation, and permitting continuous observation [4]. TDM is widely used to estimate individual tree transpiration [5,6], characterize terrestrial ecosystem evapotranspiration [7,8], and conduct water balance research [9,10]. At present, the general equation for estimating sap flow density by TDM is an empirical equation derived from three tree species, Pseudotsuga menziesii (Mirb.) Franco, Pinus nigra J. F. Arnold, and Quercus pedunculata Ehrh. [3], without considering the heat conduction process in sapwood [11]. Recent research has shown that the estimation accuracy of this formula was significantly different under different conditions [12,13,14]. Azimuthal profile [15], radial difference [16], wood characteristics [17], sensor type [18], and other factors can affect estimation accuracy. Therefore, an accuracy test and formula calibration should be carried out before using the TDM to estimate transpiration [19].
Natural temperature gradient resulting from changes in environmental temperature is affected by bark thickness, irregular tree growth, and the distance between the tree and the forest edge [20,21]. When the natural temperature gradient of the tree is greater than 0.2 °C, there will also be a non-negligible error in the estimation of sap flow density [22]. In order to reduce the influence of the natural temperature gradient, two sets of parallel probes can be set, one set of heated probes and the other set of unheated probes, replacing the natural temperature gradient of the heated probe with the temperature difference in the unheated probes [12]. The cyclic heating mode could replace the natural temperature gradient by the temperature between the two probes in the cooling stage, thereby enhancing estimation accuracy and at the same time having the advantages of reducing both energy consumption and stem dry heat damage [23]. Subsequent studies determined that single-probe cyclic heating can also achieve the purpose of considering the natural temperature gradient. The influence of natural temperature difference is considered in the calculation method of temperature difference in the cyclic heating mode, which is different from that in the traditional continuous heating mode. The time for the probe to reach a stable state is related to the thermal characteristics of the sensor and the wood. When applying the cyclic heating mode, different power supply schemes should be adopted according to different situations [24]. Therefore, under the cyclic heating mode, an appropriate heating time should also be selected for specific tree species, and the estimation equation should be reconstructed.
Calibration experiments have been carried out for many years, and in order to fit the practical application, the calibration environment gradually changed from indoor to field. The usual method employed was to take the stems from the trees, and water flows were forced into the detached stem by applying pressure. The change of volume and weight were used as the basic data for calibration. These data could result in a comprehensive and wide range of sap flow rates and higher-resolution data [25]. However, the lack of leaves and roots in the detached stem destroyed the complete hydraulic path and plant forms and easily causes embolism. The sap flow in the water conduction structure was completely out of the actual environment and unrepresentative of natural conditions. In order to simulate the actual transpiration of trees, previous research used root-cut trees (retaining branches and leaves) as the experimental material and a high-precision electronic potometer as the reference [26]. Transpiration initiates sap flow similar to natural conditions, but the intact hydraulic path was still destroyed. This problem can be solved by using living potted trees as experimental materials, which can best represent the transpiration of trees in real environment. However, due to the low resolution of instruments in past studies, transpiration can only be analyzed on a daily scale. However, due to the small proportion of mass changes caused by transpiration in the weight of tree, the accuracy and temporal resolution of this experiment were low. Sperling, et al., and Tfwala, et al., took living trees as the experimental material and used a lysimeter to provide the reference data to obtain an estimation equation suitable for Phoenix dactylifera L., Ziziphus mucronata Willd., and four other species [27,28]. This method is similar to real conditions and is accurate, but lysimeters are expensive and inconvenient to operate. Different experimental methods determine the reliability and applicability of the calibration equation, so it is necessary to choose the most suitable experimental scheme according to the actual research situation.
The density, diameter, and distribution of xylem water-conducting tissues influence hydraulic conduction and may affect plant transpiration [29]. Density and distribution of water-conducting tissue in the xylem affects plant transpiration. The widely-used equation assumed that the water-conducting tissue and sap flow were uniformly distributed within the sapwood, but this was not the case in practice. According to the characteristics of water-conducting tissue, woody plants can be divided into three types: ring-porous, diffuse-porous and conifer [3]. Studies have found that ring-porous wood vessels are distributed in sapwood in a circular manner, and xylem sap flow is mainly distributed in vessels from the current year tree ring, with great differences in radial direction. The consistency of sap flow between different species and individuals of the same species is poor [14,30]. In contrast, vessels/tracheid of diffuse-porous species and conifer were uniformly distributed in the stem sapwood, and there was no significant difference in the radial distribution of sap flow [17]. Therefore, we chose diffuse-porous and conifer with slight radial differences as research objects to explore the TDP of cyclic heating mode.
To determine the feasibility of using the cyclic heating mode to estimate diffuse-porous species and conifer sap flow, we chose a high-precision balance as the benchmark to carry out the TDP calibration experiment on Salix matsudana Koidz. (diffuse-porous) and Pinus bungeana Zucc. (conifer) in the cyclic heating mode. The main objectives of this study were to: 1) compare the variation in trends of temperature differences under different heating modes and judge whether the cyclic heating mode is suitable for transpiration estimation for the two species; 2) establish and verify estimation equations under different circumstances to determine the optimal formula for each species; and 3) determine the influence of species (wood characteristics) on the determination of heating patterns. We expect to provide a theoretical basis for accurate estimation of sap flow in the presence of natural temperature gradients and for long-term field observations made by TDM.

2. Materials and Methods

2.1. Study Site

This experiment was conducted at the experimental station of Hebei Agricultural University (latitude 38°48′23′′ N; longitude 115°24′58′′ E), located in Baoding, China. There are more than 110 species of trees at this location, including Sophora japonica L., Populus tomentosa Carr., S. matsudana, and P. bungeana. The research area experiences a warm temperate monsoon climate, and precipitation is mainly concentrated from June to August. The average annual precipitation and evaporation are 499 mm and 1430 mm, respectively. The average annual temperature is 13.4 °C, and the annual sunshine duration for the study area is 2511 h.

2.2. Measurement

Before the growing season, S. matsudana and P. bungeana were transplanted into containers with controllable drainage holes at the bottom (diameter = 100 cm and height = 90 cm, with radiation-proof film on the outside of the containers). In July, when transpiration was high, three trees of each species were selected for the experiment, and the soil in the container was covered with plastic film. Full irrigation before the experiment ensured an adequate water supply during the measurement period. The details of the samples are shown in Table 1. The experimental materials were obtained from the field experiment station of Hebei Agricultural University.

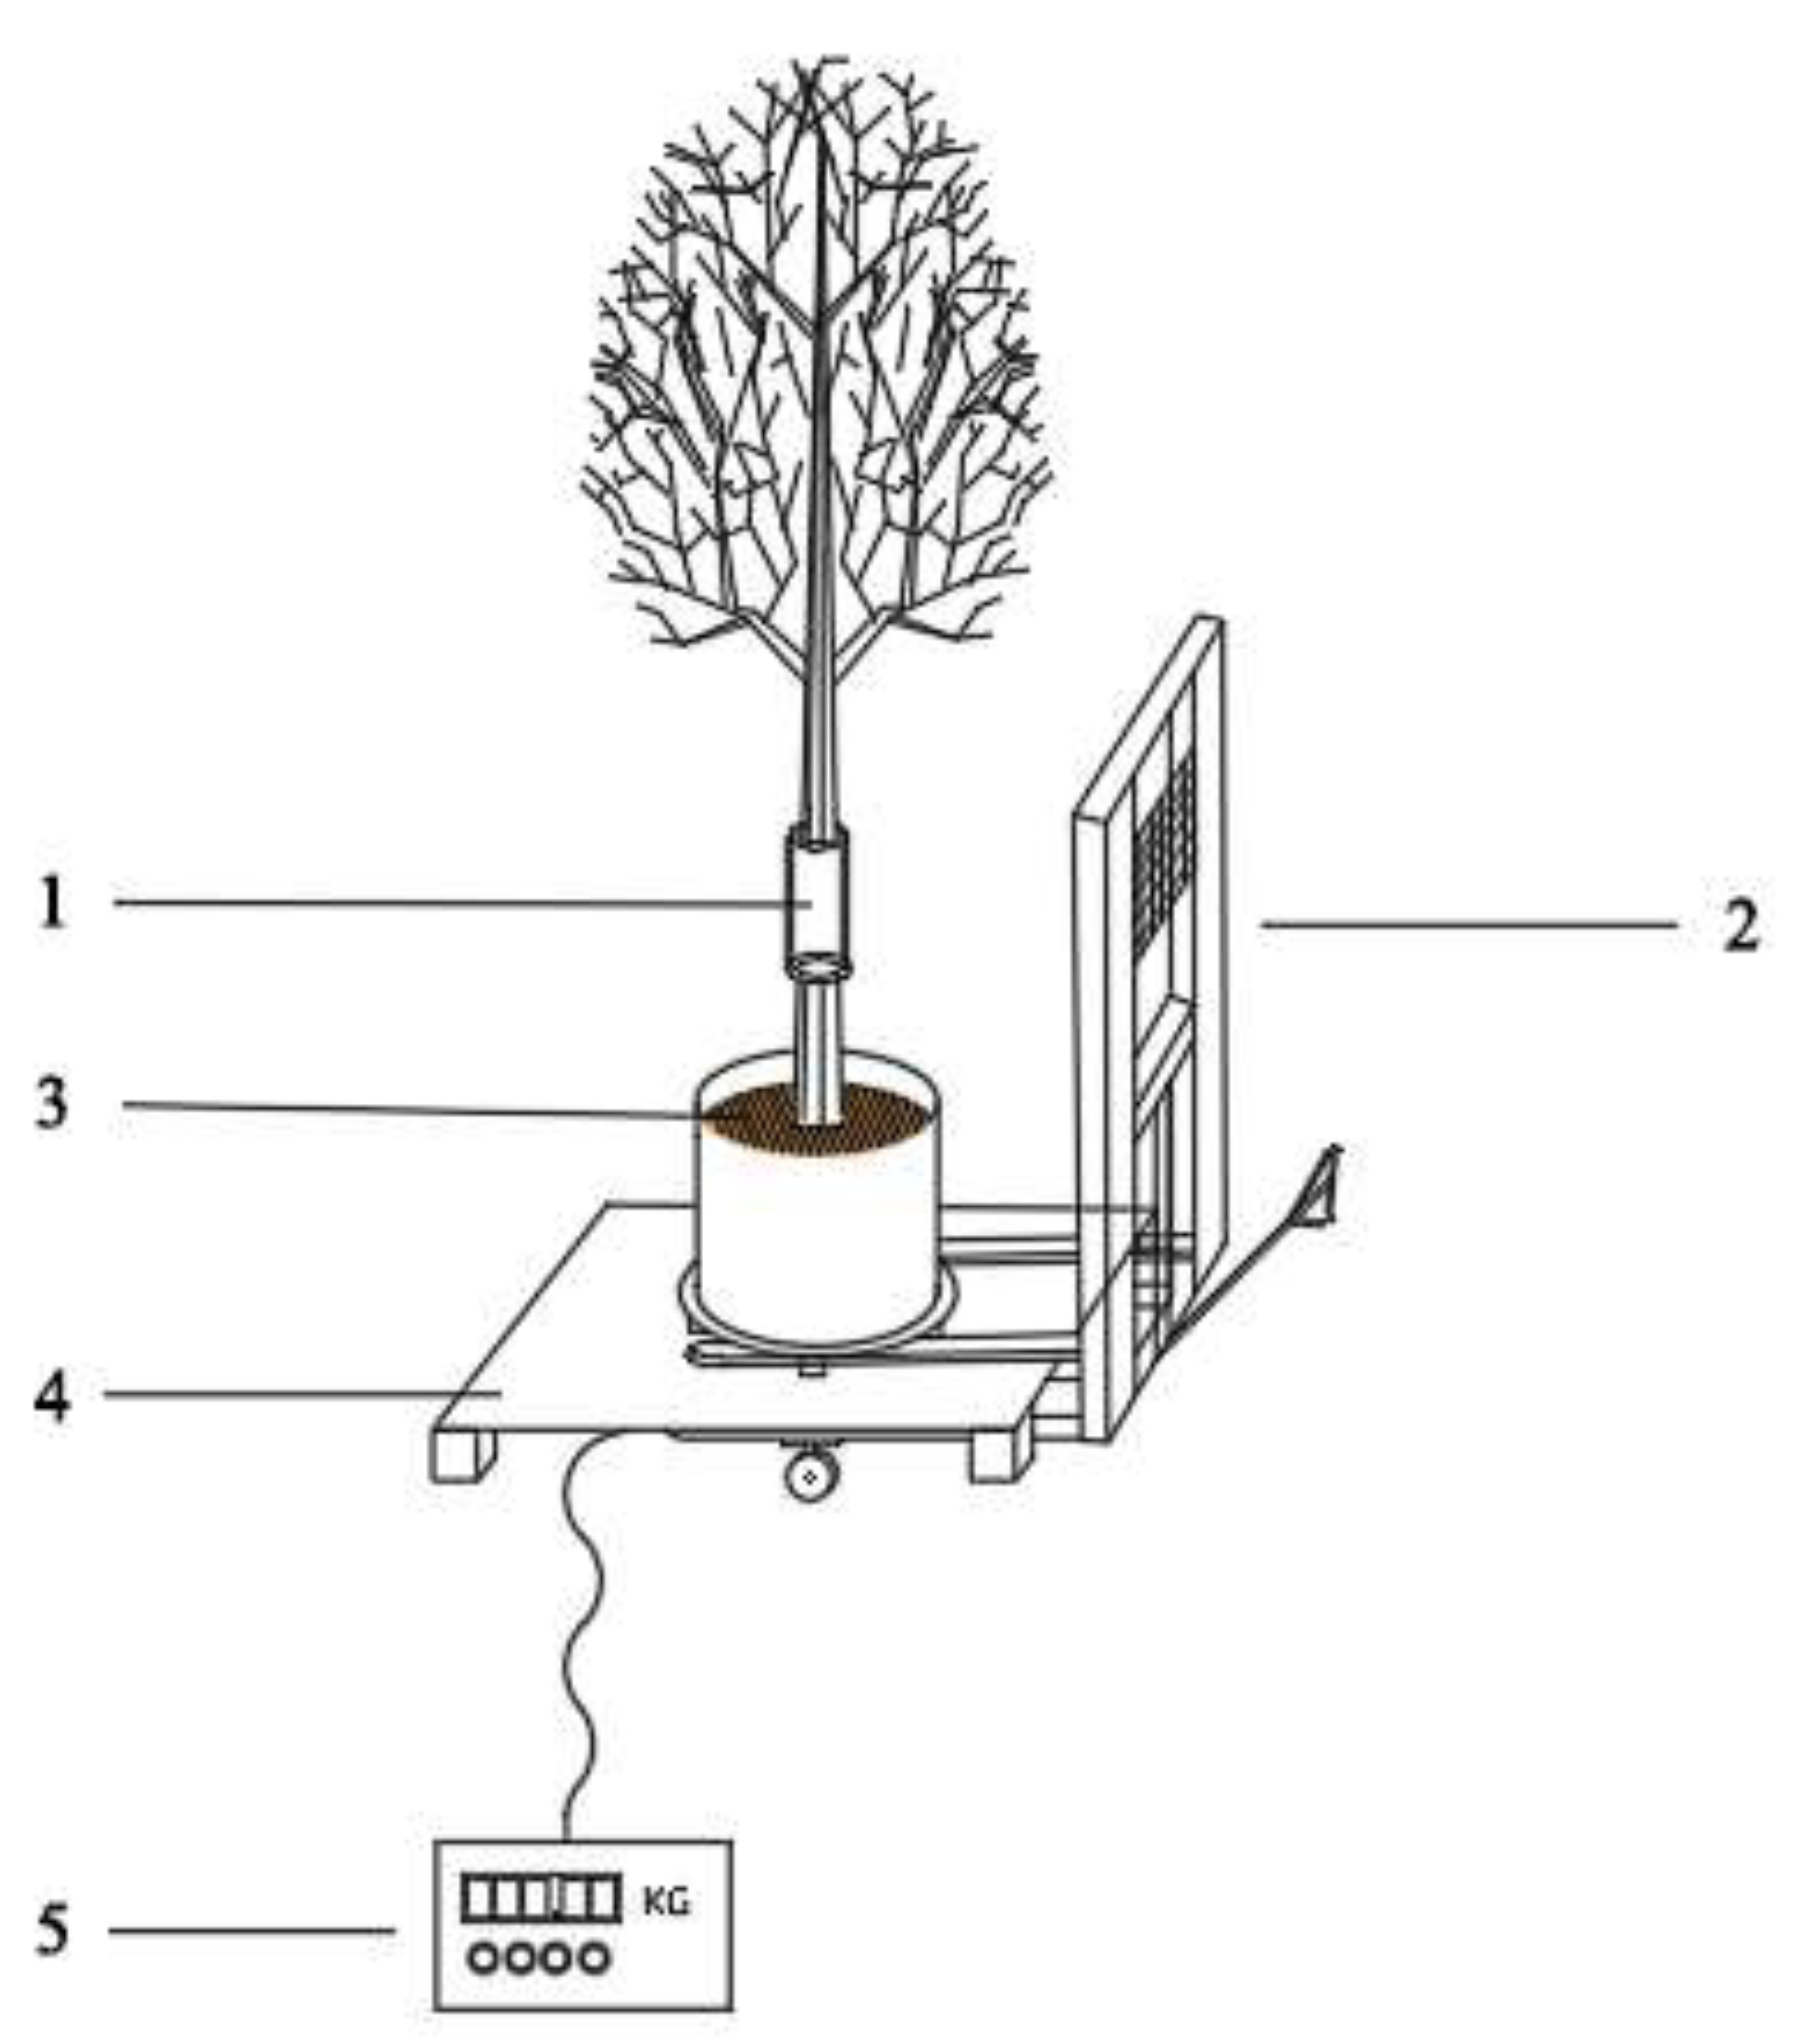
2.2.1. Sap Flow Measurement

Each tree was instrumented with three TDP units (Rainroot Scientific Limited, Beijing, China) to measure temperature changes over time. Each probe unit consisted of two needles (length = 20 mm, diameter = 2 mm, operation voltage = 2 V, spacing = 40 mm). The upper needle was heated, and the lower needle was not heated. One probe unit was set for continuous heating, another unit was designated as “10/50” (10 min heating and 50 min cooling), and the third unit was designated as “30/30” (30 min heating and 30 min cooling). The probe temperature data were collected by a datalogger (CR1000, Campbell Scientific Inc., Logan, UT, USA). We used the original equation form to calculate the sap flow density [3]:
Fd = α K β
K = Δ T max Δ T / Δ T
where, Fd is the sap flow density (cm3·cm−2·s−1); Δ T max is the temperature difference at zero flow (in this study, Δ T max is the maximum daily temperature difference); Δ T is the instantaneous temperature difference, K is temperature coefficient; α and β are curve fitting coefficients.
Based on Granier’s equation, the temperature difference at the end of the cooling stage is regarded as the natural temperature gradient, and then the natural temperature gradient is separated from the temperature difference between probes. The equation is:
Δ T = Δ T C Δ T 0
where, Δ T C and Δ T 0   are the temperature differences at the end of heating and cooling stages, respectively.

2.2.2. Reference Flow Rate Measurement

In order to calibrate the sap flow density equation with the temperature coefficient (K) measured by TDP, the reference sap flow was measured by the whole-tree weighing method (Fdw). To eliminate the impact of soil water evaporation on the measurement, the surface of the soil was sealed with plastic film. The experiment was carried out in the field so that the flow process would be fully represented under natural conditions (Figure 1). A wide-range balance (model XK3190-A6, range: 1000 kg, accuracy: 0.02 kg) was used to weigh living trees. The weighing time was from 6:00 to 19:00 every day, and the weighing time interval was 1 h. For the sake of comparison, we harmonized the unit of Fd and Fdw. The estimation equation for Fdw (cm3·cm−2·s−1) is:
Fd w = W 1 W 2 1000 / As 3600
W 1 W 2 is the difference between two sequential weights (kg); As is the sapwood area (cm2), obtained from cores that were collected by a Pressler Borer to identify sapwood.

2.3. Statistical Analysis

The experiment was carried out for five days, and we divided the weighing data and fluid flow data into two groups. The first group of data was obtained by regression fitting of three days of data for K and Fdw. The second group of data used two days of data to verify the accuracy of the calibration equation. To ensure the reliability of the result, the following analysis was based on the average value of each three trees. Relative to the reference value, the goodness of fit of the estimated value was determined by coefficient of determination (R2) and Willmott’s index of agreement (D) [31]. The accuracy of the estimate was determined by root mean square error (RMSE) and mean absolute error (MAE). The mean bias error (MBE) was calculated to determine the deviation between the predicted tree sap flow rate and the reference flow rate. The calculation formulas for the evaluation indexes are:
D = 1 i = 1 N P i O i 2 i = 1 N P i O ¯ + O i O ¯ 2
RMSE = N 1 i = 1 N P i O i 2 0.5
MAE = 1 N i = 1 N P i O i
MBE = 1 N i = 1 N P i O i
P i and O i are the predicted and observed current time values, respectively;   O   ¯ is the mean observed value; N is the number of observations.

3. Results

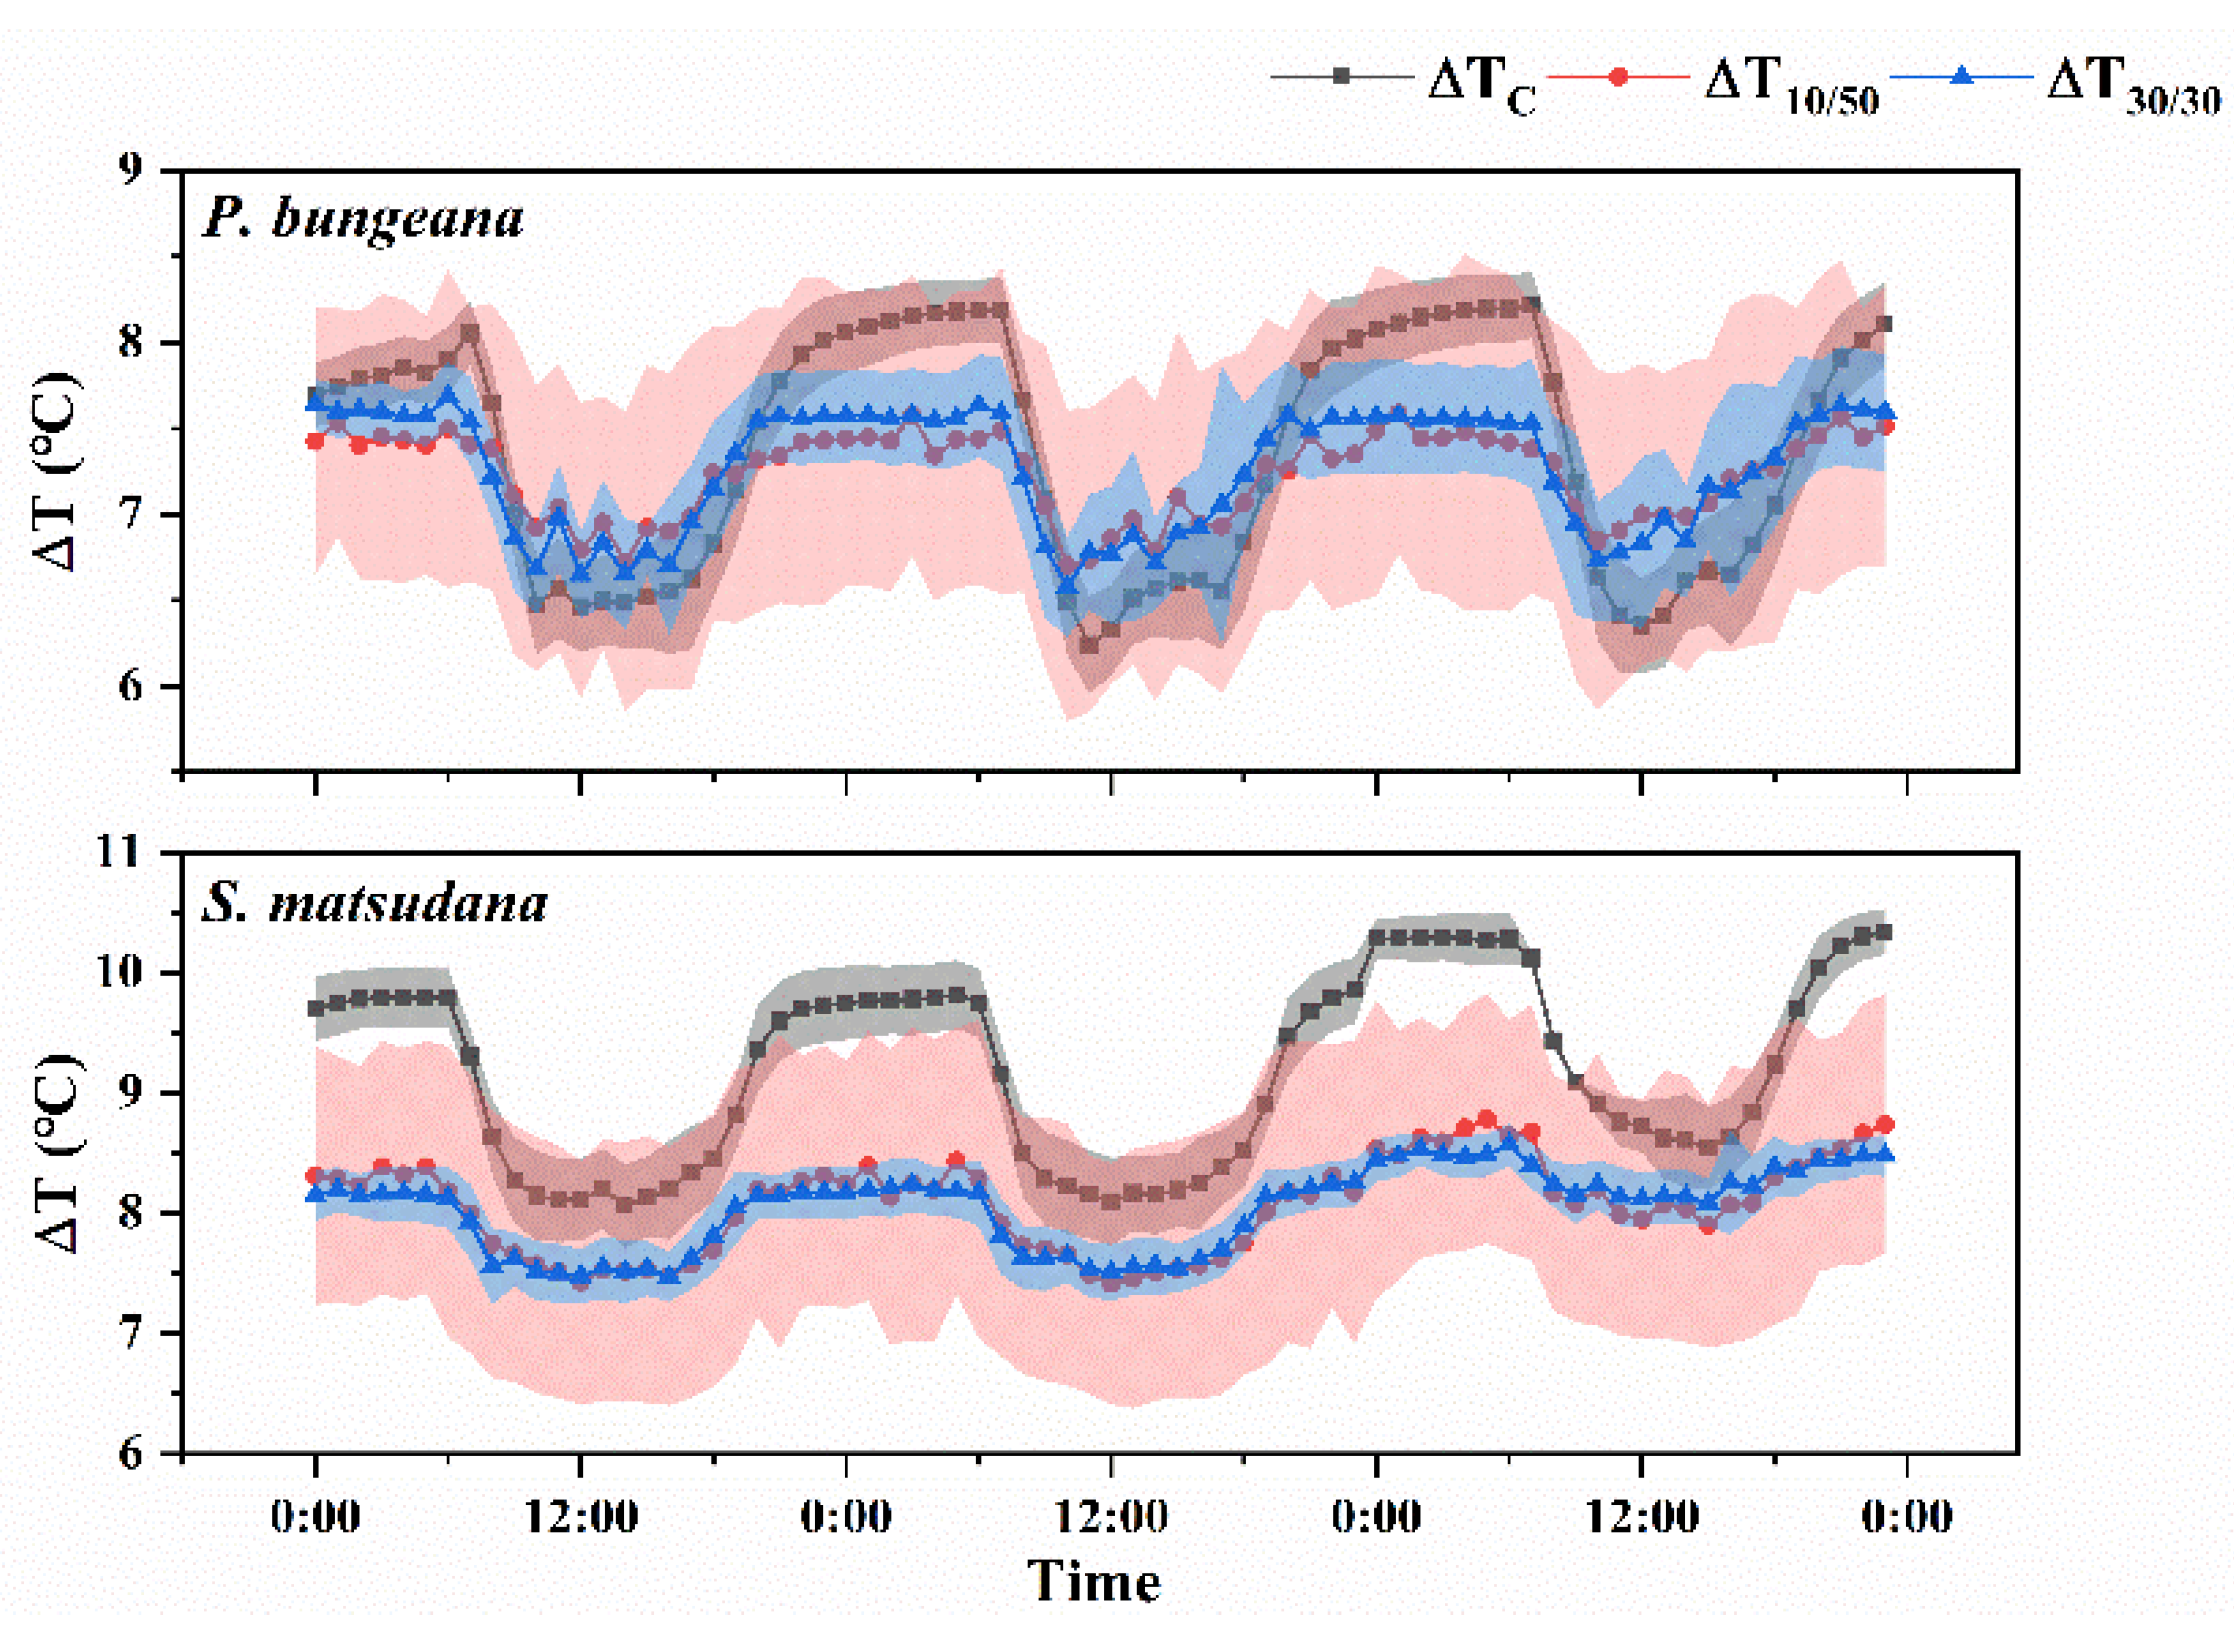
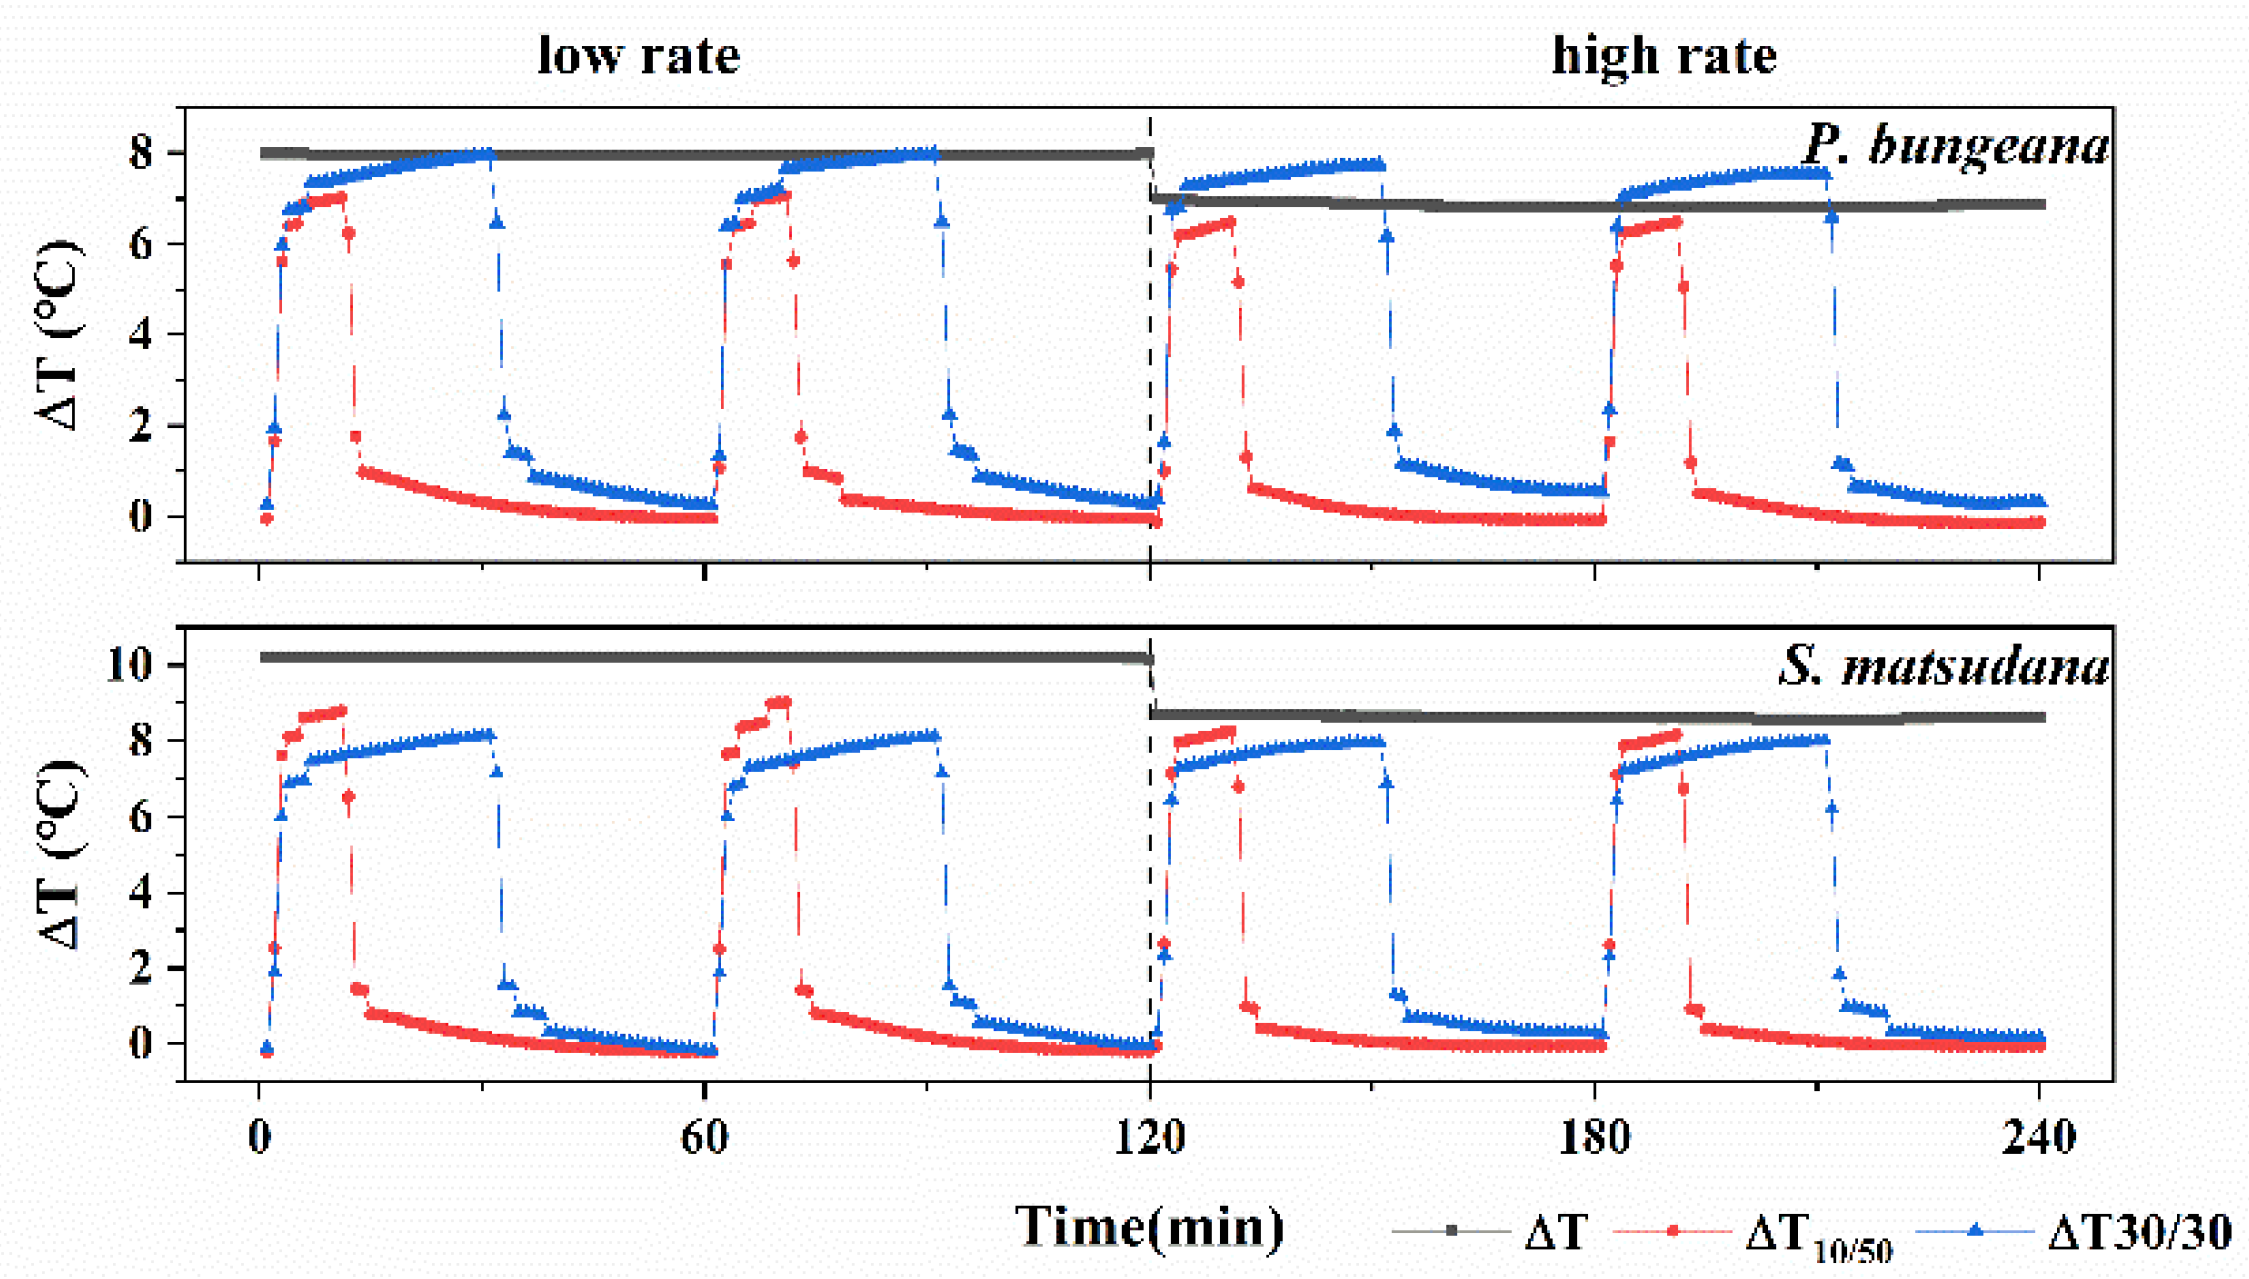
3.1. Tendency of Temperature Difference under Different Heating Modes

In order to determine the feasibility of measuring sap flow using probes in the cyclic heating mode, we compared the diurnal variation characteristics of the probe temperature differences under different heating modes (Figure 2). The temperature difference and amplitude of the two species under the continuous heating mode were higher than those under cyclic heating. Temperature differences began to decline gradually at 5:00, reached a minimum at about 11:00, and gradually increased after noon. When the two tree species were heated continuously, the temperature differences between the needles were relatively stable during the day and night. The temperature differences for the two cyclic heating modes fluctuated more and had poorer stability than the continuous heating mode, especially for the 10/50 mode.
The larger the temperature difference, the slower the flow rate, and vice versa. We selected 4:00 to 5:00 and 11:00 to 12:00 to represent low and high flow rate conditions, respectively. The mean temperature differences of P. bungeana and S. matsudana under high and low flow rate conditions were 1.1 °C and 1.58 °C for the continuous heating mode; 0.56 °C and 0.7 °C for the 10/50 mode; and 0.33 °C and 0.16 °C for the 30/30 mode. The temperature differences between the probe needles increased sharply during the heating stage of the cyclic modes. Temperature difference between the probes changed dramatically when the cyclic mode switched heating/cooling. In both heating and cooling stage, the time required to reach equilibrium under high sap flow is shorter than that under low sap flow. The temperature differences in the cooling stage were consistent with those observed in the heating stage, and decreased rapidly within 2 min and tended to be stable after 10 min (Figure 3). The cooling process takes longer to reach equilibrium than the heating process. Because there was a good correlation between the temperature difference observed for cyclic heating and that for continuous heating, the cyclic heating probe also has potential to be applied to sap flow rate measurements of the two tree species.

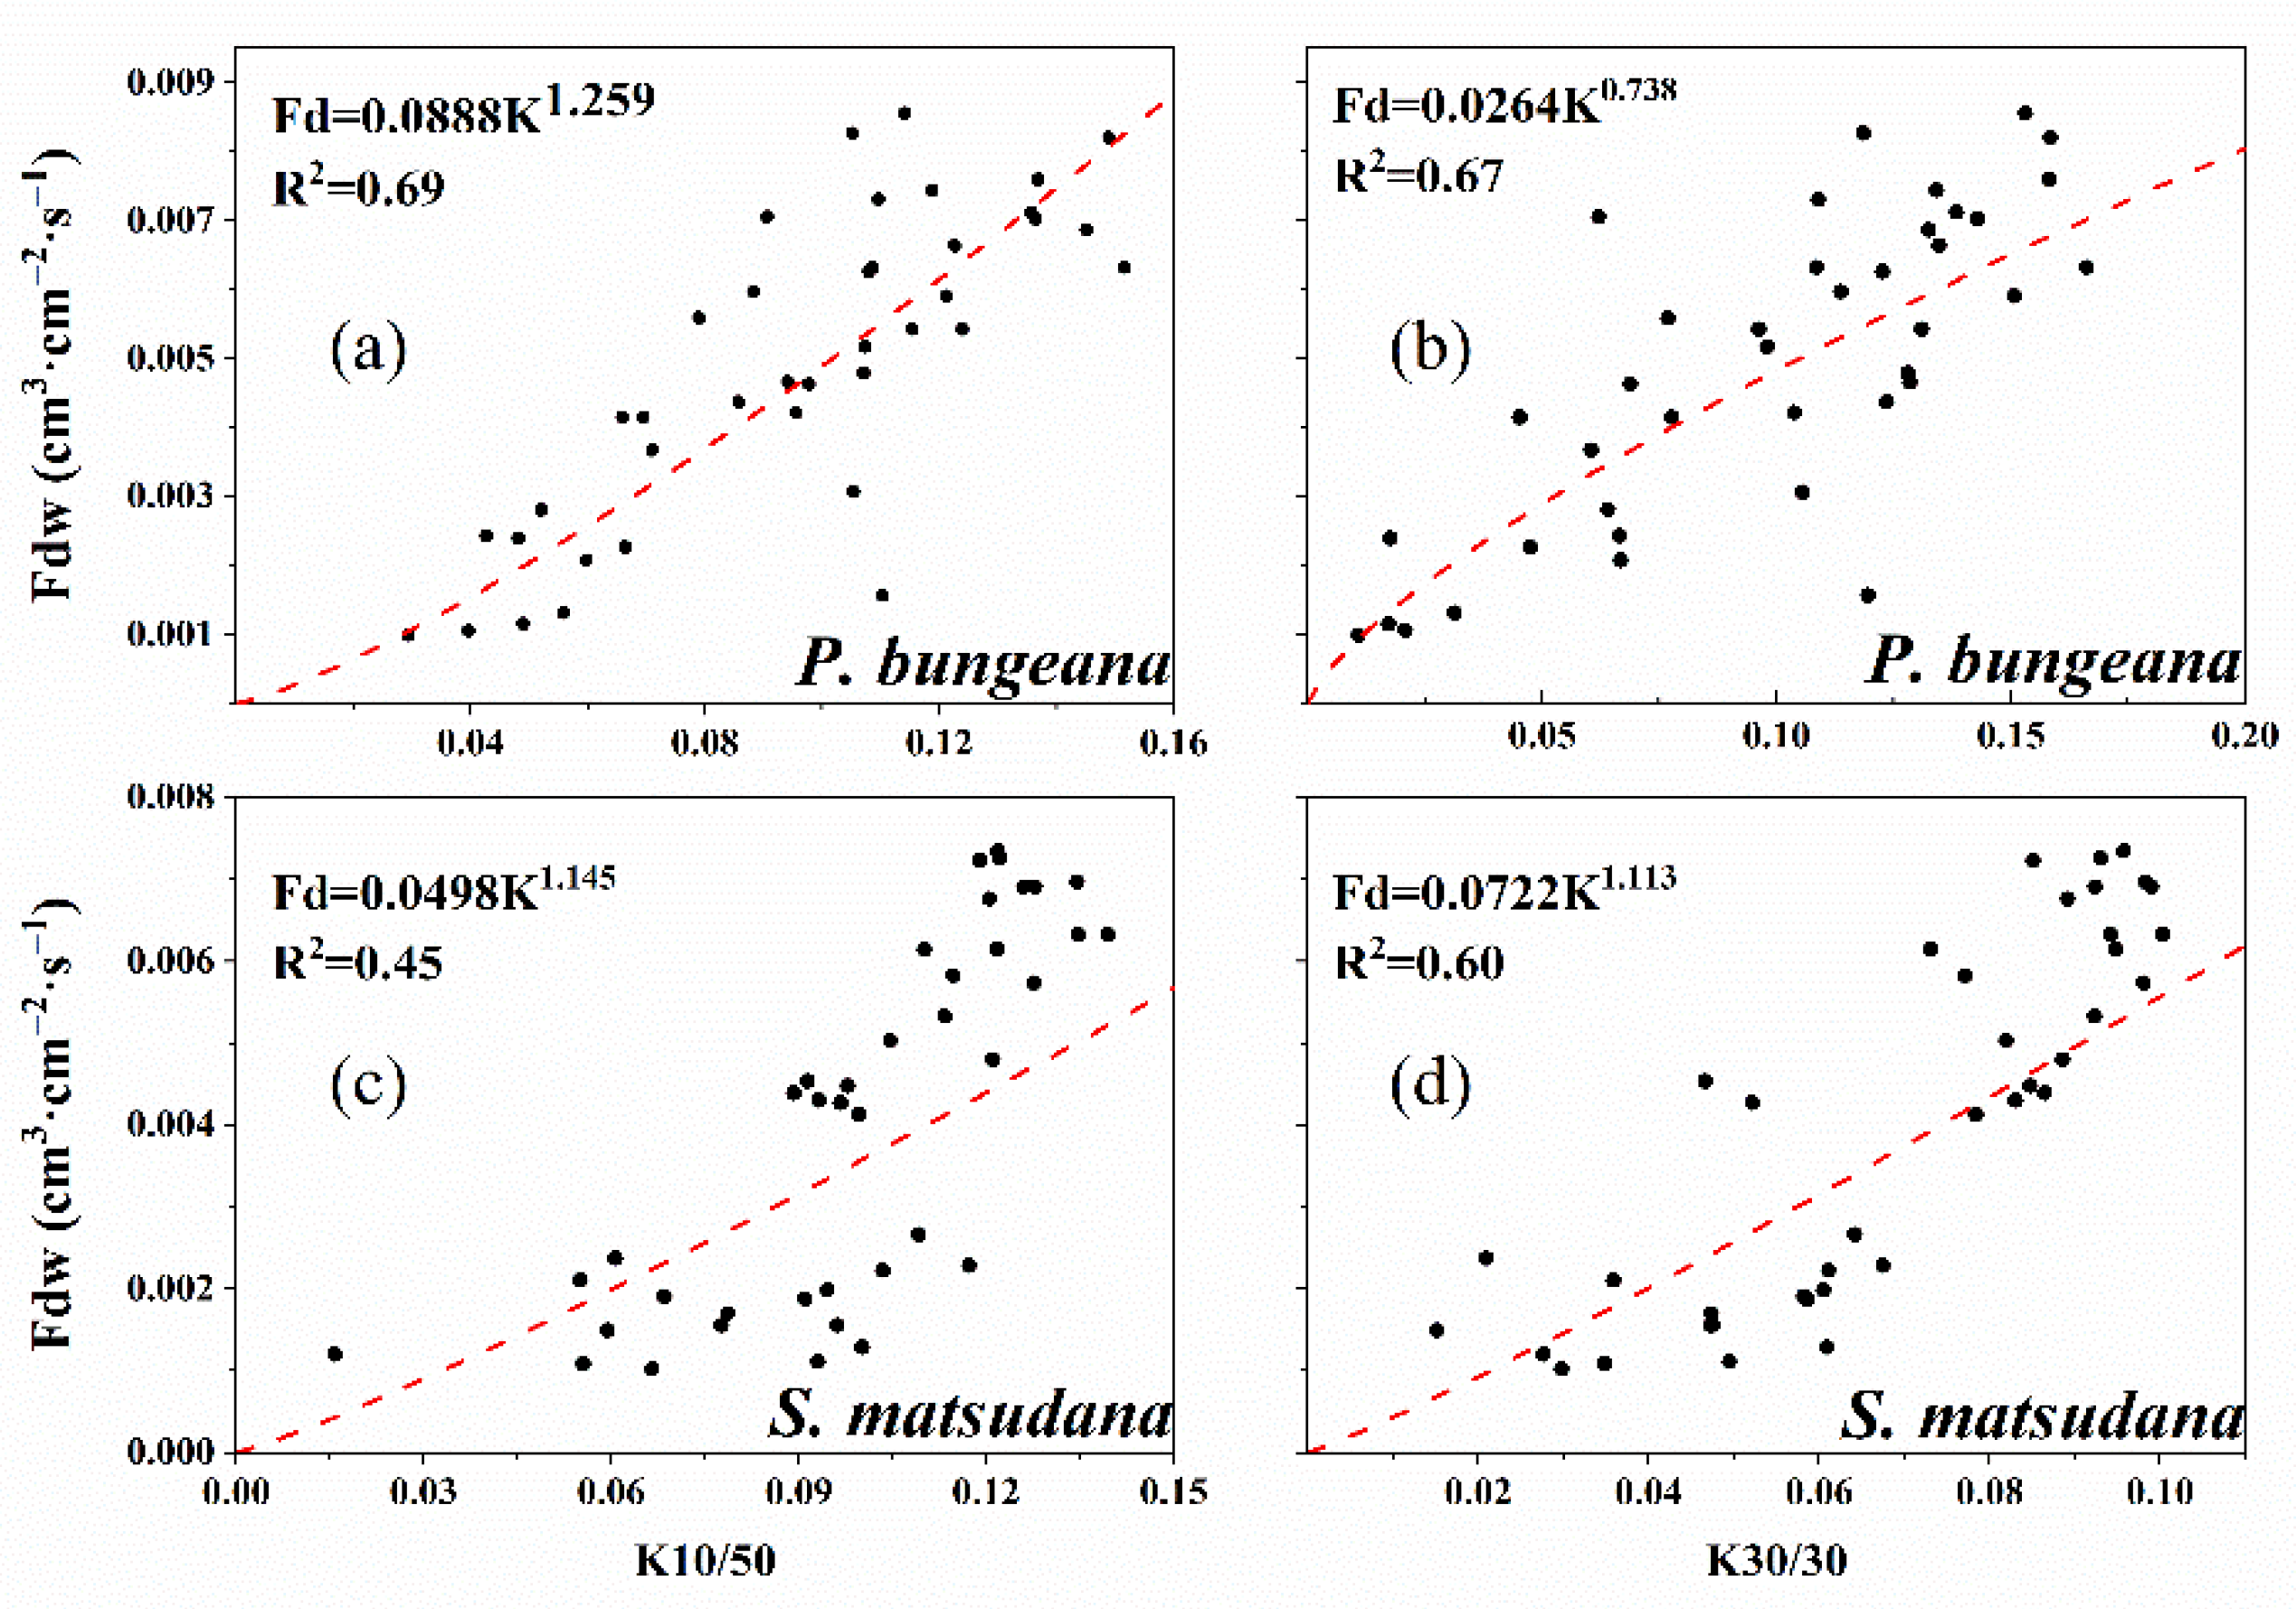
3.2. Calibration Equations

The relationships between K and Fd at the hourly time scale are shown in Figure 4. We chose the nonlinear function (power function) to represent the relationships. The calibration equations for P. bungeana and S. matsudana under the 10/50 mode were, respectively:
Fd = 0.0888 K 1.259 R 2 = 0.69
Fd = 0.0498 K 1.145 R 2 = 0.45
The calibration equations of P. bungeana and S. matsudana under the 30/30 mode were, respectively:
Fd = 0.0264 K 0.738 R 2 = 0.67
Fd = 0.0772 K 1.113 R 2 = 0.60
The calibration equations were different from the original equation, especially for parameter α. The parameter α of Equations (9)–(12) ranged from 0.0264 to 0.0722, and these values were greater than the original α value (0.0119). The β coefficient of Equation (11) was 0.738. β < 1 made the relationship turn into convex curve (Figure 4), with the increase in Fd slowing down as K increased. Among the four equations, the coefficient of determination of Equation (10) was relatively low, indicating a relatively poor relationship between K and Fdw.

3.3. Validation of the Calibration Equations

The accuracy of the new calibration equations must be verified before they can be applied to subsequent research. By comparing Fd calculated by the calibration equation with Fdw, we found that the comparison line fitted to points obtained from Equation (9) deviated far from the 1:1 line, indicating that this calibration equation could not be applied in subsequent studies (Figure 5). In contrast, the other calibration Equations (10)–(12) produced Fd estimates that were closer to the measured Fdw values. The sap flow rates of P. bungeana and S. matsudana were underestimated by 67% and 60%, respectively, by the original equation. The R2 values for the 30/30 equation were better than those for the 10/50 equation in both species.
The statistical indexes representing the accuracy of the equations showed that for P. bungeana and S. matsudana under different equations ranked in the order of 30/30 > 10/50 > original (Granier) (Table 2). Compared with the original equation, MAE, MBE, and RMSE values from the estimation equations for the cyclic heating mode applied to both tree species were closer to 0 than they were for the original equation. The error indexes of 30/30 mode of both species were less than 10/50, indicating high accuracy. The performance statistics in Table 2 show that the estimated values of sap flow density determined by the calibration equations under the 30/30 cyclic heating mode for both P. bungeana and S. matsudana were highly consistent with the observed values, and therefore more suitable for the estimation of sap flow flux density.

4. Discussion

4.1. Accuracy of Sap Flow Density Estimates in the Field

Thermal dissipation probes are widely used in measuring vegetation transpiration in forests [32], deserts [33], cropland [34], and other ecosystems [35]. However, recent research has shown that the original equation of Granier cannot accurately estimate sap flow density due to differences in sensors, wood properties, and environmental conditions [3]. In a similar calibration experiment, it was found that the sap flow rate estimated by a self-made probe using the original equation underestimated transpiration rate obtained from a weighing lysimeter by 40% [27]. When probes and sap flow meters were used to verify the accuracy of the original equation for the stems of six species with three wood characteristics, it was found that the estimated rates were underestimated or overestimated to varying degrees compared with the actual rate [36]. In this study, we found that the original equation underestimated sap flow density of P. bungeana and S. matsudana by 67% and 60%, respectively, compared to the reference flow rates, with large errors. Therefore, the original equation can be applied for measurements and research only after calibration. Moreover, the cyclic heating mode cannot maintain the thermal stability state, and the equation should be calibrated before application.
The current study was carried out under simulated natural conditions, and there were natural temperature differences that could not be ignored during the measurement times. Estimation accuracy can be improved by the calibration equations for cyclic heating. For the 30/30 heating mode, the equations for P. bungeana and S. matsudana overestimated sap flow density by 9% and 0.8% respectively, indicating greatly improved estimation accuracy. We chose an unstable method, so our equation cannot be compared with other traditional calibration equations. Calibration method determines the result. Previous studies applied pressure to in vitro stems to simulate sap flow, and the range of upper and lower sap flow rates was wide [37]. In contrast, our study was carried out in the field with living trees as the research objects. Similar to other field studies [28,30,38], transpiration in the actual growing environment can be simulated to the maximum extent. However, due to the complex field conditions, even when soil moisture was sufficient, sap flow was affected by vapor pressure deficit, leading in some cases to a small transpiration demand that could not reach the limit of instrumental pressurization, and the upper and lower limits of sap flow rate were different from those experienced in laboratory research. TDP was more effective under hydroponic conditions, and plant stems were more likely to reach a stable state under high sap flow conditions, i.e., water movement rate will affect the calibration results [39]. Therefore, in addition to the effect of different tree species on sap flow rate, the lack of high flow data may also be the main reason for the difference in optimal cycle time. Similarly, the calibration equations obtained in this study may be more suitable for sap flow estimation of P. bungeana and S. matsudana in climate zones similar to the experimental site. However, with additional progress in measurement technology, field experiments may better match large-scale ecosystem studies and may become the preferred method for conducting calibration experiments.

4.2. Benefits and Limitations of the Cyclic Heating Mode

Because the thermal diffusivity of heat in the sapwood is not uniform, there is a general difference in temperature between different locations on the plant stem. The temperature difference between the heating needle and the control needle of the TDP includes both sap flow information and natural temperature difference [40]. Therefore, when the natural temperature difference is too large (>0.2 °C), the TDP cannot obtain an estimated value that is consistent with the actual value [17,22]. For the cyclic heating mode TDP, the temperature difference at the end of the cooling stage represents the natural temperature difference, and the natural temperature difference can be separated from the probe temperature difference by a simple calculation to reduce the influence of the natural temperature difference. In Figure 2, both the traditional temperature difference and its amplitude are larger than the cyclic temperature difference. This difference can be explained by Fourier’s law. Firstly, the temperature difference is reduced by the heat transfer from the unstable heat source to the surrounding area; secondly, the higher the temperature, the faster the heat transfer and the higher the temperature conductivity. Spatial variation of the three groups of probes may also lead to differences in their measured values, but we tried to avoid this in the design of the experiment. The similar diurnal variation and significant correlation of temperature differences between the different models suggest that the cyclic mode has the potential to replace the traditional mode. According to Figure S1, the observed value after cooling for 30 min has the same diurnal variation and significant correlation with the actual value. The observed value overestimates the actual value by less than 10%, which can be used as a substitute for the natural temperature difference. We judge the feasibility of heating time by the relation with the temperature difference value of the traditional mode. When corrected for the natural temperature gradient, the error can be substantially reduced, especially in dry and sparse environments [41]. The calibration equation for the cyclic heating mode was also reported to improve the estimation accuracy of Abies alba Mill., a conifer species with low sap flow [42]. The single needle intermittent heating can also avoid the natural temperature difference, and the relevant research results showed that it can significantly improve the estimation accuracy [43]. The results of subsequent studies on single-needle cyclic heating probes also confirmed this point of view [44,45].
Cyclic heating mode can also reduce heat damage to stems. Probe insertion causes wound effects to the plant that produce hormones and biochemical reactions, change the anatomical structure of the plant stem, and reduce thermal conductivity around the wound. The wound effect is a biochemical process that can be exacerbated by prolonged heating of the probe. This results in decreased probe sensitivity, as shown by a gradual decrease in the sap flow rate [46,47]. In long-term positioning observations of sap flow, researchers found that the sap flow rate in the second year of probe insertion was 30%–45% lower than in the first year [48]. Relevant studies found that the thermal damage caused by heating the probe was further aggravated with the extension of measurement time [49]. Shortening the heating time is undoubtedly the approach needed to slow down heat damage to the tree trunk and to prolong the service life of the probe. Using the cyclic heating mode can reduce thermal damage to the stem, making it suitable for long-term field observations.
The cyclic heating mode has two major disadvantages: one is the heating/cooling time choice, and the other is that some of the time resolution is sacrificed. Stable temperature differences between the probe needles ensure the quality of the sap flow rate calculation, so the selection of heating and cooling time for cyclic modes is very important. If the cycle period is too long, it will be affected by changes in the external environment, and there are limitations associated with low data resolution and small data volume. If the cycle period is too short, the thermal properties of wood are unstable, and the estimation accuracy cannot be guaranteed. It is necessary to replace the natural temperature difference with the temperature difference under cooling. It is not only necessary to consider the heating time, but also to confirm the cooling time to ensure that the measured value only includes the natural temperature difference. If a TDP needs to be associated with other instrument data, such as from calibration experiments, reasonable selection should be made according to the instrument time resolution of the measured data and under conditions that ensure accuracy. Researchers should consider limitations associated with the environment and methods used to carry out specific calibration work [4]. It is recommended to select 15 min heating and 15 min cooling as the cycle period for calibration experiments on artificial stems [22]. The research showed that the cycle timing not only met the precision requirements, but also had the advantage of saving electricity. Their results were then confirmed by a calibration study on in vitro stems, and the heating time was further shortened to 10 min [24]. In simulating the sap flow rate of olive trees (diffuse-porous wood), 10/20 heating mode single needle probe can be selected for observation, which can track the change in transpiration well [21]. Our results showed that the calibration equation for the 10/50 heating mode could not satisfy the accuracy requirements, and the 30/30 heating mode was selected as the best mode, although this result was different from previous studies. This difference may be caused by different calibration methods and tree species. The diameters of the vessels/tracheid were significantly correlated with water conductivity, and water conductivity would increase with increasing diameter, which is the main reason for the species specificity of sap flow [29,50].
In the TDP calibration experiment of a single probe, it was easier for the probe to reach stability when the flow rate was faster. In this study, the time to reach stability under the condition of high flow was shorter than the time to reach stability under low flow [21]. We found that the temperature difference between the probes of S. matsudana was more stable than the temperature difference between the probes of P. bungeana under the cyclic heating mode, and this finding may be a result of the larger water conductivity of the diffuse-porous species than that of the conifer species. Therefore, species will inevitably affect the optimal heating/cooling time and should be selected and tested prior to application. Both the accuracy of measurement and the time resolution should be considered.

4.3. The Uncertainty of Outcome

Our results are based on a probe and scaled up to whole tree transpiration using a correction equation. However, this method can produce uncertainty and errors which are unavoidable. Previous studies have shown that the sap flow is not evenly distributed in the sapwood of the stem, especially in the ring-porous species, due to differences in the diameter and density distribution of the vessel [36]. This spatial variation is mainly manifested in the radial and axial directions in practical applications [29]. The researchers claimed that adding multiple sets of probes of different lengths, or selecting probes with an appropriate length, were ways to avoid radial variation and improve accuracy [51]. The axial variation is due to the sap flow heterogeneity caused by the adaptation of wild growth to the environment in different directions, especially radiation and moisture. Many researchers choose to use young trees as experimental materials, or to add probes in different directions. Therefore, in order to reduce this uncertainty, P. bungeana and S. matsudana trees with more uniform distribution of conduits and sapwood width close to probe length were selected for the experiment. In order to compare the estimation capabilities of different modes of probes, the probes were positioned in the same direction of the stem and were staggered under the first branch height to avoid axial-heterogeneity and heat source crossing. For the temperature difference in Figure 2, axial variation is the cause of the difference, but this effect is small compared with that of heat conduction.
Transpiration is an important component in the water cycle. TDP is the most widely used method for estimating single tree transpiration. However, there are still some uncertainties to be resolved. In the future, when using TDP to calculate transpiration of whole trees, it is better to make the following points: (1) pay attention to the radial and axial variation of sap flow and accurately push the point data of TDP upward to surface, (2) determine and remove the influence of natural temperature difference, and (3) establish or use species-specific equations.

5. Conclusions

This study found the original sap flow equation greatly underestimated transpiration rate in two tree species. Cyclic heating mode is an effective way to consider the effect of natural temperature differences on sap flow estimation. The fitting and verification of the calibration equations showed that accurate observations of sap flow rate for the two species were obtained with the 30/30 cyclic heating mode. Compared with the original equation, the calibration equations Fd = 0.0264K0.738 (R2 = 0.67) and Fd = 0.0722K1.113 (R2 = 0.60) better simulated the sap flow rate of P. bungeana and S. matsudana, thereby dramatically improving estimation accuracy. It should be noted that the calibration equations obtained by using whole-tree weighing in the calibration experiment are more suitable for the climatic conditions of the calibration experiment site. In other cases where there is a lack of high/low sap flow data, estimation accuracy will be affected.

Supplementary Materials

Supplementary material associated with this article can be found in the online version at https://www.mdpi.com/article/10.3390/f13111964/s1. Figure S1: The diurnal dynamic of TA (actual temperature difference of reference probes) and T0(temperature difference at the end of cooling stage of the test probes) of Pinus burgeana(a) and Salix matsudana(b). Dots and shade represent mean values and standard deviations calculated from five days, respectively. The relationship between TA with T0 in Pinus burgeana(c) and Salix matsudana(d).

Author Contributions

Conceptualization, J.Z. and C.M.; methodology, C.M. and J.Z.; formal analysis and investigation, M.H. and Y.M.; writing—original draft preparation, M.H.; writing—review and editing, J.Z., C.M. and W.X.; funding acquisition, J.Z.; resources, C.L. and C.M.; supervision, C.M. and J.Z. All authors have read and agreed to the published version of the manuscript.

Funding

This research was supported by the National Key Research and Development Project (grant no. 2020YFA0608101, 2016YFC0500101).

Data Availability Statement

The datasets generated during and/or analyzed during the current study are available from the corresponding author on reasonable request.

Acknowledgments

The authors thank the staff of College of Forestry, Hebei Agricultural University, for their support and help in the field experiment.

Conflicts of Interest

The authors declare no conflict of interest.

References

  1. Green, S.; Clothier, B.; Jardine, B. Theory and practical application of heat pulse to measure sap flow. Agron. J. 2003, 95, 1371–1379. [Google Scholar] [CrossRef]
  2. Peramaki, M.; Vesala, T.; Nikinmaa, E. Analysing the applicability of the heat balance method for estimating sap flow in boreal forest conditions. Boreal Environ. Res. 2001, 6, 29–43. [Google Scholar]
  3. Granier, A. Une nouvelle méthode pour la mesure du flux de sève brute dans le tronc des arbres. Ann. Sci. For. 1985, 42, 193–200. [Google Scholar] [CrossRef]
  4. Flo, V.; Martinez-Vilalta, J.; Steppe, K.; Schuldt, B.; Poyatos, R. A synthesis of bias and uncertainty in sap flow methods. Agric. For. Meteorol. 2019, 271, 362–374. [Google Scholar] [CrossRef]
  5. Chen, Y.J.; Bongers, F.; Tomlinson, K.; Fan, Z.X.; Lin, H.; Zhang, S.B.; Zheng, Y.L.; Li, Y.P.; Cao, K.F.; Zhang, J.L. Time lags between crown and basal sap flows in tropical lianas and co-occurring trees. Tree Physiol. 2016, 36, 736–747. [Google Scholar] [CrossRef] [Green Version]
  6. Yang, S.J.; Zhang, Y.J.; Goldstein, G.; Sun, M.; Ma, R.Y.; Cao, K.F. Determinants of water circulation in a woody bamboo species: Afternoon use and night-time recharge of culm water storage. Tree Physiol. 2015, 35, 964–974. [Google Scholar] [CrossRef] [Green Version]
  7. Kobayashi, N.; Kumagai, T.; Miyazawa, Y.; Matsumoto, K.; Tateishi, M.; Lim, T.K.; Mudd, R.G.; Ziegler, A.D.; Giambelluca, T.W.; Yin, S. Transpiration characteristics of a rubber plantation in central Cambodia. Tree Physiol. 2014, 34, 285–301. [Google Scholar] [CrossRef] [Green Version]
  8. Rabbel, I.; Bogena, H.; Neuwirth, B.; Diekkruger, B. Using Sap Flow Data to Parameterize the Feddes Water Stress Model for Norway Spruce. Water 2018, 10, 279. [Google Scholar] [CrossRef] [Green Version]
  9. Bucci, S.J.; Scholz, F.G.; Goldstein, G.; Hoffmann, W.A.; Meinzer, F.C.; Franco, A.C.; Giambelluca, T.; Miralles-Wilhelm, F. Controls on stand transpiration and soil water utilization along a tree density gradient in a Neotropical savanna. Agric. For. Meteorol. 2008, 148, 839–849. [Google Scholar] [CrossRef]
  10. Jung, E.Y.; Otieno, D.; Lee, B.; Lim, J.H.; Kang, S.K.; Schmidt, M.W.T.; Tenhunen, J. Up-scaling to stand transpiration of an Asian temperate mixed-deciduous forest from single tree sapflow measurements. Plant Ecol. 2011, 212, 383–395. [Google Scholar] [CrossRef]
  11. Lu, P.; Urban, L.; Zhao, P. Granier’s thermal dissipation probe (TDP) method for measuring sap flow in trees: Theory and practice. Acta Bot. Sin. 2004, 46, 631–646. [Google Scholar]
  12. Goulden, M.L.; Field, C.B. 3 Methods for Monitoring the Gas-Exchange of Individual Tree Canopies—Ventilated-Chamber, Sap-Flow and Penman-Monteith Measurements on Evergreen Oaks. Funct. Ecol. 1994, 8, 125–135. [Google Scholar] [CrossRef]
  13. Taneda, H.; Sperry, J.S. A case-study of water transport in co-occurring ring- versus diffuse-porous trees: Contrasts in water-status, conducting capacity, cavitation and vessel refilling. Tree Physiol. 2008, 28, 1641–1651. [Google Scholar] [CrossRef] [Green Version]
  14. Bush, S.E.; Hultine, K.R.; Sperry, J.S.; Ehleringer, J.R. Calibration of thermal dissipation sap flow probes for ring- and diffuse-porous trees. Tree Physiol. 2010, 30, 1545–1554. [Google Scholar] [CrossRef] [Green Version]
  15. Berdanier, A.B.; Miniat, C.F.; Clark, J.S. Predictive models for radial sap flux variation in coniferous, diffuse-porous and ring-porous temperate trees. Tree Physiol. 2016, 36, 932–941. [Google Scholar] [CrossRef] [Green Version]
  16. Baiamonte, G.; Motisi, A. Analytical approach extending the Granier method to radial sap flow patterns. Agric. Water Manag. 2020, 231, 105988. [Google Scholar] [CrossRef]
  17. Xie, J.; Wan, X.C. The accuracy of the thermal dissipation technique for estimating sap flow is affected by the radial distribution of conduit diameter and density. Acta Physiol. Plant. 2018, 40, 88. [Google Scholar] [CrossRef]
  18. Alizadeh, A.; Toudeshki, A.; Ehsani, R.; Migliaccio, K. Potential Sources of Errors in Estimating Plant Sap Flow Using Commercial Thermal Dissipation Probes. Appl. Eng. Agric. 2018, 34, 899–906. [Google Scholar] [CrossRef]
  19. Smith, D.M.; Allen, S.J. Measurement of sap flow in plant stems. J. Exp. Bot. 1996, 47, 1833–1844. [Google Scholar] [CrossRef] [Green Version]
  20. Cermak, J.; Kucera, J. The Compensation of Natural Temperature-Gradient at the Measuring Point during the Sap Flow-Rate Determination in Trees. Biol. Plant. 1981, 23, 469–471. [Google Scholar] [CrossRef]
  21. Masmoudi, M.M.; Mahjoub, I.; Lhomme, J.P.; Ben Mechlia, N. Sap flow measurement by a single thermal dissipation probe in transient regime: Implementation of the method and test under field conditions. Ann. For. Sci. 2012, 69, 773–781. [Google Scholar] [CrossRef]
  22. Do, F.; Rocheteau, A. Influence of natural temperature gradients on measurements of xylem sap flow with thermal dissipation probes. 1. Field observations and possible remedies. Tree Physiol. 2002, 22, 641–648. [Google Scholar] [CrossRef]
  23. Do, F.; Rocheteau, A. Influence of natural temperature gradients on measurements of xylem sap flow with thermal dissipation probes. 2. Advantages and calibration of a noncontinuous heating system. Tree Physiol. 2002, 22, 649–654. [Google Scholar] [CrossRef] [Green Version]
  24. Ayutthaya, S.I.N.; Do, F.C.; Pannengpetch, K.; Junjittakarn, J.; Maeght, J.L.; Rocheteau, A.; Cochard, H. Transient thermal dissipation method of xylem sap flow measurement: Multi-species calibration and field evaluation. Tree Physiol. 2010, 30, 139–148. [Google Scholar] [CrossRef]
  25. Lopez, J.G.; Licata, J.; Pypker, T.; Asbjornsen, H. Effects of heater wattage on sap flux density estimates using an improved tree-cut experiment. Tree Physiol. 2019, 39, 679–693. [Google Scholar] [CrossRef]
  26. Pasqualotto, G.; Carraro, V.; Menardi, R.; Anfodillo, T. Calibration of Granier-Type (TDP) Sap Flow Probes by a High Precision Electronic Potometer. Sensors 2019, 19, 2419. [Google Scholar] [CrossRef] [Green Version]
  27. Sperling, O.; Shapira, O.; Cohen, S.; Tripler, E.; Schwartz, A.; Lazarovitch, N. Estimating sap flux densities in date palm trees using the heat dissipation method and weighing lysimeters. Tree Physiol. 2012, 32, 1171–1178. [Google Scholar] [CrossRef] [Green Version]
  28. Tfwala, C.M.; van Rensburg, L.D.; Bello, Z.A.; Green, S.R. Calibration of compensation heat pulse velocity technique for measuring transpiration of selected indigenous trees using weighing lysimeters. Agric. Water Manag. 2018, 200, 27–33. [Google Scholar] [CrossRef]
  29. Tyree, M.T.; Zimmermann, M.H. Xylem Structure and the Ascent of Sap, 2nd ed.; Springer Science & Business Media: Berlin/Heidelberg, Germany, 2013. [Google Scholar]
  30. McCulloh, K.A.; Winter, K.; Meinzer, F.C.; Garcia, M.; Aranda, J.; Lachenbruch, B. A, comparison of daily water use estimates derived from constant-heat sap-flow probe values and gravimetric measurements in pot-grown saplings. Tree Physiol. 2007, 27, 1355–1360. [Google Scholar] [CrossRef] [PubMed] [Green Version]
  31. Willmott, C.J. On the validation of models. Phys. Geogr. 1981, 2, 184–194. [Google Scholar] [CrossRef]
  32. Wang, Q.; Lintunen, A.; Zhao, P.; Shen, W.J.; Salmon, Y.; Chen, X.; Ouyang, L.; Zhu, L.W.; Ni, G.Y.; Sun, D.; et al. Assessing Environmental Control of Sap Flux of Three Tree Species Plantations in Degraded Hilly Lands in South China. Forests 2020, 11, 206. [Google Scholar] [CrossRef] [Green Version]
  33. Hayat, M.; Zha, T.S.; Jia, X.; Iqbal, S.; Qian, D.; Bourque, C.P.A.; Khan, A.; Tian, Y.; Bai, Y.J.; Liu, P.; et al. A multiple-temporal scale analysis of biophysical control of sap flow in Salix psammophila growing in a semiarid shrubland ecosystem of northwest China. Agric. For. Meteorol. 2020, 288, 107985. [Google Scholar] [CrossRef]
  34. Venturin, A.Z.; Guimaraes, C.M.; de Sousa, E.F.; Machado, J.A.; Rodrigues, W.P.; Serrazine, I.D.; Bressan-Smith, R.; Marciano, C.R.; Campostrini, E. Using a crop water stress index based on a sap flow method to estimate water status in conilon coffee plants. Agric. Water Manag. 2020, 241, 106343. [Google Scholar] [CrossRef]
  35. O’Keefe, K.; Bell, D.M.; McCulloh, K.A.; Nippert, J.B. Bridging the Flux Gap: Sap Flow Measurements Reveal Species-Specific Patterns of Water Use in a Tallgrass Prairie. J. Geophys. Res. Biogeosci. 2020, 125, e2019JG005446. [Google Scholar] [CrossRef]
  36. Sun, H.Z.; Aubrey, D.P.; Teskey, R.O. A simple calibration improved the accuracy of the thermal dissipation technique for sap flow measurements in juvenile trees of six species. Trees 2012, 26, 631–640. [Google Scholar] [CrossRef]
  37. Reyes-Acosta, J.L.; Vandegehuchte, M.W.; Steppe, K.; Lubczynski, M.W. Novel, cyclic heat dissipation method for the correction of natural temperature gradients in sap flow measurements. Part 2. Laboratory validation. Tree Physiol. 2012, 32, 913–929. [Google Scholar] [CrossRef] [Green Version]
  38. Lubczynski, M.W.; Chavarro-Rincon, D.; Roy, J. Novel, cyclic heat dissipation method for the correction of natural temperature gradients in sap flow measurements. Part 1. Theory and application. Tree Physiol. 2012, 32, 894–912. [Google Scholar] [CrossRef] [PubMed] [Green Version]
  39. Nourtier, M.; Chanzy, A.; Granier, A.; Huc, R. Sap flow measurements by thermal dissipation method using cyclic heating: A processing method accounting for the non-stationary regime. Ann. For. Sci. 2011, 68, 1255–1264. [Google Scholar] [CrossRef] [Green Version]
  40. Do, F.C.; Ayutthaya, S.I.N.; Rocheteau, A. Transient thermal dissipation method for xylem sap flow measurement: Implementation with a single probe. Tree Physiol. 2011, 31, 369–380. [Google Scholar] [CrossRef] [Green Version]
  41. Nhean, S.; Ayutthaya, S.I.N.; Rocheteau, A.; Do, F.C. Multi-species test and calibration of an improved transient thermal dissipation system of sap flow measurement with a single probe. Tree Physiol. 2019, 39, 1061–1070. [Google Scholar] [CrossRef]
  42. Ren, R.Q.; von der Crone, J.; Horton, R.; Liu, G.; Steppe, K. An improved single probe method for sap flow measurements using finite heating duration. Agric. For. Meteorol. 2020, 280, 107788. [Google Scholar] [CrossRef]
  43. Steppe, K.; De Pauw, D.J.W.; Doody, T.M.; Teskey, R.O. A comparison of sap flux density using thermal dissipation, heat pulse velocity and heat field deformation methods. Agric. For. Meteorol. 2010, 150, 1046–1056. [Google Scholar] [CrossRef]
  44. Rana, G.; De Lorenzi, F.; Palatella, L.; Martinelli, N.; Ferrara, R.M. Field scale recalibration of the sap flow thermal dissipation method in a Mediterranean vineyard. Agric. For. Meteorol. 2019, 269, 169–179. [Google Scholar] [CrossRef]
  45. James, S.A.; Clearwater, M.J.; Meinzer, F.C.; Goldstein, G. Heat dissipation sensors of variable length for the measurement of sap flow in trees with deep sapwood. Tree Physiol. 2002, 22, 277–283. [Google Scholar] [CrossRef] [Green Version]
  46. Dichio, B.; Montanaro, G.; Sofo, A.; Xiloyannis, C. Stem and whole-plant hydraulics in olive (Olea europaea) and kiwifruit (Actinidia deliciosa). Trees 2013, 27, 183–191. [Google Scholar] [CrossRef]
  47. Maranon-Jimenez, S.; Van den Bulcke, J.; Piayda, A.; Van Acker, J.; Cuntz, M.; Rebmann, C.; Steppe, K. X-ray computed microtomography characterizes the wound effect that causes sap flow underestimation by thermal dissipation sensors. Tree Physiol. 2018, 38, 287–301. [Google Scholar] [CrossRef] [Green Version]
  48. Wullschleger, S.D.; Childs, K.W.; King, A.W.; Hanson, P.J. A model of heat transfer in sapwood and implications for sap flux density measurements using thermal dissipation probes. Tree Physiol. 2011, 31, 669–679. [Google Scholar] [CrossRef] [Green Version]
  49. Moore, G.W.; Bond, B.J.; Jones, J.A.; Meinzer, F.C. Thermal-dissipation sap flow sensors may not yield consistent sap-flux estimates over multiple years. Trees 2010, 24, 165–174. [Google Scholar] [CrossRef]
  50. Wiedemann, A.; Maranon-Jimenez, S.; Rebmann, C.; Herbst, M.; Cuntz, M. An empirical study of the wound effect on sap flux density measured with thermal dissipation probes. Tree Physiol. 2016, 36, 1471–1484. [Google Scholar] [CrossRef] [Green Version]
  51. Clearwater, M.J.; Meinzer, F.C.; Andrade, J.L.; Goldstein, G.; Holbrook, N.M. Potential errors in measurement of nonuniform sap flow using heat dissipation probes. Tree Physiol. 1999, 19, 681–687. [Google Scholar] [CrossRef]
Figure 1. Schematic diagram of experimental set-up: (1) thermal dissipation probe, (2) portable forklift, (3) plastic film, (4) wide-range balance, (5) display screen.
Forests 13 01964 g001
Figure 2. Diurnal variation of temperature difference under continuous heating (TC, black), 10 min heating and 50 min cooling (T10/50, red), and 30 min heating and 30 min cooling (T30/30, blue). Dots and shade represent mean values and standard deviations, respectively, calculated from three trees.
Forests 13 01964 g002
Figure 3. Temperature difference changes within hours of low (left side of dotted line) and high (right side of dotted line) sap flow rates under continuous heating (ΔT, black), 10 min heating and 50 min cooling (ΔT10/50, red), and 30 min heating and 30 min cooling (ΔT30/30, blue).
Forests 13 01964 g003
Figure 4. Relationship between K10/50(K for 10 min heating and 50 min cooling mode, (a) and (c)) and K30/30(K for 30 min heating and 30 min cooling mode, (b) and (d)) with reference sap flow density (Fdw, measured by tree weighing).
Forests 13 01964 g004
Figure 5. Verification of the accuracy of the calibration equations. The dashed black line represents the 10 min heating and 50 min cooling mode, the dashed red line represents the 30 min heating and 30 min cooling mode, and the solid black line is the 1:1 line.
Forests 13 01964 g005
Table 1. Experimental tree details. Note: n is the number of samples.
SpeciesHeight
(m)
Trunk Diameter
(cm)
Sapwood Area
(cm2)
Sapwood Width
(mm)
n
P. bungeana4.4 ± 0.2211.5 ± 0.2858.00 ± 2.5419.3 ± 0.043
S. matsudana5.4 ± 0.1210.7 ± 0.3163.27 ± 1.9824.5 ± 0.063
Table 2. Performance statistics for each sap flow density equation (equation number given in parentheses). MAE = mean absolute error; MBE = mean bias error; RMSE = root mean square error; D = Willmott’s index of agreement; k= the slope of the estimated value changing with the measured value; ER = error rate (%); R2 = coefficient of determination; n = number of observations.
SpeciesEquationMAEMBERMSEDkERR2n
P. bungeanaOriginal0.0017−0.00170.00200.560.33670.8525
10/50 (9)0.0012−0.00110.00150.710.58420.7825
30/30 (11)0.00080.00030.00110.861.0990.9025
S. matsudanaOriginal0.0017−0.00170.00210.560.40600.9025
10/50 (10) 0.00080.00060.00090.901.14140.9625
30/30 (12)0.0004<0.000010.00050.971.0080.80.9825
Publisher’s Note: MDPI stays neutral with regard to jurisdictional claims in published maps and institutional affiliations.

