
A UAV-Based Forest Fire Patrol Path Planning Strategy

Abstract
:1. Introduction
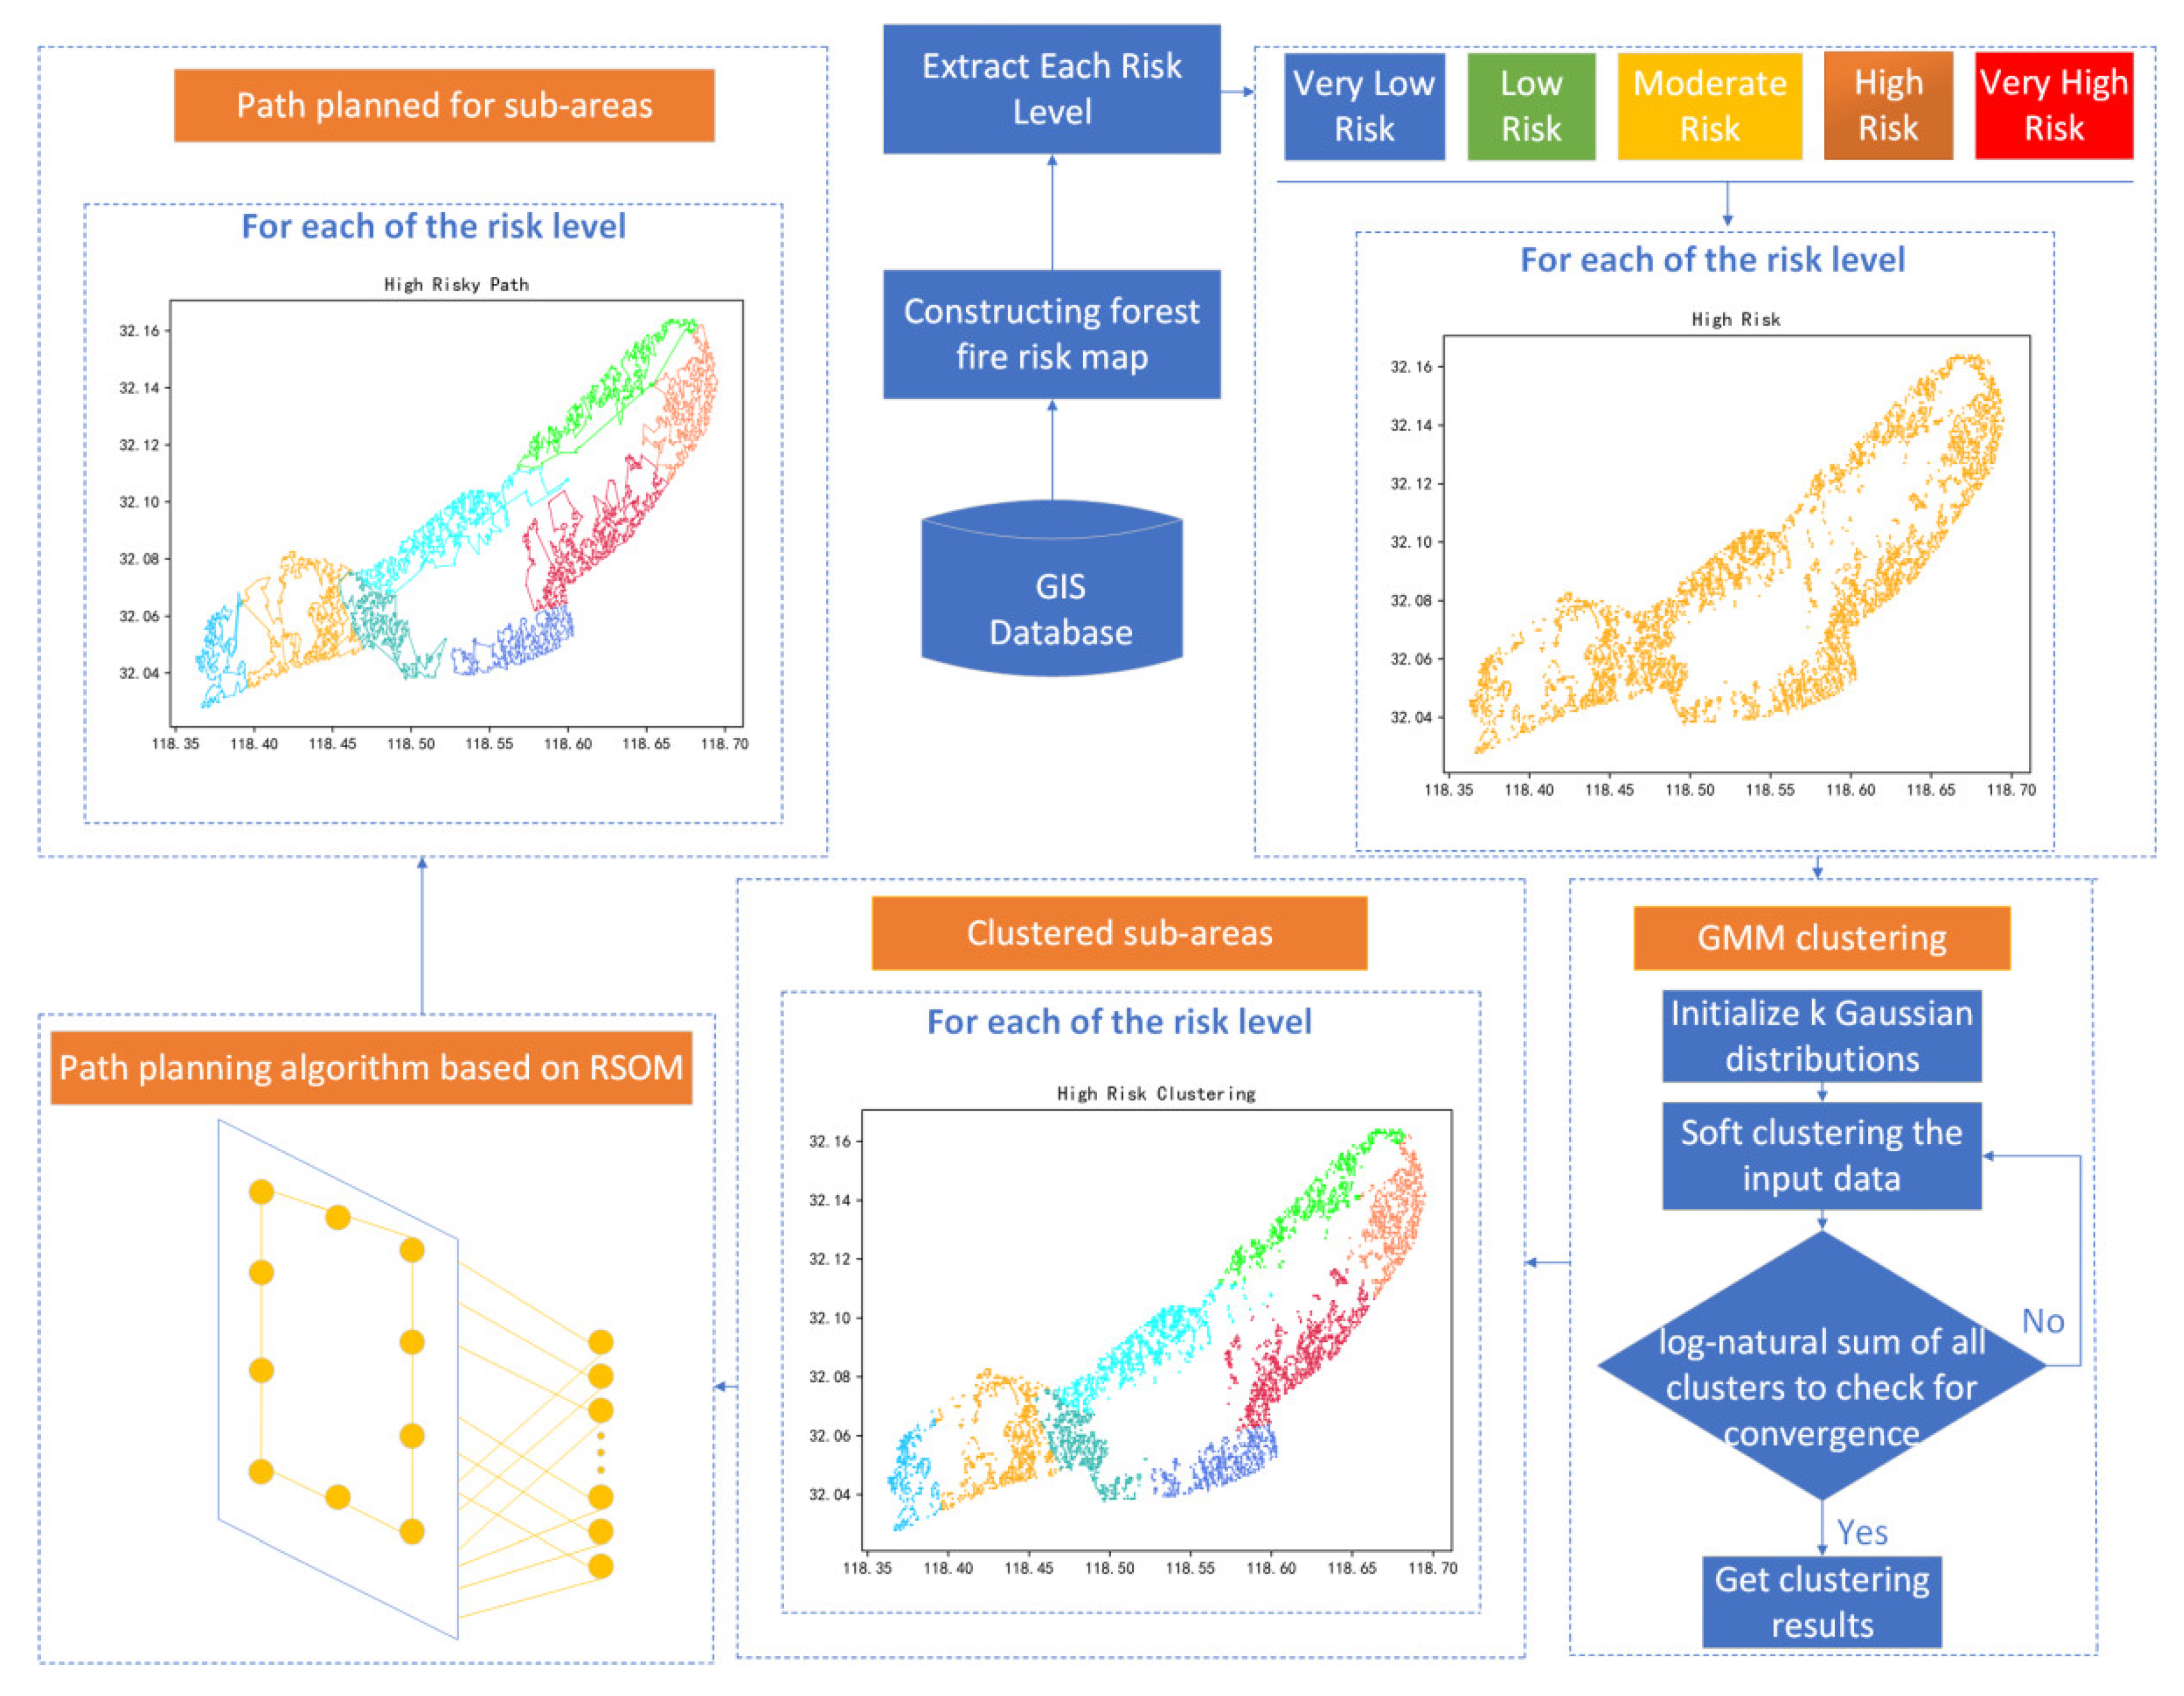
2. Methods
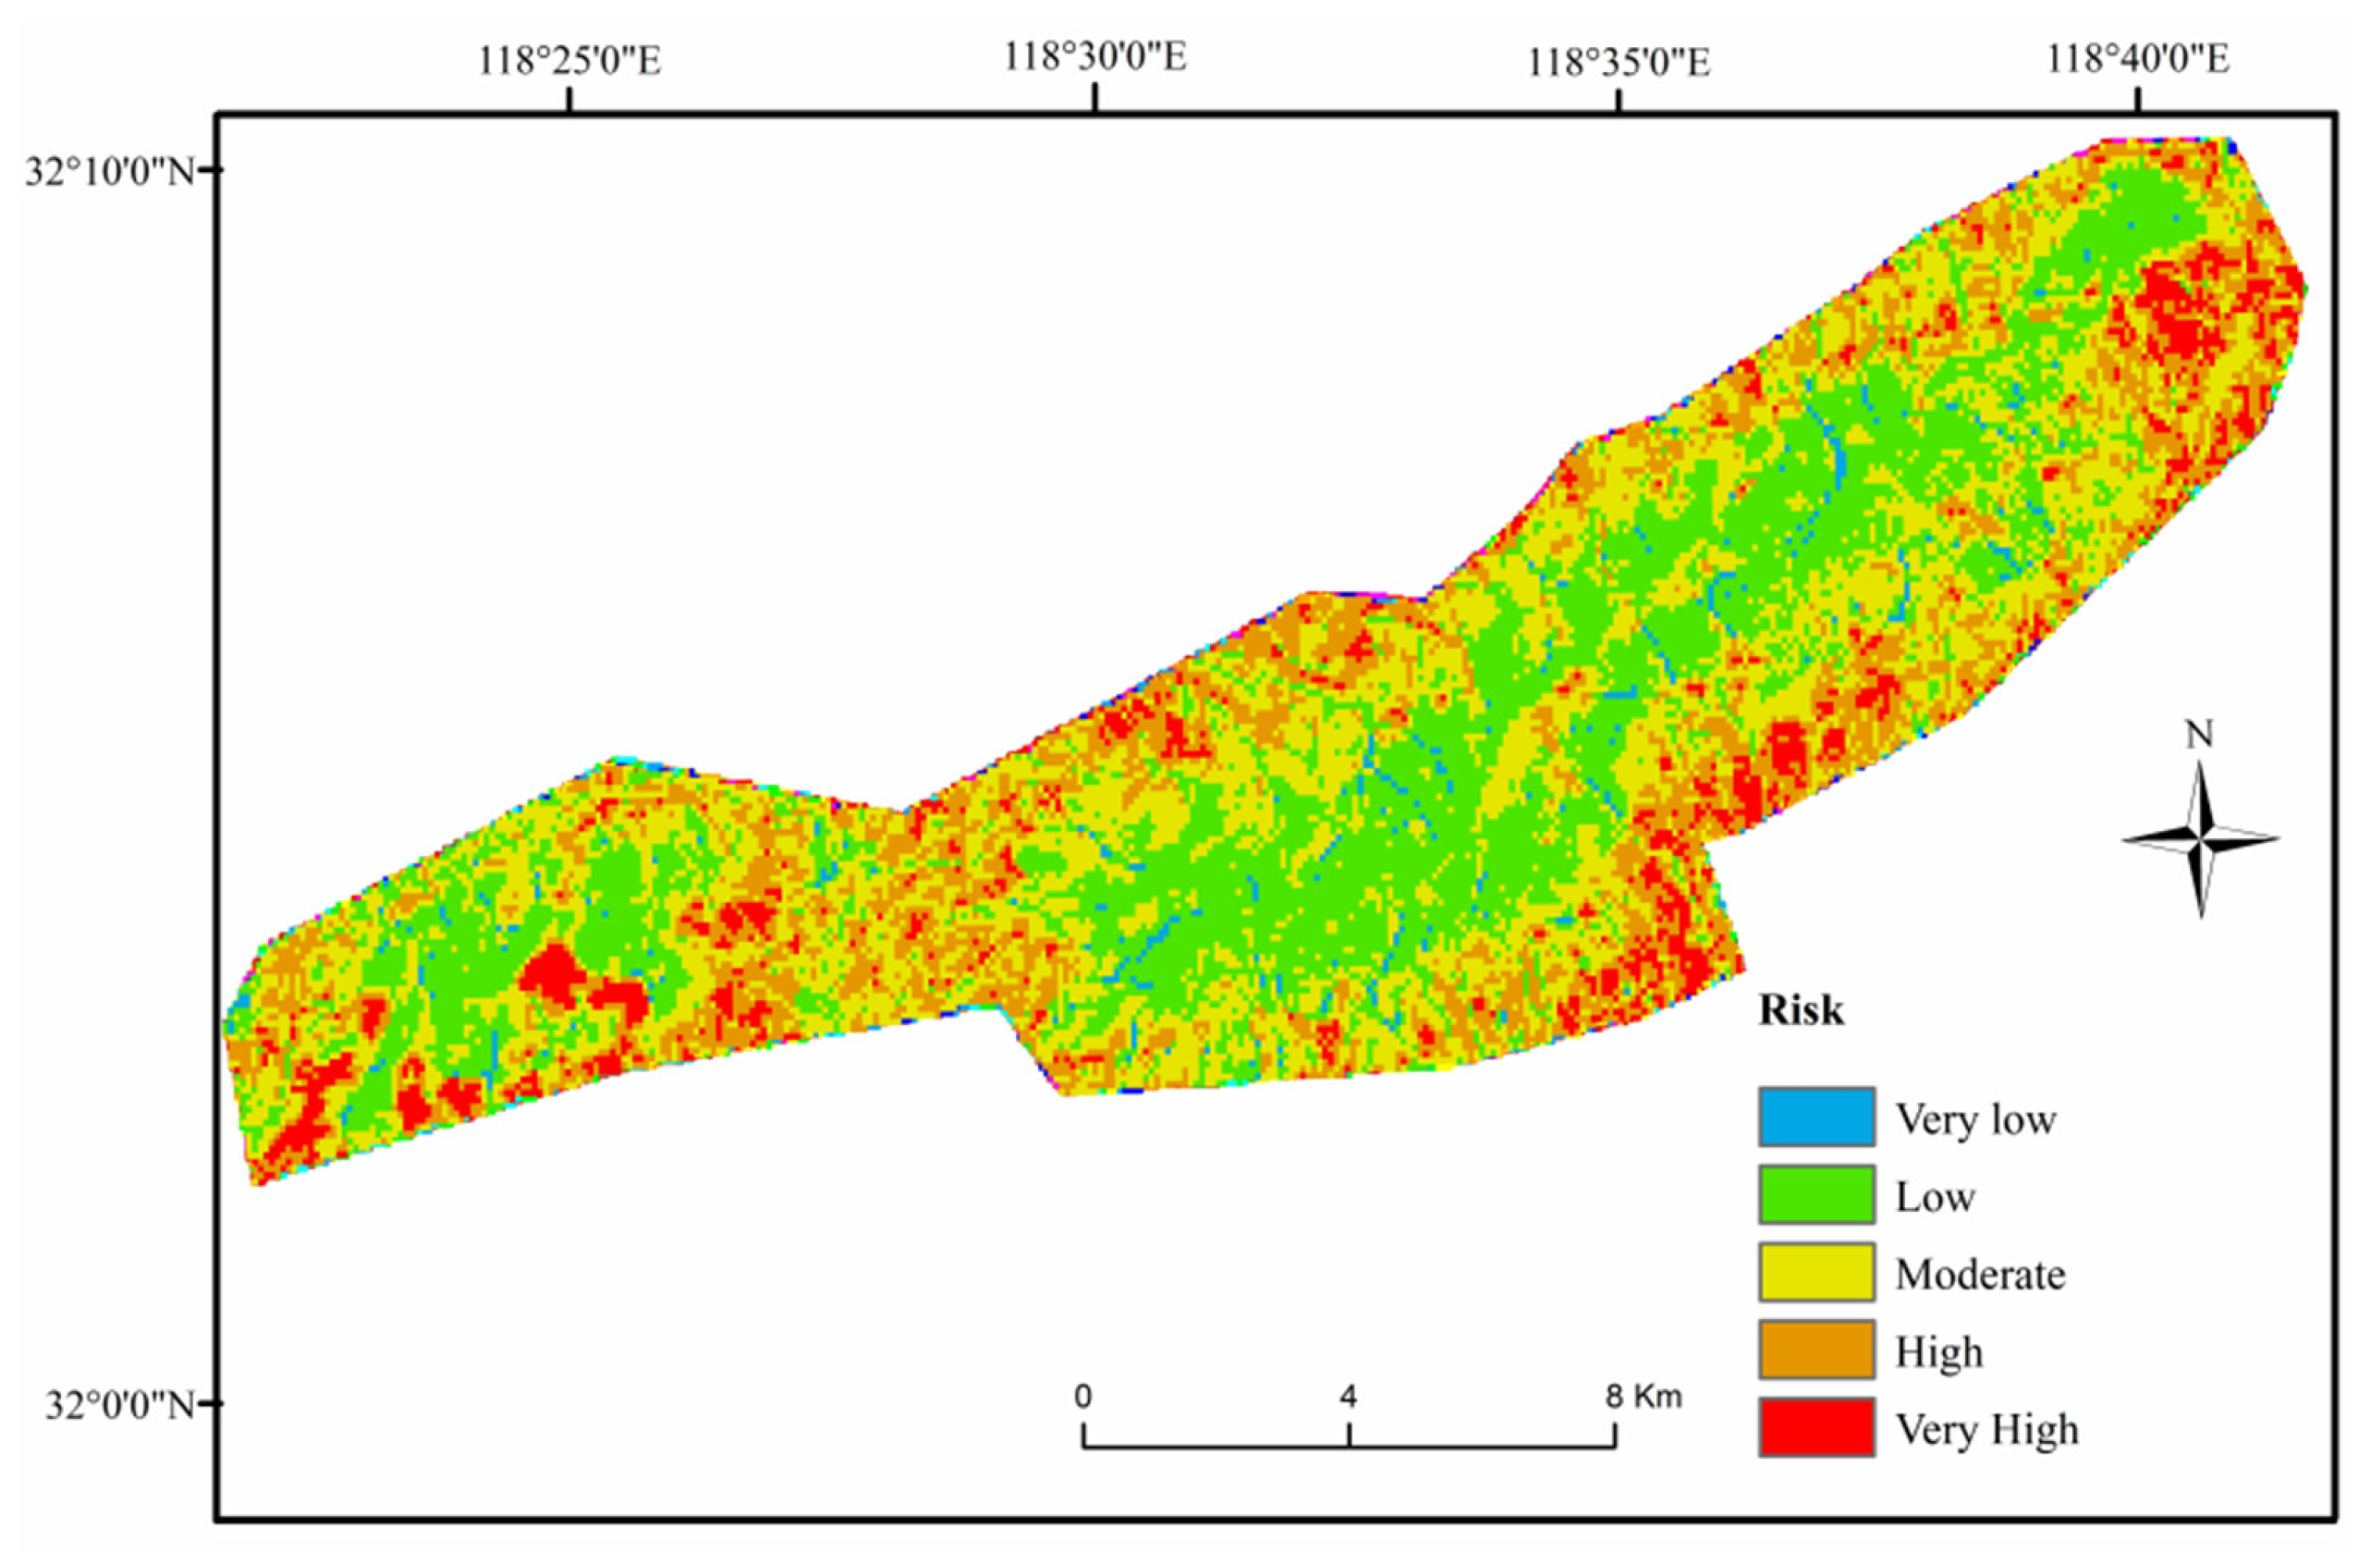
2.1. Model Formulation
2.2. Gaussian Mixture Model
- Initialize Gaussian distributions with random mean and random variance for each Gaussian distribution.
- Perform soft clustering on the input data (known as the expectation step), and calculate the membership degree of each coordinate point to each category with Equation (7).where is the probability density function of the normal distribution (Equation (8)), and the value range of is 1, 2, 3, …, K.
- With E, estimate the parameter mean and variance of the Gaussian distribution; is the weighted average of all coordinate points calculated with Equation (9), and variance is calculated with Equation (10).
- Evaluate the log likelihood with Equation (11) to check for convergence by summing the log-likelihood values of all clusters. If there is convergence, return the result; otherwise, return to step 2.where is the mixing coefficient.
2.3. Ring Self-Organizing Map-Based Path Planning
| Algorithm 1: Path planning algorithm based on RSOM |
| 1: ▷Input: Tmax, nums, N, C, W |
| 2: ▷Tmax: Number of iterations |
| 3: ▷Nums: Number of classified points |
| 4: ▷C: Counter for each neuron |
| 5: ▷W: Weight of each neuron |
| 6: ▷Tint: Check time interval |
| 7: ▷Output: Path |
| 8: i = 0, j = 1 |
| 9: While (i <Tmax) do |
| 10: for j = 1 to Nums do |
| 11: NeuronIndex = minDistanceNeuron(sorted(distance(j,1:N))) |
| 12: PreNeuronIndex = getPreNeuronWithNeuronIndex() |
| 13: NextNeuronIndex = getNextNeuronWithNeuronIndex() |
| 14: W = updateParameterW(NeuronIndex,PreNeuronIndex,NextNeuronIndex) |
| 15: C(NeuronIndex)++ |
| 16: end for |
| 17: ▷Add neurons |
| 18: if mod(i,Tint) == 0 |
| 19: distance1 = distance(NeuronIndex,PreNeuronIndex) |
| 20: distance2 = distance(NeuronIndex,PreNeuronIndex) |
| 21: if distance1 > distance2 |
| 22: insertNewNeuronbetween(NeuronIndex,PreNeuronIndex) |
| 23: else |
| 24: insertNewNeuronbetween(NeuronIndex,NextNeuronIndex) |
| 25: end if |
| 26: end if |
| 27: ▷Draw points and neuronal paths |
| 28: displayW(Nums, W, i) |
| 29: end While |
| 30: return displayPath(Nums) |
3. Results and Discussion
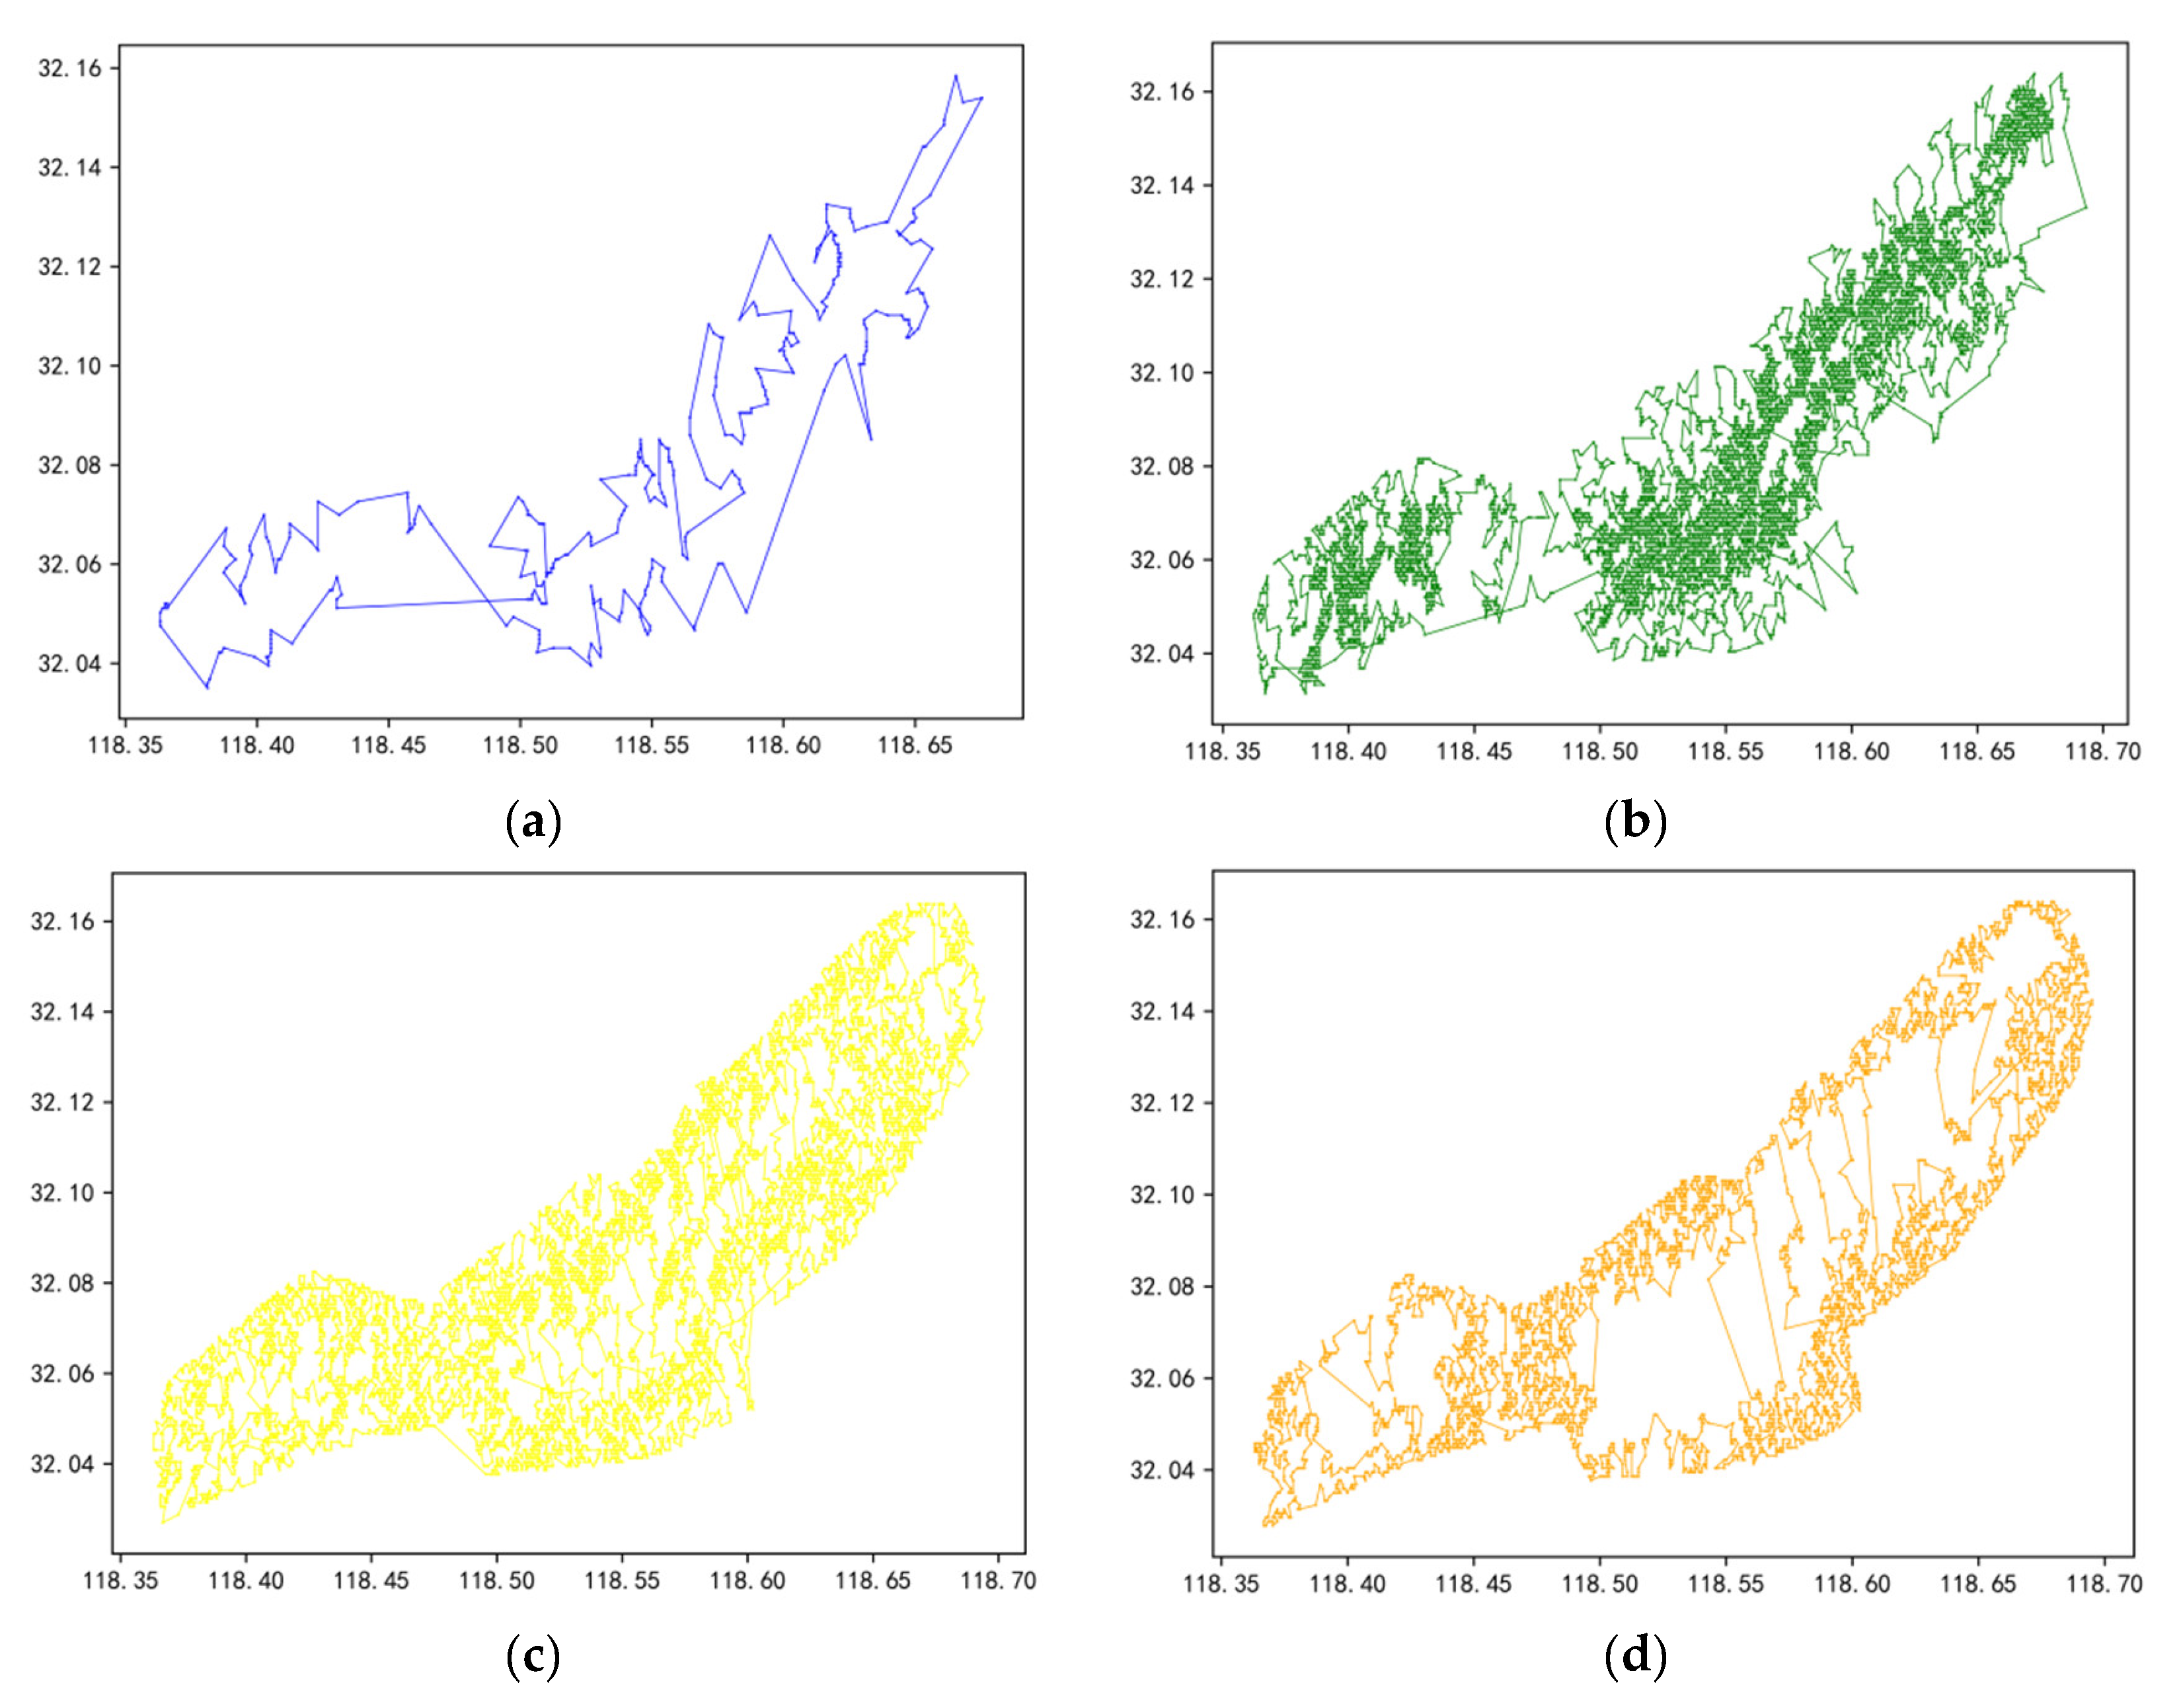
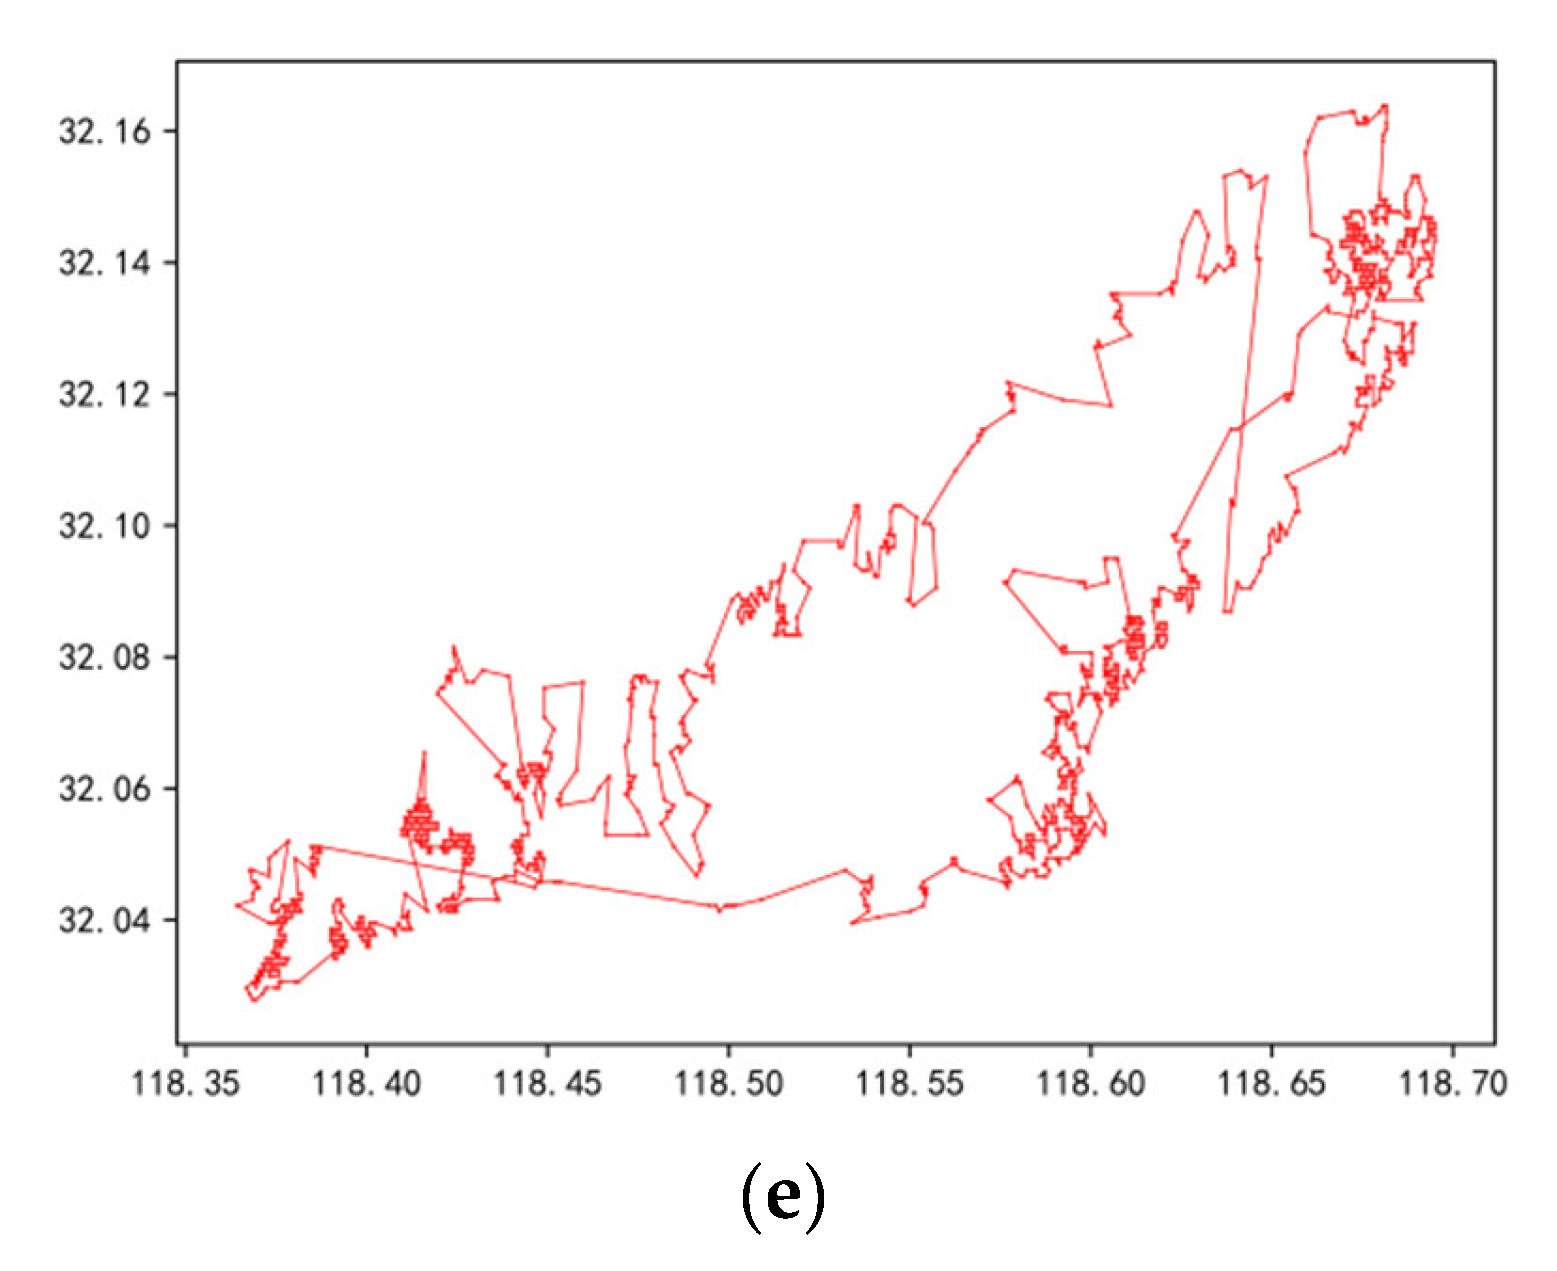
3.1. Results of RSOM-Based Planning
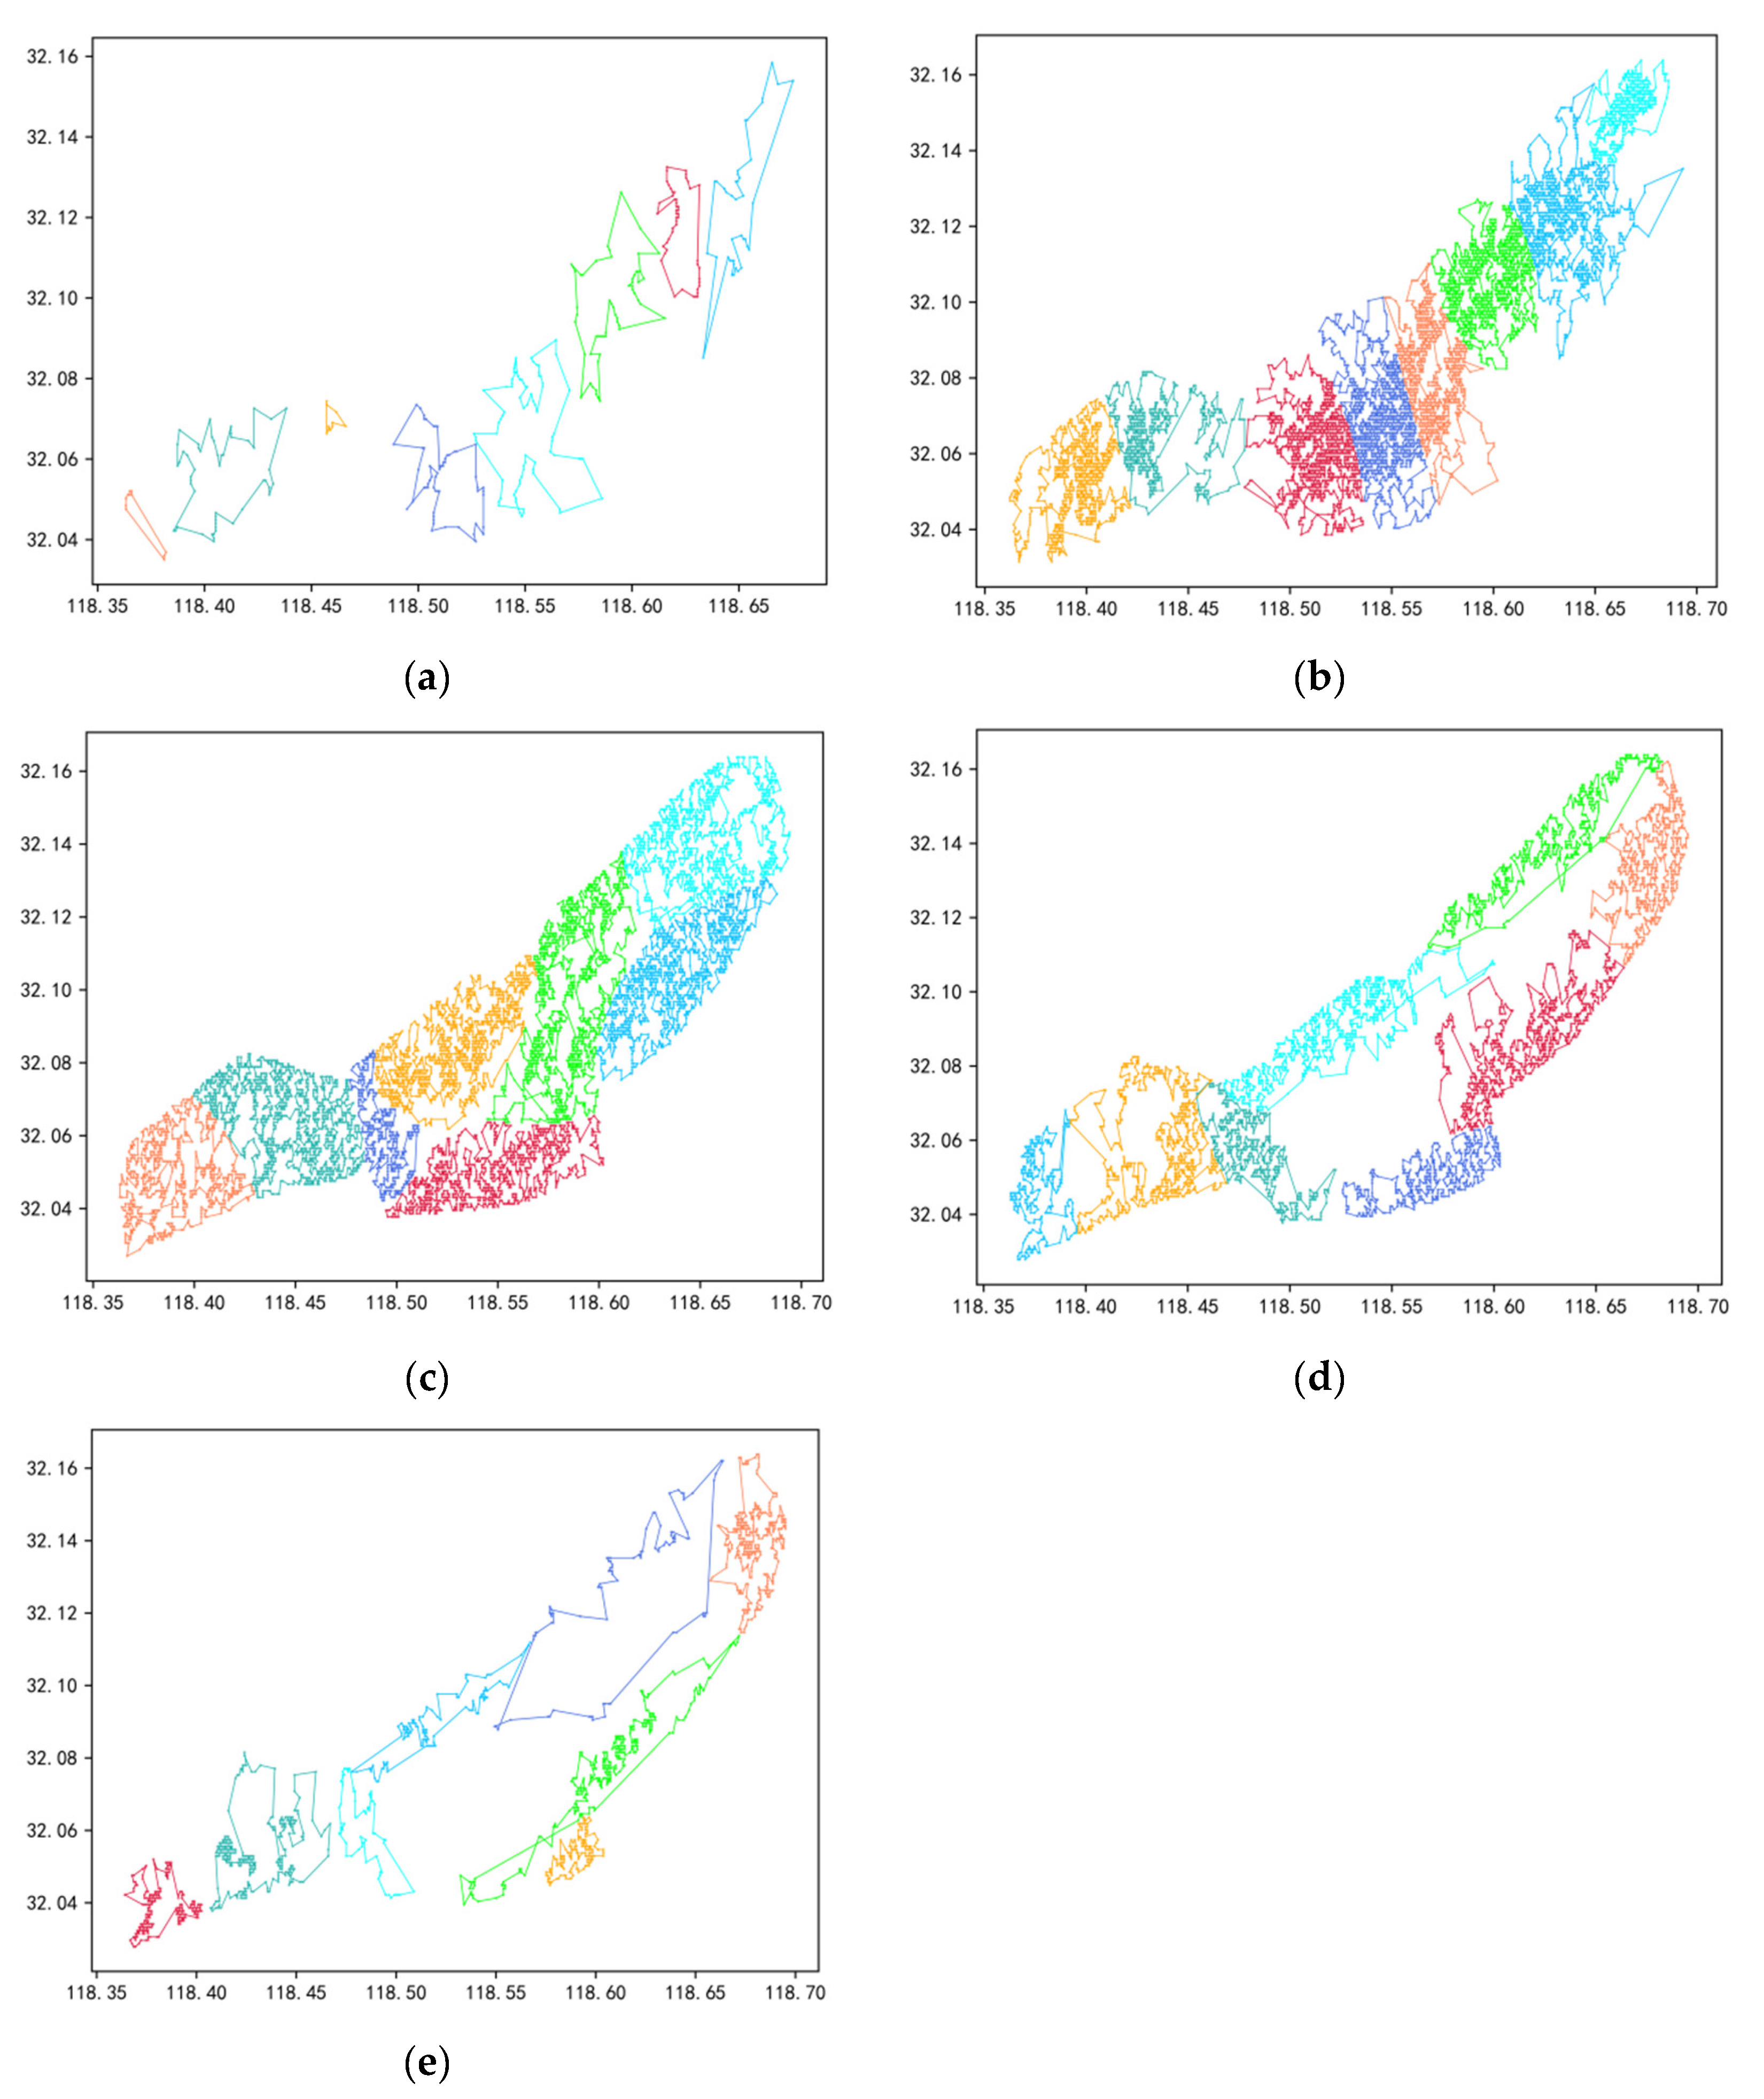
3.2. Results of Multiple UAVs with RSUPP
- (a)
- Whether the area traveled by the UAV is a fully connected graph;
- (b)
- Whether there is only one shortest path between any two points;
- (c)
- Whether the starting point coincides with the stopping point.
3.3. Comparison of Related Works
4. Conclusions
Author Contributions
Funding
Data Availability Statement
Conflicts of Interest
References
- Mohsen, N.; Rizeei, H.M.; Ramezani, F. Forest fire risk prediction: A spatial deep neural network-based framework. Remote Sens. 2021, 13, 2513. [Google Scholar]
- Ertugrul, M.; Varol, T.; Ozel, H.B.; Cetin, M.; Sevik, H. Influence of climatic factor of changes in forest fire danger and fire season length in Turkey. Environ. Monit. Assess. 2021, 193, 28. [Google Scholar] [CrossRef]
- Jain, M.; Saxena, P.; Sharma, S.; Sonwani, S. Investigation of forest fire activity changes over the central India domain using satellite observations during 2001–2020. GeoHealth 2021, 5, e2021GH000528. [Google Scholar] [CrossRef]
- Xu, N.; Rangwala, S.; Chintalapudi, K.K.; Ganesan, D.; Broad, A.; Govindan, R.; Estrin, D. A wireless sensor network for structural monitoring. In Proceedings of the 2nd International Conference on Embedded Networked Sensor Systems, Baltimore, MD, USA, 3–5 November 2004; pp. 13–24. [Google Scholar]
- Mao, G.; Fidan, B.; Anderson, B.D.O. Wireless sensor network localization techniques. Comput. Netw. 2007, 51, 2529–2553. [Google Scholar] [CrossRef] [Green Version]
- Dampage, U.; Bandaranayake, L.; Wanasinghe, R.; Kottahachchi, K.; Jayasanka, B. Forest fire detection system using wireless sensor networks and machine learning. Sci. Rep. 2022, 12, 46. [Google Scholar] [CrossRef]
- Bao, S.; Xiao, N.; Lai, Z.; Zhang, H.; Kim, C. Optimizing watchtower locations for forest fire monitoring using location models. Fire Saf. J. 2015, 71, 100–109. [Google Scholar] [CrossRef]
- Heyns, A.M.; du Plessis, W.; Curtin, K.M.; Kosch, M.; Hough, G. Analysis and Exploitation of Landforms for Improved Optimisation of Camera-Based Wildfire Detection Systems. Fire Technol. 2021, 57, 2269–2303. [Google Scholar] [CrossRef]
- Andries, H.; du Warren, P.; Michael, K.; Gavin, H. Optimisation of tower site locations for camera-based wildfire detection systems. Int. J. Wildland Fire 2019, 28, 651–665. [Google Scholar]
- Khan, A.; Gupta, S.; Gupta, S.K. Multi-hazard disaster studies: Monitoring, detection, recovery, and management, based on emerging technologies and optimal techniques. Int. J. Disaster Risk Reduct. 2020, 47, 101642. [Google Scholar] [CrossRef]
- Zhao, L.; Shi, Y.; Liu, B.; Hovis, C.; Duan, Y.; Shi, Z. Finer classification of crops by fusing UAV images and Sentinel-2A data. Remote Sens. 2019, 11, 3012. [Google Scholar] [CrossRef] [Green Version]
- Alsamhi, S.H.; Shvetsov, A.V.; Kumar, S.; Shvetsova, S.V.; Alhartomi, M.A.; Hawbani, A.; Nyangaresi, V.O. UAV computing-assisted search and rescue mission framework for disaster and harsh environment mitigation. Drones 2022, 6, 154. [Google Scholar] [CrossRef]
- Roberge, V.; Tarbouchi, M.; Labonté, G. Fast Genetic Algorithm Path Planner for Fixed-Wing Military UAV Using GPU. IEEE Trans. Aerosp. Electron. Syst. 2018, 54, 2105–2117. [Google Scholar] [CrossRef]
- Lindner, G.; Schraml, K.; Mansberger, R.; Hübl, J. UAV monitoring and documentation of a large landslide. Appl. Geomat. 2016, 8, 1–11. [Google Scholar] [CrossRef]
- Onishi, M.; Ise, T. Explainable identification and mapping of trees using UAV RGB image and deep learning. Sci. Rep. 2021, 11, 903. [Google Scholar] [CrossRef]
- Zhao, Y.; Zheng, Z.; Liu, Y. Survey on computational-intelligence-based UAV path planning. Knowl.-Based Syst. 2018, 158, 54–64. [Google Scholar] [CrossRef]
- Yin, C.; Xiao, Z.; Cao, X.; Xi, X.; Yang, P.; Wu, D. Offline and online search: UAV multiobjective path planning under dynamic urban environment. IEEE Internet Things J. 2017, 5, 546–558. [Google Scholar] [CrossRef]
- Elkhrachy, I. Accuracy assessment of low-cost Unmanned Aerial Vehicle (UAV) photogrammetry. Alex. Eng. J. 2021, 60, 5579–5590. [Google Scholar] [CrossRef]
- Arca, D.; Hacısalihoğlu, M.; Kutoğlu, Ş.H. Producing forest fire susceptibility map via multi-criteria decision analysis and frequency ratio methods. Nat. Hazards 2020, 104, 73–89. [Google Scholar] [CrossRef]
- Alemayehu, T.S.; Kim, J.H. Efficient nearest neighbor heuristic TSP algorithms for reducing data acquisition latency of UAV relay WSN. Wirel. Pers. Commun. 2017, 95, 3271–3285. [Google Scholar] [CrossRef]
- Zhang, H.; Dou, L.; Xin, B.; Chen, J.; Gan, M.; Ding, Y. Data collection task planning of a fixed-wing unmanned aerial vehicle in forest fire monitoring. IEEE Access 2021, 9, 109847–109864. [Google Scholar] [CrossRef]
- He, L.; Aouf, N.; Song, B. Explainable Deep Reinforcement Learning for UAV autonomous path planning. Aerosp. Sci. Technol. 2021, 118, 107052. [Google Scholar] [CrossRef]
- Zhou, J.; Zhang, W.; Zhang, Y.; Zhao, Y.; Ma, Y. Optimal Path Planning for UAV Patrolling in Forest Fire Prevention. In Asia-Pacific International Symposium on Aerospace Technology; Springer: Singapore, 2018; pp. 2209–2218. [Google Scholar]
- Amiri, M.; Pourghasemi, H.R. Predicting areas affected by forest fire based on a machine learning algorithm. Comput. Earth Environ. Sci. 2022, 351–362. [Google Scholar]
- Li, M.; Richards, A.; Sooriyabandara, M. Reliability-Aware Multi-UAV Coverage Path Planning using a Genetic Algorithm. In Proceedings of the 20th International Conference on Autonomous Agents and MultiAgent Systems, Online, 3–7 May 2021; pp. 1584–1586. [Google Scholar]
- Van Hoang, T.; Chou, T.Y.; Fang, Y.M.; Nguyen, N.T.; Nguyen, Q.H.; Xuan Canh, P.; Ngo Bao Toan, D.; Nguyen, X.L.; Meadows, M.E. Mapping Forest Fire Risk and Development of Early Warning System for NW Vietnam Using AHP and MCA/GIS Methods. Appl. Sci. 2020, 10, 4348. [Google Scholar] [CrossRef]
- Pan, Y.; Yang, Y.; Li, W. A deep learning trained by genetic algorithm to improve the efficiency of path planning for data collection with multi-UAV. IEEE Access 2021, 9, 7994–8005. [Google Scholar] [CrossRef]
- Nagasawa, R.; Mas, E.; Moya, L.; Koshimura, S. Model-based analysis of multi-UAV path planning for surveying postdisaster building damage. Sci. Rep. 2021, 11, 18588. [Google Scholar] [CrossRef]
- Gheshlaghi, A.; Hassan; Feizizadeh, B.; Blaschke, T. GIS-based forest fire risk mapping using the analytical network process and fuzzy logic. J. Environ. Plan. Manag. 2020, 63, 481–499. [Google Scholar] [CrossRef]
- Bonazountas, M.; Kallidromitou, D.; Kassomenos, P.A.; Passas, N. Forest fire risk analysis. Hum. Ecol. Risk Assess. 2005, 11, 617–626. [Google Scholar] [CrossRef]
- Sivrikaya, N.U.R.İ.; Saglam, B.; Akay, A.; Bozali, N. Evaluation of forest fire risk with GIS. Pol. J. Environ. Stud. 2014, 23, 187–194. [Google Scholar]
- Jaiswal, R.K.; Mukherjee, S.; Raju, K.D.; Saxena, R. Forest fire risk zone mapping from satellite imagery and GIS. Int. J. Appl. Earth Obs. Geoinf. 2002, 4, 1–10. [Google Scholar] [CrossRef]
- Adab, H.; Kanniah, K.D.; Solaimani, K. Modeling forest fire risk in the northeast of Iran using remote sensing and GIS techniques. Nat. Hazards 2013, 65, 1723–1743. [Google Scholar] [CrossRef]
- Alonso-Betanzos, A.; Fontenla-Romero, O.; Guijarro-Berdiñas, B.; Hernández-Pereira, E.; Andrade, M.I.P.; Jiménez, E.; Soto, J.L.L.; Carballas, T. An intelligent system for forest fire risk prediction and fire fighting management in Galicia. Expert Syst. Appl. 2003, 25, 545–554. [Google Scholar] [CrossRef]
- Eugenio, F.C.; dos Santos, A.R.; Fiedler, N.C.; Ribeiro, G.A.; da Silva, A.G.; dos Santos, Á.B.; Paneto, G.G.; Schettino, V.R. Applying GIS to develop a model for forest fire risk: A case study in Espírito Santo, Brazil. J. Environ. Manag. 2016, 173, 65–71. [Google Scholar] [CrossRef]
- Sharma, L.K.; Kanga, S.; Nathawat, M.S.; Sinha, S.; Pandey, P.C. Fuzzy AHP for forest fire risk modeling. Disaster Prev. Manag. Int. J. 2012.
- Jain, A.; Ravan, S.A.; Singh, R.K.; Das, K.K.; Roy, P.S. Forest fire risk modelling using remote sensing and geographic information system. Curr. Sci. 1996, 70, 928–933. [Google Scholar]
- Ozkan, O.; Kilic, S. UAV routing by simulation-based optimization approaches for forest fire risk mitigation. Ann. Oper. Res. 2022, 314, 1–37. [Google Scholar] [CrossRef]
- Wang, J.; Deng, H.; Wang, C.; Cao, X. A Dual-Robot Welding Path Planning Method Based on Kmeans and Ant Colony Algorithms. In Proceedings of the 2021 8th International Conference on Information, Cybernetics, and Computational Social Systems (ICCSS), Beijing, China, 10–12 December 2021; pp. 172–176. [Google Scholar]
- Yue, X.; Zhang, W. UAV path planning based on k-means algorithm and simulated annealing algorithm. In Proceedings of the 2018 37th Chinese Control Conference (CCC), Wuhan, China, 25–27 July 2018; pp. 2290–2295. [Google Scholar]
- Tang, Y.; Zhou, R.; Sun, G.; Di, B.; Xiong, R. A novel cooperative path planning for multirobot persistent coverage in complex environments. IEEE Sens. J. 2020, 20, 4485–4495. [Google Scholar] [CrossRef]
- He, X.; Cai, D.; Shao, Y.; Bao, H.; Han, J. Laplacian regularized gaussian mixture model for data clustering. IEEE Trans. Knowl. Data Eng. 2010, 23, 1406–1418. [Google Scholar] [CrossRef] [Green Version]
- Sasamura, H.; Ohta, R.; Saito, T. A simple learning algorithm for growing ring SOM and its application to TSP. In Proceedings of the 9th International Conference on Neural Information Processing, Singapore, 18–22 November 2002; Volume 3, pp. 1287–1290. [Google Scholar]
- Zhao, P.; Zhang, F.; Lin, H.; Xu, S. GIS-Based Forest Fire Risk Model: A Case Study in Laoshan National Forest Park, Nanjing. Remote Sens. 2021, 13, 3704. [Google Scholar] [CrossRef]
- Conway, R.W.; Johnson, B.M.; Maxwell, W.L. Some problems of digital systems simulation. Manag. Sci. 1959, 6, 92–110. [Google Scholar] [CrossRef]
- Chen, T.; Zhang, G.; Hu, X.; Xiao, J. Unmanned aerial vehicle route planning method based on a star algorithm. In Proceedings of the 2018 13th IEEE Conference on Industrial Electronics and Applications (ICIEA), Wuhan, China, 31 May–2 June 2018; pp. 1510–1514. [Google Scholar]


| Reference | Large Area Suitability | UAV Endurance | Cruise Frequency | Optimization Objective | Multiple UAVs | |
|---|---|---|---|---|---|---|
| Distance | Fire risk | |||||
| [13] | √ | √ | ||||
| [17,27] | √ | √ | √ | √ | ||
| [21,23] | √ | |||||
| [25] | √ | √ | √ | |||
| [28] | √ | √ | √ | |||
| [38] | √ | √ | √ | √ | ||
| Ours | √ | √ | √ | √ | √ | √ |
| Risk Level | Very Low | Low | Moderate | High | Very High |
|---|---|---|---|---|---|
| Distance (km) | 88.96 | 493.79 | 585.63 | 375.48 | 165.00 |
| Time (h) | 1.48 | 8.23 | 9.76 | 6.26 | 2.75 |
| Sub-Area | Very Low | Low | Moderate | High | Very High | |||||
|---|---|---|---|---|---|---|---|---|---|---|
| Distance | Time | Distance | Time | Distance | Time | Distance | Time | Distance | Time | |
| 0 | 13.75 | 0.23 | 67.14 | 1.12 | 90.94 | 1.52 | 48.20 | 0.80 | 34.31 | 0.57 |
| 1 | 13.13 | 0.22 | 47.70 | 0.80 | 82.61 | 1.38 | 37.50 | 0.63 | 26.27 | 0.44 |
| 2 | 11.25 | 0.19 | 73.27 | 1.22 | 30.45 | 0.51 | 26.98 | 0.45 | 23.33 | 0.39 |
| 3 | 15.01 | 0.25 | 85.69 | 1.43 | 87.77 | 1.46 | 26.98 | 0.45 | 17.25 | 0.29 |
| 4 | 9.55 | 0.16 | 70.90 | 1.18 | 67.14 | 1.12 | 68.63 | 1.14 | 14.92 | 0.25 |
| 5 | 18.91 | 0.32 | 31.49 | 0.52 | 85.09 | 1.42 | 59.31 | 0.99 | 9.93 | 0.17 |
| 6 | 2.64 | 0.04 | 55.74 | 0.93 | 80.73 | 1.35 | 55.24 | 0.92 | 10.72 | 0.18 |
| 7 | 3.01 | 0.05 | 60.18 | 1.00 | 56.23 | 0.94 | 46.17 | 0.77 | 26.85 | 0.45 |
| Total distance | 87.25 | 492.11 | 580.96 | 369.01 | 163.58 | |||||
| Method | Very Low | Low | Moderate | High | Very High |
|---|---|---|---|---|---|
| Distance (km) | Distance (km) | Distance (km) | Distance (km) | Distance (km) | |
| A UAV | 88.96 | 493.79 | 585.63 | 375.48 | 165.00 |
| Multi-UAV | 87.25 | 492.11 | 580.96 | 369.01 | 163.58 |
| Optimization (%) | 1.9 | 0.3 | 0.7 | 1.7 | 0.8 |
| Risk Level | Frequency |
|---|---|
| Very low | 1 |
| Low | 2 |
| Moderate | 3 |
| High | 4 |
| Very high | 5 |
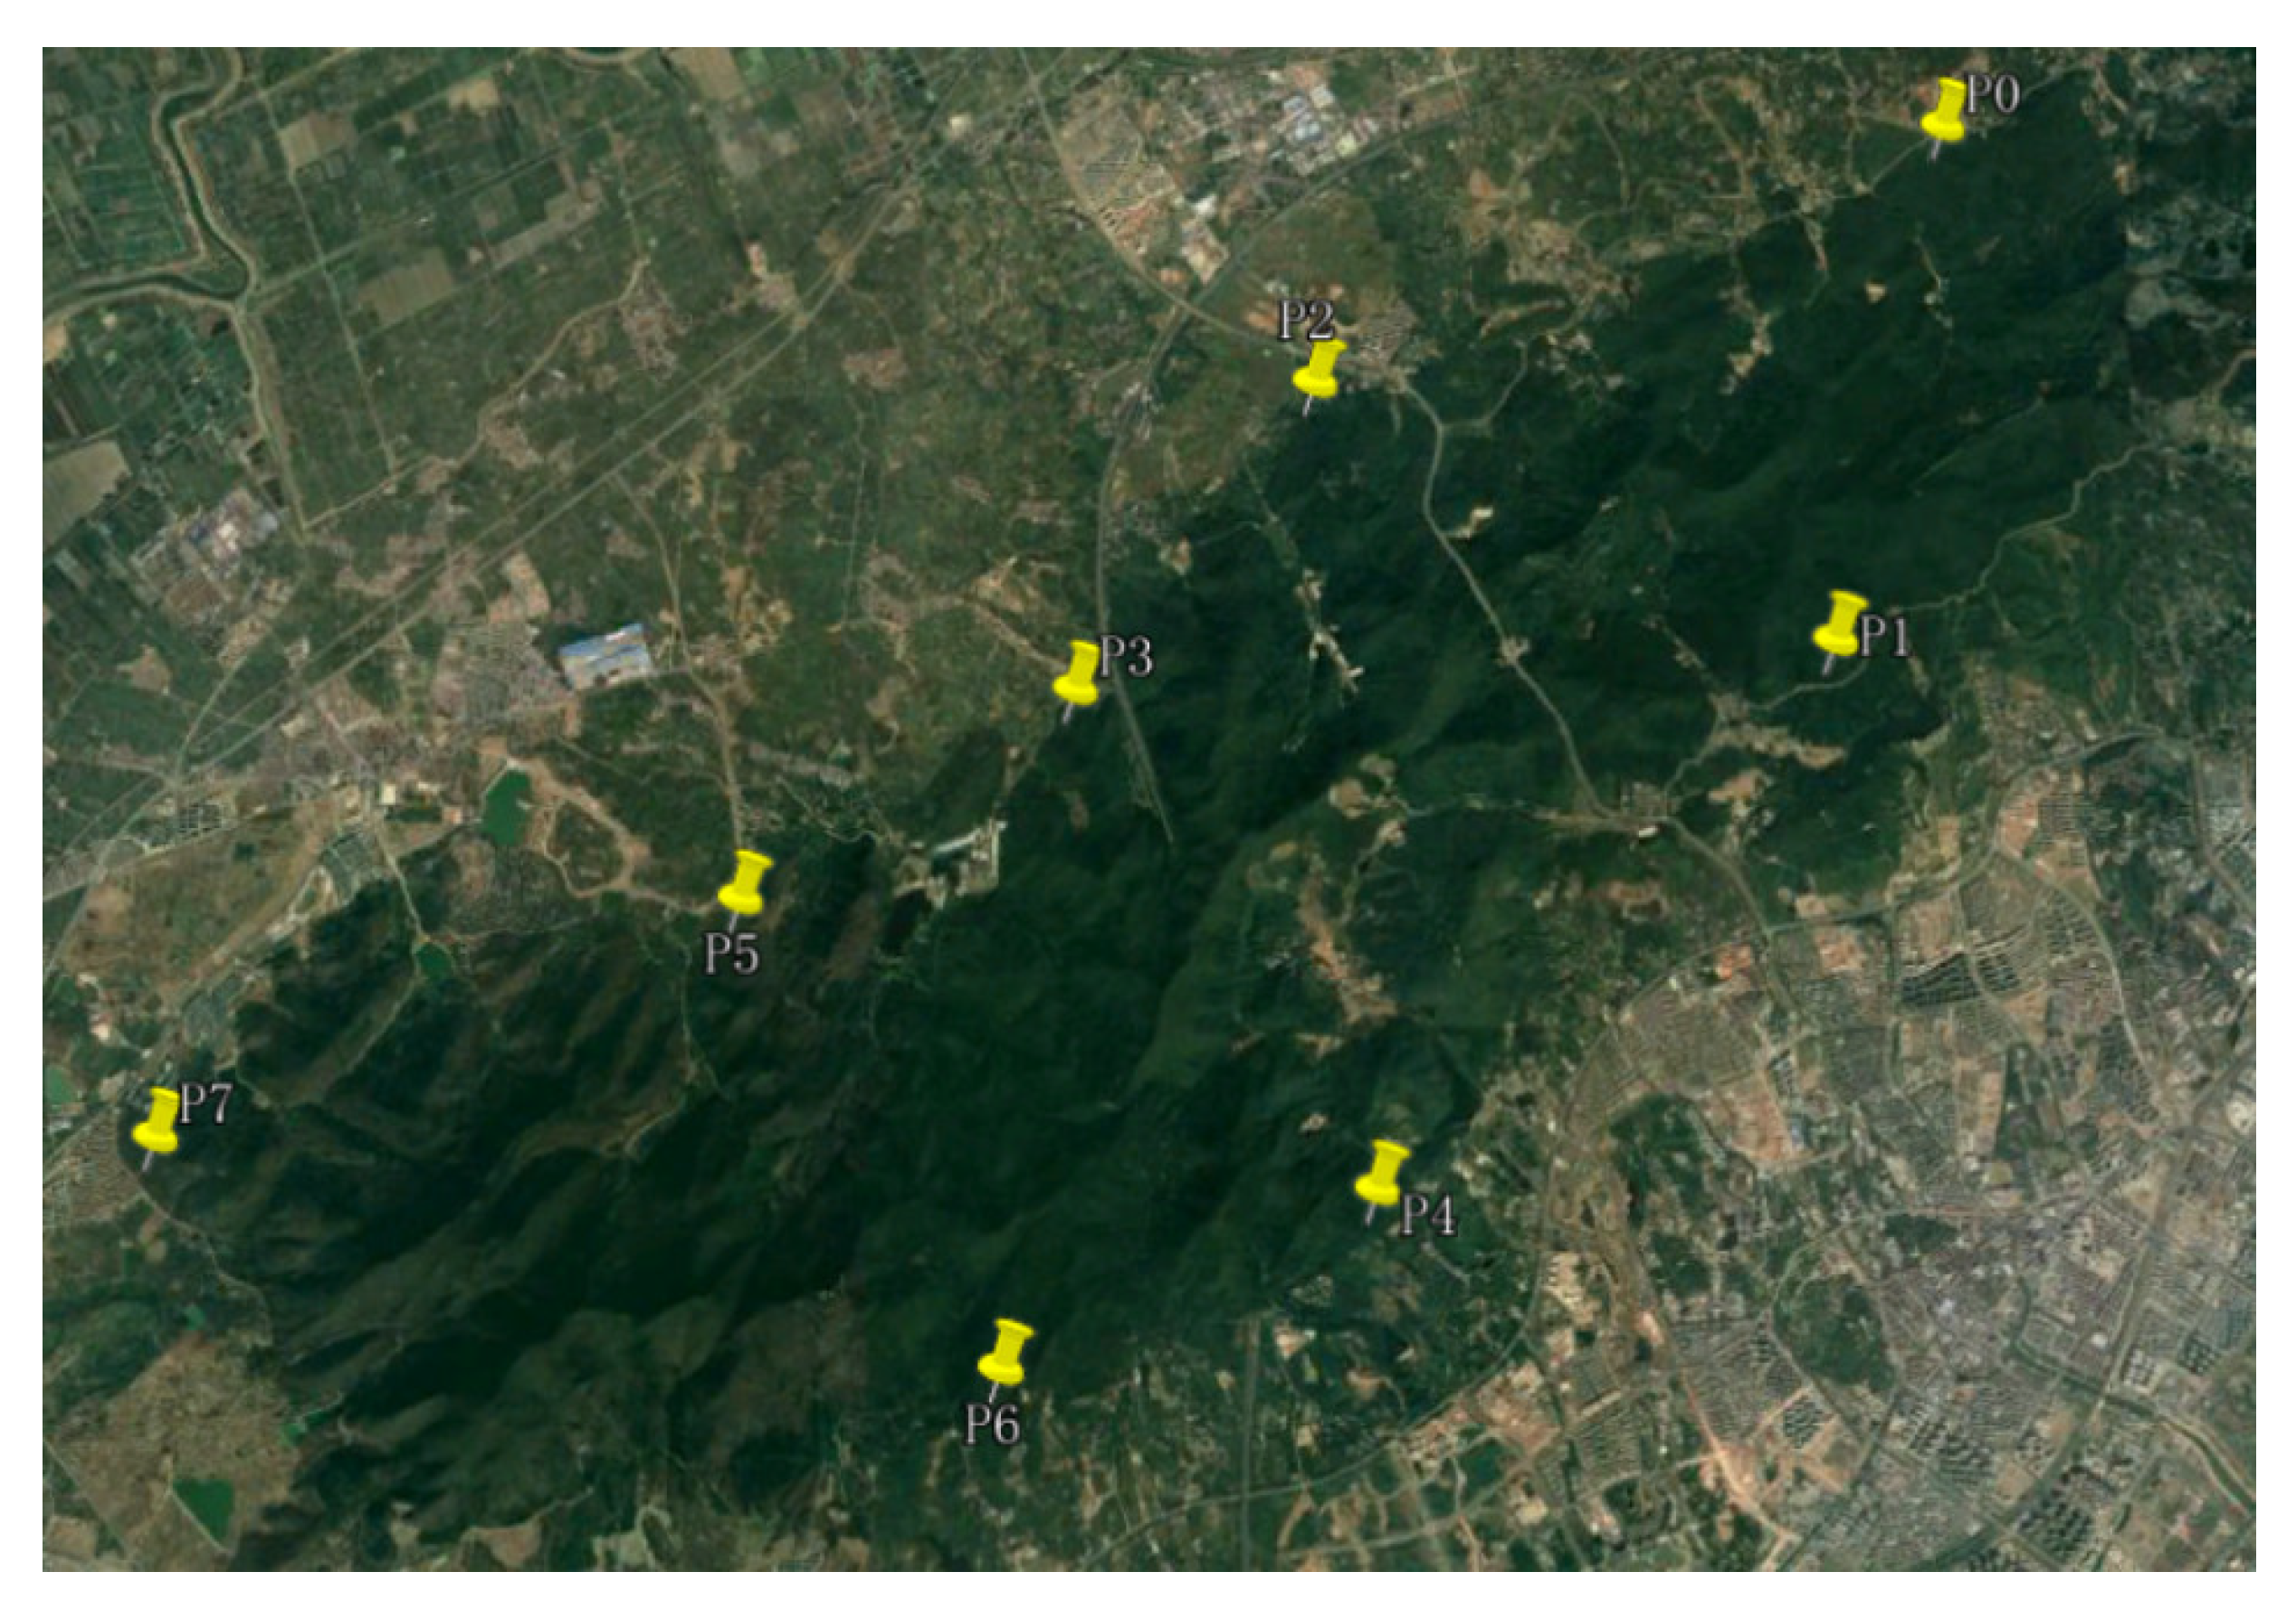
| Site | Latitude | Longitude |
|---|---|---|
| P0 | 32°7′51.28″ N | 118°37′10.41″ E |
| P1 | 32°5′54.94″ N | 118°36′40.02″ E |
| P2 | 32°6′53.23″ N | 118°34′24.37″ E |
| P3 | 32°5′44.13″ N | 118°33′21.98″ E |
| P4 | 32°3′54.38″ N | 118°34′40.50″ E |
| P5 | 32°4′57.84″ N | 118°31′55.44″ E |
| P6 | 32°3′15.76″ N | 118°33′4.09″ E |
| P7 | 32°4′5.73″ N | 118°29′25.35″ E |
| Subarea | Very Low | Low | Moderate | High | Very High | Total Time (h) |
|---|---|---|---|---|---|---|
| 0 | 0.23 | 1.12 | 1.52 | 0.80 | 0.57 | 13.08 |
| 1 | 0.22 | 0.80 | 1.38 | 0.63 | 0.44 | 10.68 |
| 2 | 0.19 | 1.22 | 0.51 | 0.45 | 0.39 | 7.91 |
| 3 | 0.25 | 1.43 | 1.46 | 0.45 | 0.29 | 10.74 |
| 4 | 0.16 | 1.18 | 1.12 | 1.14 | 0.25 | 11.69 |
| 5 | 0.32 | 0.52 | 1.42 | 0.99 | 0.17 | 10.43 |
| 6 | 0.04 | 0.93 | 1.35 | 0.92 | 0.18 | 10.53 |
| 7 | 0.05 | 1.00 | 0.94 | 0.77 | 0.45 | 10.20 |
| Subarea | Very Low | Low | Moderate | High | Very High | AP-RSUPP (%) | |||||
|---|---|---|---|---|---|---|---|---|---|---|---|
| Distance | RSB (%) | Distance | RSB (%) | Distance | RSB (%) | Distance | RSB (%) | Distance | RSB (%) | ||
| 0 | 16.86 | 7.69 | 80.76 | 7.63 | 128.26 | 9.79 | 86.19 | 8.05 | 39.95 | 8.44 | 100 |
| 1 | 21.52 | 0.00 | 133.15 | 3.55 | 134.33 | 4.39 | 64.11 | 3.50 | 25.90 | 6.72 | 100 |
| 2 | 12.67 | 6.98 | 71.76 | 3.02 | 112.57 | 3.65 | 72.75 | 4.46 | 19.59 | 2.38 | 100 |
| 3 | 8.78 | 0.00 | 77.26 | 12.93 | 110.08 | 13.39 | 93.55 | 12.82 | 56.86 | 14.36 | 100 |
| 4 | 13.76 | 18.75 | 71.23 | 12.26 | 86.74 | 9.66 | 75.63 | 13.41 | 43.01 | 10.57 | 100 |
| 5 | 20.07 | 3.28 | 159.68 | 3.48 | 129.81 | 3.95 | 71.10 | 2.82 | 30.98 | 3.51 | 100 |
| 6 | 17.34 | 13.04 | 81.89 | 11.59 | 83.80 | 11.54 | 52.58 | 9.04 | 32.43 | 10.71 | 100 |
| 7 | 22.11 | 2.60 | 133.57 | 3.76 | 155.43 | 4.38 | 85.35 | 3.13 | 33.54 | 2.4 | 100 |
| Total distance | 133.11 | 809.3 | 941.02 | 601.26 | 282.26 | ||||||
| Subarea | Origin (%) | LSB (%) | AP-RSUPP (%) |
|---|---|---|---|
| 0 | 8.49 | 48.10 | 100 |
| 1 | 3.97 | 15.13 | 100 |
| 2 | 3.77 | 73.81 | 100 |
| 3 | 13.21 | 87.97 | 100 |
| 4 | 11.68 | 20.33 | 100 |
| 5 | 3.55 | 10.53 | 100 |
| 6 | 11.10 | 17.86 | 100 |
| 7 | 3.84 | 33.6 | 100 |
Publisher’s Note: MDPI stays neutral with regard to jurisdictional claims in published maps and institutional affiliations. |
© 2022 by the authors. Licensee MDPI, Basel, Switzerland. This article is an open access article distributed under the terms and conditions of the Creative Commons Attribution (CC BY) license (https://creativecommons.org/licenses/by/4.0/).
Share and Cite
Xu, Y.; Li, J.; Zhang, F. A UAV-Based Forest Fire Patrol Path Planning Strategy. Forests 2022, 13, 1952. https://doi.org/10.3390/f13111952
Xu Y, Li J, Zhang F. A UAV-Based Forest Fire Patrol Path Planning Strategy. Forests. 2022; 13(11):1952. https://doi.org/10.3390/f13111952
Chicago/Turabian StyleXu, Yiqing, Jiaming Li, and Fuquan Zhang. 2022. "A UAV-Based Forest Fire Patrol Path Planning Strategy" Forests 13, no. 11: 1952. https://doi.org/10.3390/f13111952