Article

Changing Relationships between Nitrogen Content and Leaf Spectral Characteristics of Moso Bamboo Leaves under Pantana phyllostachysae Chao Stress

1
Academy of Geography and Ecological Environment, Fuzhou University, Fuzhou 350108, China
2
College of Environment and Safety Engineering, Fuzhou University, Fuzhou 350108, China
3
Key Laboratory of Spatial Data Mining & Information Sharing, Ministry of Education, The Academy of Digital China, Fuzhou University, Fuzhou 350108, China
4
College of Forestry, Fujian Agriculture and Forestry University, Fuzhou 350002, China
5
International Institute for Earth System Science, Nanjing University, Nanjing 210023, China
6
Fujian Provincial Key Laboratory of Resources and Environment Monitoring & Sustainable Management and Utilization, Sanming 365004, China
*
Author to whom correspondence should be addressed.
Forests 2022, 13(11), 1752; https://doi.org/10.3390/f13111752
Submission received: 14 September 2022 / Revised: 13 October 2022 / Accepted: 21 October 2022 / Published: 24 October 2022
(This article belongs to the Special Issue Diseases of Forests and Urban Trees Transmitted by Insects)

Abstract

:
Nitrogen is an important indicator of vegetation health, but the relationship between changes in the leaf nitrogen content of Moso bamboo leaves under Pantana phyllostachysae Chao (PPC) stress and leaf spectra remains unclear. We analyzed the relationship between the leaf nitrogen content and leaf spectra of Moso bamboo leaves under PPC stress to investigate whether the relationship could be used to detect pests and prevent their spread. We measured the nitrogen content and leaf spectra of Moso bamboo leaves under different damage levels, identified spectral indicators that were correlated with leaf nitrogen content (by removing the envelope and first-order differentiation of the raw spectra), and estimated leaf nitrogen content from the spectral data using regression models. Leaf nitrogen content decreased with increasing pest damage, and the leaf spectral curves changed, with the “green peak” and “red valley” in the visible range disappearing and the slope of the spectral curve decreasing. The wavelength region with the strongest correlation between the nitrogen content and spectral characteristics changed significantly with increasing pest damage, and the correlation in the red-edge region gradually decreased. The fits of nitrogen-content estimation models tended to decrease and then increase with increasing pest damage and were worst among leaves in the moderate damage state (Mo). A disordered relationship between nitrogen content and spectral characteristics indicated possible PPC damage. The degree of disorder was greatest in the Mo state. This study provides theoretical support for remote sensing monitoring of PPC hazards.

1. Introduction

Bamboo forest is crucial in forest ecosystems and the forest carbon sink, fostering ecological security and socio-economic development. China’s ninth forest resources inventory (2014–2018) shows that the area of bamboo forest is approximately 6,411,600 ha. Among many bamboo species, Moso bamboo accounts for 72.96% of the total area. It is the largest, most widely distributed, and most economically valuable bamboo species in China. Pests are important limits to healthy growth of bamboo forests. Pantana phyllostachysae Chao (PPC; Lepidoptera: Lymantriidae) causes huge ecological and economic losses to bamboo forests annually in China, and the negative impact cannot be ignored. PPC exhibits the characteristics of swarming and periodicity and causes severe damage [1,2]. During severe PPC outbreaks, Moso bamboo leaves are eaten, causing the death of patches of Moso bamboo forests. Traditionally, forest monitoring for pests is achieved through manual ground surveys. However, it is difficult to obtain a timely and detailed understanding of pest occurrence using this approach. The emergence of remote sensing technology has substantially improved the efficiency of forest pest surveys [3,4,5,6]. Advances in hyperspectral technology have further improved the accuracy and efficiency of forest pest monitoring [7,8,9].
The physiological state of leaves can be effectively used to characterize the health status of the vegetation [10,11]. Under pest stress, the external morphology of leaves changes, as well as the internal biochemical components [12,13,14,15,16]. Spectral information is affected by physiological changes in the vegetation [17]. Remote sensing has been widely used in agricultural and forestry management to obtain information on the biochemical components of leaves. Liu et al. used spectral indices to establish an inverse model of the chlorophyll content of soybean leaves, and the results provided a reference for large-scale monitoring of soybean growth status [18]. Minaei et al. estimated the nitrogen content of sugarcane leaves using Sentinel-2 data combined with a machine learning model to provide a reference for assessing the growing season quality of the crop [19]. Rubio-Delgado et al. found the best model for estimating the leaf nitrogen content of olive trees by adopting various pre-processing methods for raw spectra which provided a reference for fertilization management [20]. The inversion model of biochemical components of vegetation under pest stress based on spectral information has great practical value for understanding the response mechanism and monitoring of pests. Lian et al. estimated the canopy water content of Ziziphus jujuba under Tetranychus truncatus stress using multiple regression models [21]. Bai et al. constructed a model for monitoring the hazard level of Dendrolimus tabulaeformis by screening hyperspectral indices that are sensitive to biochemical component parameters [22]. Nitrogen is a crucial nutrient element for plant growth and plays an important role in the growth and development of vegetation and photosynthesis [23,24].
The nitrogen content of vegetative leaves changes significantly under pest stress, and nitrogen has become an important indicator for monitoring vegetation pests [25,26]. Nitrogen in leaves is mainly found in proteins and chlorophyll, and nitrogen-containing chemical bonds of leaves vibrate under a certain intensity of spectral radiation, triggering the absorption and reflection of specific spectral bands. The intensity of spectral absorption is closely related to the content of these chemical bonds [27]. At present, remote sensing inversion of the nitrogen content of vegetation is most commonly achieved by physical and empirical models, with good results [28,29,30,31,32]. Among these, empirical models are most widely used to determine the nitrogen content by modeling the relationship between the nitrogen content and spectral characteristics. Therefore, for studying pest monitoring mechanisms, it is important to clarify the relationship between the changing nitrogen content and spectra of leaves under pest stress.
Most published studies have focused on using spectral information and improving algorithms to estimate the nitrogen content of vegetation, but few studies have investigated the relationships between the changing nitrogen content and spectral characteristics of vegetation under pest stress. To address these problems, this study classified Moso bamboo leaves with different damage levels and investigated the relationship between them as pest damage stress increased. The objectives of this study were: (1) to clarify changes in the nitrogen content and spectral information of Moso bamboo leaves under different levels of damage; (2) to screen and analyze the spectral characteristics that are sensitive to the nitrogen content of Moso bamboo leaves under different levels of damage and establish a model for estimating the nitrogen content; and (3) to analyze the resultant estimates of the nitrogen content of Moso bamboo leaves under different damage levels and provide a fundamental basis for accurate identification of pests in large areas.

2. Materials and Methods
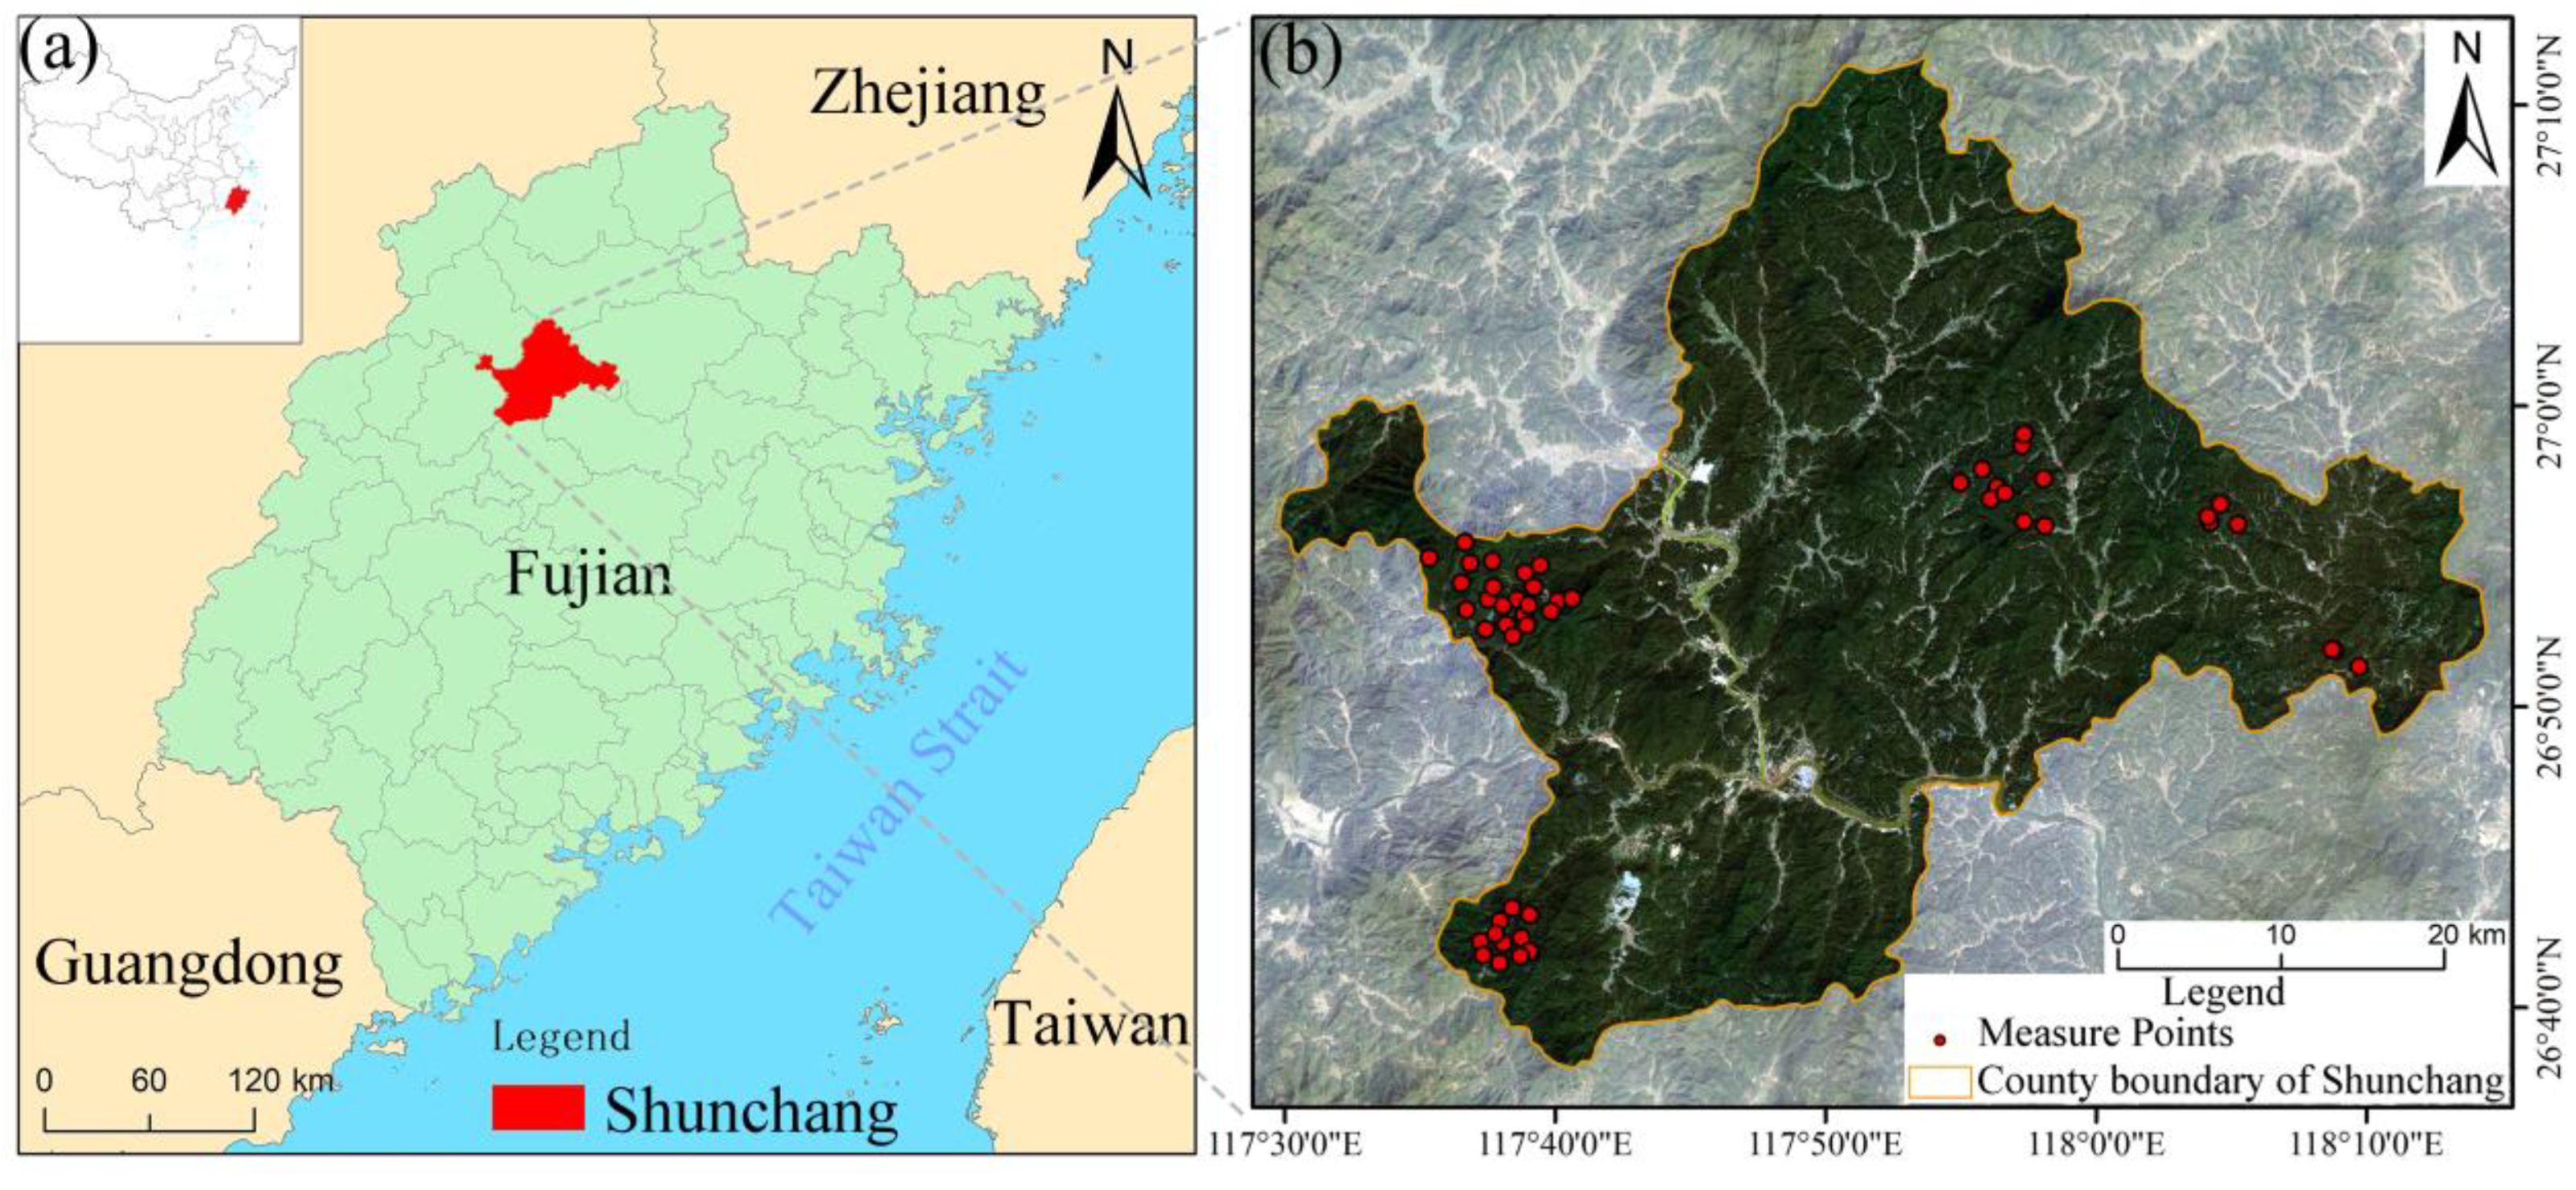
2.1. Study Area

The study area is located in Shunchang County of Fujian Province, southeastern China (117°29′–118°14′ E, 26°38′–27°12′ N; Figure 1a,b). Shunchang County has a subtropical monsoon climate—a mild climate with abundant rainfall. The terrain of the county is mainly mountainous and hilly, with large undulating terrain. It is a key forest area in the south of China and the first single bamboo forest carbon sink trading site in China. The county’s forest land area covers 167,000 ha, of which the bamboo forest area covers 44,000 ha, with 110 million standing Moso bamboo. In 2021, the area of PPC occurrence in Shunchang County was 964 ha. Three generations of PPC occur in Fujian Province in a year, with the first generation (from late June to late August) causing the greatest harm.

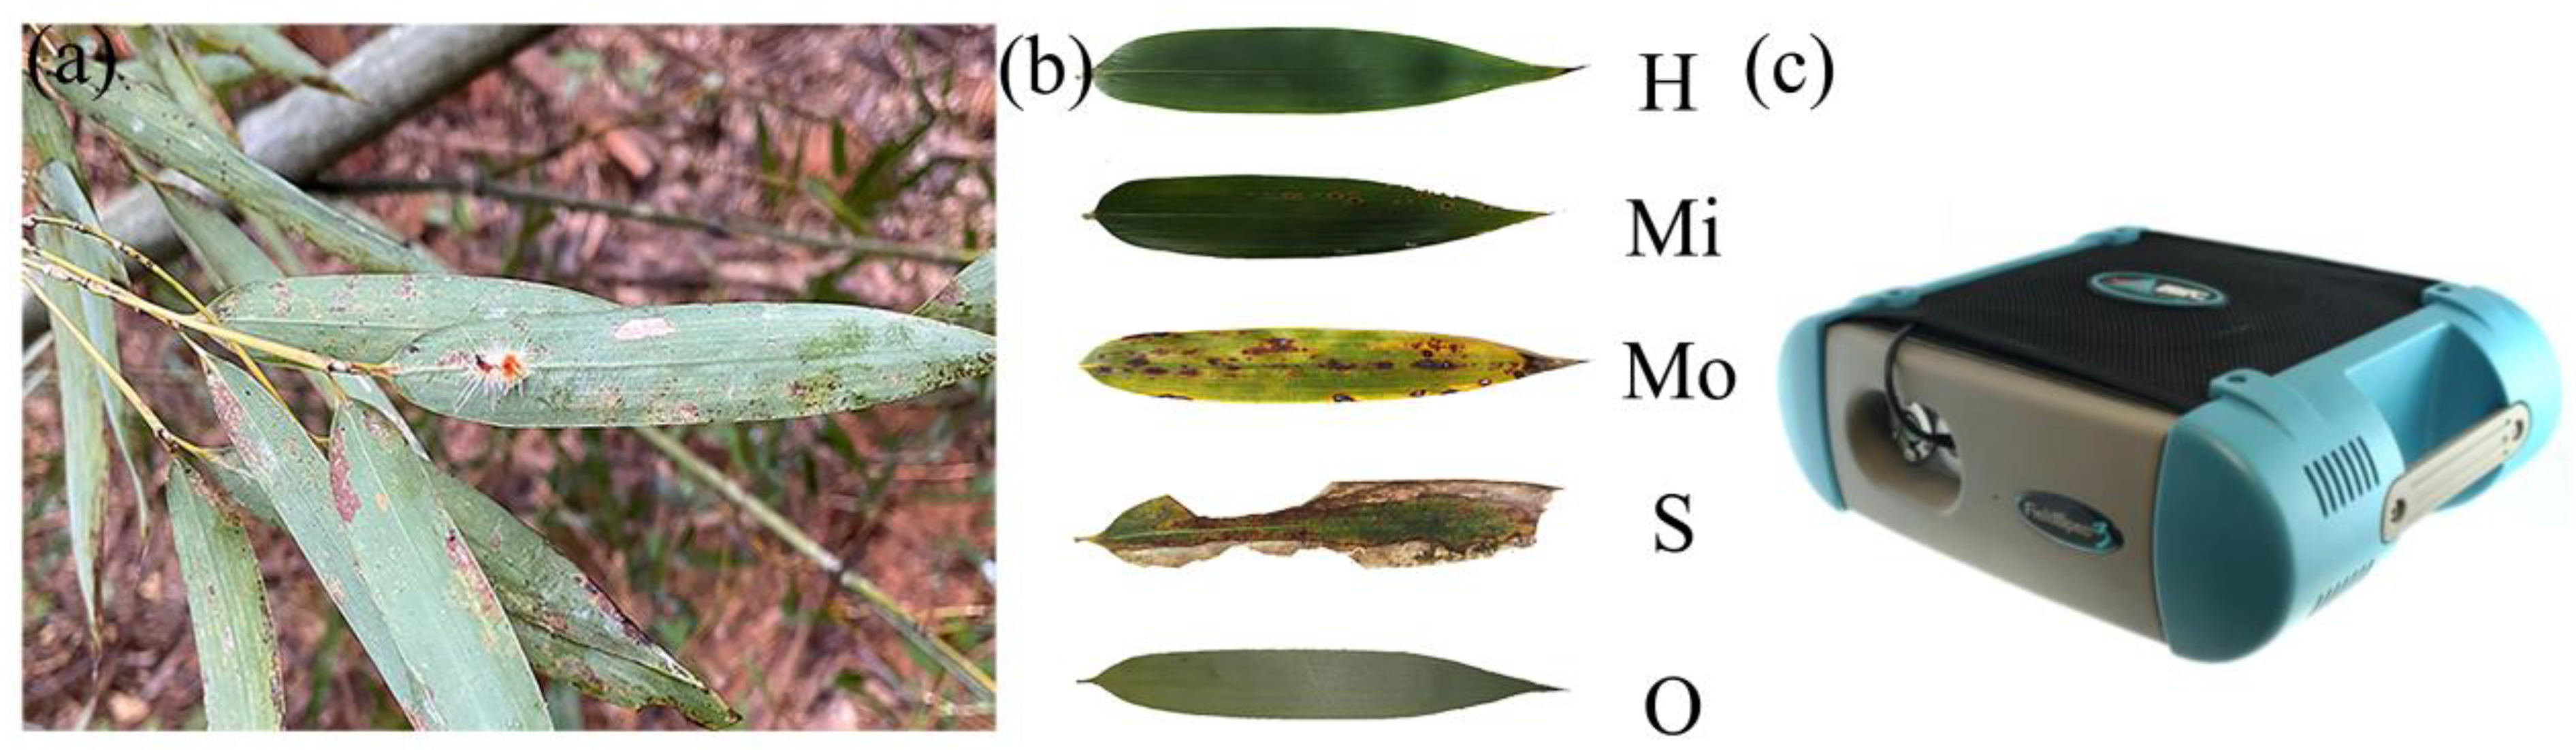
2.2. Sample Collection

Healthy and damaged leaves were randomly selected from Moso bamboo canopies at different altitudes on 20 August 2019 (Figure 2a,b). The degree of Moso bamboo leaf damage was classified according to the leaf damage rate as described by LY/T2011 (2012): 0% to 5% = Healthy (H), 5% to 25% = Mildly damaged (Mi), 25% to 50% = Moderately damaged (Mo), and ≥50% = Severely damaged (S). Moso bamboo produces a large number of shoots and long bamboo annually, and an annual whip for leaf replacement the following year. This phenomenon is known as Moso bamboo on- and off-years, and there are significant differences in the biochemical parameters of Moso bamboo leaves between on- and off-years. The N, P, and K contents of Moso bamboo leaves in on-years are significantly higher than those in off-years (O) [33]. To avoid the effects of off-years of Moso bamboo, the off-year Moso bamboo leaves were grouped separately. The off-year Moso bamboo leaves were predominantly in a healthy condition. A total of 169 Moso bamboo leaf samples were collected. The numbers of leaves of each hazard class were H: 37, Mi: 29, Mo: 35, S: 28, and O: 40.

2.3. Determination of Leaf Spectra and Nitrogen Content

Leaf spectra were obtained by coupling the ASD FieldSpec3 spectrometer (Figure 2c) with the ASD Plant Spectrum Probe (Analytical Spectral Devices, Longmont, CO, USA) in the field immediately after they were removed. The spectrometer has 2151 bands, which are essential to detecting spectral information over the full range of the solar irradiation spectrum (350–2500 nm) with sampling intervals of 1.4 nm (350–1000 nm) and 2 nm (1001–2500 nm), and 1 nm after resampling. Dark current correction was applied before each measurement. For each leaf the spectral reflectance was obtained from the mean value of the results of five leaf scans. Different parts of the leaf (tip, veins, lamina) and damaged parts were considered when selecting the scanning area. The Savitzky-Golay smoothing algorithm with a polynomial order of 3 and a window width of 11 was used to preprocess all raw spectral data to reduce effects from particle size, scattering, and covariance [34].
After the leaf spectra were measured, leaves were put into sealed bags and temporarily stored in liquid nitrogen tanks. After being returned to the laboratory, leaves were dried in a drying oven at 105 °C for 30 min and then dried to a constant weight at 80 °C. The dried leaves were put into centrifuge tubes and ground into powder using a DHS v4800 grinder, while a Vario MICRO cube elemental analyzer (Elementar, Langenselbold, Hessen, Germany) was used to determine the nitrogen content of each leaf.

2.4. Spectral Data Processing

Original spectrum (OS) data have low sensitivity to the parameters of biochemical components of vegetation, the detection of which requires further processing of the spectral data. Continuum removal (CR) is a spectral analysis method that is crucial to effectively improve the absorption and reflection characteristics of the spectral profile [35,36]. The formulae for calculation are as follows:
K = ( R e R s ) / ( λ e λ s )
C R j = R j / ( R s + K × ( λ j λ s ) )
where Re and Rs are the original spectral reflectances of the start and end points, respectively. λe and λs are the wavelengths of the start and end points, respectively; K is the slope between the start and end point bands. λj is the central wavelength of the j band. Rj is the original spectral reflectance of band j, and CRj is the envelope removal value of band j. Derivative processing of spectral data eliminates baseline drift, moderates the effects of background interference, and amplifies subtle changes in the spectral profile. This means that it provides a higher-resolution and higher-definition spectral profile than the OS [37]. First derivative spectra provide a better representation of the rate of change and extreme value points of the raw spectral data and are calculated as follows:
F D R λ i = ( R λ i + 1 R λ i ) / Δ λ
where FDRλi is the first derivative spectral value between band i and band i + 1. λi is the wavelength value of band i. Rλi+1 and Rλi represent the original spectral reflectance at bands λi+1 and λi, respectively, and Δ λ represents the wavelength difference between bands λi+1 to λi.

2.5. Relationship Model Construction
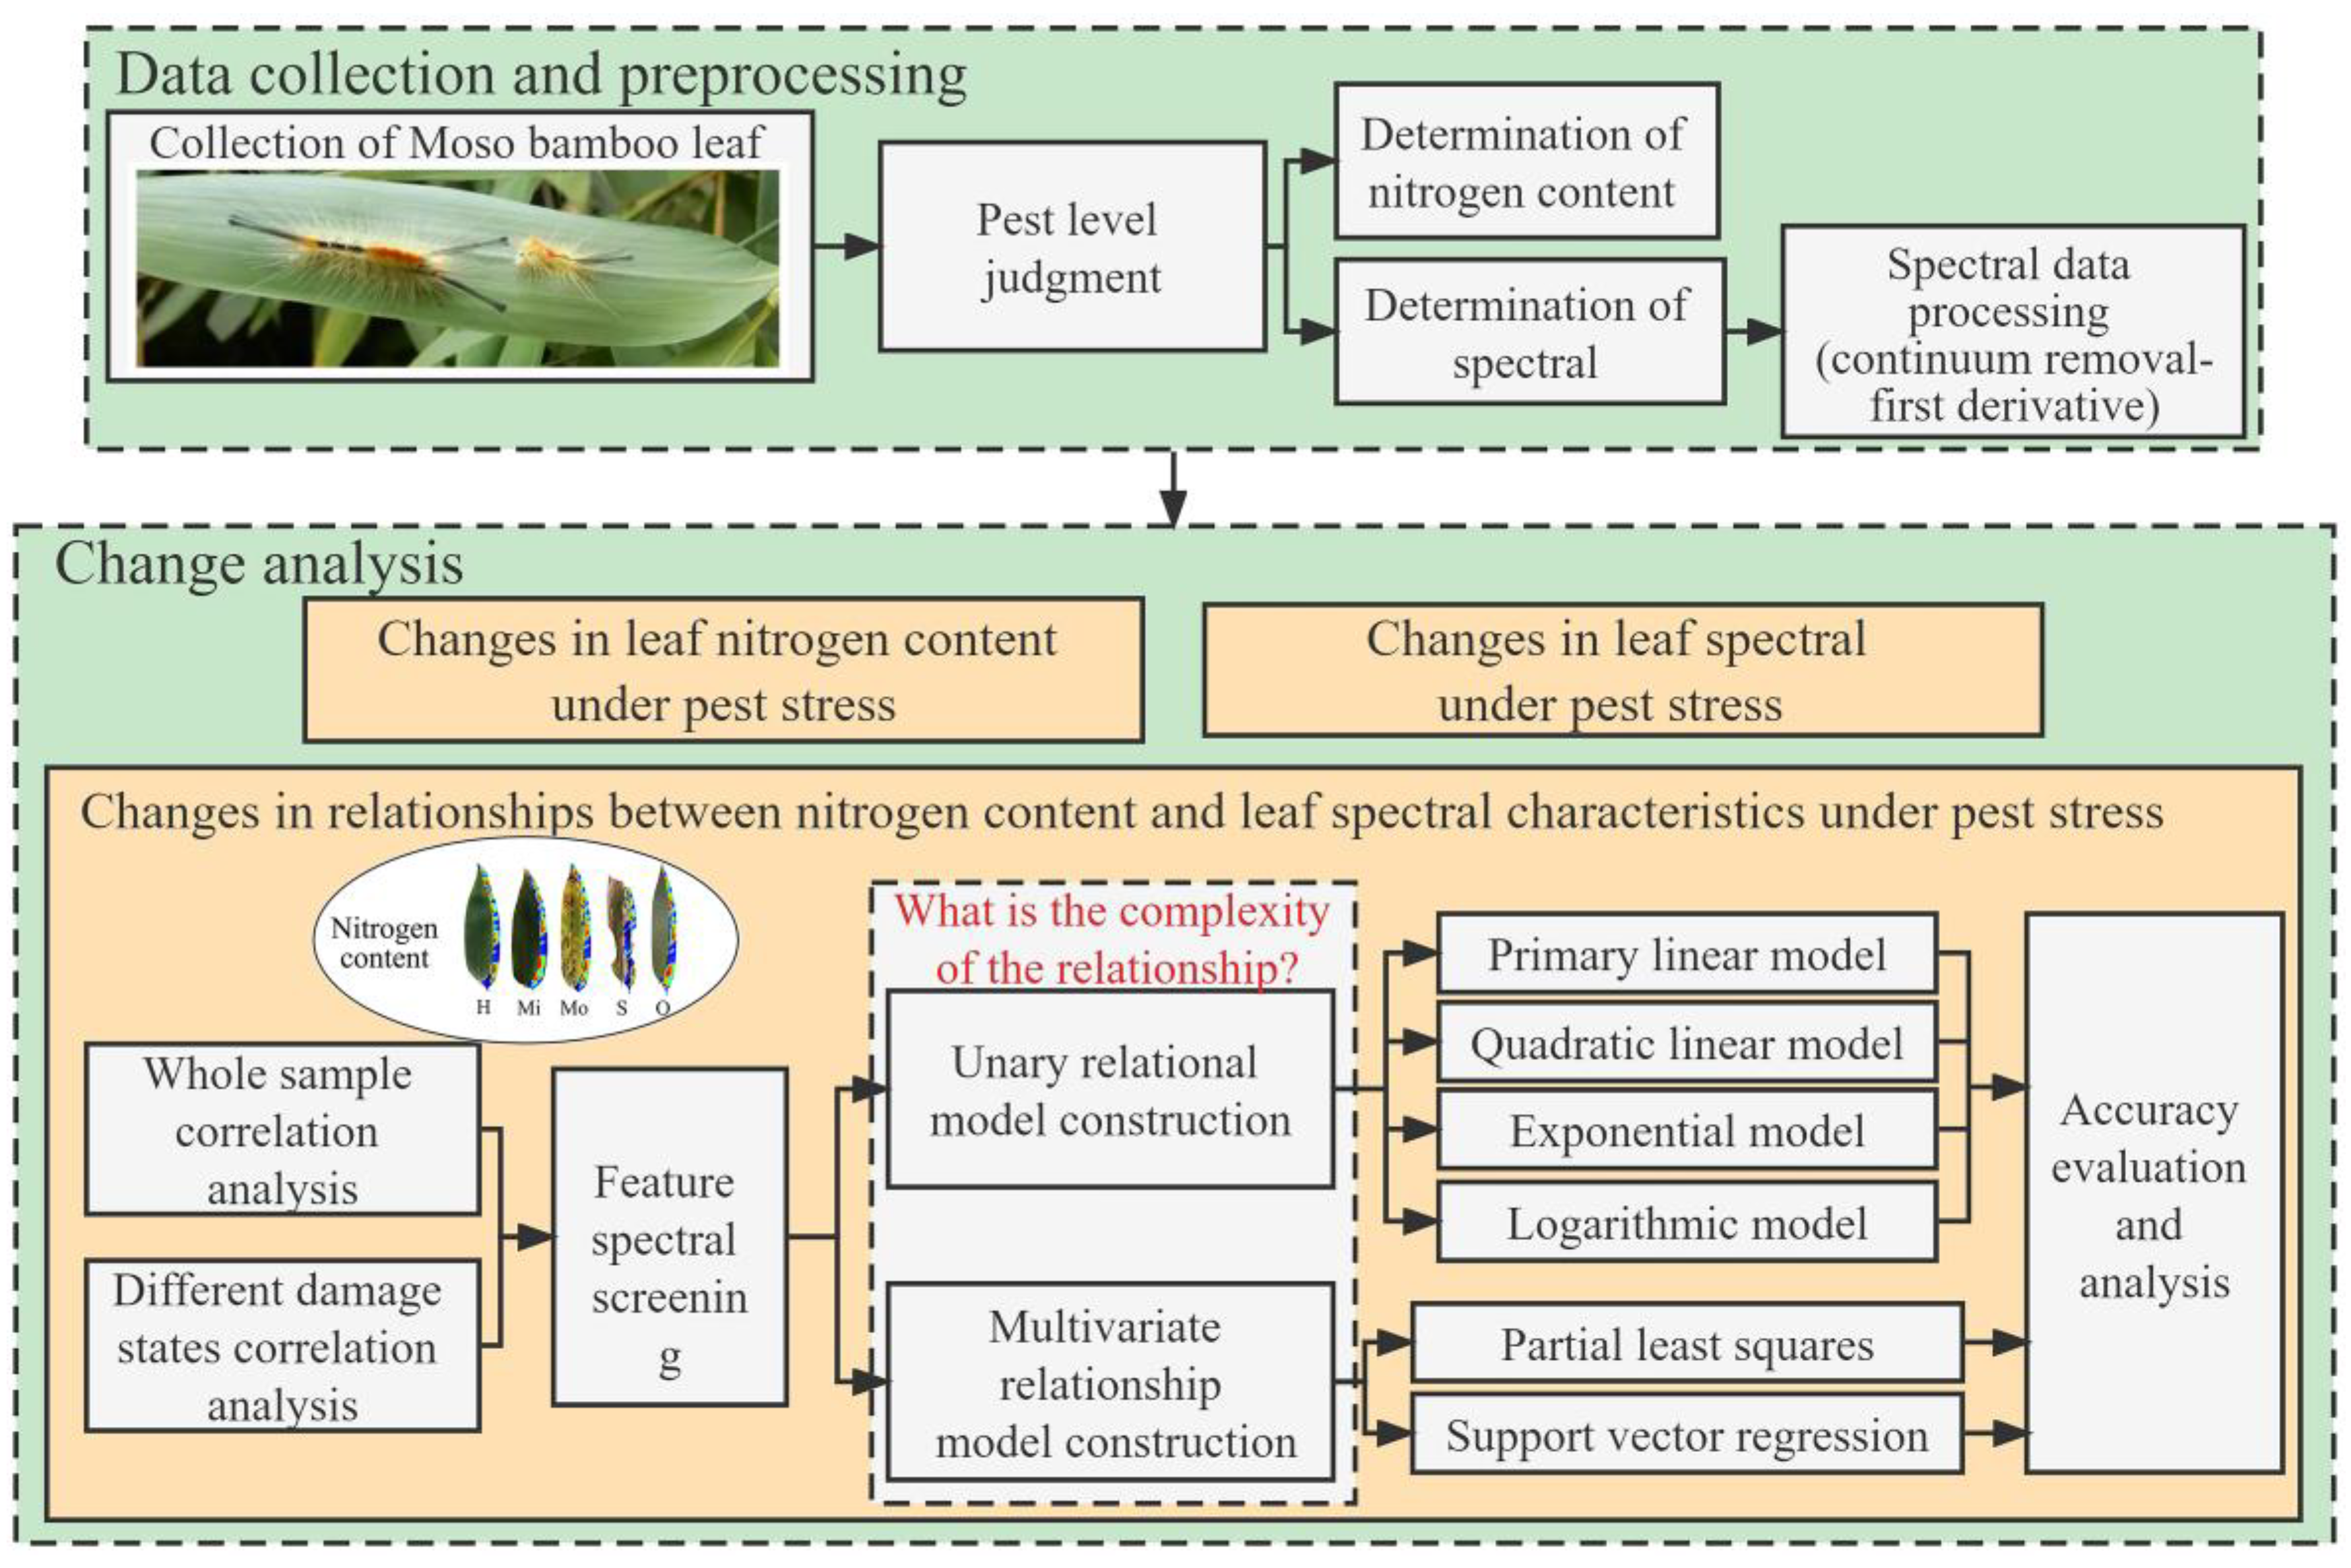
Partial least squares (PLS) provides a method of many-to-many linear regression modeling. It differs from ordinary least squares regression by employing data dimensionality reduction, information synthesis, and screening techniques in the regression modeling process [38,39]. For analyses involving many variables with multiple correlations and a small number of observations, models built with PLS regression offer advantages that are not offered by traditional methods such as classical regression analysis. The main parameter to be adjusted in the PLS model is n-components.
Support vector regression (SVR) is a nonparametric modeling technique for pattern recognition and classification that does not require a priori assumptions about the distribution of the data and ensures maximum generalizability of the model from the perspective of structural risk minimization [40]. It allows nonlinear regression modeling by adjusting the kernel function and has many advantages for pattern recognition in small sample datasets. Both PLS and SVR models were implemented using the scikit-learn packages in Python and the parameters were tuned using five-fold cross-validation [41].
The pattern of change in the relationship between Moso bamboo leaf nitrogen content and the spectra of leaves under different damage conditions is complex. Correlations between the nitrogen content and spectral reflectance data processed by continuum removal-first derivative (CR-FD) were determined. Wavelengths with high correlations were screened and labeled as the characteristic spectra. The relationships between the nitrogen content and the characteristic spectra were constructed using multiple regression models, and patterns in the relationships under different degrees of damage to the leaves were analyzed. The PLS and SVR methods model linear and nonlinear relationships, respectively, and results indicate the complexity of the relationship between the nitrogen content and leaf spectra. The model was constructed using 70% of the data as training samples and 30% of the data as test samples. Models were evaluated using the regression model evaluation index coefficient (R2) and root mean square error (RMSE). If the PLS model is better, it means that the relationship between the nitrogen content and leaf spectra is relatively simple, while if the SVR model is better, it means that the relationship is in a relatively complex state.

2.6. Study Workflow

The workflow for this study (Figure 3) included the collection and processing of data and an analysis of changes in the relationship between the nitrogen content and leaf spectra under PPC stress.

3. Results

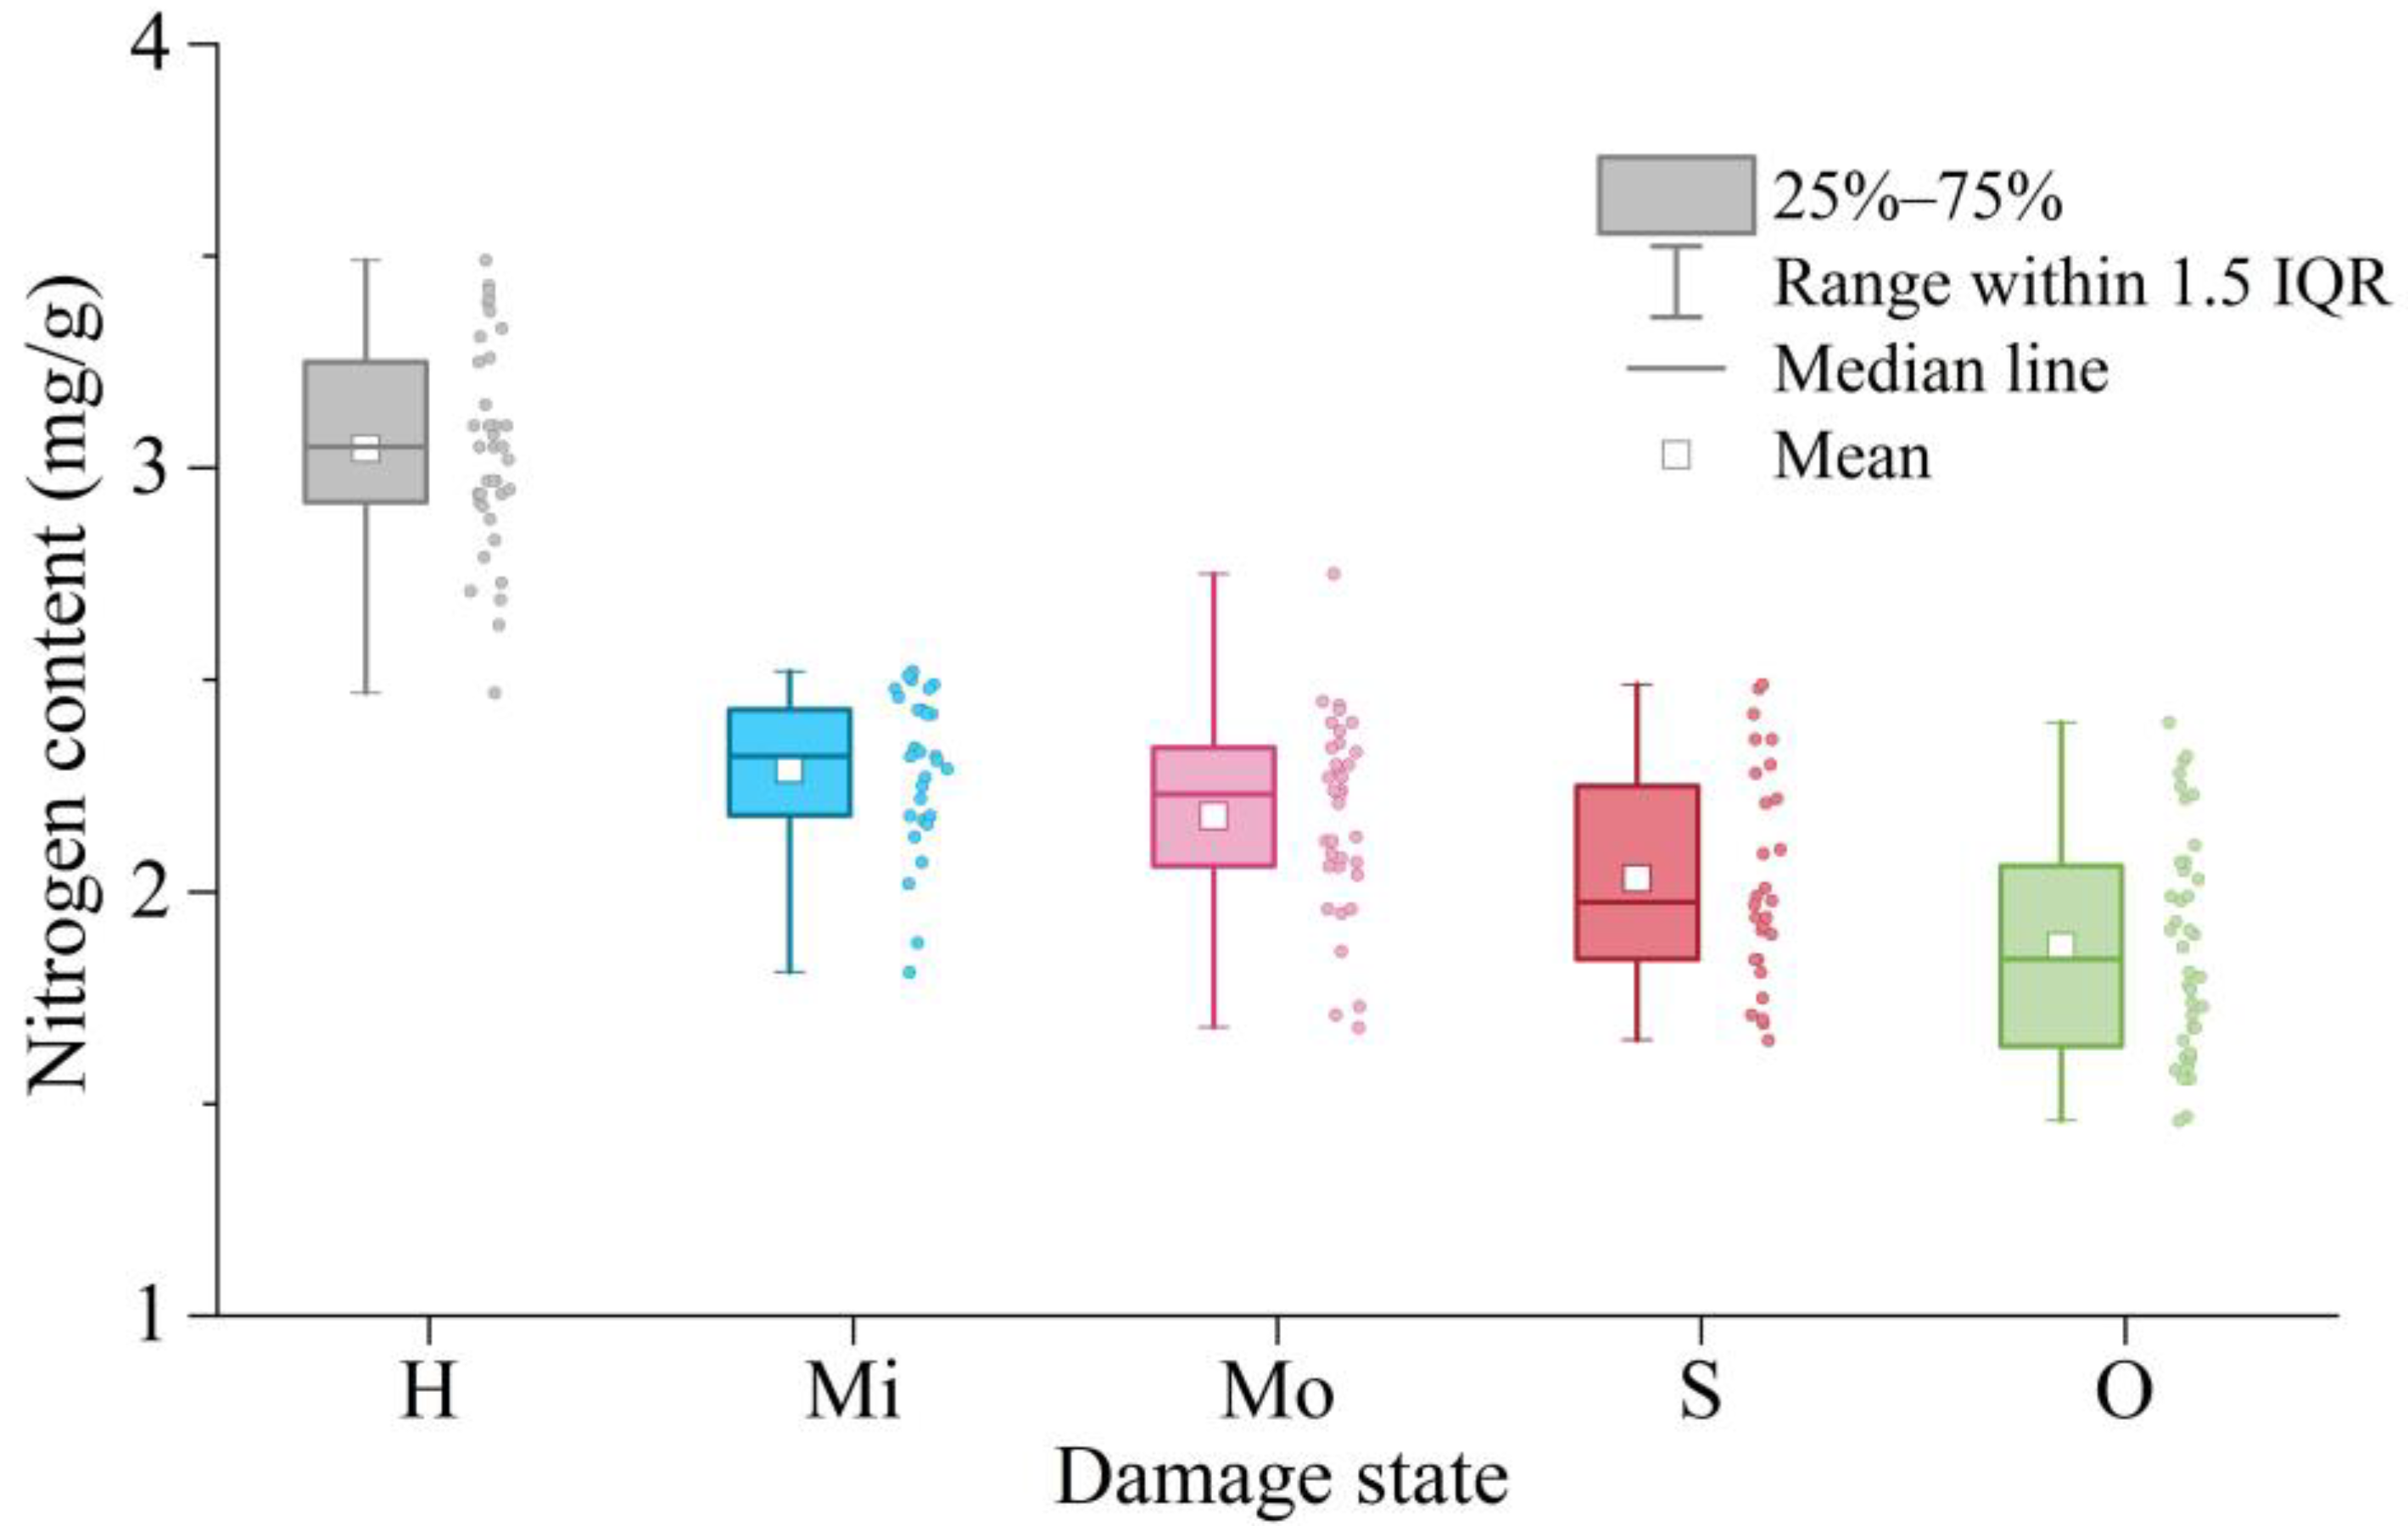
3.1. Analysis of Changes in Nitrogen Content

The nitrogen content of Moso bamboo leaves with the same damage exhibited a wide range of values, and the damage level could not be effectively distinguished by the nitrogen content (Figure 4). The nitrogen content gradually decreased with the increasing damage. The decrease was most pronounced in leaves in the H to Mi state, which provides a reference for the early monitoring of insect pests. The nitrogen content of off-year leaves was much lower than that of on-year leaves. After being eaten by pests, the cell structure of Moso bamboo leaves was damaged and a large number of nutrients were lost, which led to a gradual decrease in the overall nitrogen content of the leaves with increasing pest damage.

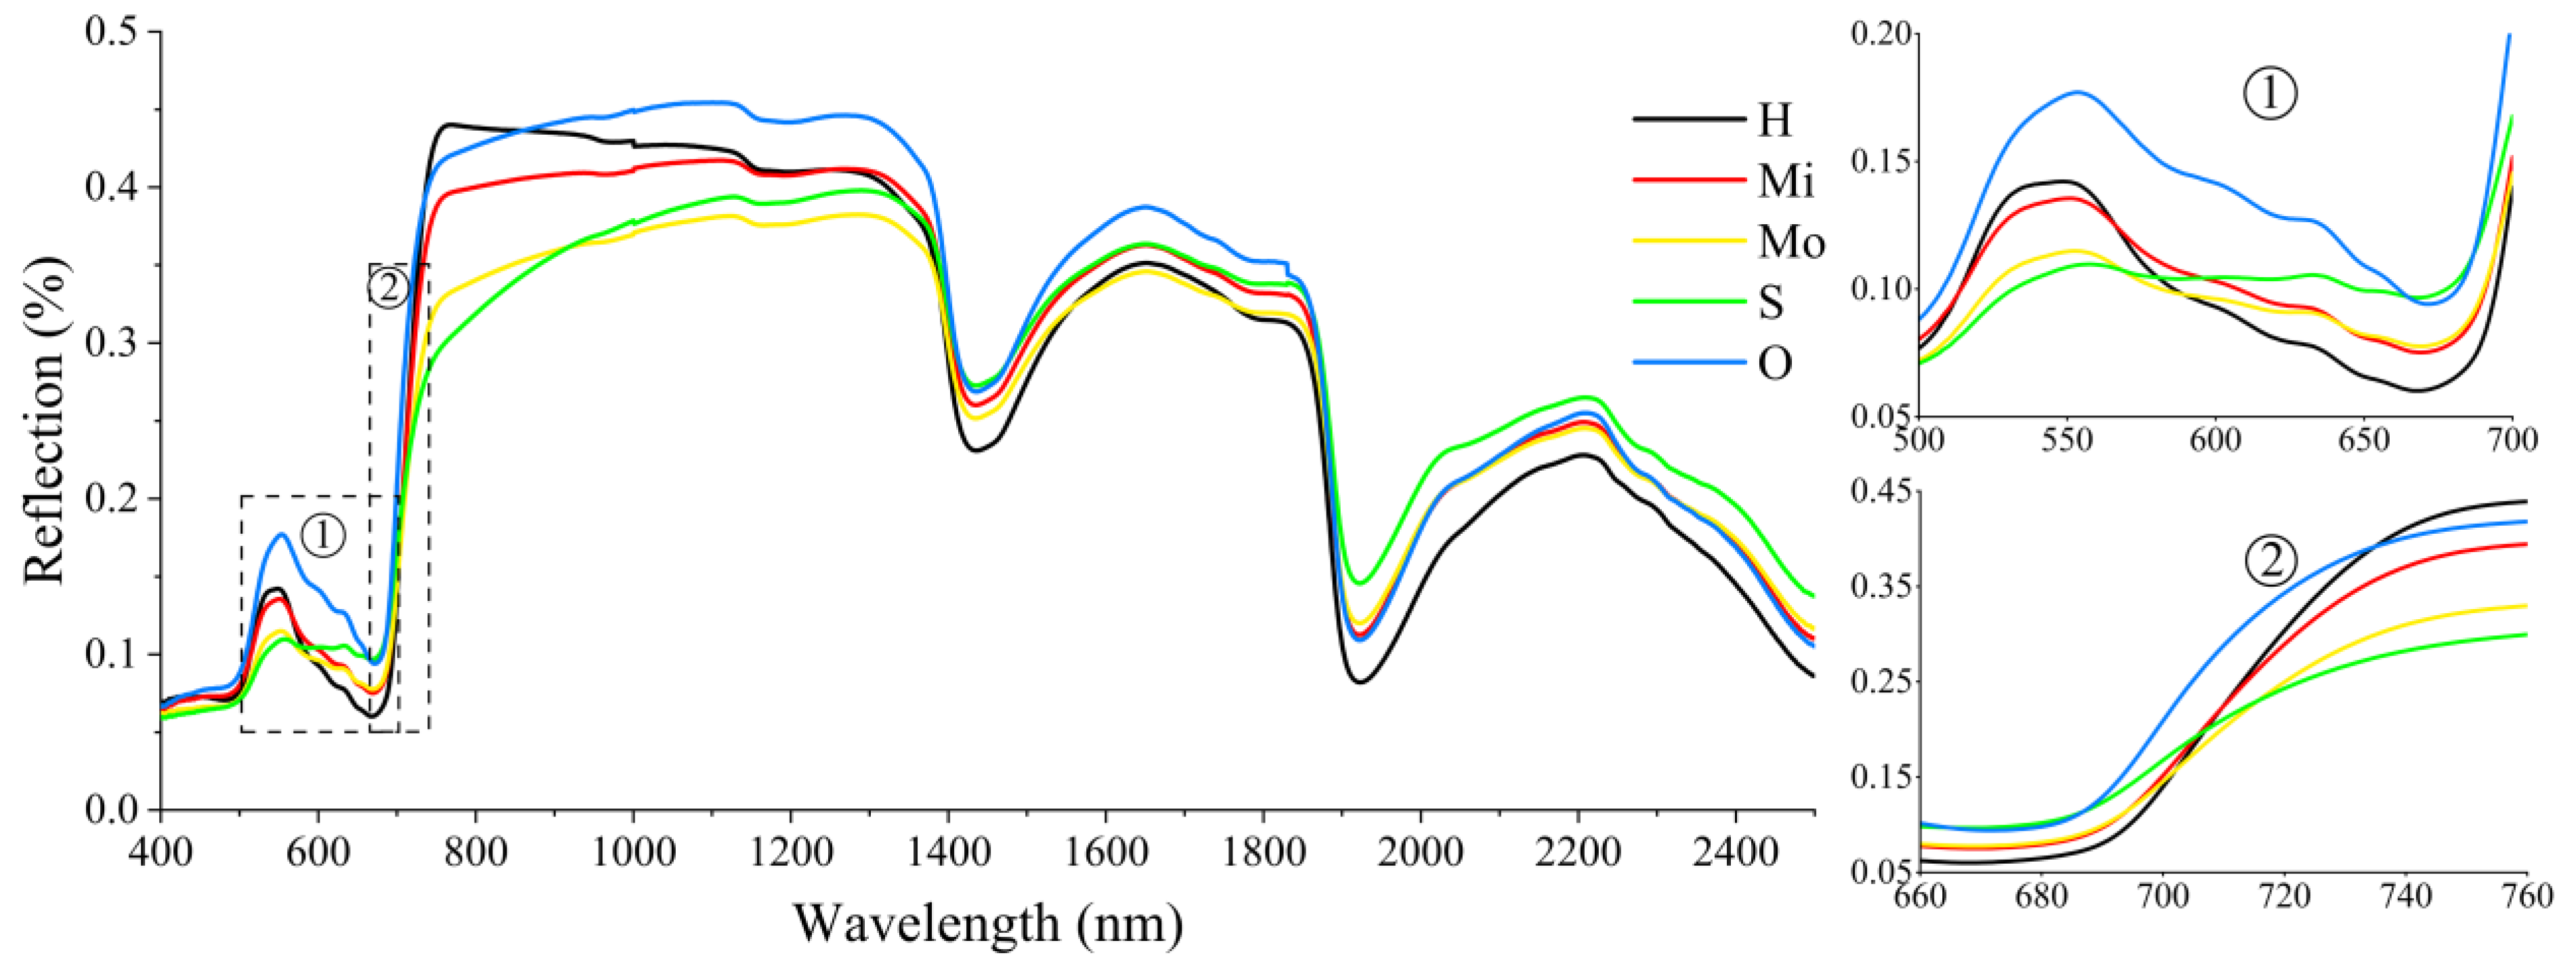
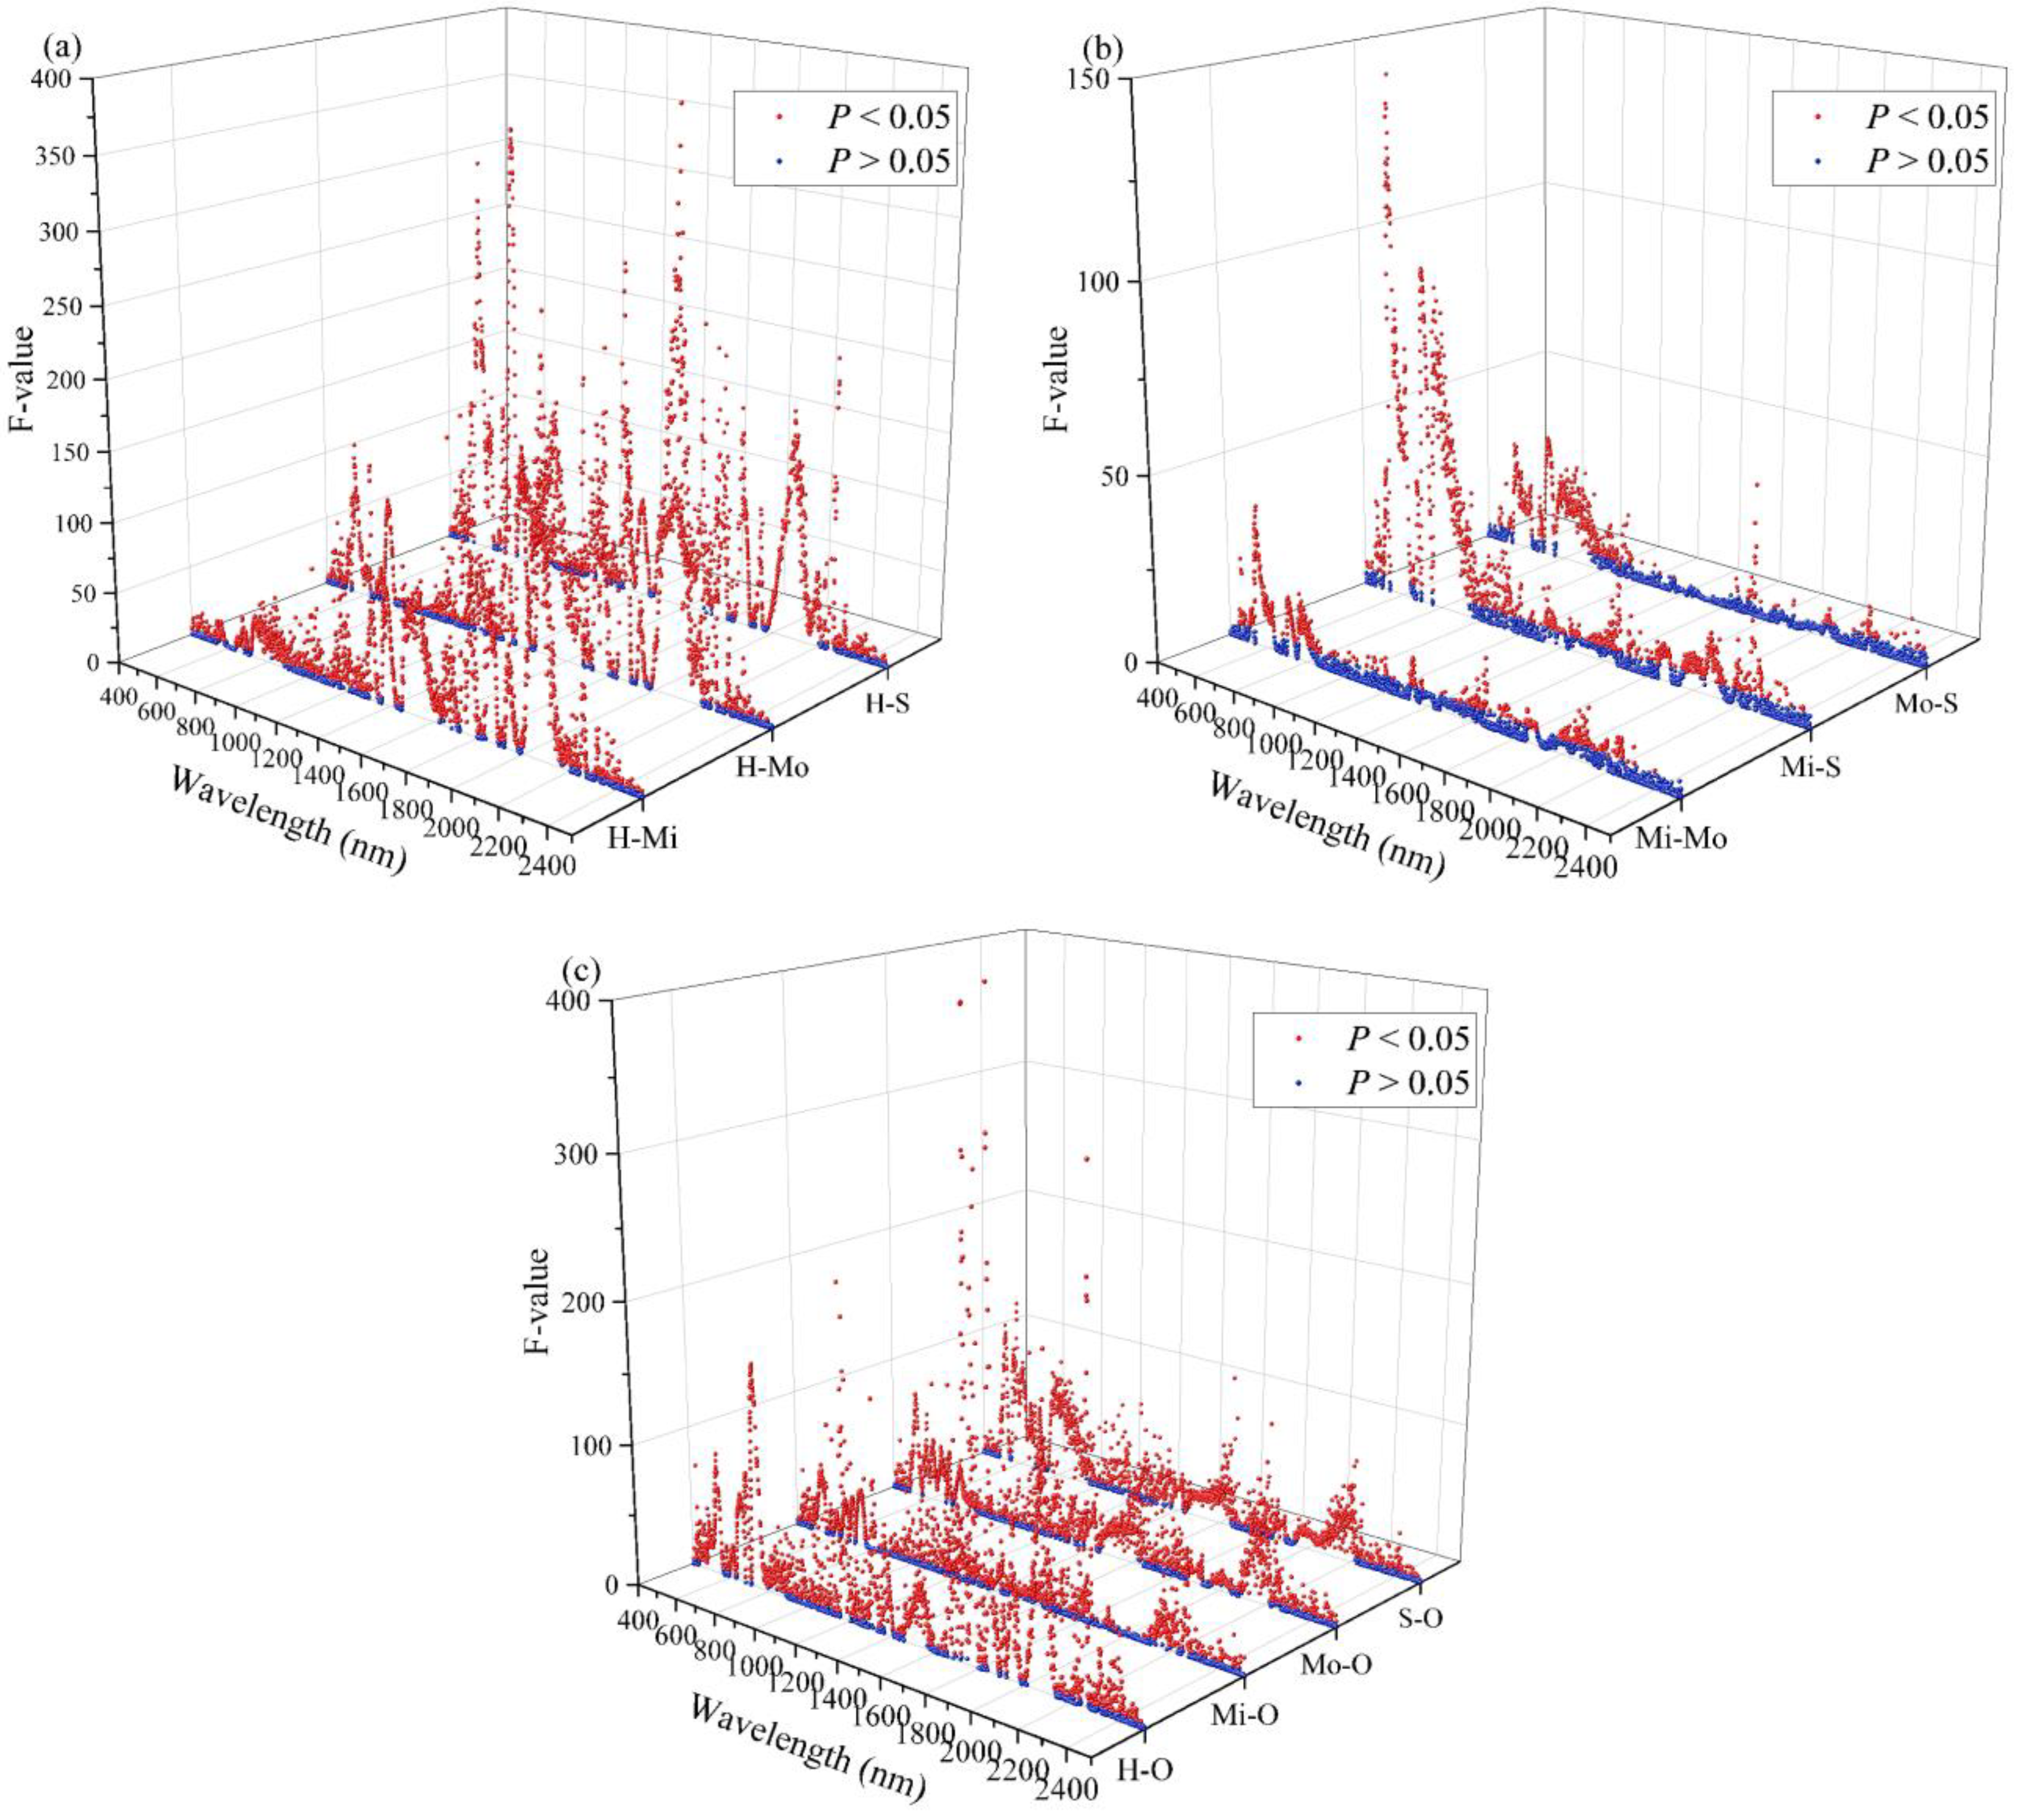
3.2. Analysis of Variation in Leaf Spectral Characteristics

The spectra of Moso bamboo leaf have characteristics of evident undulating changes, and the overall spectral characteristics are similar to those of other green plant leaves. Under PPC stress, Moso bamboo leaves lost their green color and experienced water deficiency and other diseases, resulting in pronounced changes in the spectral reflectance curve (Figure 5). (1) The healthy leaf spectral reflectance curve between 490 and 600 nm had a wave-shaped peak, called the “green peak”, which was the green strong-reflectance area corresponding to chlorophyll. (2) The healthy leaf spectral reflectance curve between 600 and 700 nm had the form of a trough, called the “red valley”, where 610–660 nm was the main absorption band for phycocyanin, and 650–700 nm was the strong absorption band for chlorophyll. (3) The “green peak” and “red valley” gradually disappeared as the degree of pest damage increased, and the slope of the spectral curve in the red-edge range (670–760 nm) gradually decreased. (4) The spectral reflectance curves of off-year Moso bamboo leaves were the same as those of on-year Moso bamboo leaves, except that the overall spectral reflectance of off-year leaves was slightly higher than that of on-year leaves.

3.3. Model Construction and Change Analysis

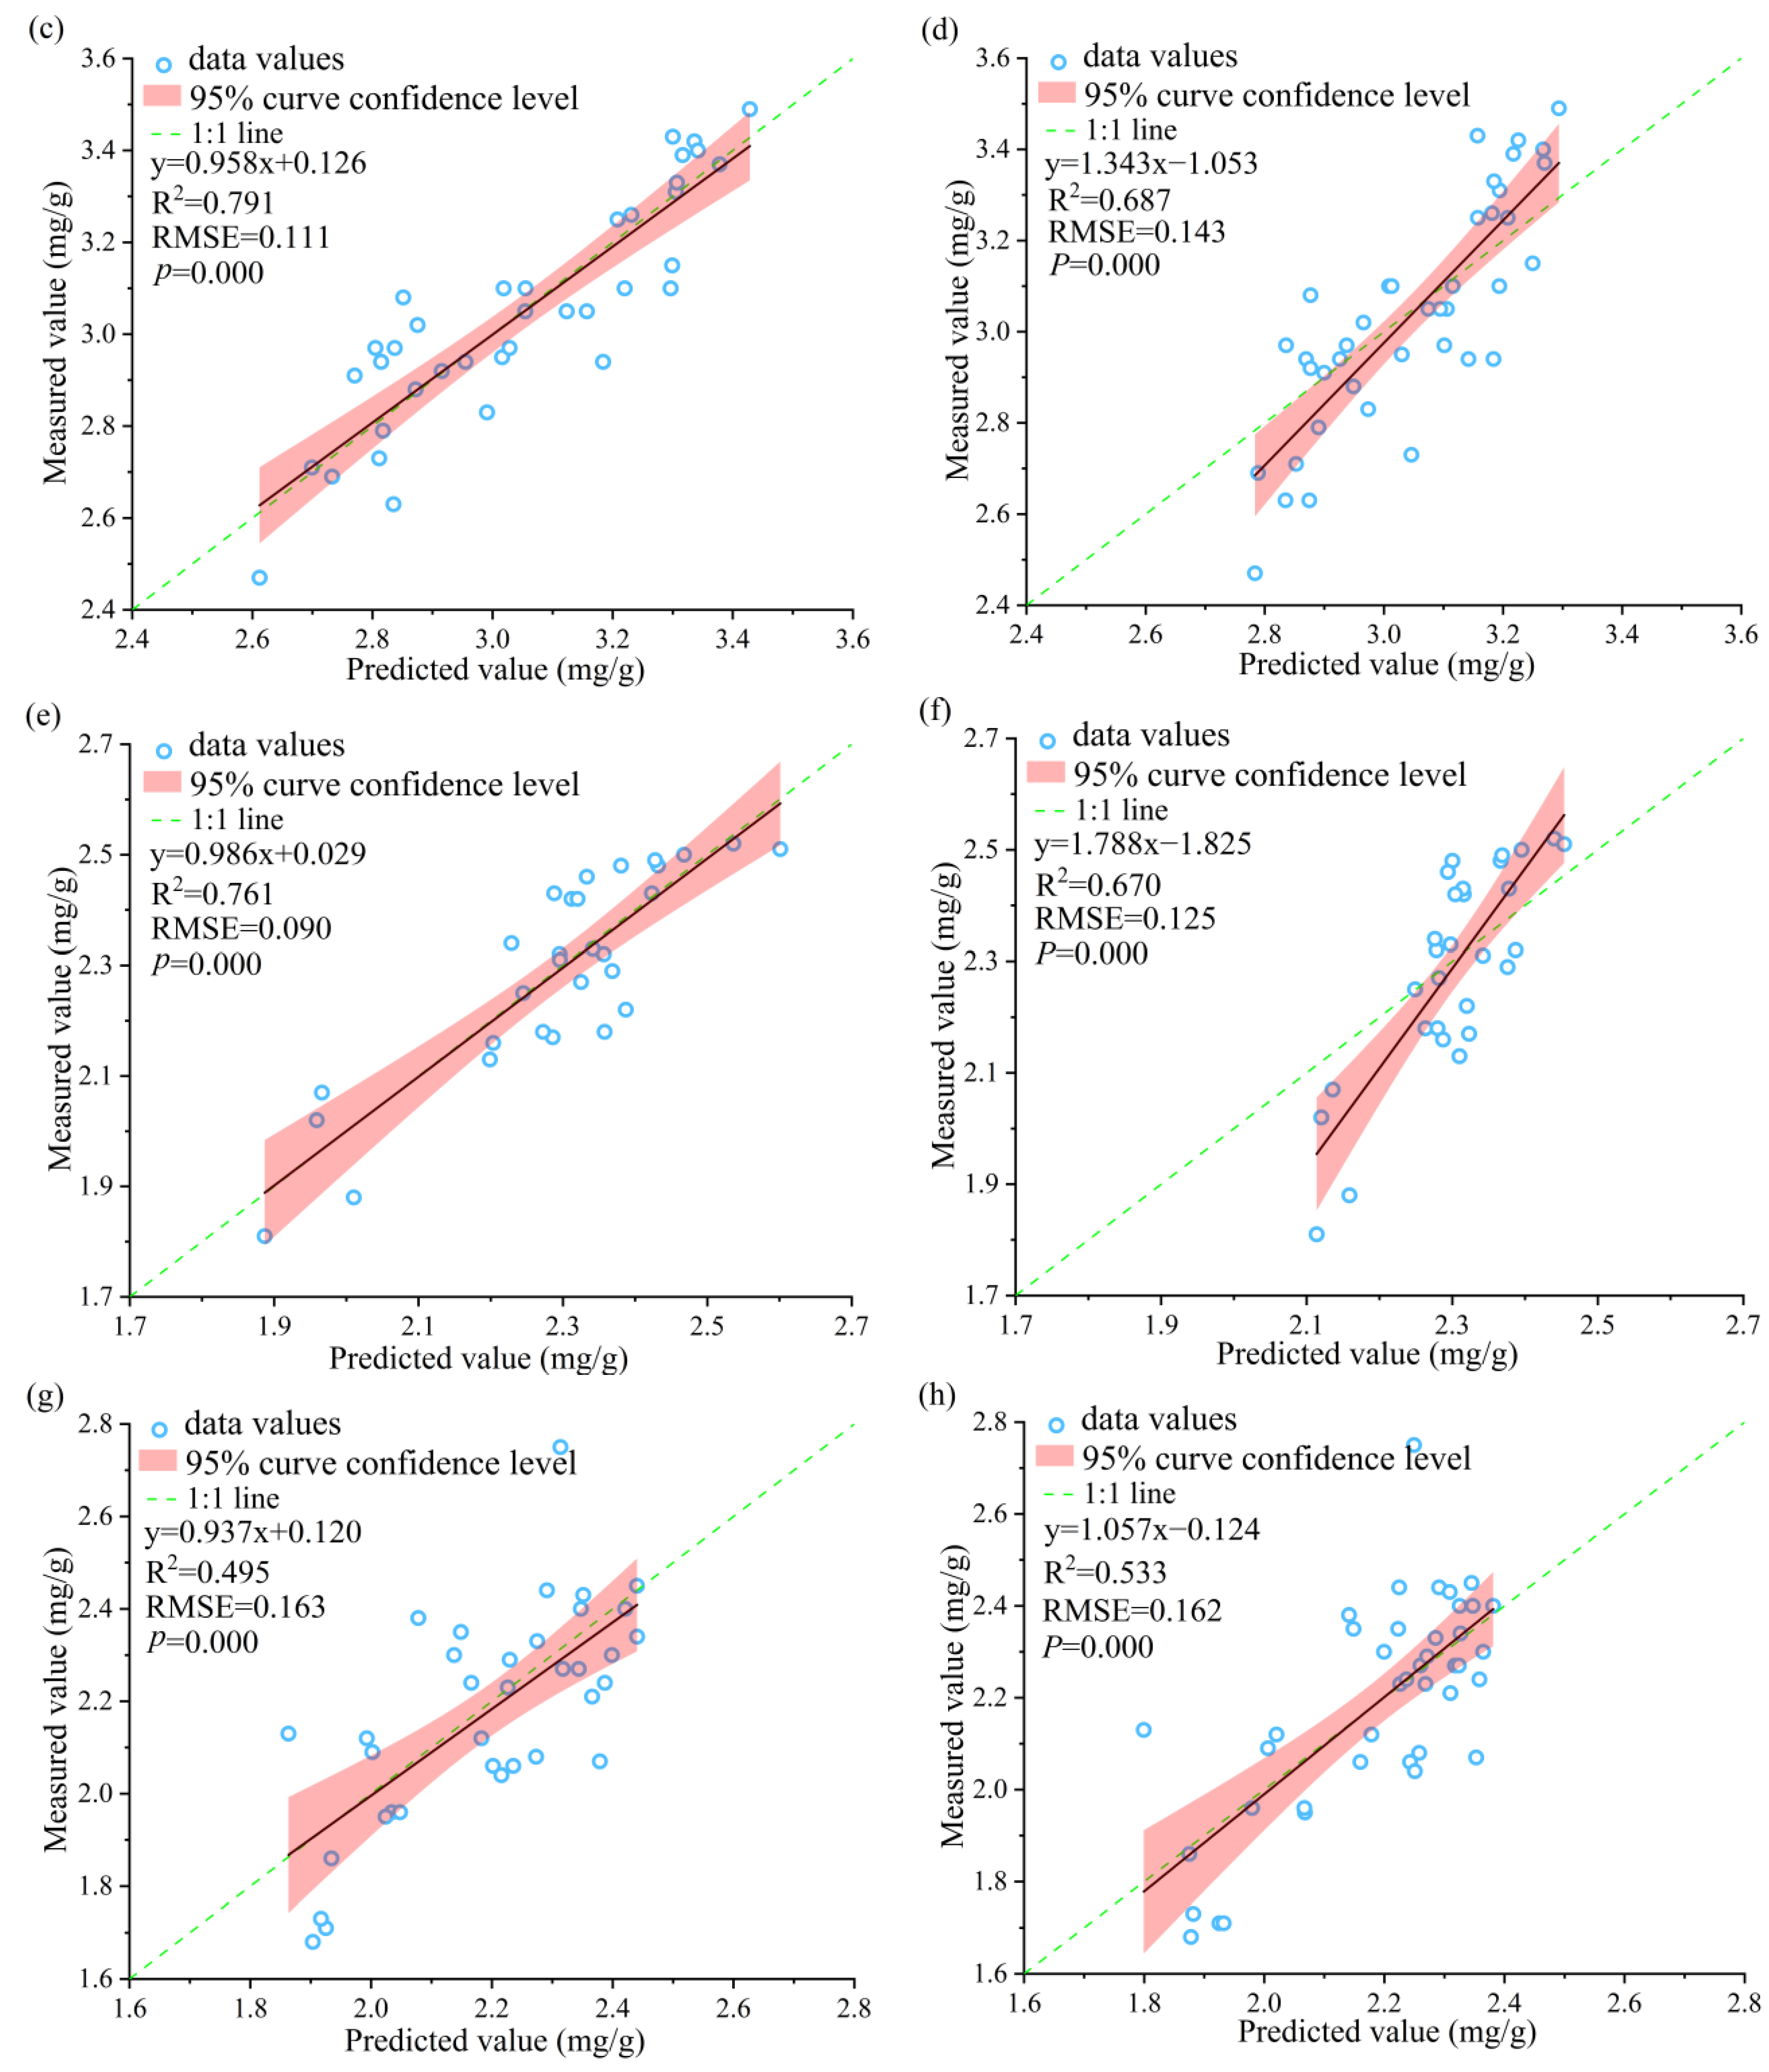
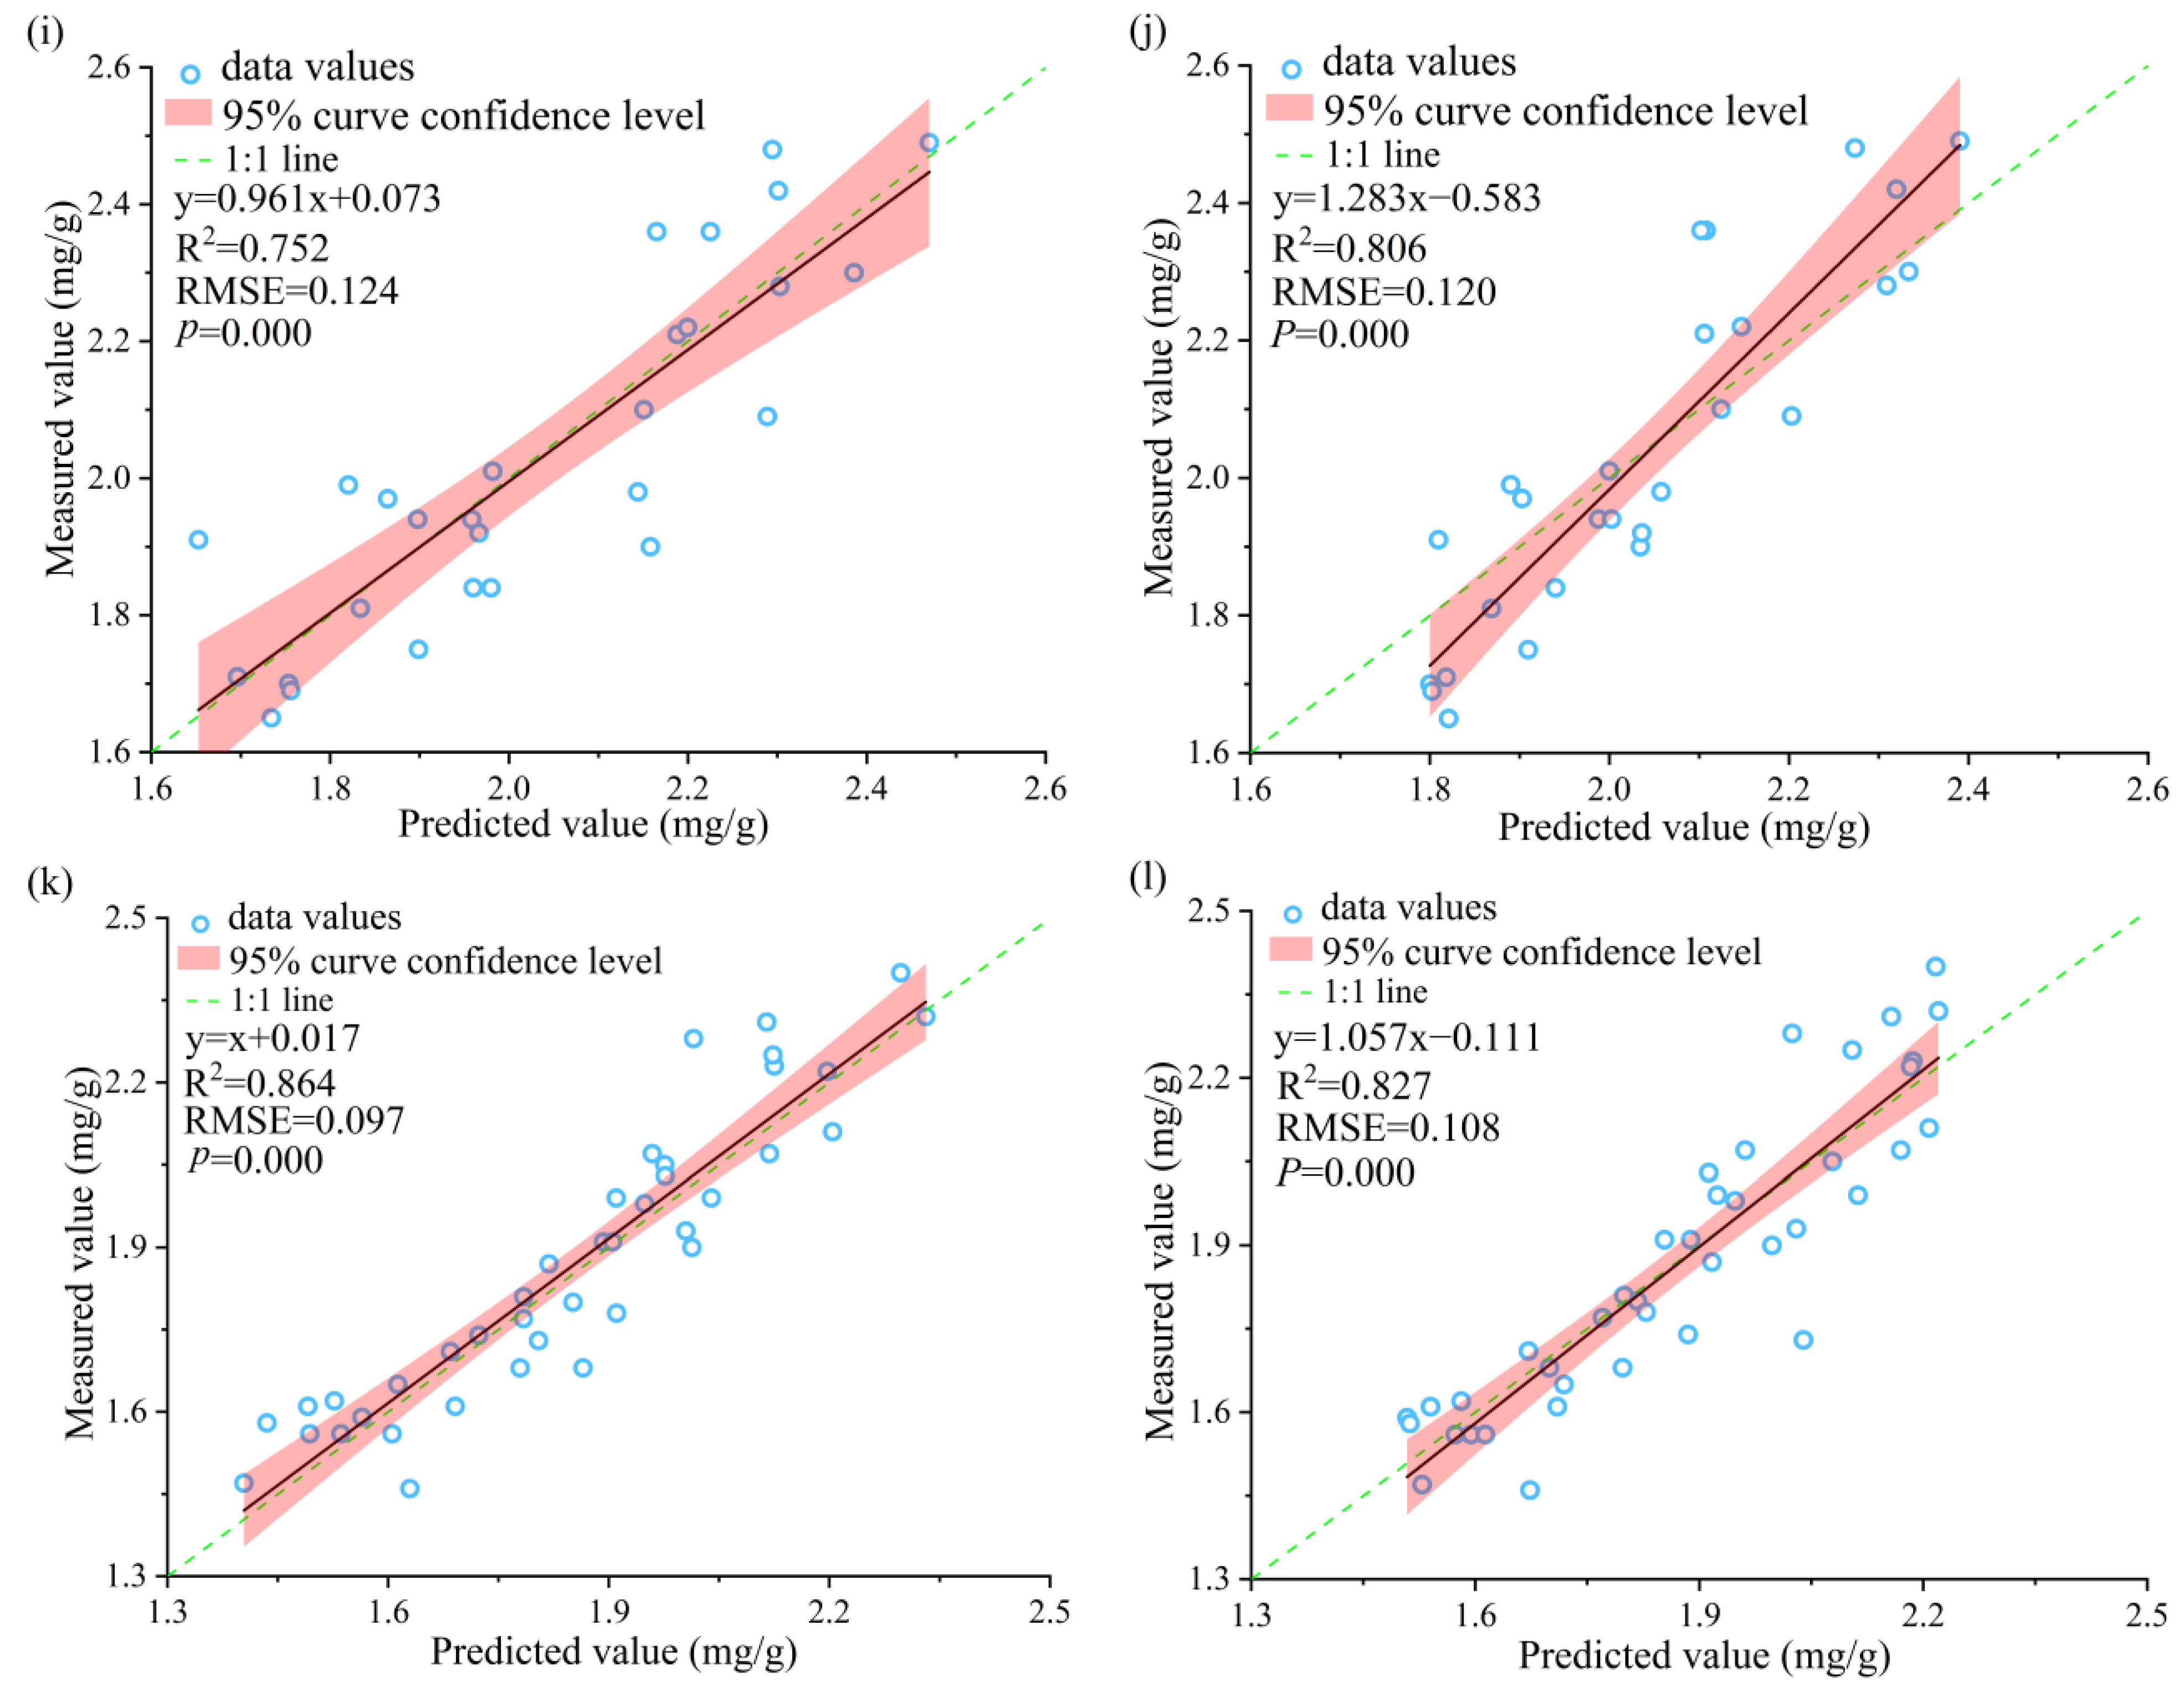
3.3.1. Model Construction and Analysis of Whole Leaf Sample

Analyses of the correlation between the nitrogen content and spectral data of Moso bamboo leaves after OS, CR, and CR-FD treatments are shown in Figure 6. CR and CR-FD treatments significantly improved the correlation between the spectral information and nitrogen content. The regions with a higher correlation were around 540, 687, 740, 1690, 1733, 1784, 1840, 2071, and 2251 nm. The red-edge regions (680–760 nm) had a higher correlation, and comparative analysis revealed that most of the high correlation regions were sensitive ranges for chlorophyll and protein [42,43]. The highest correlation was located at 740 nm with a correlation coefficient of 0.823 (p < 0.01).

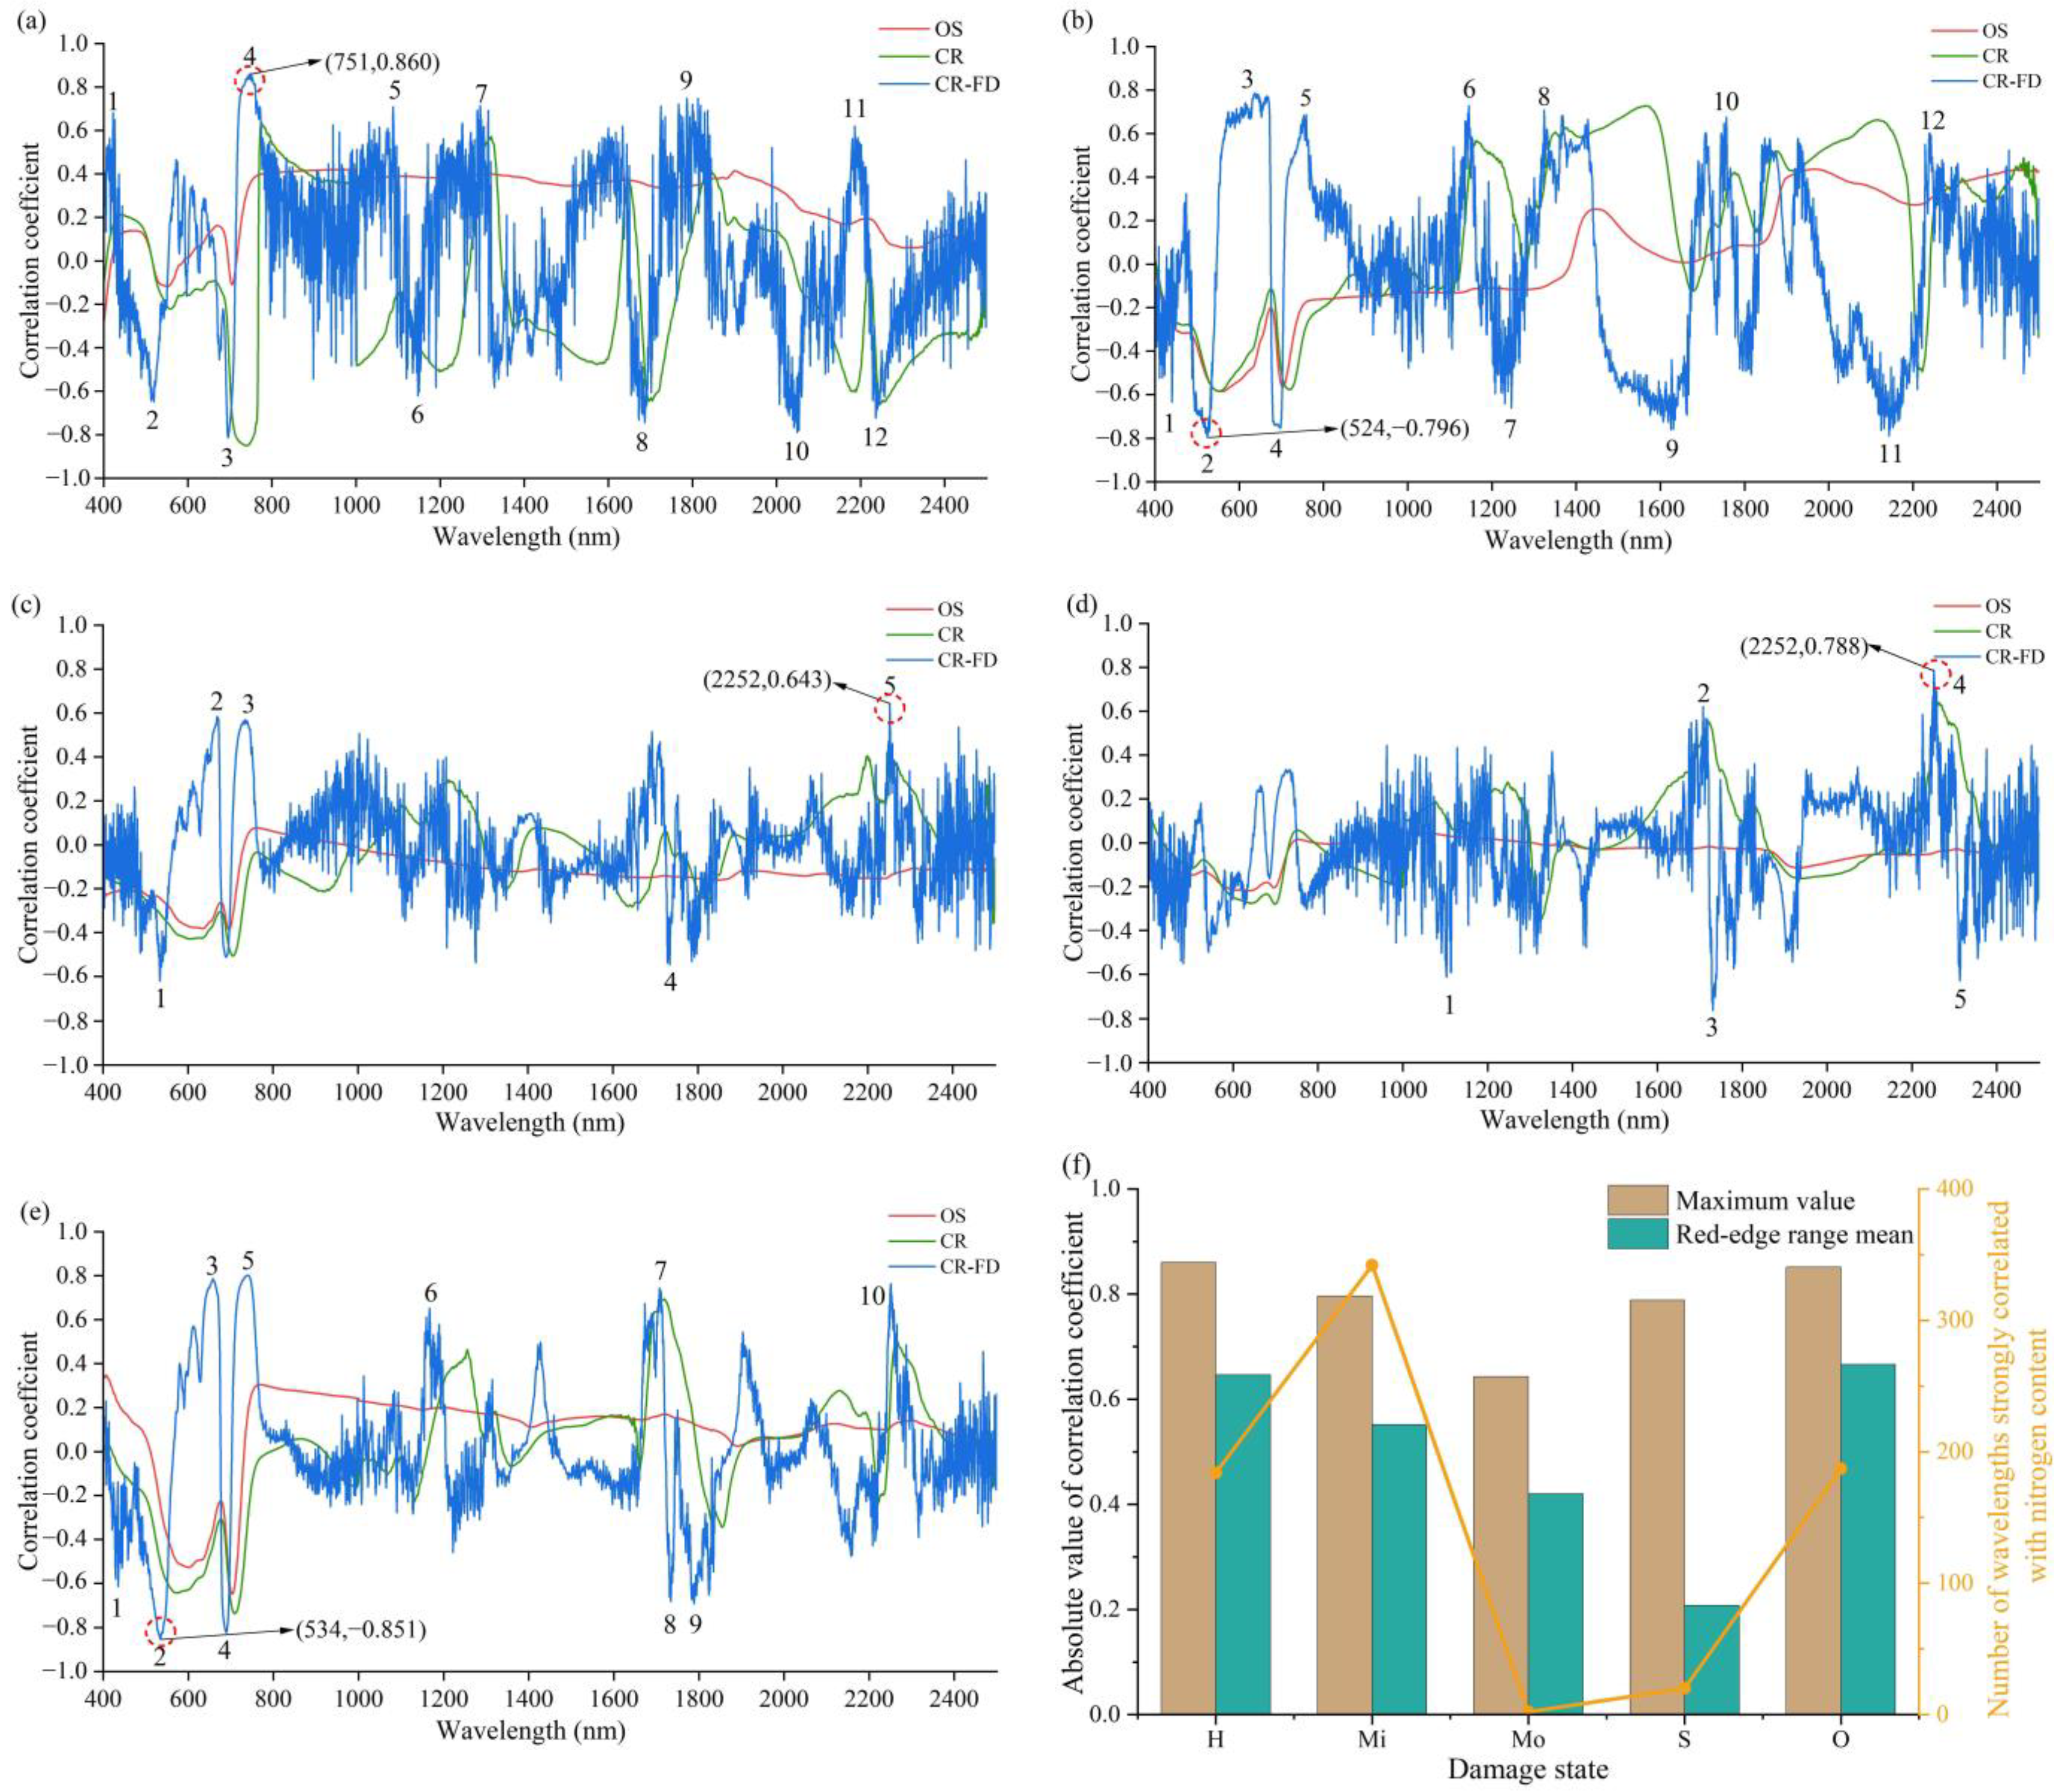
3.3.2. Model Construction and Analysis for Leaves in Different Damage States

To investigate variation in the pattern of the relationship between the spectral information and nitrogen content of Moso bamboo leaves in different damage states, leaves were divided into different damage classes and off-year groups, and correlations of their spectral information with the nitrogen content were assessed (Figure 7). Wavelengths with the highest correlation between the nitrogen content and leaf spectral data of Moso bamboo leaves in different damage states were H: 751 nm, Mi: 524 nm, Mo: 2252 nm, S: 2252 nm, and O: 534 nm, and their correlation coefficients were H: 0.860, Mi: −0.796, Mo: 0.643, S: 0.788, and O: −0.851. The wavelength region with the strongest correlation between the nitrogen content and spectral information changed significantly as the degree of pest damage increased, and the absolute value of the correlation coefficients tended to decrease and then increase. The mean of the absolute value of the two correlation coefficients in the red-edge range tended to gradually decrease with increasing pest damage. In the 400–2500 nm wavelength range, the number of wavelengths with a strong correlation (absolute value of correlation coefficient > 0.6) with a nitrogen content of Moso bamboo leaves increased and then decreased with increasing pest damage. The number of wavelengths with strong correlations with a nitrogen content of Moso bamboo leaves was the highest for the Mi state, followed by the O and H states. The lowest number was observed for the S and Mo states.
The model was constructed by selecting wavelength spectral reflectance information with the highest absolute value of correlation with the nitrogen content, from the area with high correlations between the nitrogen content and leaf spectral data of Moso bamboo leaves with different damage levels. Table 1 shows the three best one-dimensional models of the relationship between the leaf spectra and the nitrogen content of Moso bamboo leaves in different damage states. The fit of the models shows a general trend of decreasing and then increasing with rising pest damage levels. Estimation of the model in the Mo state was poor, and the estimation model constructed from the 751 nm wavelength spectral information in the H state was the best.

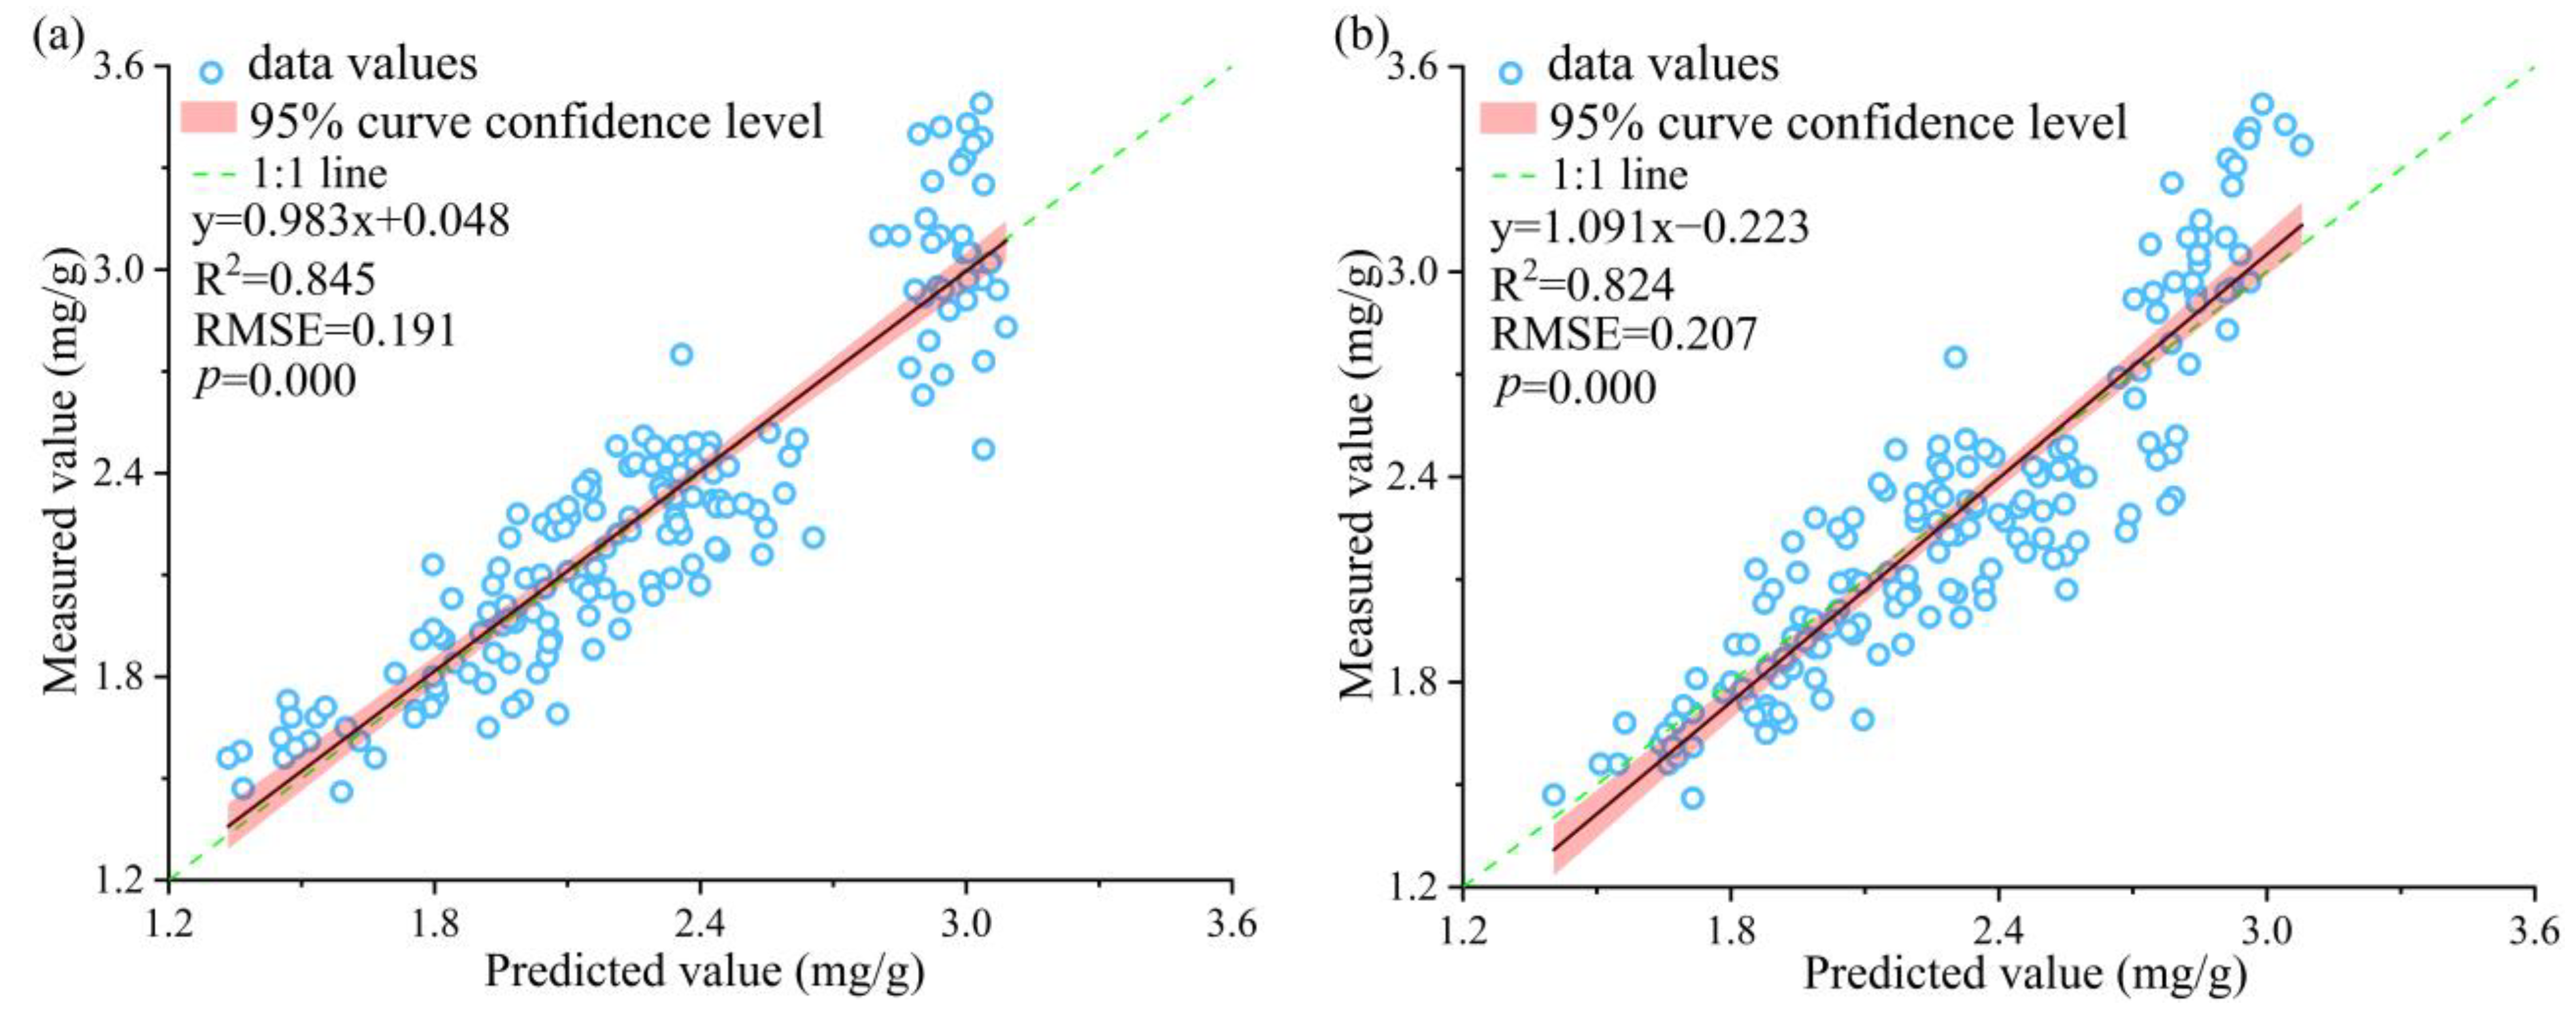
3.3.3. Multivariate Model Construction and Analysis

When individual spectral characteristics were selected for the estimation of nitrogen content, the spectral information of the individual bands was not sufficiently explanatory for the nitrogen content. Overall estimation of the model was poor due to a loss of information on physicochemical parameters carried by other spectral bands. Therefore, it was necessary to explore multivariate models for the relationship between spectral characteristics and the nitrogen content of Moso bamboo leaves. Both PLS and SVR models were implemented to explore their advantages and disadvantages. In the SVR model, after cross-validation the best kernel function for the model was determined to be the radial basis kernel function. Figure 8 shows the estimated nitrogen content of Moso bamboo and the model fits for the whole samples and those in different damage states. The overall fit of the multiple regression models was significantly improved compared with that of the one-way regression model. The p-values of the models were all less than 0.001 and reached a highly significant level. In the Mo and S states, the SVR model outperformed the PLS model while in the other states the reverse was observed. The fits of both models showed the same trends for different damage states of Moso bamboo leaves. The model fits decreased and then increased with the rise in pest damage level, and the model fits in the Mo state were the worst.
To investigate whether the results of the models were statistically different at different damage levels, paired t-tests were performed using the results of five trials. Table 2 shows that for the evaluation index R2, the results are not significantly different under the Mi-S group; for the evaluation index RMSE, the results are not significantly different under the Mi-S and Mi-O groups of the SVR model. The main reason for the above phenomenon was that the model results showed a decreasing and then increasing trend as the pest level rises and the effect was worst in the Mo state, while the difference between the Mi and S states was not obvious. The results of the experiment further verified the variation pattern between the nitrogen content and leaf spectrum of Moso bamboo leaves under PPC stress.

4. Discussion

4.1. Discriminatory Ability of Nitrogen Content-Sensitive Spectra for PPC Stress

Bands of spectra differed in their responsiveness to Moso bamboo leaves under different damage levels, and a one-way analysis of variance (ANOVA) revealed the responsiveness of spectral information to different damage classes [44] (Figure 9). When the spectral information of a band significantly differed (p < 0.05) among leaves of different damage classes, the information was used as a reference factor for the PPC damage detection model. Figure 9 shows that (1) the spectral reflectance of healthy (H) and damaged (Mi, Mo, S) Moso bamboo leaves differed significantly in most wavelength ranges, and the band ranges in which the groups significantly differed were similar. (2) The overall differences in spectral reflectance between Moso bamboo leaves in the affected states were small, but there were more pronounced differences in spectral reflectance in the green to red wavelength range. (3) The differences in spectral reflectance of Moso bamboo leaves between the O and other states were relatively complex. The overall difference between the O and H states was pronounced. The overall difference between the O and Mi states was relatively small. There were more significant differences between the O and Mo and S states in some wavelength ranges. A one-way ANOVA showed that the range of spectral wavelengths that was sensitive to the nitrogen content was also the range with significant differences among the leaf states.

4.2. Effect of Spectral Feature Index Screening on Model Results

The effectiveness of the model for estimating the nitrogen content of Moso bamboo leaves was closely related to the selection of leaf spectral characteristics. In this study, the selection of spectral characteristics was considered in two aspects, namely the correlation between the spectral information and nitrogen content, and the existence of co-linearity between the spectral information. The reasons for considering these two aspects were: (1) when there is a strong correlation between variables, it is meaningful to conduct regression analysis to obtain the specific relationships between variables. (2) Any covariance problem in the feature indicators will lead to a lack of stability in the regression model and affect the generalization error of the model.
Correlation between spectral reflectance data and the nitrogen content was significantly improved by CR-FD processing of the original spectra. Therefore, the CR-FD-processed spectral reflectance data were used as a basis for selecting feature indicators. When the absolute value of the correlation between the spectral information and the nitrogen content was >0.6, the wavelength reflectance at the largest absolute value of the correlation coefficient was selected as the characteristic index. However, in the Mo and S states, the value was adjusted slightly downward due to the low correlation between the spectral data and nitrogen content. The range of the region is predominantly determined according to whether there is a significant change in the correlation between the spectral information and nitrogen content, to avoid covariance due to the close distance of sensitive wavelengths. To avoid covariance in the selected feature spectra after this treatment, PLS was used to model the multivariate linear relationship. This is because doing so can weaken the effect of covariance between characteristics. The improvement in the models can be combined with feature selection and principal component analysis in future studies [45]. Screening spectral characteristics sensitive to nitrogen content revealed that the number of wavelengths with a strong correlation with nitrogen content was highest in the Mi state. However, constructing the relational model showed that the nitrogen content estimation model was inferior in the Mi state compared with those in the H and O states. This result was related to the low correlation between the nitrogen content and feature spectra in the Mi state. This result also demonstrated the shortcomings of analyzing the relationship between the two changes using the relational model.

4.3. Relationship between Pests and Leaf Nitrogen Content and Leaf Spectrum

PPC damage occurs when larvae eat bamboo leaves, causing leaves to become notched and hollow and resulting in a high loss of nutrients, including nitrogen, chlorophyll, and water [46]. This has a serious impact on Moso bamboo photosynthesis. Reduced photosynthetic efficiency leads to ineffective decomposition of water in the bamboo body, triggering a vicious cycle of water accumulation in the bamboo cavity at each node, further resulting in the death of patches of affected bamboo in the forest. Selection of spectral characteristics that can reflect these characteristic changes is the key to using leaf spectral information to determine the degree of pest stress. Asner et al. found that concentrations of chlorophyll, water, and nonstructural carbohydrates were significantly reduced in 80% of leaves of disease-infested plants, which together led to changes in leaf spectral reflectance [47]. Xi et al. studied the response mechanisms of larch forests under Jas’s Larch Inchworm stress using ground-based hyperspectral and biochemical components data (chlorophyll and water contents) [48]. Some researchers believe that current remote sensing technology cannot accurately analyze the extent of damage to the host by PPC [49] and that research should be conducted at the leaf scale. After continuous exploration identified the pest stage, related research found that leaves with PPC damage are sensitive to wavelengths of 703.43–898.56 nm, and the spectral reflectance of the leaf differs for different pest classes [50]. Pest stress led to changes in vegetation biochemical fractions, which further influenced changes in vegetation spectra. Exploring the effect of pest damage stress on the remote sensing inversion of biochemical components of forest trees is of considerable importance for accurate identification of pest damage, the study of forest tree resistance mechanisms, analysis of the spread of pest damage, and traceability work.
Nitrogen is an important component of plant chlorophyll and protein and is a key factor in regulating the photosynthetic capacity of plant leaves. Nitrogen affects all aspects of photosynthesis, including leaf chlorophyll content, the photosynthetic rate, dark-reaction enzyme activity, and photorespiration. Correlation between the nitrogen content and leaf spectral information and the fit of the nitrogen content model were significantly reduced after infestation by pests significantly decreased. Therefore, nitrogen content can be used as a response indicator to monitor the health status of Moso bamboo under PPC stress. The nitrogen content of Moso bamboo leaves changed significantly during infestation by the pest, especially in the early stage of infestation. Therefore, measuring nitrogen content can be key in efficiently and effectively monitoring pests in Moso bamboo forests through remote sensing. Nevertheless, to improve the precision of pest identification via remote-sensing pest monitoring, data of other biochemical component parameters, such as chlorophyll, water content, cellulose, and lignin, should also be analyzed.

5. Conclusions

In this study, we measured the nitrogen content and leaf spectra of Moso bamboo leaves. Briefly, we selected spectral characteristics that were strongly correlated with the nitrogen content of leaves by processing original spectral data using CR and FD and then estimated the nitrogen content of Moso bamboo leaves using spectral data as predictors through various regression models. The relationship between the nitrogen content and leaf spectral characteristics, as well as variations in the relationship, were analyzed according to the indices of fit of estimation models, and the following conclusions were drawn:
(1)
The overall nitrogen content of leaves gradually declined with increasing insect damage, with the fastest rate of decline in the H to Mi damaged states. These results provide a reference for the early monitoring of insect pests. The overall nitrogen content of leaves in off-years was lower than that in on-years.
(2)
The spectral curve of Moso bamboo leaves changed significantly under PPC damage. The “green peak” and “red valley” gradually disappeared in the visible range, and the slope of the spectral curve in the red range gradually decreased.
(3)
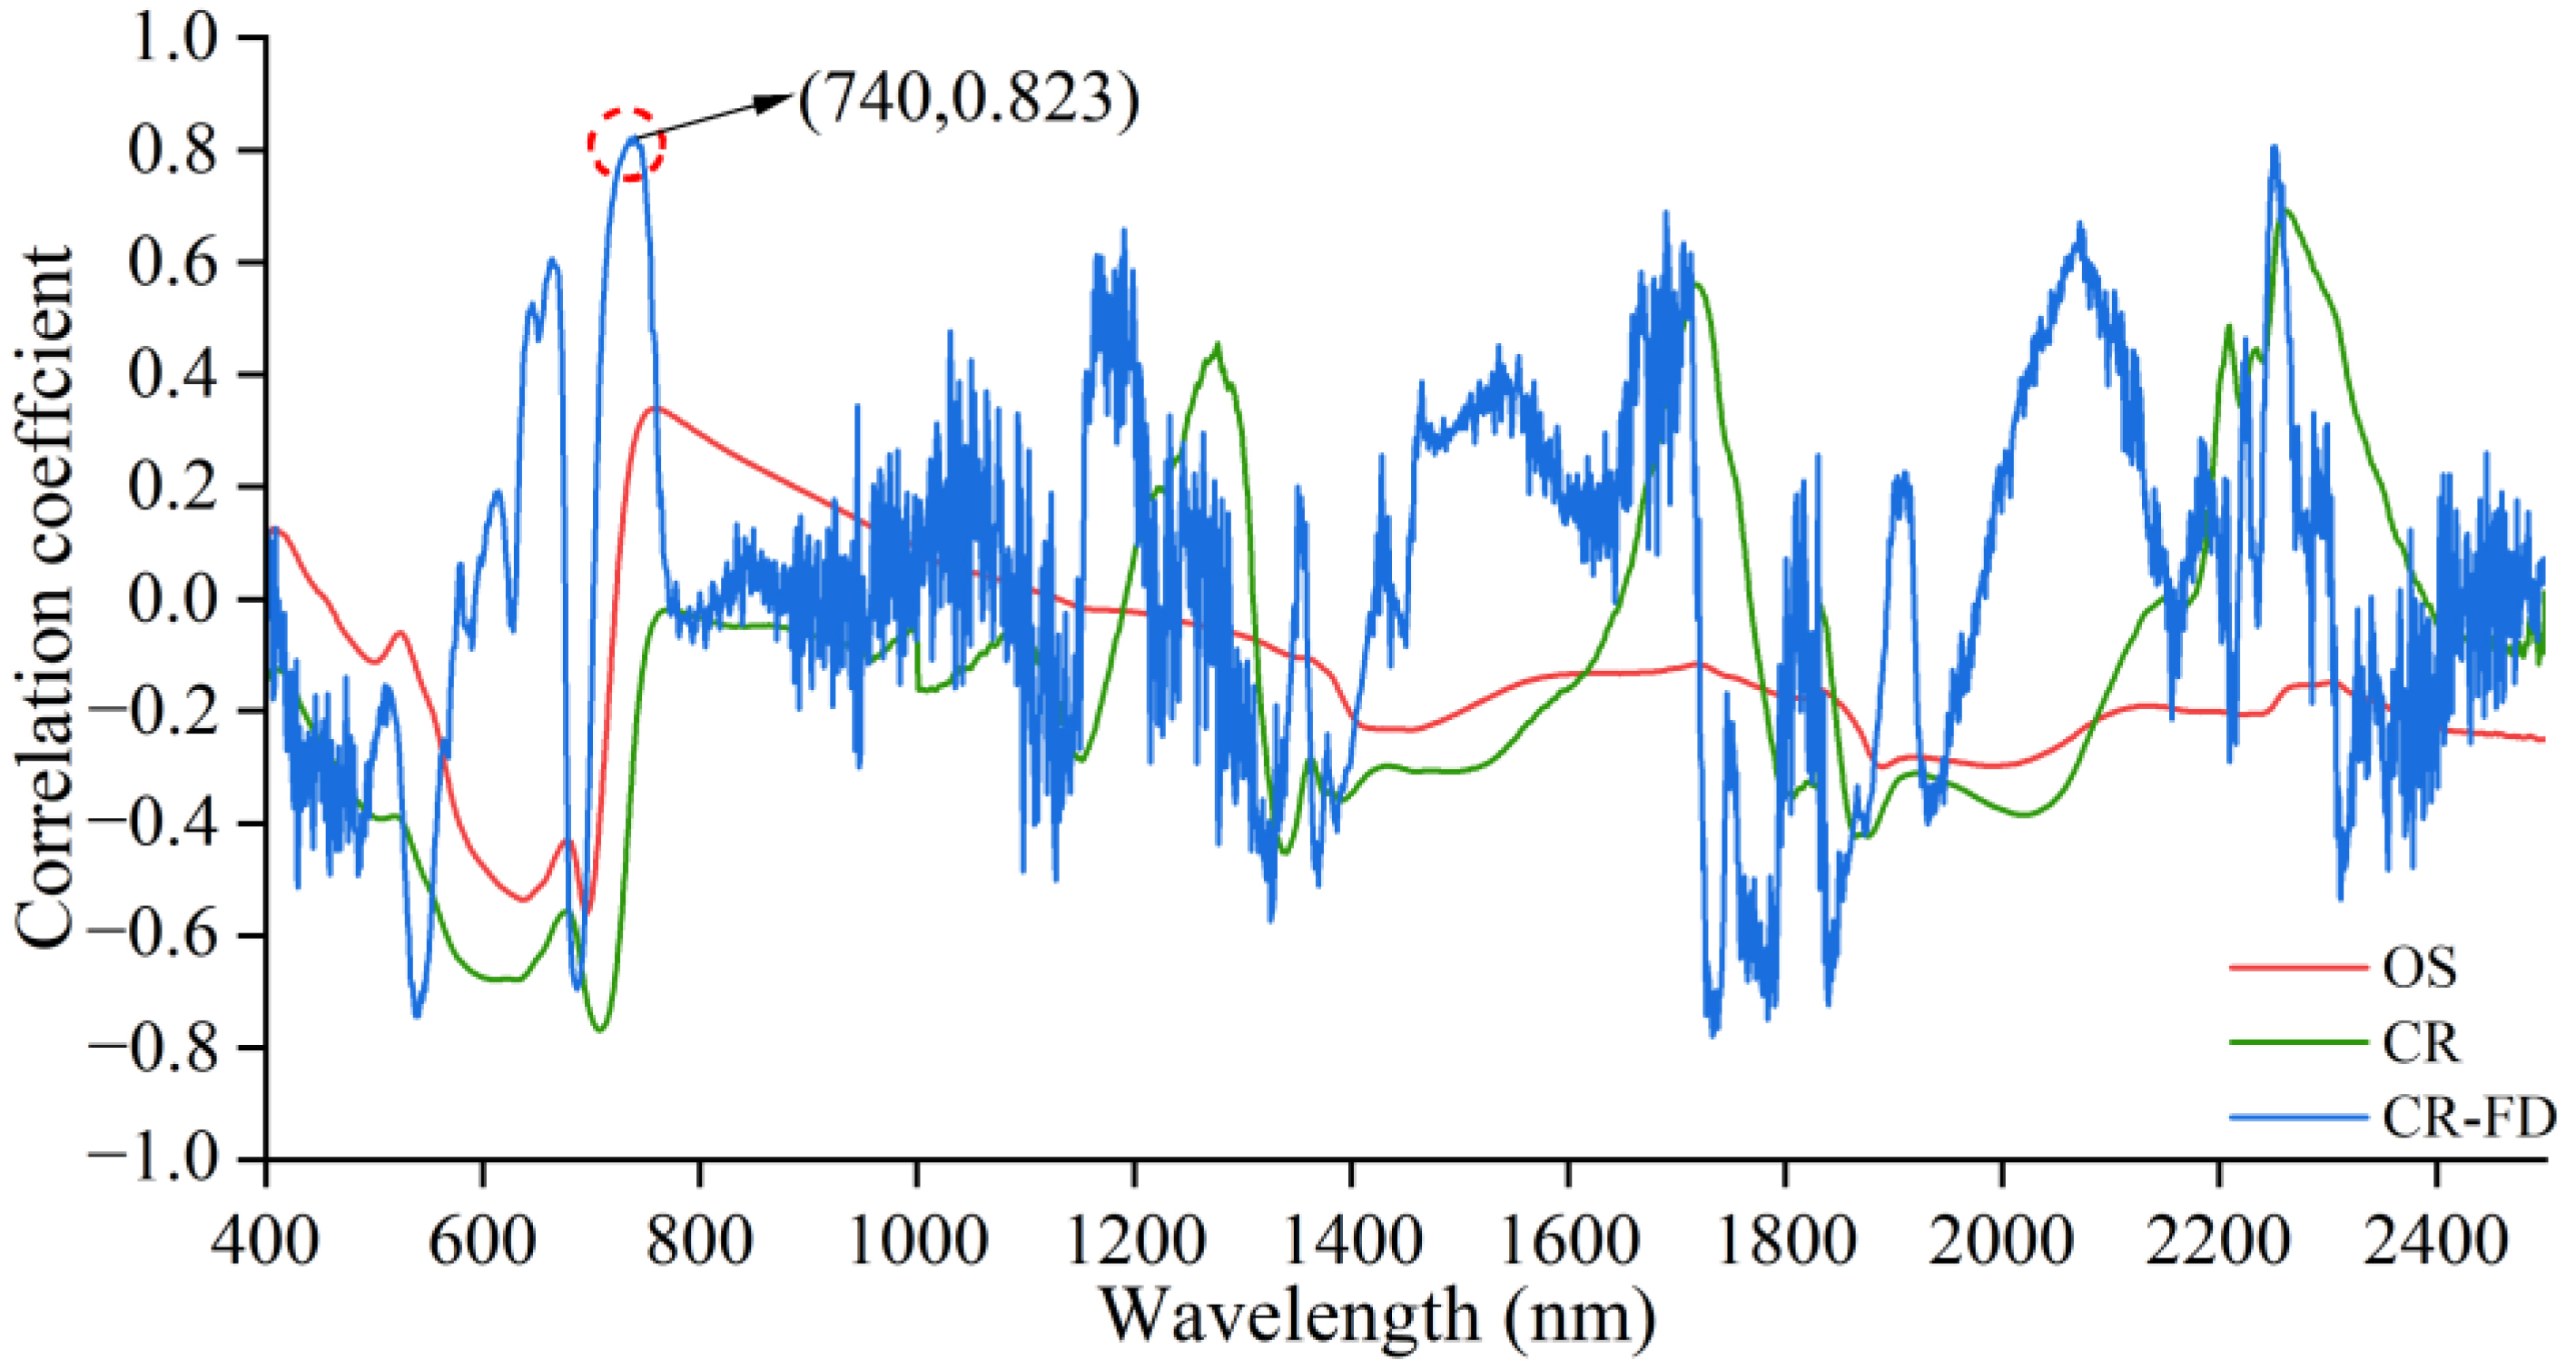
In the whole leaf samples, the wavelength regions strongly correlated with the nitrogen content of leaves were around 540, 687, 740, 1690, 1733, 1784, 1840, 2071, and 2251 nm. The wavelength region with the strongest correlation between the nitrogen content and spectral characteristics changed significantly in leaves in different damage states. The mean of the absolute value of the correlation between the nitrogen content and spectral characteristics in the red-edge range tended to gradually decrease with an increase in the degree of pest damage. The number of wavelengths with a strong correlation with the nitrogen content in the wavelength range from 400 to 2500 nm first increased and then decreased with an increasing degree of pest damage. The number of wavelengths with a strong correlation between the nitrogen content and spectral data was highest in the Mi state.
(4)
The SVR model outperformed the PLS model in the Mo and S states, and the fits of both were significantly improved compared with those of the univariate models. For both the univariate and multivariate models, the model fit followed the same trend, i.e., the fit of both models decreased and then increased as the pest damage level increased. The fit of both models in the Mo state was the worst, and that of the models in the off-year state was better than that in the on-year state.

Author Contributions

Conceptualization, Z.X. and H.Y.; methodology, Z.X. and H.Y.; software, H.Y. and B.L.; validation, Z.H., Y.L., S.X. and H.Y.; data curation, B.L.; writing—original draft preparation, Z.X. and H.Y.; writing—review and editing, Z.X., Z.H. and X.H.; visualization, Z.L. and X.G. All authors have read and agreed to the published version of the manuscript.

Funding

This research was supported by the National Natural Science Foundation of China, grant number 42071300; the Fujian Province Natural Science Foundation Project, grant number 2020J01504; the China Postdoctoral Science Foundation, grant number 2018M630728; the Open Fund of Fujian Provincial Key Laboratory of Resources and Environment Monitoring & Sustainable Management and Utilization, grant number ZD202102; the Program for Innovative Research Team in Science and Technology in Fujian Province University, grant number KC190002; the Research Project of Jinjiang Fuda Science and Education Park Development Center, grant number 2019-JJFDKY-17; and the Open Fund of University Key Lab for Geomatics Technology & Optimize Resource Utilization in Fujian Province, grant number fafugeo201901.

Data Availability Statement

The research data have been uploaded to the Mendeley Data database. This data can be found here: [https://data.mendeley.com/datasets/8d9jhbhcg6/1] (accessed on 31 August 2022).

Acknowledgments

We are grateful to the Forestry Bureau of Shunchang County, as well as Xiamen Forest Pest Control and Quarantine Station for their help in this work. A special thank you to Zhaoquan Zhong, Xianyun Lin, Huafeng Zhang and Juyuan Gao for their help in the field experiment for this research.

Conflicts of Interest

The authors declare no conflict of interest.

References

  1. Wei, C.J. Plague division and application of Pantana phyllostachysae Chao in Fujian Province. J. For. Environ. 2003, 23, 79–83. [Google Scholar]
  2. Su, J.; Zhang, F.P.; Huang, W.L.; Chen, D.L.; Chen, S.L. Influence of different types of Phyllostachys pubescens (Poales: Poaceae) leaves on population parameters of Pantana phyllostachysae (Lepidoptera: Lymantriidae) and parasitic effects of Beauveria bassiana (Moniliales: Moniliaceae). J. Insect Sci. 2015, 15, 39. [Google Scholar] [CrossRef] [PubMed] [Green Version]
  3. Qin, J.L.; Yang, X.H.; Yang, Z.W.; Luo, J.T.; Lei, X.F. New technology for using meteorological information in forest insect pest forecast and warning systems. Pest. Manag. Sci. 2017, 73, 2509–2518. [Google Scholar] [CrossRef] [PubMed]
  4. Pasquarella, V.J.; Elkinton, J.S.; Bradley, B.A. Extensive gypsy moth defoliation in Southern New England characterized using Landsat satellite observations. Biol. Invasions. 2018, 20, 3047–3053. [Google Scholar] [CrossRef]
  5. Zhang, J.C.; Huang, Y.B.; Pu, R.L.; Gonzalez-Moreno, P.; Yuan, L.; Wu, K.H.; Huang, W.J. Monitoring plant diseases and pests through remote sensing technology: A review. Comput. Electron. Agric. 2019, 165, 104943. [Google Scholar] [CrossRef]
  6. Ye, S.; Rogan, J.; Zhu, Z.; Hawbaker, T.J.; Hart, S.J.; Andrus, R.A.; Meddens, A.J.H.; Hicke, J.A.; Eastman, J.R.; Kulakowski, D. Detecting subtle change from dense Landsat time series: Case studies of mountain pine beetle and spruce beetle disturbance. Remote Sens. Environ. 2021, 263, 112560. [Google Scholar] [CrossRef]
  7. Apan, A.; Held, A.; Phinn, S.; Markley, J. Detecting sugarcane ‘orange rust’ disease using EO-1 Hyperion hyperspectral imagery. Int. J. Remote Sens. 2004, 25, 489–498. [Google Scholar] [CrossRef] [Green Version]
  8. Görlich, F.; Marks, E.; Mahlein, A.K.; König, K.; Lottes, P.; Stachniss, C. UAV-based classification of cercospora leaf spot using RGB images. Drones 2021, 5, 34. [Google Scholar] [CrossRef]
  9. Feng, Z.H.; Wang, L.Y.; Yang, Z.Q.; Zhang, Y.Y.; Li, X.; Song, L.; He, L.; Duan, J.Z.; Feng, W. Hyperspectral monitoring of powdery mildew disease severity in wheat based on machine learning. Front. Plant Sci. 2022, 13, 828454. [Google Scholar] [CrossRef]
  10. Leite, R.M.V.B.C.; Amorim, L.; Bergamin Filho, A. Relationships of disease and leaf area variables with yield in the Alternaria helianthi–sunflower pathosystem. Plant Pathol. 2006, 55, 73–81. [Google Scholar] [CrossRef]
  11. Wijesinghe, R.E.; Lee, S.Y.; Kim, P.; Jung, H.Y.; Jeon, M.; Kim, J. Optical inspection and morphological analysis of Diospyros kaki plant leaves for the detection of circular leaf spot disease. Sensors 2016, 16, 1282. [Google Scholar] [CrossRef] [PubMed] [Green Version]
  12. Macedo, T.B.; Weaver, D.K.; Peterson, R.K.D. Characterization of the impact of wheat stem sawfly, Cephus cinctus Norton, on pigment composition and photosystem II photochemistry of wheat heads. Environ. Entomol. 2006, 35, 1115–1120. [Google Scholar] [CrossRef] [Green Version]
  13. Wu, D.K.; Ma, C.W.; Du, S.F. Influences of different damaged degrees of leafminer-infected leaves on the near infrared spectral reflectance. Trans. Chin. Soc. Agric. Eng. 2007, 23, 156–159. [Google Scholar]
  14. Goławska, S.; Krzyżanowski, R.; Łukasik, I. Relationship between aphid infestation and chlorophyll content in Fabaceae species. Acta Biol. Cracov. Ser. Bot. 2010, 52, 76–80. [Google Scholar] [CrossRef]
  15. Errard, A.; Ulrichs, C.; Kühne, S.; Mewis, I.; Drungowski, M.; Schreiner, M.; Baldermann, S. Single-versus multiple-pest infestation affects differently the biochemistry of tomato (Solanum lycopersicum ‘Ailsa Craig’). J. Agric. Food. Chem. 2015, 63, 10103–10111. [Google Scholar] [CrossRef] [PubMed]
  16. Polyakova, L.V.; Gamayunova, S.G.; Zhurova, P.T.; Litvinenko, V.I. Biochemical specifics of English oak trees with dry crown. Contemp. Probl. Ecol. 2015, 8, 885–891. [Google Scholar] [CrossRef]
  17. Chavana-Bryant, C.; Malhi, Y.; Anastasiou, A.; Enquist, B.J.; Cosio, E.G.; Keenan, T.F.; Gerard, F.F. Leaf age effects on the spectral predictability of leaf traits in Amazonian canopy trees. Sci. Total Environ. 2019, 666, 1301–1315. [Google Scholar] [CrossRef] [Green Version]
  18. Liu, S.; Yu, H.Y.; Zhang, J.H.; Zhou, H.G.; Kong, L.J.; Zhang, L.; Dang, J.M.; Sui, Y.Y. Study on inversion model of chlorophyll content in soybean leaf based on optimal spectral indices. Spectrosc. Spectral Anal. 2021, 41, 1912–1919. [Google Scholar]
  19. Minaei, S.; Soltanikazemi, M.; Shafizadeh-Moghadam, H.; Mahdavian, A. Field-scale estimation of sugarcane leaf nitrogen content using vegetation indices and spectral bands of Sentinel-2: Application of random forest and support vector regression. Comput. Electron. Agric. 2022, 200, 107130. [Google Scholar]
  20. Rubio-Delgado, J.; Perez, C.J.; Vega-Rodríguez, M.A. Predicting leaf nitrogen content in olive trees using hyperspectral data for precision agriculture. Precis. Agric. 2021, 22, 1–21. [Google Scholar] [CrossRef]
  21. Lian, L.; Wang, Z.X.; Gao, Y.L.; Shi, Y.Q.; Yang, Y.Q.; Li, P.; Yusun, T.S.J. Hyperspectral estimation model of water content in coronal layer of jujube damaged by Tetranychus truncatus. Southwest Chin. J. Agr. Sci. 2020, 33, 2524–2529. [Google Scholar]
  22. Bai, X.Q.; Zhang, X.L.; Zhang, L.; Zhang, L.S.; Ma, Y.B. Monitoring model of Dendrolimus tabulaeformis disaster using hyperspectral remote sensing technology. J. Beijing For. Univ. 2016, 38, 16–22. [Google Scholar]
  23. Feng, W.; Zhu, Y.; Tian, Y.C.; Cao, W.X.; Yao, X.; Li, Y.X. Monitoring leaf nitrogen accumulation with hyper-spectral remote sensing in wheat. Acta Ecol. Sin. 2008, 28, 23–32. [Google Scholar]
  24. Khan, A.; Yan, L.; Hasan, M.M.; Wang, W.; Xu, K.; Zou, G.W.; Liu, X.D.; Fang, X.W. Leaf traits and leaf nitrogen shift photosynthesis adaptive strategies among functional groups and diverse biomes. Ecol. Indic. 2022, 141, 109098. [Google Scholar] [CrossRef]
  25. McNeil, B.E.; de Beurs, K.M.; Eshleman, K.N.; Foster, J.R.; Townsend, P.A. Maintenance of ecosystem nitrogen limitation by ephemeral forest disturbance: An assessment using MODIS, Hyperion, and Landsat ETM+. Geophys. Res. Lett. 2007, 34, 1–5. [Google Scholar] [CrossRef]
  26. Camino, C.; Calderón, R.; Parnell, S.; Dierkes, H.; Chemin, Y.; Román-Écija, M.; Montes-Borrego, M.; Landa, B.B.; Navas-Cortes, J.A.; Zarco-Tejada, P.J.; et al. Detection of Xylella fastidiosa in almond orchards by synergic use of an epidemic spread model and remotely sensed plant traits. Remote Sens. Environ. 2021, 260, 112420. [Google Scholar] [CrossRef]
  27. Chen, Y.Z.; Fu, B.J.; Feng, X.M. Overview and outlook of remote sensing inversion of vegetation nitrogen content. Acta Ecol. Sin. 2017, 37, 6240–6252. [Google Scholar]
  28. Mutanga, O.; Skidmore, A.K. Integrating imaging spectroscopy and neural networks to map grass quality in the Kruger National Park, South Africa. Remote Sens. Environ. 2004, 90, 104–115. [Google Scholar] [CrossRef]
  29. Wang, Y.; Wang, F.M.; Huang, J.F.; Wang, X.Z.; Liu, Z.Y. Validation of artificial neural network techniques in the estimation of nitrogen concentration in rape using canopy hyperspectral reflectance data. Int. J. Remote Sens. 2009, 30, 4493–4505. [Google Scholar] [CrossRef]
  30. Li, M.; Zhu, X.C.; Li, W.; Tang, X.Y.; Yu, X.Y.; Jiang, Y.M. Retrieval of nitrogen content in apple canopy based on unmanned aerial vehicle hyperspectral images using a modified correlation coefficient method. Sustainability 2022, 14, 1992. [Google Scholar] [CrossRef]
  31. Lin, M.Y.; Lynch, V.; Ma, D.D.; Maki, H.; Jin, J.; Tuinstra, M. Multi-species prediction of physiological traits with hyperspectral modeling. Plants 2022, 11, 676. [Google Scholar] [CrossRef] [PubMed]
  32. Yang, L.C.; Deng, S.; Ma, S.M.; Xiao, F.X. Estimation model of leaf nitrogen content based on GEP and leaf spectral reflectance. Comput. Electr. Eng. 2022, 98, 107648. [Google Scholar] [CrossRef]
  33. Xu, Q.B.; Guo, B.H.; Fan, S.H.; Su, W.H.; Zhao, J.C. Aboveground biomass pattern and nutrient dynamic changes of Phyllostachys edulis during the spring shoot and young bamboo growing period. Chin. J. Trop Crops 2014, 35, 1481–1486. [Google Scholar]
  34. Nawar, S.; Buddenbaum, H.; Hill, J.; Kozak, J.; Mouazen, A.M. Estimating the soil clay content and organic matter by means of different calibration methods of vis-NIR diffuse reflectance spectroscopy. Soil Till. Res. 2016, 155, 510–522. [Google Scholar] [CrossRef] [Green Version]
  35. Sanches, I.D.A.; Souza Filho, C.R.; Kokaly, R.F. Spectroscopic remote sensing of plant stress at leaf and canopy levels using the chlorophyll 680 nm absorption feature with continuum removal. ISPRS J. Photogramm. Remote Sens. 2014, 97, 111–122. [Google Scholar] [CrossRef]
  36. Guo, C.F.; Guo, X.Y. Estimation of wetland plant leaf chlorophyll content based on continuum removal in the visible domain. Acta Ecol. Sin. 2016, 36, 6538–6546. [Google Scholar]
  37. Cheng, C.M.; Wei, Y.C.; Sun, X.P.; Zhou, Y. Estimation of chlorophyll-a concentration in turbid lake using spectral smoothing and derivative analysis. Int. J. Environ. Res. Public Health. 2013, 10, 2979–2994. [Google Scholar] [CrossRef] [Green Version]
  38. Faix, O.; Böttcher, J.H. Determination of phenolic hydroxyl group contents in milled wood lignins by FTIR spectroscopy applying partial least-squares (PLS) and principal components regression (PCR). Holzforschung 1993, 47, 45–49. [Google Scholar] [CrossRef]
  39. Yu, L.; Hong, Y.S.; Geng, L.; Zhou, Y.; Zhu, Q.; Cao, J.J.; Nie, Y. Hyperspectral estimation of soil organic matter content based on partial least squares regression. Trans. Chin. Soc. Agric. Eng. 2015, 31, 103–109. [Google Scholar]
  40. Cortes, C.; Vapnik, V. Support-vector networks. Mach. Learn. 1995, 20, 273–297. [Google Scholar] [CrossRef]
  41. Pedregosa, F.; Varoquaux, G.; Gramfort, A.; Michel, V.; Thirion, B.; Grisel, O.; Blondel, M.; Prettenhofer, P.; Weiss, R.; Dubourg, V.; et al. Scikit-learn: Machine Learning in Python. J. Mach. Learn. Res. 2011, 12, 2825–2830. [Google Scholar]
  42. Mutanga, O.; Skidmore, A.K.; Van Wieren, S. Discriminating tropical grass (Cenchrus ciliaris) canopies grown under different nitrogen treatments using spectroradiometry. ISPRS J. Photogramm. Remote Sens. 2003, 57, 263–272. [Google Scholar]
  43. Mitchell, J.J.; Glenn, N.F.; Sankey, T.T.; Derryberry, D.R.; Germino, M.J. Remote sensing of sagebrush canopy nitrogen. Remote Sens. Environ. 2012, 124, 217–223. [Google Scholar] [CrossRef]
  44. Chen, J.Q.; Li, X.M.; Wang, K.; Zhang, S.Y.; Li, J.; Zhang, J.; Gao, W.C. Variable optimization of seaweed spectral response characteristics and species identification in Gouqi island. Sensors. 2022, 22, 4656. [Google Scholar] [CrossRef] [PubMed]
  45. Shafizadeh-Moghadam, H. Fully component selection: An efficient combination of feature selection and principal component analysis to increase model performance. Expert Syst. Appl. 2021, 186, 115678. [Google Scholar] [CrossRef]
  46. Huang, X.Y.; Xu, Z.H.; Yang, X.; Shi, J.M.; Hu, X.Y.; Ju, W.M. Monitoring the severity of Pantana phyllostachysae Chao on bamboo using leaf hyperspectral data. Remote Sens. 2021, 13, 4146. [Google Scholar] [CrossRef]
  47. Asner, G.P.; Martin, R.E.; Keith, L.M.; Heller, W.P.; Hughes, M.A.; Vaughn, N.R.; Hughes, R.F.; Balzotti, C. A spectral mapping signature for the rapid ohia death (ROD) pathogen in Hawaiian forests. Remote Sens. 2018, 10, 404. [Google Scholar] [CrossRef] [Green Version]
  48. Xi, G.L.; Huang, X.J.; Xie, Y.W.; Gang, B.; Bao, Y.H.; Dashzebeg, G.; Nanzad, T.; Dorjsuren, A.; Enkhnasan, D.; Ariunaa, M. Detection of larch forest stress from Jas’s larch inchworm (Erannis jacobsoni Djak) attack using hyperspectral remote sensing. Remote Sens. 2021, 14, 124. [Google Scholar] [CrossRef]
  49. Xu, Z.H.; Zhang, Q.; Xiang, S.Y.; Li, Y.F.; Huang, X.Y.; Zhang, Y.W.; Zhou, X.; Li, Z.L.; Yao, X.; Li, Q.S.; et al. Monitoring the severity of Pantana phyllostachysae Chao infestation in Moso bamboo forests based on UAV multi-spectral remote sensing feature selection. Forests 2022, 13, 418. [Google Scholar] [CrossRef]
  50. Huang, X.Y.; Xu, Z.H.; Lin, L.; Liu, J.; Zhong, Z.Q.; Zhou, H.K. Spectral characteristic wavelengths of Moso bamboo leaves damaged by Pantana phyllostachysae Chao. Spectrosc. Spectral Anal. 2018, 38, 3829–3838. [Google Scholar]
Figure 1. Study site: (a) location of the study area in Shunchang County; (b) remote sensing images and locations of sampling sites in Shunchang County.
Forests 13 01752 g001
Figure 2. Sample collection and analysis: (a) Pantana phyllostachysae Chao larvae; (b) leaf samples of Moso bamboo in different states of damage; (c) ASD FieldSpec3 spectrometer used in the study. 0% to 5% = Healthy (H), 5% to 25% = Mildly damaged (Mi), 25% to 50% = Moderately damaged (Mo), ≥50% = Severely damaged (S), and Off-years (O).
Forests 13 01752 g002
Figure 3. Workflow of changes in the relationship between nitrogen content and leaf spectral characteristics under PPC stress.
Forests 13 01752 g003
Figure 4. Trends in nitrogen content of Moso bamboo leaf samples in different damage states. The left side of each pair of graphs shows the box line plot for nitrogen content for that damage state, and the right side shows the actual distribution of data.
Forests 13 01752 g004
Figure 5. Spectral information for Moso bamboo leaves in different states: ① and ② are local enlargements of the corresponding areas.
Forests 13 01752 g005
Figure 6. Correlation analysis of spectral data for whole leaf samples with nitrogen content. The number is the area with high correlation, and the scope of the area is predominantly determined according to whether the correlation trend has significantly changed. Original spectrum (OS); continuum removal (CR); continuum removal-first derivative (CR-FD).
Forests 13 01752 g006
Figure 7. Correlation analysis of spectral data and nitrogen content of Moso bamboo leaves in different states: (ae) correlations between spectral data and nitrogen contents of leaves in H, Mi, Mo, S, and O states, respectively. (f) Correlations between nitrogen content and spectral characteristics.
Forests 13 01752 g007
Figure 8. Estimated nitrogen content of Moso bamboo from two regression models for Moso bamboo leaves in different damage states: (a) Whole samples PLS model; (b) whole samples SVR model; (c) H-PLS; (d) H-SVR; (e) Mi-PLS; (f) Mi-SVR; (g) Mo-PLS; (h) Mo-SVR; (i) S-PLS; (j) S-SVR; (k) O-PLS; (l) O-SVR. partial least squares (PLS); support vector regression (SVR).
Forests 13 01752 g008aForests 13 01752 g008bForests 13 01752 g008c
Figure 9. One-way ANOVA of spectral wavelengths among different Moso bamboo leaf states: (a) one-way ANOVA of the H and damaged (Mi, Mo, S) states; (b) one-way ANOVA of different damage states; (c) one-way ANOVA of off-year and on-year (H, Mi, Mo, S) states.
Forests 13 01752 g009
Table 1. Construction of relationship models for Moso bamboo leaves in different damage states.
StateIndexBest Estimate Model EquationR2RMSE
HCR-FD696 y = 1.882 ln x 4.761 0.6740.127
CR-FD751 y = 0.952 ln x + 8.927 0.8050.098
CR-FD2049 y = 8.467 e 477.187 x 0.5410.151
MiCR-FD524 y = 118.638 x + 2.912 0.5510.145
CR-FD637 y = 2.772 e 71.364 x 0.5330.148
CR-FD2143 y = 91865.999 x 2 + 219.435 x + 2.475 0.6590.127
MoCR-FD534 y = 76054.291 x 2 74.496 x + 2.397 0.0970.163
CR-FD735 y = 9163.851 x 2 + 191.572 x + 1.368 −0.1460.184
CR-FD2252 y = 2.629 e 160.511 x 0.2750.157
SCR-FD1103 y = 2344354.231 x 2 1797.199 x + 2.080 0.3120.206
CR-FD1731 y = 1904836.384 x 2 1147.347 x + 2.069 0.5300.170
CR-FD2252 y = 78149.816 x 2 + 718.358 x + 2.868 0.6040.156
OCR-FD534 y = 19972.230 x 2 256.702 x + 2.404 0.6900.126
CR-FD689 y = 1360.659 x 2 87.458 x + 2.829 0.4870.162
CR-FD739 y = 136.485 x + 1.489 0.6040.142
Table 2. Paired t-test for evaluation index of PLS and SVR models.
Pest LevelPLSSVR
R2RMSER2RMSE
tptptptp
H-Mi7.1780.002 **17.9200.000 **5.9130.004 **5.7140.005 **
H-Mo91.6250.000 **−61.3880.000 **13.4600.000 **−8.5720.001 **
H-S5.0270.007 **−6.8020.002 **−10.8460.000 **6.6620.003 **
H-O−22.8230.000 **12.1130.000 **−14.3660.000 **6.1520.004 **
Mi-Mo327.9160.000 **−72.8380.000 **13.1180.000 **−6.9060.002 **
Mi-S2.2540.087−26.3150.000 **−12.1590.000 **−2.1590.097
Mi-O−102.3740.000 **−7.7910.001 **−20.8030.000 **1.3250.256
Mo-S−61.4730.000 **32.1520.000 **−19.1990.000 **8.0560.001 **
Mo-O−23.9480.000 **54.1940.000 **−27.8150.000 **7.2600.002 **
S-O−299.6050.000 **24.8900.000 **−2.9300.043 *3.5810.023 *
Note: * at the significance level of 0.05; ** at the significance level of 0.01.
Publisher’s Note: MDPI stays neutral with regard to jurisdictional claims in published maps and institutional affiliations.

