1. Introduction
Road transport of wood can be optimized by adjusting several factors which make up the activity. Thus, the extraction of knowledge generated through data, that is, a relational database makes it possible to identify target variables that can be estimated and, consequently, provide support to forest managers’ strategies. Planning is a strategic component, which can make decision-making more efficient and faster.
The planning is divided into decision-making levels, relating them to the application time horizon and the type of decision taken. Levels must be integrated to avoid inconsistent solutions. Strategies determine the line of action of the project, being carried out in the long term; tactics, organize medium-term activities; and operations, aim at routine, short-term decisions [
1,
2,
3,
4].
When it comes to strategic-level planning, it is an organizational process of strategies and decision-making, concerning overall long-term objectives. The line of action is elaborated before the initial phase of the action, aggregating information that organizes the operational plan, which allows the employees to carry out the allocation of resources, stipulating the risks, a strategy that is capable of reducing environmental impacts and social networks, identifying possible long-term gains [
5,
6,
7,
8].
The execution of strategic planning in the forestry sector can provide the optimization of activities, generate more assertive decision-making, as well as intelligently obtain inputs, reducing operating costs. Planning has been widely applied in the sector, such as in pulp and paper industries, for the management of planted forests and forest transport [
9,
10,
11,
12].
The detailing of the planning corroborates the increase in the efficiency of forestry activities when using wood resources. It avoids environmental disturbances and helps to develop an ideal route for the transport of wood, which can guarantee maximum profit from the transported products. The transport of wood is considered an expensive process, being the activity with one of the highest costs in the forestry sector [
13,
14,
15,
16].
The transport of wood consists of the movement of the bundles to the consumer units. In this connection between the planted forests and the manufacturing units, there is the possibility of carrying out this activity through the road modal, whose displacement can be carried out by trucks, in addition to presenting a varied offer of vehicles and short travel time. Proper planning of this activity can contribute to the performance of forestry activities or the supply chain, reducing costs. Some factors significantly affect the operational cost of road transport of wood, for example, the displacement, the condition of the road and the distance between the places of supply and the consumer [
17,
18,
19,
20,
21,
22].
Machine learning concerns the scientific study of algorithms and statistical models which are used by machine systems to perform specific and efficient tasks. It is noteworthy that this tool does not require strict programming. Machine learning algorithms fall into different types of learning, supervised or unsupervised [
23,
24,
25].
The machine learning can be used to automate and manage forestry activities, such as the application in road transport of wood. The algorithms are used to analyze the data sets and, later, build decision-making systems. The goal of machine learning is about achieving goodness of fit in an independent test suite, as it can minimize deviations between actual and predicted results [
26,
27,
28,
29].
The methods based on machine learning can be applied predictively in order to predict the state and future values of the system. The construction of the predictive model is carried out from various resources, so that there are parameters within these models that are determined from historical data. The machine learning methods allow the creation of data-driven models and algorithms, which mostly have predictive capacity [
30,
31,
32,
33].
The machine learning is considered a promising solution for road transport of wood, since it can contribute to reducing congestion, improving employee safety, reducing human errors, mitigating unfavorable environmental impacts, optimizing energy performance, improve productivity and transport efficiency. The when developing a model through machine learning algorithms, it becomes possible to predict and establish strategies for problems in the forestry sector [
34,
35,
36,
37].
Based on variables inherent to the wood transport process, we verified whether machine learning models can act as predictors of the volume of wood to be transported and support strategic decision-making.
2. Materials and Methods
2.1. Case Study
We use structured data from road transport of wood, destined for the production of bleached
Eucalyptus short fiber pulp. The forests were located in the western region of Uruguay (
Table 1) and were planted with five species, namely:
Eucalyptus dunnii Maiden;
Eucalyptus grandis W. Hill ex Maiden;
Eucalyptus saligna Sm.;
Eucalyptus tereticornis Sm.; and
Eucalyptus viminalis Labill. Wood was harvested using harvesters, that is, the cut-to-length system was used to cut, peel, and section the trees into logs measuring 4.80 m and 7.20 m in length.
Road transport of wood was carried out using three models of Load Carrier Compositions (LCC), ensuring a minimum ratio of 4.5 HP per ton, characterized as: LCC_1—truncated truck with a single axle and a set of tandem axles and a trailer with two double axles, with a maximum length of 20.0 m and a combined total gross mass of 45.0 tons; LCC_2—tractor truck with a single axle and a set of axles in double tandem and a semi-trailer with a set of double axles with a distance greater than 2.4 m between them, with a maximum length of 18.6 m and a combined total gross mass of 45.0 tons; LCC_3—truncated tractor truck with a single axle and a set of axles in double tandem and a semi-trailer with a set of axles in triple tandem with a distance greater than 1.2 m and less than 2.4 m between them and a maximum length of 18.6 m and combined total gross mass of 49.5 tons.
2.2. Exploratory Analysis
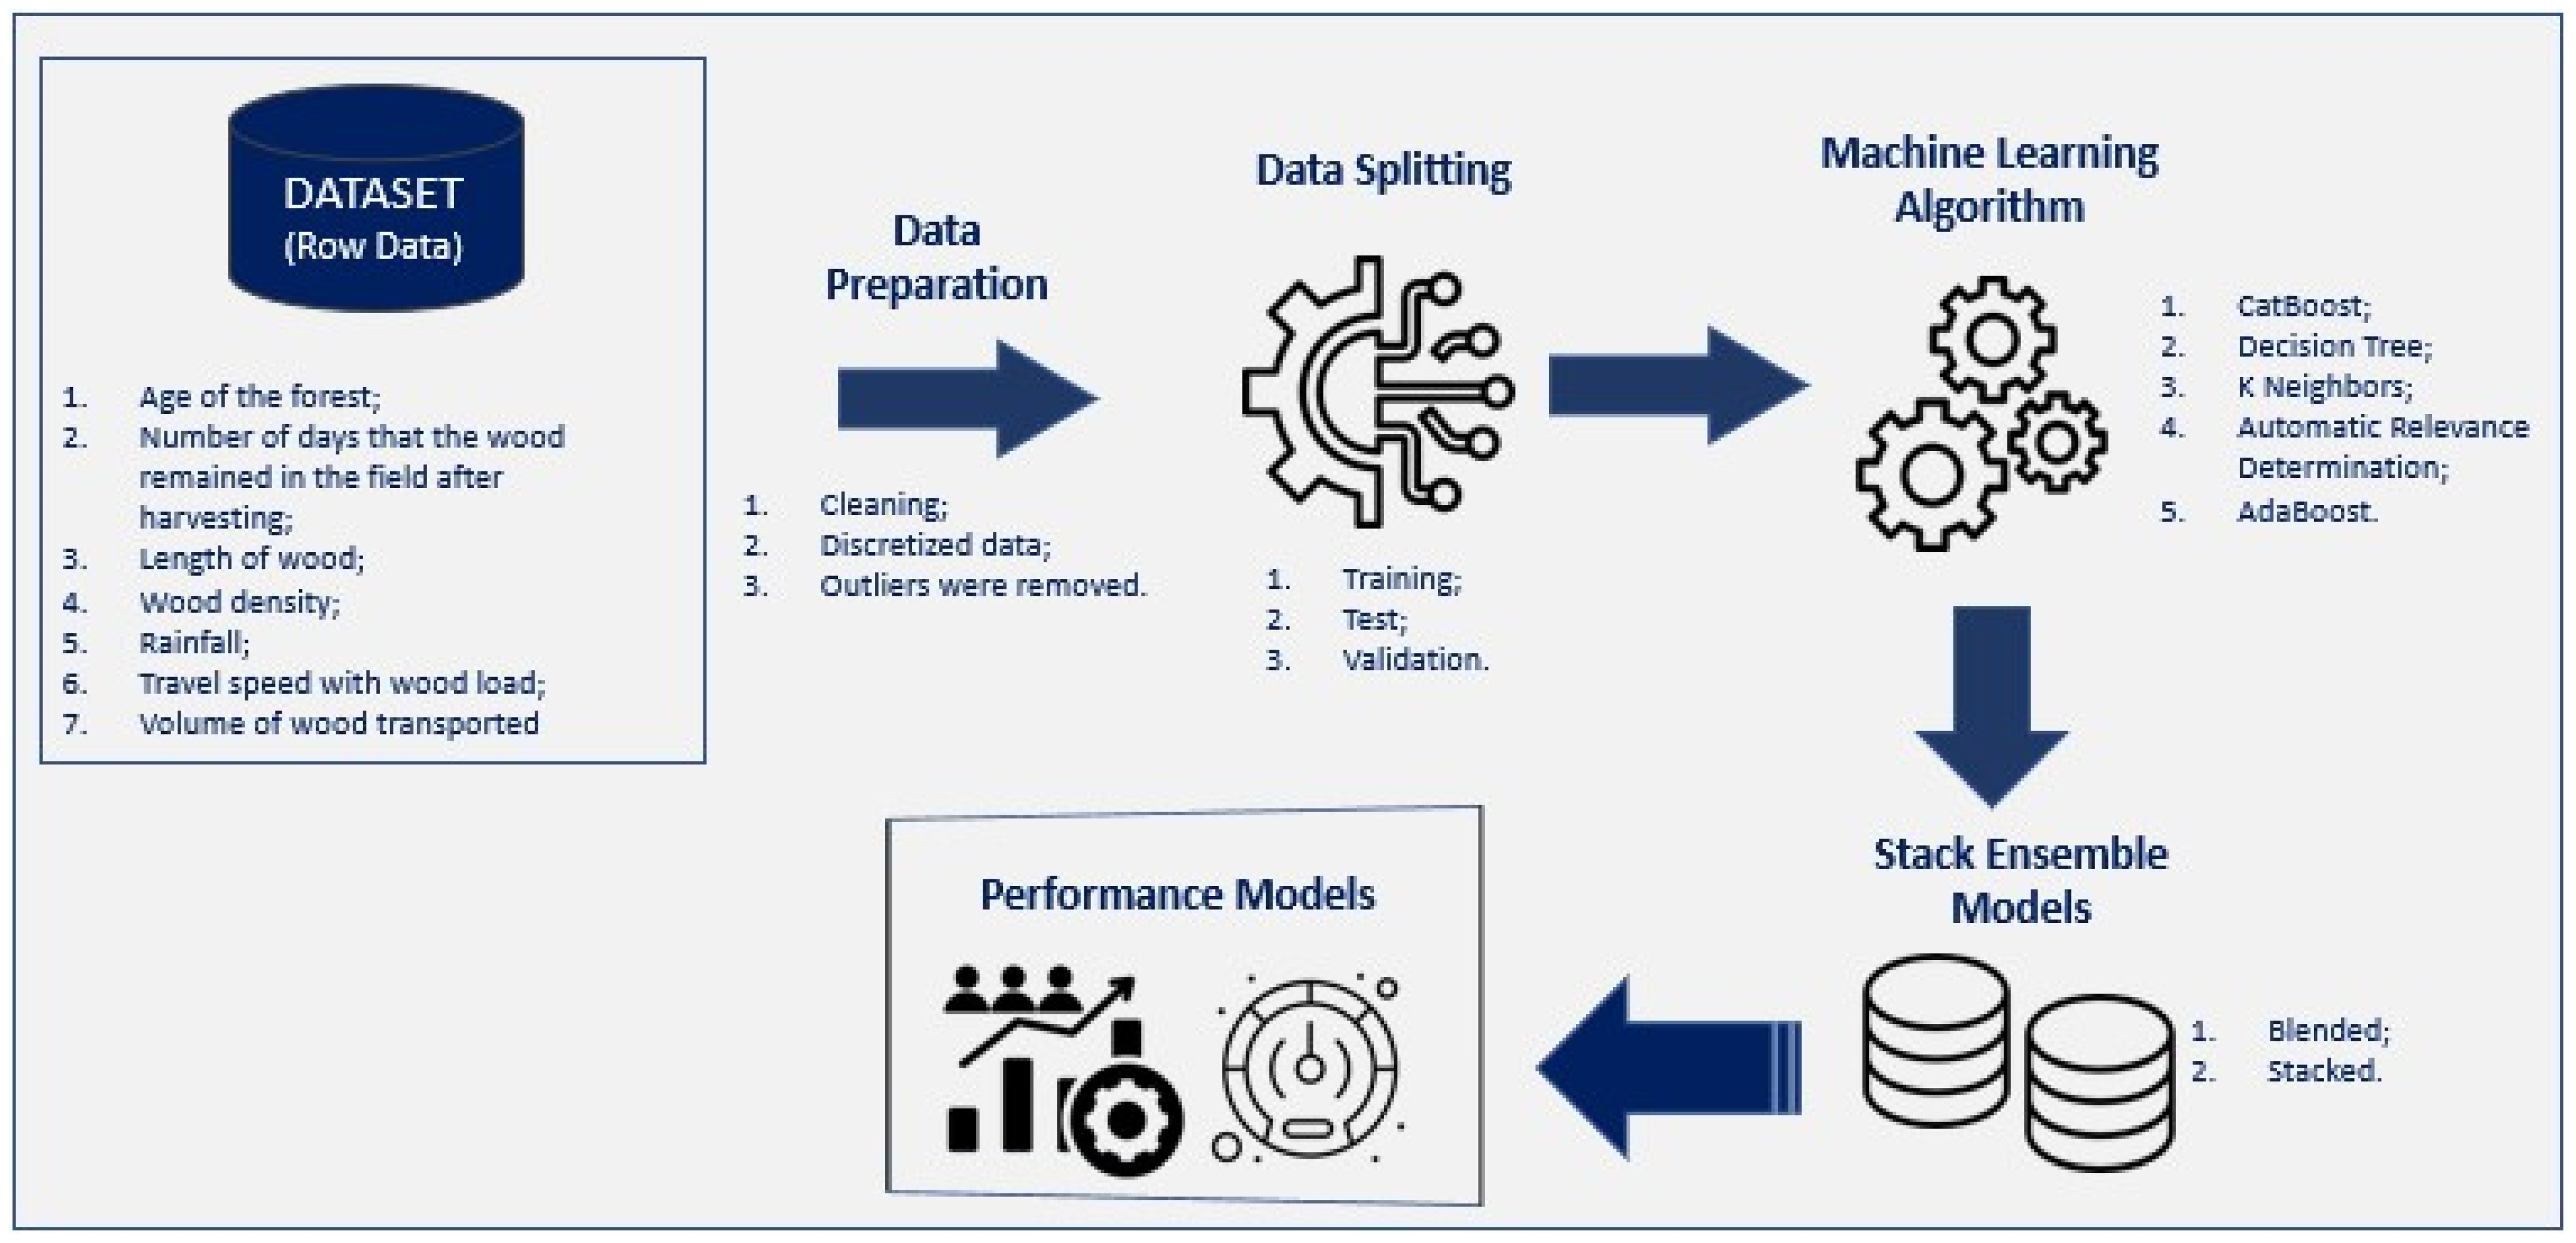
The prediction of the volume of wood transported was estimated using five categorical attributes: age of the forest, number of days that the wood remained in the field after harvesting, forest species, combinations of cargo vehicles, and length of wood. Three other numerical factors were added: wood density, rainfall, and displacement speed with the wood load. The target variable selected was the volume of wood transported (m3).
As they present a repetitive pattern, the forest age attribute was discretized, via clustering, into five categories. The number of days that the wood remained in the field after harvesting, length of wood, rainfall, and the speed of displacement with the wood load.
The dataset was composed of 26,761 instances and 10 attributes, which was partitioned into 90% for training the models and 10% for testing. A verification set is added with 1% of the observations from the initial set. To the detriment of the raw data obtained, outliers were removed.
Using the R programming language [
38], data wrangling routines were implemented for planning, managing, and detecting the quality of data to be consumed by machine learning algorithms. To create a balanced dataset, the oversampling technique was applied [
39]. Using the random forests algorithm [
40], the importance of the attributes for the modeling process was observed and, through the spearman correlation [
41], the parameters correlated with 5% of significance were excluded.
2.3. Model
In the automation of the machine learning workflow and model development, the PyCaret library [
42] of the Python programming language was used. From the built workflow, supervised learning regression models were tested and evaluated [
43,
44].
The performances of five algorithms in default mode were tested: CatBoost, Decision Tree, K Neighbors, Automatic Relevance Determination, and AdaBoost. These algorithms were compared, above all, for their methodological basis, algorithms based on gradient, decision tree, clustering, linear, and ensemble. After the performance evaluation in default mode, according to Schratz et al. [
45] and Andonie [
46], the hyperparameters were adjusted to optimize the folds, iteration, tuning process, estimator, and method.
We selected the best models generated from each methodological basis and these were combined Blend and Stack models processes. The models were ordered and stacked on the learnings together in a hierarchical data structure. In each set of folds, we applied k-fold cross-validation, in line with Ghorbanzadeh et al. [
47] and Arabameri et al. [
48].
We tested machine learning algorithms and selected them according to their performance in predicting the volume of wood to be transported, using universal metrics for evaluating the performance of models [
49,
50,
51,
52], such as Mean Squared Error (MSE), root mean squared error (RMSE), Root Mean Squared Logarithmic Error (RMSLE), mean absolute error (MAE), mean absolute percent error (MAPE), and coefficient of determination (R
2).
The actual performance of the selected model, five test subsets were created containing 100 randomly selected instances, thus applying the selected model over the test set and test subsets (
Figure 1).
3. Results
With the interquartile ranges (IQR) and the metrics of descriptive statistics, that is, mean, standard deviation (Sd), minimum (Min) and maximum (Max), skewness and kurtosis, the initial profile of the data were characterized. Consequently, it was also discriminated by through categorical variables, the outliers were evidenced (
Table 2).
With the remaining data instances of the outlier removal process, that is, with 26,052 data, the relative importance of the attributes was tested. It is noteworthy that the global importance of the density variable was present in 55.40% of the random forest algorithm adjustments, followed by the age of the forest and displacement speed with the wood load.
In 90% of the instances, 23,445 data were used for the training of the algorithms and 10% for the test. Furthermore, 1% of the initial dataset represented 2607 data instances for validation. The related attributes, per dataset, were not correlated with each other (p-value < 0.05).
Modeling
With the algorithms in default mode, the performances of the models with CatBoost Regressor, Decision Tree Regressor, and K Neighbors Regressor stood out (
Table 3).
Despite the mean absolute percent error being close, the three algorithms had the coefficient of determination maximized.
In addition to belong to different methodological basis, CatBoost Regressor, Decision Tree Regressor, and K Neighbors Regressor were selected mainly for providing minimal values to errors metrics and maximal values to determination coefficient.
After pre-processing the data and selecting the type of machine learning algorithm, the adjustment of the hyperparameters influences the results. We adjust the number of folds of the CatBoost Regressor, Decision Tree Regressor, and K Neighbors Regressor algorithms, permuting between 10, 20, 30, 40, or 50 folds. The algorithms CatBoost Regressor and Decision Tree Regressor were better adjusted with 50 folds, while for K Neighbors Regressor they were 30 folds (
Table 4).
The number of iterations (10, 20, 30, 40, or 50) and the adjustment process (Bayesian, Random, or Optuna) were also adjusted, also aiming to optimize performance metrics (
Table 5). It is worth mentioning the maintenance of the RMSLE and MAPE metrics.
We adjusted the value of the estimator hyperparameter (10, 20, 30, 40, or 50) and the sampling method between bagging and boosting. With the best performance in each adjustment, we selected the models (
Table 6), with the adjusted hyperparameters, to apply the learnings together.
With the models built individually from the combination of data and the algorithms with adjusted hyperparameters, we applied the joint learning techniques by blending and stacking ensemble models (
Table 7).
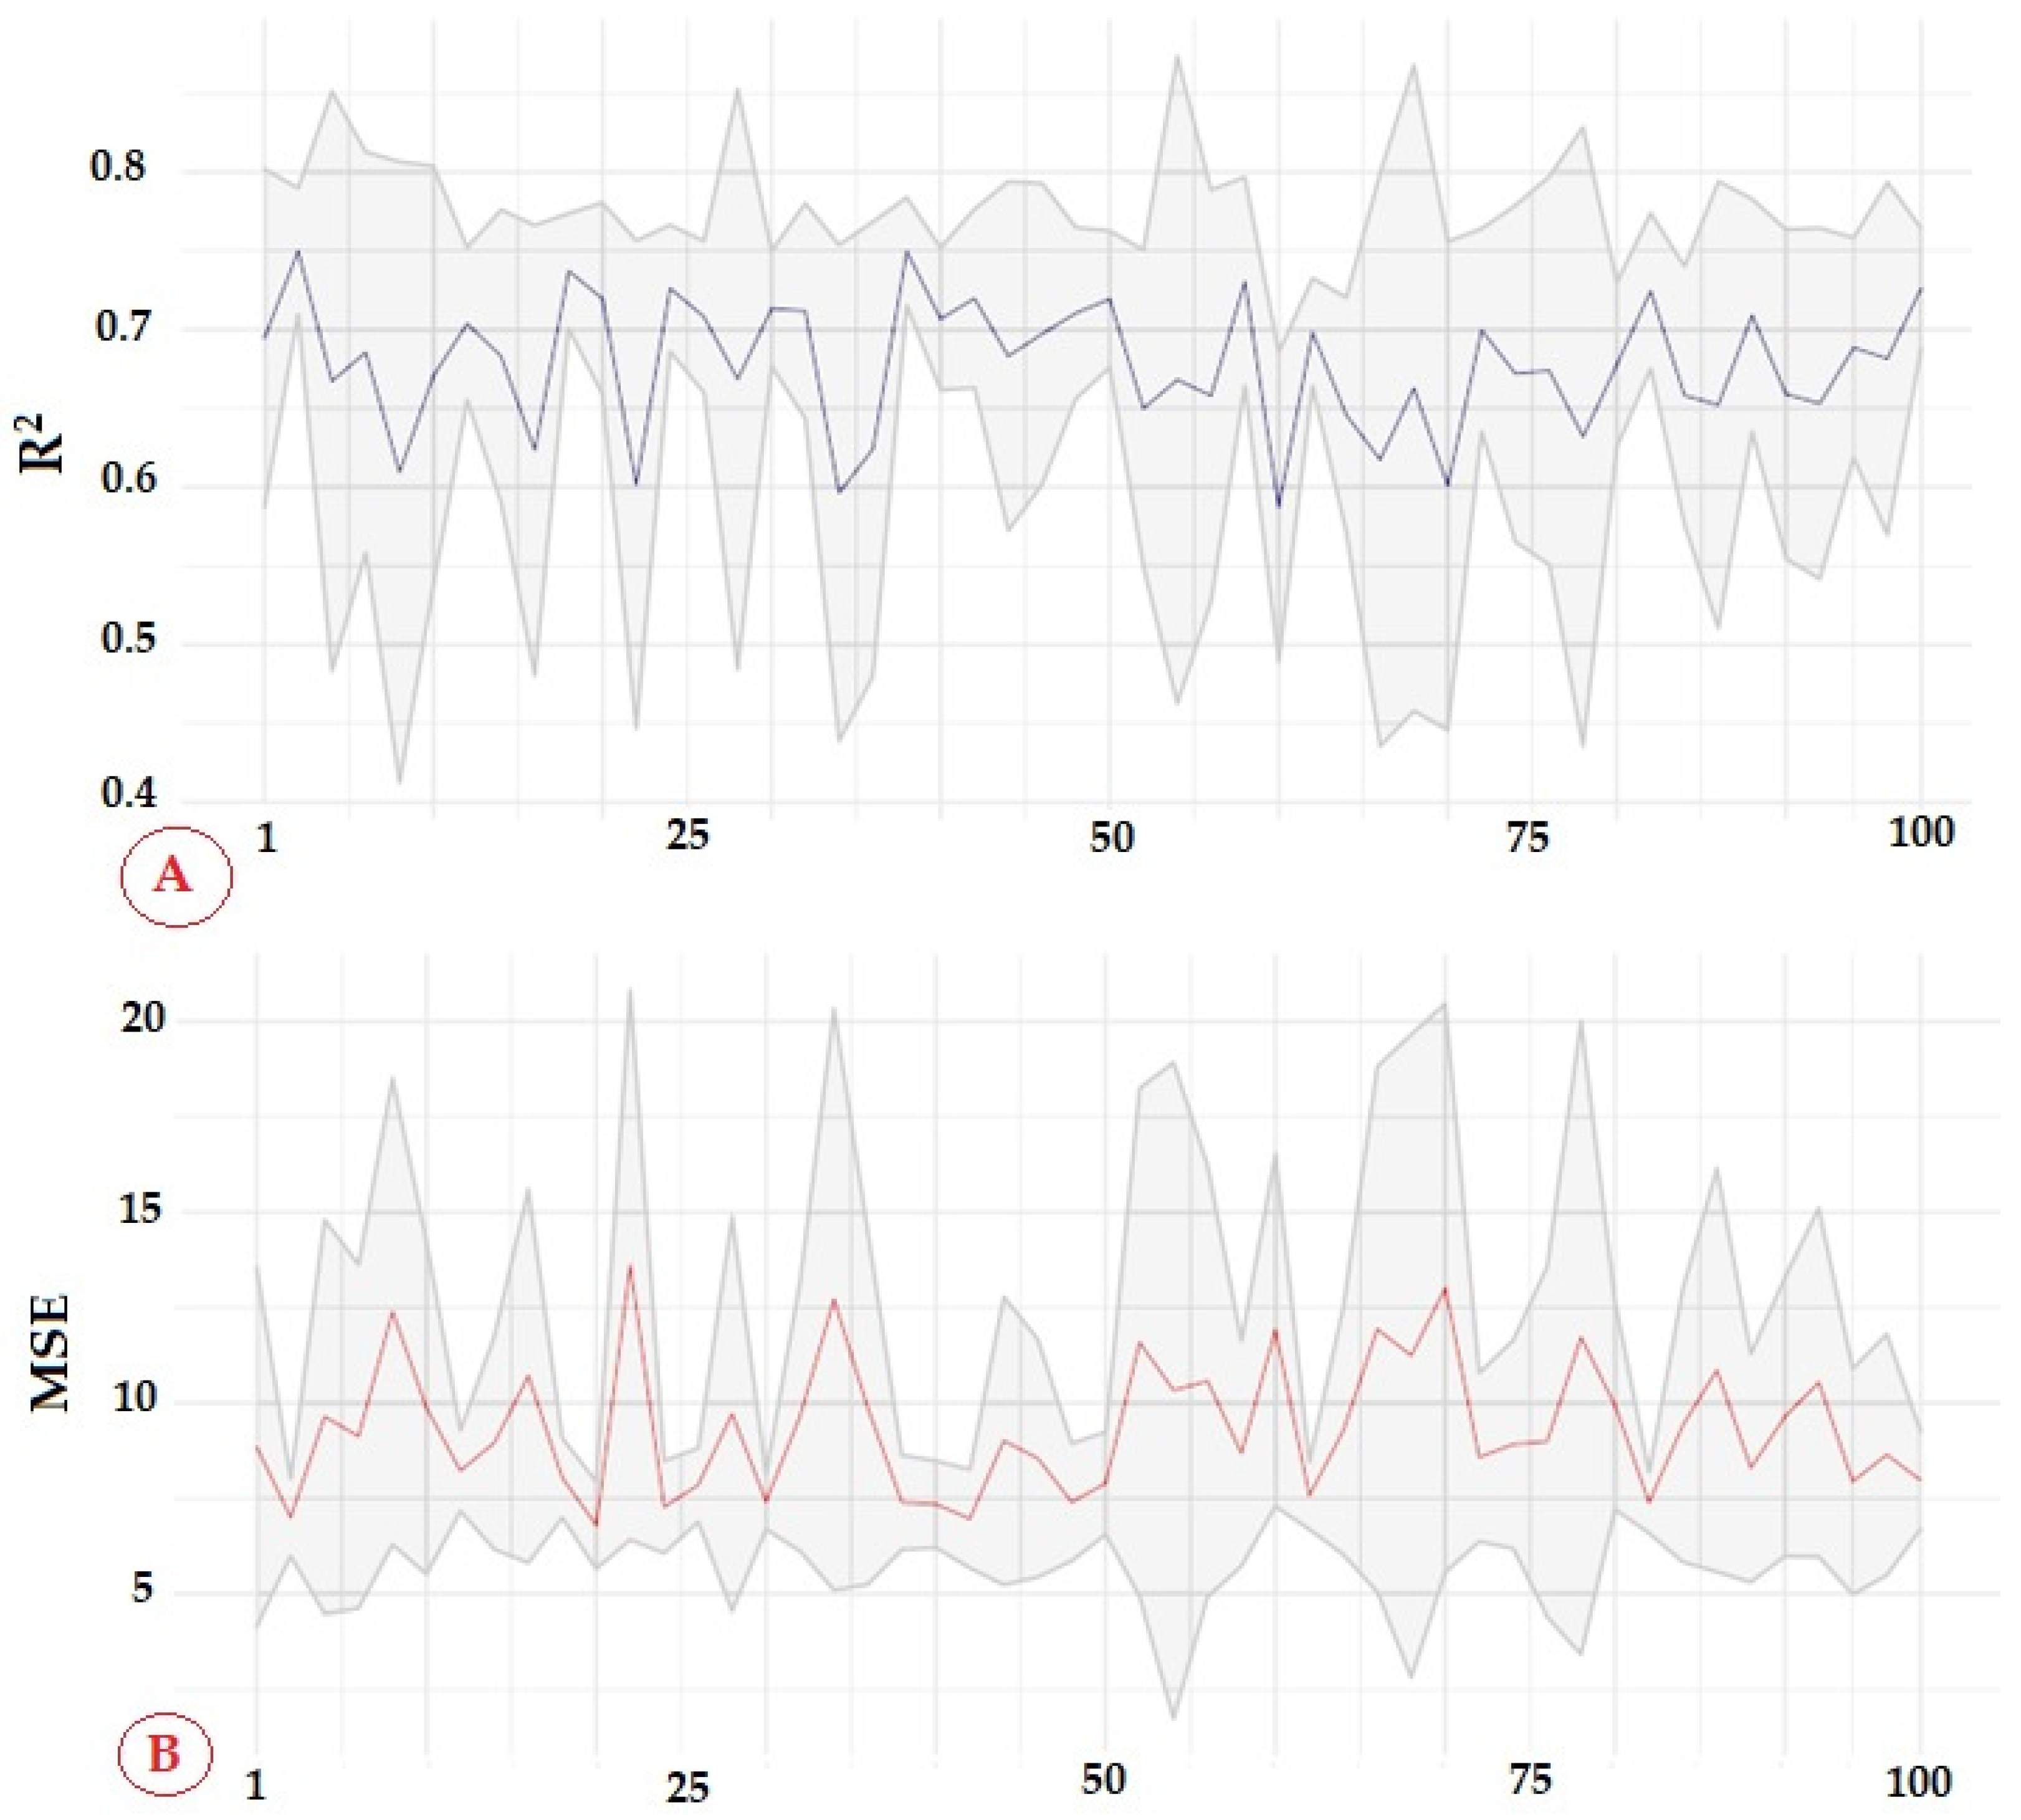
We simulated an application in an out-of-sample validation set, we estimated the average determination coefficient of the stack ensemble models in the 50 randomly generated samples and verified its consistency with the standard deviation (
Figure 2A). We verified the tendency to minimize the mean absolute percent error (
Figure 2B).
4. Discussion
The efficiency of road timber transport is primarily impacted by the volume of timber transported [
53,
54,
55,
56]. In the dataset evaluated, the association between the volume of wood transported with the attributes: age of the forest, number of days that the wood remained in the field after harvest, forest species, combinations of cargo vehicles, wood density, rainfall, and the displacement speed with wood load, guided the strategy of using it as a target variable.
Data as resources are essential to create resilience in the decision-making process to be deployed in the 4.0 forest. According to Visser [
57] and Wang et al. [
58] they support innovation, increase responsiveness, and assign flexibility to activity. However, they initially had to go through the data wrangling process. This step can be crucial for the feasibility of building the model, as it measures the health of the data and certifies adherence to its construction. Despite the criticality, only 3% of the dataset was not able to be ingested by the algorithms.
With the application of the random forest algorithm, it was possible to identify the classification of the relative importance of the weighted regressors for building the model, by increasing the precision, decreasing the unexplained variation (IncNodePurity). In order of importance for the models, the wood density was obtained.
Frisk et al. [
59] and Mobini et al. [
60] also identified the density of the material to be transported as one of the main factors in estimating target variables related to road transport, such as transport cost and transported volume. With the combination of wood density and other relevant attributes for predicting the volume of wood to be transported, with machine learning algorithms, the models were built.
Exploring the capacity of the different calculations used by machine learning algorithms enhances the chance of previously obtaining a model with a reasonable fit. For this reason, the five different calculation strategies of the five algorithms tested were used.
The strategy of using boosting, decision tree, and clustering algorithms stood out. To enhance the prediction of the volume of wood to be transported, the gain of information obtained by the nodes of the decision tree, the penalty of the combination of sequential trees, and the non-parametric strategy structured in the dataset were used.
The scope of the optimization even incorporated machine learning algorithms, since they were agnostic in nature. According to Ojha et al. [
61], they can be classified as evolutionary algorithms, as they allow a global optimization that iteratively guides a population towards a final population, solving several problems from the hyperparameter adjustment.
From the optimization of the hyperparameters, significant gains were noticed in the performance of the decision tree and KNN algorithms, the percentage increase in the coefficient of determination was 6% and 5%, respectively. On the other hand, as it has a more optimized structure, changes to the hyperparameters did not impact the performance of the CatBoost Regressor algorithm.
Furthermore, Zantalis et al. [
28] and Tsolaki et al. [
62] identified a gap in analyses that present the combination of different machine learning methods in solving transport problems. To increase the prediction of the volume of wood to be transported, joint learning by stack ensemble models was the method that returned the best performance.
The optimization of the volume of wood to be transported associated with the machine learning models mitigated the negative impacts of the absence of prior information in the strategic planning of forest managers. Through the application of the chosen model, the predictability of the volume to be transported provided support and evidence for the logistical capacity and performance, which were available.
5. Conclusions
Based on variables inherent to the wood transport process, we verified that machine learning models can act in the prediction of the volume of wood to be transported and support strategic decision-making.
The attributes of wood density, age of the forest, species, number of days that the wood remained in the field after harvesting, rainfall, and displacement speed with wood load are the attributes that make up the datasets of transport activities that impact the estimated volume of wood to be transported.
Among the learning models tested, the one learned by stack stands out with a coefficient of determination of 0.70 and an average absolute percentage error of 6%.
The predictability provided by machine learning methods applied on database from activity of road transport of wood offer support to strategic decision-making to forest managers.
In addition, having defined the essential variables, the model must be observed and adjusted always that results show huge discrepancies of the metrics evaluated. As dynamic environment, regular monitoring will provide an assertiveness of the choices made by forest managers.
Author Contributions
Conceptualization, R.A.M., D.S. and V.A.S.J.; methodology, R.A.M., D.S., R.O.A. and D.A.C.; software, R.A.M. and R.O.A.; validation, R.A.M., R.O.A., D.A.C., T.d.S., V.A.S.J. and D.S.; formal analysis, R.A.M., R.O.A. and D.A.C.; investigation, R.A.M., D.A.C. and T.d.S.; data curation, R.A.M. and R.O.A.; writing—original draft preparation, R.A.M., D.A.C., T.d.S. and V.A.S.J.; writing—review and editing, R.A.M., R.O.A., D.A.C., T.d.S., V.A.S.J. and D.S.; visualization.; supervision, D.S.; project administration, D.S. All authors have read and agreed to the published version of the manuscript.
Funding
This research received no external funding.
Data Availability Statement
All data are provided in the main manuscript. Contact the corresponding author if further explanation is required.
Acknowledgments
Conselho Nacional de Desenvolvimento Científico e Tecnológico (CNPq).
Conflicts of Interest
The authors declare no conflict of interest.
References
- Allaoui, H.; Guo, Y.; Sarkis, J. Decision support for collaboration planning in sustainable supply chains. J. Clean. Prod. 2019, 229, 761–774. [Google Scholar] [CrossRef]
- Aspland, E.; Gartner, D.; Harper, P. Clinical pathway modelling: A literature review. Health Syst. 2021, 10, 1–23. [Google Scholar] [CrossRef] [PubMed] [Green Version]
- Akhtari, S.; Sowlati, T. Hybrid optimization-simulation for integrated planning of bioenergy an biofuel supply chains. Appl. Energy 2020, 259, 114124. [Google Scholar] [CrossRef]
- Pereira, D.F.; Oliveira, J.F.; Carravilla, M.A. Tactical sales and operations planning: A holistic framework and a literature review of decision-making models. Int. J. Prod. Econ. 2020, 228, 107695. [Google Scholar] [CrossRef]
- George, B.; Walker, R.M.; Monster, J. Does Strategic Planning Improve Organizational Performance? A Meta-Analysis. Public Adm. Rev. 2019, 79, 810–819. [Google Scholar] [CrossRef]
- Teixeira, G.F.G.; Canciglieri Junior, O. How to make strategic planning for corporate sustainability? J. Clean. Prod. 2019, 230, 1421–1431. [Google Scholar] [CrossRef]
- Bolland, E.J. Evolution of Strategy: Origin, Planning, Strategic Planning and Strategic Management. In Strategizing; Emerald Publishing Limited: Bingley, UK, 2020; pp. 25–48. [Google Scholar] [CrossRef]
- Sara, I.M.; Saputra, K.A.K.; Utama, I.W.K.J. The Effects of Strategic Planning, Human Resource and Asset Management on Economic Productivity: A Case Study in Indonesia. J. Asian Financ. Econ. Bus. 2021, 8, 381–389. [Google Scholar] [CrossRef]
- Akhtari, S.; Sowlati, T.; Griess, V.C. Integrated strategic and tactical optimization of forest-based biomass supply chains to consider medium-term supply and demand variations. Appl. Energy 2018, 213, 626–638. [Google Scholar] [CrossRef]
- Laschi, A.; Foderi, C.; Fabiano, F.; Neri, F.; Cambi, M.; Mariotti, B.; Marchi, E. Forest road planning, construction and maintenance to improve forest fire fighting: A review. Croat. J. For. Eng. 2019, 40, 207–219. [Google Scholar]
- Schröder, T.; Lauven, L.P.; Sowlati, T.; Geldermann, J. Strategic planning of a multi-product wood-biorefinery production system. J. Clean. Prod. 2019, 211, 1502–1516. [Google Scholar] [CrossRef]
- Falcone, P.M.; Tani, A.; Tartiu, V.E.; Imbriani, C. Towards a sustainable forest-based bioeconomy in Italy: Findings from a SWOT analysis. For. Policy Econ. 2020, 110, 101910. [Google Scholar] [CrossRef]
- Conrad, J.L. Costs and challenges of log truck transportation in Georgia, USA. Forests 2018, 9, 650. [Google Scholar] [CrossRef] [Green Version]
- Kühmaier, M.; Erber, G. Research trends in European forest fuel supply chains: A review of the last ten years (2007–2016)—Part two: Comminution, transport & logistics. Croat. J. For. Eng. 2018, 39, 139–152. [Google Scholar]
- Mokhirev, A.P.; Pozdnyakova, M.O.; Medvedev, S.O.; Mammatov, V.O. Assessment of availability of wood resources using geographic information and analytical systems (the krasnoyarsk territory as a case study). J. Appl. Eng. Sci. 2018, 16, 313–319. [Google Scholar] [CrossRef]
- Keramati, A.; Lu, P.; Sobhani, A.; Haji Esmaeili, S.A. Impact of Forest Road Maintenance Policies on Log Transportation Cost, Routing, and Carbon-Emission Trade-Offs: Oregon Case Study. J. Transp. Eng. Part A Syst. 2020, 146, 04020028. [Google Scholar] [CrossRef]
- Koirala, A.; Kizha, A.R.; Roth, B.E. Perceiving Major Problems in Forest Products Transportation by Trucks and Trailers: A Cross-sectional Survey. Eur. J. For. Eng. 2017, 3, 23–34. [Google Scholar]
- Malladi, K.T.; Sowlati, T. Optimization of operational level transportation planning in forestry: A review. Int. J. For. Eng. 2017, 28, 198–210. [Google Scholar] [CrossRef]
- Johannes, E.; Ekman, P.; Huge-Brodin, M.; Karlsson, M. Sustainable timber transport-economic aspects of aerodynamic reconfiguration. Sustainability 2018, 10, 1965. [Google Scholar] [CrossRef] [Green Version]
- Olegovna Pozdnyakova, M.; Petrovich Mokhirev, A.; Ryabova, T.G. Comprehensive evaluation of technological measures for increasing availability of wood resources. J. Appl. Eng. Sci. 2018, 16, 565–569. [Google Scholar] [CrossRef]
- Sarrazin, F.; Lebel, L.; Lehoux, N. Analyzing the impact of implementing a logistics center for a complex forest network. Can. J. For. Res. 2019, 49, 179–189. [Google Scholar] [CrossRef]
- Hlatká, M.; Kampf, R.; Fedorko, G.; Molnár, V. Optimization of logistics processes during the production of wood chips. TEM J. 2020, 9, 889–898. [Google Scholar] [CrossRef]
- Biamonte, J.; Wittek, P.; Pancotti, N.; Rebentrost, P.; Wiebe, N.; Lloyd, S. Quantum machine learning. Nature 2017, 549, 195–202. [Google Scholar] [CrossRef] [PubMed]
- Batta, M. Machine Learning Algorithms—A Review. Int. J. Sci. Res. 2020, 9, 381–386. [Google Scholar] [CrossRef]
- Machine Learning and the City: Applications in Architecture and urban Design, 1st ed.; Carta, S. (Ed.) Wiley-Blackwell: Hoboken, NJ, USA, 2022; ISBN 978-1-119-74963-9. [Google Scholar]
- Athey, S. The Economics of Artificial Intelligence: An Agenda. In The Economics of Artificial Intelligence; Agrawal, A., Gans, J., Goldfarb, A., Eds.; University of Chicago Press: Chicago, IL, USA, 2019; pp. 507–547. ISBN 9780226613338. [Google Scholar]
- Ayoubi, S.; Limam, N.; Salahuddin, M.A.; Shahriar, N.; Boutaba, R.; Estrada-Solano, F.; Caicedo, O.M. Machine Learning for Cognitive Network Management. IEEE Commun. Mag. 2018, 56, 158–165. [Google Scholar] [CrossRef]
- Zantalis, F.; Koulouras, G.; Karabetsos, S.; Kandris, D. A review of machine learning and IoT in smart transportation. Futur. Internet 2019, 11, 94. [Google Scholar] [CrossRef] [Green Version]
- Verbraeken, J.; Wolting, M.; Katzy, J.; Kloppenburg, J.; Verbelen, T.; Rellermeyer, J.S. A Survey on Distributed Machine Learning. ACM Comput. Surv. 2020, 53, 1–33. [Google Scholar] [CrossRef] [Green Version]
- Lee, S.C.; Kim, J.H.; Hong, J.Y. Characterizing perceived aspects of adverse impact of noise on construction managers on construction sites. Build. Environ. 2019, 152, 17–27. [Google Scholar] [CrossRef]
- Ma, X.; Zhang, J.; Du, B.; Ding, C.; Sun, L. Parallel Architecture of Convolutional Bi-Directional LSTM Neural Networks for Network-Wide Metro Ridership Prediction. IEEE Trans. Intell. Transp. Syst. 2019, 20, 2278–2288. [Google Scholar] [CrossRef]
- Barua, L.; Zou, B.; Zhou, Y. Machine learning for international freight transportation management: A comprehensive review. Res. Transp. Bus. Manag. 2020, 34, 100453. [Google Scholar] [CrossRef]
- van Klompenburg, T.; Kassahun, A.; Catal, C. Crop yield prediction using machine learning: A systematic literature review. Comput. Electron. Agric. 2020, 177, 105709. [Google Scholar] [CrossRef]
- Liakos, K.G.; Busato, P.; Moshou, D.; Pearson, S.; Bochtis, D. Machine learning in agriculture: A review. Sensors 2018, 18, 2674. [Google Scholar] [CrossRef] [Green Version]
- Tizghadam, A.; Khazaei, H.; Moghaddam, M.H.Y.; Hassan, Y. Machine Learning in Transportation. J. Adv. Transp. 2019, 2019, 4359785. [Google Scholar] [CrossRef]
- Li, J.P.; Mirza, N.; Rahat, B.; Xiong, D. Machine learning and credit ratings prediction in the age of fourth industrial revolution. Technol. Forecast. Soc. Change 2020, 161, 120309. [Google Scholar] [CrossRef]
- Ibrahim, I.; Abdulazeez, A. The Role of Machine Learning Algorithms for Diagnosing Diseases. J. Appl. Sci. Technol. Trends 2021, 2, 10–19. [Google Scholar] [CrossRef]
- R Development Core Team. R: A language and environment for Statistical, statistical computing. In Vienna (Austria): R Foundation for Computing; R Development Core Team: Vienna, Austria, 2021; ISBN 3-900051-07-0. [Google Scholar]
- Munis, R.A.; Almeida, R.O.; Camargo, D.A.; Barbosa, R.; Wojciechowski, J.; Sim, D. Machine Learning Methods to Estimate Productivity of Harvesters: Mechanized Timber Harvesting in Brazil. Forests 2022, 13, 1068. [Google Scholar] [CrossRef]
- Chen, Y.; Dong, C.; Wu, B. Crown Profile Modeling and Prediction Based on Ensemble Learning. Forests 2022, 13, 410. [Google Scholar] [CrossRef]
- Bueno, G.F.; Costa, E.A.; Guimar, A.; Liesenberg, V. Machine Learning: Crown Diameter Predictive Modeling for Open-Grown Trees in the Cerrado Biome, Brazil. Forests 2022, 13, 1295. [Google Scholar] [CrossRef]
- PyCaret Org. 2021. Available online: https://pycaret.org/about (accessed on 10 July 2022).
- Borz, S.A.; Forkuo, G.O.; Oprea-sorescu, O.; Proto, A.R. Development of a Robust Machine Learning Model to Monitor the Operational Performance of Fixed-Post Multi-Blade Vertical Sawing Machines. Forests 2022, 13, 1115. [Google Scholar] [CrossRef]
- Dai, S.; Zheng, X.; Gao, L.; Xu, C.; Zuo, S.; Chen, Q.; Wei, X.; Ren, Y. Improving plot-level model of forest biomass: A combined approach using machine learning with spatial statistics. Forests 2021, 12, 1663. [Google Scholar] [CrossRef]
- Schratz, P.; Muenchow, J.; Iturritxa, E.; Richter, J.; Brenning, A. Hyperparameter tuning and performance assessment of statistical and machine-learning algorithms using spatial data. Ecol. Modell. 2019, 406, 109–120. [Google Scholar] [CrossRef] [Green Version]
- Andonie, R. Hyperparameter optimization in learning systems. J. Membr. Comput. 2019, 1, 279–291. [Google Scholar] [CrossRef] [Green Version]
- Ghorbanzadeh, O.; Shahabi, H.; Mirchooli, F.; Valizadeh Kamran, K.; Lim, S.; Aryal, J.; Jarihani, B.; Blaschke, T. Gully erosion susceptibility mapping (GESM) using machine learning methods optimized by the multi-collinearity analysis and K-fold cross-validation. Geomat. Nat. Hazards Risk 2020, 11, 1653–1678. [Google Scholar] [CrossRef]
- Arabameri, A.; Arora, A.; Pal, S.C.; Mitra, S.; Saha, A.; Nalivan, O.A.; Panahi, S.; Moayedi, H. K-Fold and State-of-the-Art Metaheuristic Machine Learning Approaches for Groundwater Potential Modelling. Water Resour. Manag. 2021, 35, 1837–1869, ISBN 1126902102815. [Google Scholar] [CrossRef]
- Mitchell, T.M. Machine Learning, 1st ed.; McGraw-Hill Science/Engineering/Math: New York, NY, USA, 1977; ISBN 978-0070428072. [Google Scholar]
- Arjasakusuma, S.; Kusuma, S.S.; Phinn, S. Evaluating variable selection and machine learning algorithms for estimating forest heights by combining lidar and hyperspectral data. ISPRS Int. J. Geo-Information 2020, 9, 507. [Google Scholar] [CrossRef]
- Lenherr, N.; Pawlitzek, R.; Michel, B. New universal sustainability metrics to assess edge intelligence. Sustain. Comput. Informatics Syst. 2021, 31, 100580. [Google Scholar] [CrossRef]
- Štambuk, N. Universal Metric Properties of the Genetic Code. Croat. Chem. Acta 2000, 73, 1123–1139. [Google Scholar]
- Picchio, R.; Tavankar, F.; Venanzi, R.; Lo Monaco, A.; Nikooy, M. Study of forest road effect on tree community and stand structure in three italian and Iranian temperate forests. Croat. J. For. Eng. 2018, 39, 57–70. [Google Scholar]
- Lotfalian, M.; Peyrov, S.; Adeli, K.; Pentek, T. Determination of Optimal Distribution and Transportation Network. Croat. J. For. Eng. 2022, 43, 313–323. [Google Scholar] [CrossRef]
- Jamhuri, J.; Norizah, K.; Mohd Hasmadi, I.; Azfanizam, A.S. Bees algorithm for Forest transportation planning optimization in Malaysia. Forest Sci. Technol. 2021, 17, 88–99. [Google Scholar] [CrossRef]
- Rix, G.; Rousseau, L.M.; Pesant, G. A column generation algorithm for tactical timber transportation planning. J. Oper. Res. Soc. 2014, 66, 278–287. [Google Scholar] [CrossRef]
- Visser, R.; Obi, O.F. Automation and Robotics in Forest Harvesting Operations. Croat. J. For. Eng. 2021, 42, 13–24. [Google Scholar] [CrossRef]
- Wang, M.; Wood, L.C.; Wang, B. Transportation capacity shortage influence on logistics performance: Evidence from the driver shortage. Heliyon 2022, 8, e09423. [Google Scholar] [CrossRef] [PubMed]
- Frisk, M.; Göthe-Lundgren, M.; Jörnsten, K.; Rönnqvist, M. Cost allocation in collaborative forest transportation. Eur. J. Oper. Res. 2010, 205, 448–458. [Google Scholar] [CrossRef] [Green Version]
- Mobini, M.; Sowlati, T.; Sokhansanj, S. Forest biomass supply logistics for a power plant using the discrete-event simulation approach. Appl. Energy 2011, 88, 1241–1250. [Google Scholar] [CrossRef]
- Ojha, V.; Timmis, J.; Nicosia, G. Assessing ranking and effectiveness of evolutionary algorithm hyperparameters using global sensitivity analysis methodologies. Swarm Evol. Comput. 2022, 74, 101130. [Google Scholar] [CrossRef]
- Tsolaki, K.; Vafeiadis, T.; Nizamis, A.; Ioannidis, D.; Tzovaras, D. Utilizing machine learning on freight transportation and logistics applications: A review. ICT Express 2022, in press. [Google Scholar] [CrossRef]
| Publisher’s Note: MDPI stays neutral with regard to jurisdictional claims in published maps and institutional affiliations. |
© 2022 by the authors. Licensee MDPI, Basel, Switzerland. This article is an open access article distributed under the terms and conditions of the Creative Commons Attribution (CC BY) license (https://creativecommons.org/licenses/by/4.0/).

 ,
, 

