Article

Environmental Factors Driving the Transpiration of a Betula platyphylla Sukaczev Forest in a Semi-arid Region in North China during Different Hydrological Years

1
College of Forestry, Inner Mongolia Agricultural University, Hohhot 010019, China
2
National Orientation Observation and Research Station of Saihanwula Forest Ecosystem in Inner Mongolia, Daban, Chifeng 025000, China
3
Research Institute of Forest Ecology, Environment and Protection, Chinese Academy of Forestry, Key Laboratory of Forest Ecology and Environment of the State Forestry Administration of China, Beijing 100091, China
4
Inland Waters Unit, Ontario Ministry of Environment, Conservation and Parks, Dorset, ON P0A 1E0, Canada
5
College of Grassland, Resources and Environment, Inner Mongolia Agricultural University, Hohhot 010011, China
6
Inner Mongolia Saihanwula National Natural Reserve Administration, Daban, Chifeng 025000, China
*
Author to whom correspondence should be addressed.
Forests 2022, 13(10), 1729; https://doi.org/10.3390/f13101729
Submission received: 5 August 2022 / Revised: 14 October 2022 / Accepted: 18 October 2022 / Published: 20 October 2022
(This article belongs to the Section Natural Hazards and Risk Management)

Abstract

:
More and more droughts happened during the last decades, threatening natural forests in the semi-arid regions of North China. The increase in drought pressure may have an impact on stand transpiration (T) in semi-arid regions due to rising temperature and changes in precipitation. It is unclear how the transpiration of natural forest in semi-arid regions respond to drought, which is regulated by environmental factors. In this study, a relatively simple but mechanism-based forest stand T model that couples the effects of the reference T, solar radiation (Rn), vapor pressure deficit (VPD), and relative extractable water (REW) in the 0–80 cm soil layer was developed to quantify the independent impacts of Rn, VPD, and REW on T. The model was established based on the observed sap flow of four sample trees, and environmental factors were observed from May to September in different hydrological years (2015, 2017, 2018, and 2021) in a pure white birch (Betula platyphylla Sukaczev) forest stand in the southern section of the Greater Khingan Mountains, northeastern China. The sap flow data were used to calculate tree transpiration (Tt) and T to calibrate the T model. The results indicated that (1) The Tt sharply declined in the ‘dry’ year compared with that in the ‘wetter’ year. The daily Tt for small trees in the ‘dry’ year was only one-fifth of that in the ‘wetter’ year, and the daily Tt of large trees was 48% lower than that in the ‘normal’ year; (2) Large trees transpired more water than small trees, e.g., the daily Tt of small trees was 89% lower than that of the large trees in the ‘normal’ year; (3) Daily T increased with the increase in Rn, and the response conformed to a binomial function. Daily T responded to the rise of VPD and REW in an exponential function, first increasing rapidly, gradually reaching the threshold or peak value, and then stabilizing; (4) The driving factors for the T shift in different hydrological years were the REW in the ‘dry’ year, but the Rn and REW in the ‘wet’, ‘normal’, and ‘wetter’ years. The REW in the ‘wet’ and ‘wetter’ years exerted positive effects on T, but in the ‘normal’ and ‘dry’ year, exerted negative effects on T. Thus, the environmental factors affecting T were not the same in different hydrological years.

1. Introduction

Drought acts as an independent stressor, depleting ecosystem water resources with devastating effects on the environment [1]. Drought reduces tree vigor, making forests more vulnerable to insects and pathogens [2]. Warmer temperatures during droughts can exacerbate water depletion through higher evaporative demands or through increased respiration of carbon starvation [3]. The natural mountain forests in semi-arid areas are widely affected by drought [4]. Due to large climatic gradients and interannual fluctuations in semi-arid regions and due to the uneven distribution of precipitation, large areas of white birch forests have experienced climate-driven decline and death [5,6]. Tree transpiration plays a determining role in the water balance of forest stands and in water yields from forested catchments [7]. It is also central to the construction of an ecosystem-level water balance [8]. A better understanding of the effects of environmental factors on stand transpiration (T) will aid in the assessment of T changes under the influence of climate change. Therefore, the accurate calculation and prediction of T and its changing pattern, as well as revealing the relationship between T and environmental factors are helpful to deeply understand the relationship between forest and water and to provide guidance for local vegetation restoration and forest water management.
Monitoring the response of tree species to growing season drought over several years allows a better understanding of not only how plants cope with extreme events but also how these events affect species [9]. The measurement of sap flow is widely used to evaluate water consumption over different time intervals [10,11,12]. In addition, this methodology has been used at different biological scales ranging from individuals [13] to the entire forest canopy [10,14]. Sap flow is controlled by both environmental and physiological factors. Physiological factors mainly include tree size [15] and leaf area index (LAI) [16], while environmental factors mainly include meteorological factors such as air temperature, rainfall, vapor pressure deficit (VPD), and solar radiation (Rn), as well as the soil moisture content, edaphic features, groundwater table, and others [12]. Evaporative demand, available energy, and water availability can be reflected by environmental factors [12]. Meteorological factors are the main power source of tree transpiration, among which Rn and VPD have direct effects on T [17,18,19]. VPD reflects the level of atmospheric evaporative demand for water vapor, and Rn provides the available energy for sap flow [12]. Soil moisture is the main source of water for T, and the effect on T depends on the water available in the soil [20]. Soil water was reported as being important during periods of low rainfall [21,22,23], such that transpiration was reduced when the plant’s available water in the soil was depleted [24]. REW (relative extractable water) reflects the water that can be absorbed and utilized by plant roots [25], and as REW increases, the water available to trees and the leaf water potential increase, as does transpiration [26].
However, at different scales, the environmental factors affecting tree sap flow will change significantly, which in turn affects tree transpiration (Tt) and T. At present, there are many studies on the responses of Tt and T to environmental factors at different time scales. For example, Wan et al. [27] studied the transpiration of Qinghai spruce (Picea crassifolia Kom.) among canopy layers and found that T was strongly influenced by potential evapotranspiration (PET) and soil moisture. A study reported by Li et al. [28] revealed that with increasing REW, T initially increased quickly and almost linearly. Tie et al. [12] found that the key environmental factor controlling Aspen (Populus davidiana Dode.) sap flow in the subhumid mountainous region of North China was photosynthetically active radiation. Li et al. [29] found that daily evapotranspiration was mainly dominated by soil moisture in the hot-dry season and was controlled by environmental factors in the mid-to-late rainy season and cool-dry season at a tropical rain forest site in Xishuangbanna, southwestern China. The main environmental factors affecting the sap flow of Salix psammophila C. Wang et Ch. Y. Yang in semi-arid regions are Rn, relative humidity, and wind speed [30]. However, there were no significant correlations between T and the soil water content in Populus euphration Oliv. and Tamarix chinensis Lour., 1790 forests in arid regions [31]. As a result, the impact of each environmental factor on sap flow varies with climatic region, species, and the age of trees [19]. T is closely related to environmental factors. Atmospheric factors and the soil water content are the two main components that affect transpiration [32]. Among atmospheric factors, Rn and VPD have direct effects on tree water use [23,33,34]. In semi-arid areas, an in-depth understanding of the relationship between forests and water is not yet achieved [35]. This requires determining the forest water consumption capacity and understanding the regulatory mechanisms by which trees respond to environmental stress.
Various methods of obtaining forest T are available, and field observations and modeling are the two most commonly used methods. However, complete and accurate field data are often limited. Simple empirical models have been widely used for T estimation in different forest types because of their simple structures and easily acquired key parameters, for example, Whitley et al. [36] used a modified Jarvis–Stewart modeling approach that was previously used [37] to calculate canopy conductance to calculate T for the native tree species Eucalyptus crebra F. V. Muell. and Callitris glaucophylla F. Muell. in Australia. Three environmental variables, namely, solar radiation, VPD, and the soil moisture content, plus LAI, were used to calculate T, using measured rates of tree water use to parameterize the model. Functional forms for the model were derived with the use of a weighted non-linear least squares fitting procedure. The model is able to give T estimates comparable to sap flow measurements. Yu et al. [38] established an improved Jarvis–Stewart model to quantify the independent contribution of RSWC (relative soil water content) in different soil layers to T. The impacts of soil moisture that are coupled in the Jarvis–Stewart model can genuinely reflect the environmental influence and can be used to quantify the contributions of soil moisture to T. Petzold et al. [39] investigated transpiration and its main driving factors in a hybrid poplar plantation with the clone Populus maximowiczii A. Henry at a site in the hilly loess region of Saxony (Germany). They discovered the main controlling factors for T included the evaporative demand, water availability, and soil temperature. The information was implemented into a simple empirical model for the prediction of transpiration. Thus, the development of a simple empirical T model, which can reflect the response mechanisms of T to dominant factors, is expected to accurately quantify the impacts of major factors.
White birch (Betula platyphylla Sukaczev) is one of the typical tree species in the studied semi-arid region of Northeast China and plays an important role in soil and water conservation. White birch was chosen because it is one of the typical forest species in the region and is extremely susceptible to drought. This study focused on the environmental controls on transpiration. Our goals are (1) to understand the tree transpiration variation characteristics and tree size-specific responses in dry years with varying intensities and (2) to determine the contribution of environmental factors (Rn, VPD, and REW) to T in dry years with varying intensities.

2. Materials and Methods

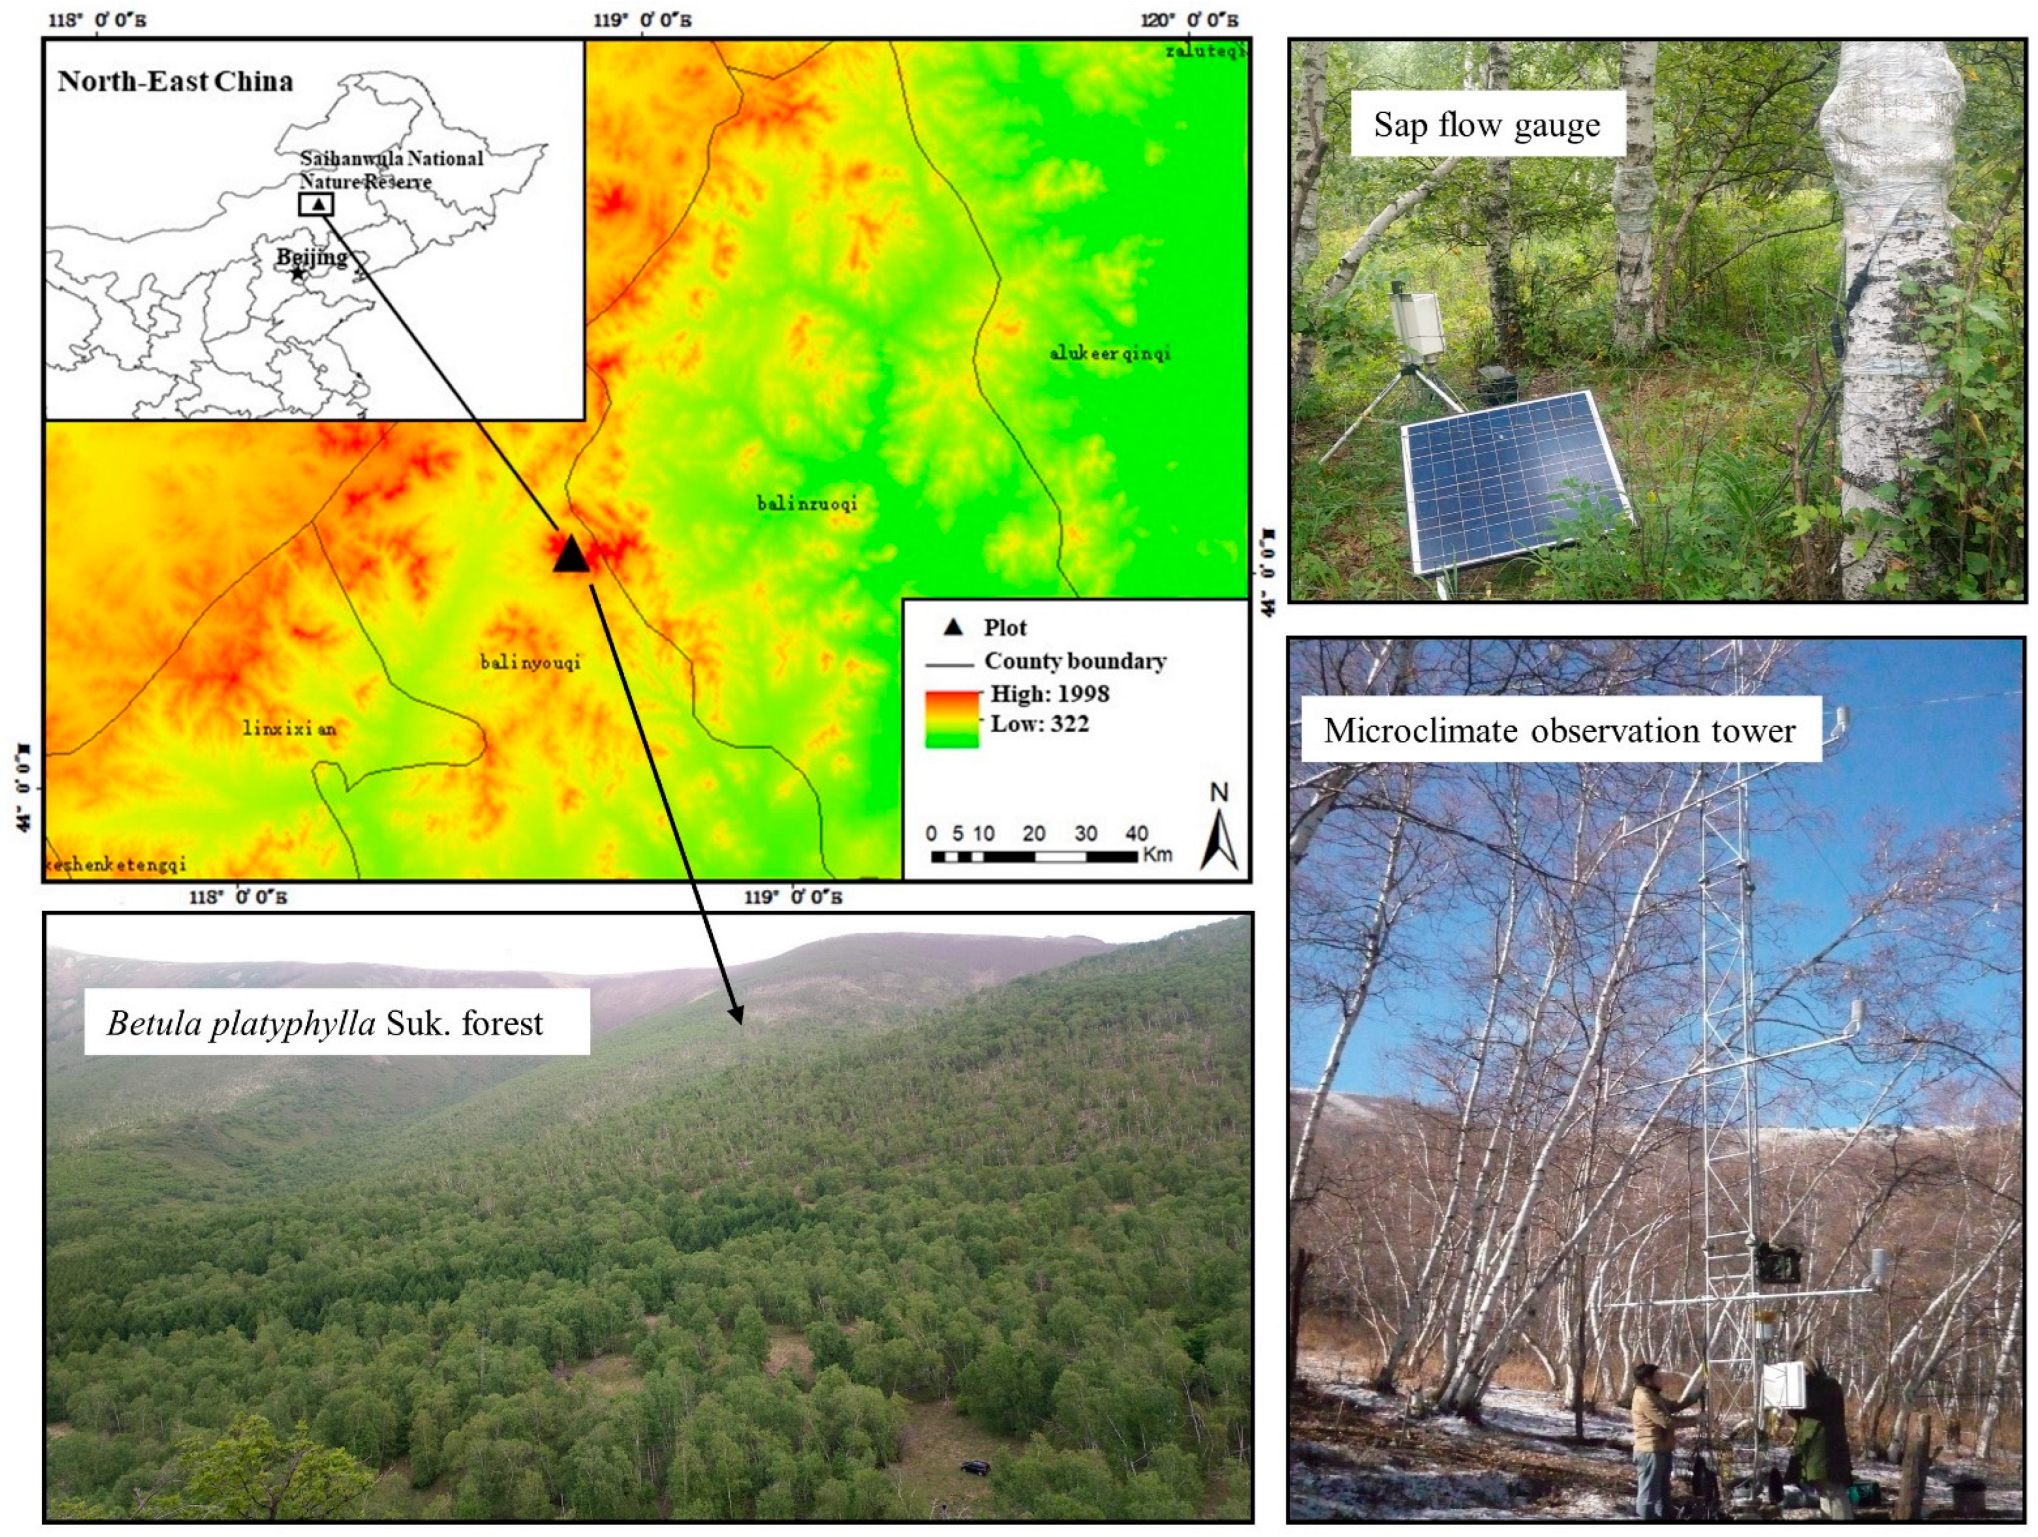
2.1. Study Area and Sample Trees

This study was carried out in the Saihanwula National Nature Reserve in Inner Mongolia (118°18′~118°55′ east longitude, 43°59′~43°27′ north latitude, 1000–1997 m above sea level) (Figure 1) in the southern section of the Greater Khingan Mountains, China. It is a dual transition zone from East Asian broad-leaved forest to cold-temperate coniferous forest of the Greater Khingan Mountains and from grassland to forest, in a mid-temperate semi-arid climate zone. The soil at this study site is dark brown forest soil with a depth ranging from 30 to 80 cm, and the soil porosity is about 50%–60% [40]. The growing season usually lasts from early May to early October. The long-term average annual precipitation is 375 mm, mostly falling from June to September. The annual average temperature is 1.54 °C, and the highest monthly average temperature is 20.5 °C and the lowest is −23.2 °C (based on rainfall and temperature data of 1986–2015 from the Climatic Research Unit).
The vegetation types of the Saihanwula National Nature Reserve are very complex. Its top is sub-alpine meadow vegetation. From high altitude to low altitude, the forest vegetation is distributed in turn, including evergreen coniferous forest Picea meyeri Rehd. et Wils. and summer green coniferous forest Larix principis rupprechtii Mayr., which grow on the mountain shady slope of 1700–1800 m in the Saihanwula National Nature Reserve, with a canopy density of more than 80%, in addition to a developed moss layer with a coverage of 90% [40]. From the top of the mountain down, the coniferous forest transitions to summer green broad-leaved forest, including white birch (Betula platyphylla Sukaczev) and aspen (Populus davidiana Dode.). Betula platyphylla forest has the largest distribution area, and its canopy closure is about 70%. Along the mountain valleys, there are Populus cathayana Rehd., Ulmus laciniata Mayr., and Salix rorida Laksch., etc., usually accompanied by mountain sparse forest vegetation, mainly Ulmus pumila L., Malus bacata Borkh. and Crataegus pinnatifida Bge. var. psilosa Schneid.). Ulmus macrocarpa Hance. is also distributed on the steeper shady slopes of the mountains, often mixed with Armeniaca sibirica L. shrubs, with a canopy density of 60%. As the north is high and the south is low, it gradually transitions down to grassland and meadow vegetation. There are continuous rivers in the mountains and valleys, with willow forests and shrubs on both sides. Most of them have been reclaimed as planted forests. Crossing the valley to the sunny slope of the mountain, the most developed plants are Quercus mongolica Fisch. ex Ledeb. and Armeniaca sibirica L. shrubs [40].
The experiment was carried out on a plot of 30 × 30 m2 (118°42′29.17″ E, 44°11′28.67″ N; 1387 m a.s.l.; Figure 1), as a small long-term experimental forest. The altitude ranged from 1300 to 1400 m, located on a SW–NE facing slope with a slope gradient of 23°. The major species of the forest stand is white birch, forming a relatively pure birch stand, with a stand density of 1100 ha−1. The average tree diameter at breast height (DBH, cm) is 18.56 ± 5.22 cm, and the average tree height is 13.40 ± 4.34 m.
All 115 white birch trees in this research plot were divided into four classes based on the tree diameter at breast height, i.e., small (DBH < 15 cm), medium1 (15 < DBH < 18 cm), medium2 (18 < DBH < 21), and large (DBH > 21 cm) classes. Trees from the small diameter class had an average tree DBH of 13.1 ± 1.4 cm. There were 26 small trees, occupying 23% of all trees in the plot, and their total sapwood area was 1595.18 cm2, accounting for 9% of the total plot sapwood area. The sapwood area of the medium1 diameter class trees was 2930.22 cm2, accounting for 16% of the total plot sapwood area. The sapwood area of the medium2 diameter class trees was 5152.45 cm2, accounting for 28% of the total plot sapwood area. The sapwood area of the large diameter class trees was the largest, 8427.86 cm2, five times that of the small diameter class, accounting for 47% of the total plot sapwood area. For each diameter class, we selected a sample tree that was well-grown and close to the average DBH of that diameter class to observe the sap flow, as presented in Table 1 that shows specific sample tree information.

2.2. Sapwood Area Measurement

DBH at breast height (1.3 m aboveground) was measured on 42 trees spanning the range of tree sizes (14–23 cm DBH) present at the study site, and tree cores were collected from individual trees to determine the sapwood thickness of white birch. The boundary between sapwood and heartwood was identified by color differences. Sapwood thickness was obtained by measuring the length of the sapwood, and sapwood thickness was then converted to sapwood area (As, cm2). As was calculated from stem diameter, sapwood thickness, and mean bark thickness. The relationship between DBH and As was calculated with a power function (1):
A s = 0.2 DBH 2.2351 ,   R 2 = 0.88
This relationship was used to estimate the As of sample trees across the site on the basis of DBH measurements, shown in Table 1.

2.3. Division of Hydrological Years

In the period from 2015–2021, the annual precipitation varied from 223 mm to 560 mm in the study area, where the mean annual precipitation from 1986 to 2015 was 375 mm. When annual precipitation is less than 75% of the average annual precipitation, it is defined as a ‘dry’ year; if less than 90% it is defined as a ‘drier’ year; falling into −10% to 10% is a ‘normal’ year; if more than 10%, it is a ‘wet’ year; and if more than 25% it is a ‘wetter’ year. The annual precipitation in 2018 was 222.7 mm and thus 2018 was identified as a ‘dry’ year. Year 2017 was a ‘normal’ year, with annual precipitation of 394 mm; 2015 was a ‘wet’ year, with annual precipitation of 444.7 mm, and 2021 was a ‘wetter’ year, with annual precipitation of 560.4 mm (Table 2). In the remainder of this article, we refer to years as “hydrological years”, which include “dry”, “normal”, “wet”, and “wetter” years. We selected the sap flow measurement data for the growing season (May–September) in 4 years, and the 4 years represented a ‘wet’ year (2015), a ‘normal’ year (2017), a ‘dry’ year (2018), and a ‘wetter’ year (2021).

2.4. Meteorological Measurements and Soil Moisture

Meteorological data were obtained from the 21-m-high microclimate observation tower installed in the study area (installed in 2011, and the distance to the study plot is about 400 m). In-situ data from the microclimate observation tower were used for analysis, including precipitation (TE525MM, Texas Electronics Inc., Dallas, TX, USA), air temperature (HMP155A, Vaisala, Helsinki, Finland), relative humidity (HMP155A, Vaisala, Helsinki, Finland), solar radiation (CNR4, Kipp&Zonen, Delft, The Netherlands), etc. A net radiation sensor (CNR4) was installed at 1.5 m height in an open spot outside the monitored forest stand. All other sensors for meteorological data were installed within the stand. All data were collected every 5 s, and 30 min averages were recorded in a data logger (CR1000, Campbell Scientific Inc., Logan, UT, USA).
The vapor pressure deficit (VPD, kPa) is a comprehensive factor of air temperature ( T a , °C) and relative humidity ( RH , %), calculated using Equation (2) [41]:
VPD = 0.611 × Exp ( 17.502 T a 240.97 + T a ) × ( 1 RH )
The REW was calculated as the ratio of the actual extractable water to the maximum extractable water [10] according to Formula (3). Soil moisture sensors (CS616-L50, Campbell Scientific, Utah, USA) were installed at soil depth intervals of 0–5 cm, 5–10 cm, 10–20 cm, 20–40 cm, and 40–80 cm to monitor the volumetric soil moisture (VSM) in the root zone (0–80 cm soil layer) from May to September. Data were collected every 30 min by a data logger (CR1000). The VSM of the 0–80 cm soil layer is the mean of the observed VSM in different soil layers, shown in Equation (3):
REW = VSM VSM m VSM FC VSM m
where VSM (%) is the volumetric soil moisture, VSM FC (%) is the soil field capacity, which had a mean value of 43.2%, obtained by the cutting ring method in this study, and VSM m (%) is the wilting point with a value of 5.75% (the volumetric soil moisture when white birch wilts) [42].

2.5. Sap Flow Estimation Methods

2.5.1. Sap Flux Density

Sap flow density ( J s , mL cm–2 min–1) was measured with the heat dissipation method [43]. Trees selected for sap flow measurements ranged in DBH from 14.1 to 22.7 cm. Thermal dissipation probes with a 30 mm integrated length (TDP-30, Dynamax Inc., Houston, TX, USA) were connected to a sap velocity system (FLGS-TDP XM1000, Dynamax, Inc., Houston, TX, USA). To install the probes, the outer bark was removed, and two small holes spaced 9 cm apart vertically were drilled into the sapwood approximately 1.3 m above ground level with a northerly aspect. Probes and the stem around probes were wrapped with reflective insulation (Reflectix Inc., Markleville, IN, USA) to reduce thermal gradients. Probe temperatures were measured every 1 min, and the 30 min means were recorded.
The sap flow density ( J s , mL cm−2 min−1) of a sample tree was calculated by Equation (4) [27]:
J s = 0.714 × ( d tmax d t d t ) 1.231
where d t is the temperature difference between two needles; d tmax is the maximum value of d t when sap flow can be considered as 0 during the night. The opensource Baseliner program was used to establish a zero-flow reference value with user-defined parameters set at VPD < 0.05 kPa for at least two consecutive hours each night. Sap flow was calculated as the product of J s (summed over a 30 min period) and individual A s near each probe [44].

2.5.2. Tree Transpiration Calculation

In the comparative analysis of tree transpiration for different size trees, we selected small and large trees. The daily (daily for 24 h) transpiration of individual trees ( T ti , L day−1) was calculated by multiplying the daily mean sap flow density ( J s ¯ , mL cm−2 min−1) of the tree by its sapwood area ( A si , cm2) using Equation (5) [32]:
T ti = J s ¯ × A si × 60 × 24 1000

2.5.3. Stand Transpiration Calculation

The mean sap flow density of the plot ( J c , mL cm−2 min−1) was the weighted average of J s from four DBH classes using Equation (6) [45]:
J c = J si N i N
where J si is the sap flow density of the sampled tree in the ith DBH class; N i is the number of trees in the ith DBH class; and N is the total number of trees in the plot. (i = 1,2,3,4, N = 44, N 1 = 7, N 2 = 11, N 3 = 12, N 4 = 14)
The daily stand transpiration (T, mm day−1) was determined by multiplying the weighted mean sap flow density ( J c ) of the plot by the sapwood area per unit ground area using Equation (7) [45]:
T = 1440 × J c × i = 1 n A si 1000 × S
where A si (cm2) is the sapwood area of each tree in the plot; S (m2) is the plot ground area; n is the number of trees in the plot.
According to the observation records of the phenology camera in the study area, the white birch began to grow around May 3, and growth ended around September 21. Better transpiration observations should be made throughout the growing season (May–September). Unfortunately, although we made observations during the growing season each year, we were unable to collect full growing season data for all years because the thermal dispersion detectors did not function sometimes and did not record the full growing season data. This may be due to untimely instrument maintenance and lower temperatures resulting in unstable power supply and poorer data. Therefore, due to the shortage of some probe data in 2015 and 2018 (data for medium size trees were missing for 2015, and data for small and medium size trees were missing for 2018), the T in 2015 and 2018 and the Tt of small trees in 2018 could not be calculated in the subsequent analysis.

2.6. Model Structure and Statistical Assessment

The multiplication equation has been widely used to determine the relationship between canopy conductance and multifactor responses [37,46]. Due to the difficulty in measuring canopy conductance, T is often used for derivation [47,48]; therefore, we assume that the relationship between the daily transpiration of a stand in response to multiple environmental factors is similar to that of the canopy conductance, which can be expressed as a multiplicative function (refer to the infrastructure of the Jarvis–Stewart model) [28,49]. There are many environmental factors that affect Tt or T, and each factor affects each other, so it is difficult to distinguish the influence of a single factor. In order to eliminate the interference from other factors, upper boundary line [50] analysis was conducted, which is useful for determining the effect of one single factor under optimal levels of other factors, to clarify how the T responded to every single factor. The upper boundary line was obtained by the following steps. Scattergrams were plotted between the T as a dependent variable and each of the independent variables (individual influential factors, i.e., Rn, VPD, and REW). For the calculation of boundary points, the data set of one scattergram needed to be split up. The response of a single factor (Rn, VPD, and REW) to T was divided into six equally spaced segments based on the range of observed data. Then, the data that were at least one standard deviation greater than the arithmetic mean of T within each variation interval were screened out. All data points of each segment were represented by only one boundary point. Finally, the boundary points along the x axis (arithmetic center of each segment) were used to describe the upper boundary line [45]. It was assumed that the effects of each single factor on transpiration are independent of each other, so the coupled model of transpiration affected by each factor was the multiplication relationship between transpiration and the response function of each single environmental factor [51]. The numerous factors influencing daily T can be simplified and divided into the three driving factors of Rn, VPD, and REW. Thus, the response of T to Rn, VPD, and REW was assumed to follow a multiplicative-type function coupling the response of T to Rn, VPD, and REW:
T = f ( R n ) × f ( VPD ) × f ( REW )
where f ( R n ) , f ( VPD ) , and f ( REW ) are functions describing the T responses to Rn, VPD, and REW, respectively.
The coefficient of determination ( R 2 ) and the Nash–Sutcliffe efficiency coefficient ( NSE ) were used for quantitative analysis of the T model performance, using Equation (9):
NSE = 1 ( T T ) 2 ( T T ¯ ) 2
where T and T are the measured and predicted values, respectively; T ¯ is the observed mean. When R 2 is close to 1 and NSE exceeds 0.6, the model performs well [52].
To provide some evaluation of the T models, several statistical tests were used in addition to NSE. Individually, the explained variance (R2) is not suitable as a measure of model performance, as it fails to account for model bias [53]. To provide a more robust statistical validation for the performance of models used in this study, the mean absolute error (MAE) and root mean square error (RMSE) were used to provide additional measures of the variation in the error. The RMSE and MAE are effective measures of the deviation of model predictions from the observed data, calculated as Equations (10) and (11) [54,55]:
RMSE = i = 1 n ( T i T i ) 2 n
MAE = | T T | n
where T and T are the observed and predicted values; n is number of data points.
An ANOVA and Tukey test were used to assess differences in environmental factors and Tt (the transpiration of small and large trees) between hydrological years. The probability values of p <0.05, p < 0.01, and p < 0.001 were considered significant. The data analysis was performed using the SPSS software package (version 19.0 for Windows, SPSS Inc., Armonk, NY, USA). The nonlinear regression was done in OriginPro (version 2022, OriginLab, Northampton, MA, USA).

2.7. Determination of the Contributions of R n , V P D , and R E W to T

Based on the newly developed T model, a factorial experiment [56] was used to determine the contribution of Rn, VPD, and REW to T. This method compares the difference between the modeled T using only one variable factor and a transpiration rate under a control simulation. The control T simulation (expressed as T control ) in this study was calculated by the developed T model using the long-term means of the daily Rn (23 MJ m−2 day−1, 2012–2020), VPD (0.43 kPa, 2012–2020), and REW (0.41, 2012–2020) during the growing season (May–September). This T value from the control simulation represented the reference daily T under the long-term mean environmental conditions at this study site. Second, the relative effect of Rn, VPD, and REW on T was calculated by the following Equations (12)–(14):
T Rn = f ( R n ) T control
T VPD = f ( VPD ) T control
T REW = f ( REW ) T control
where f ( R n ) , representing the total T in a season, was calculated using the observed mean daily Rn during the study periods of 2015, 2017, 2018, and 2021, as well as the controlled daily VPD (0.43 kPa) and REW (0.41); f ( VPD ) was calculated using the observed mean VPD during 2015, 2017, 2018, and 2021, as well as the controlled daily Rn (23 MJ m−2 day−1) and REW; f ( REW ) was calculated using the observed mean daily REW during 2015, 2017, 2018, and 2021, as well as controlled daily Rn and VPD.
The contribution rate of each factor to T was calculated as follows:
C Rn = T Rn T control × 100 %
C VPD = T VPD T control × 100 %
C REW = T REW T control × 100 %
where C Rn ( % ) ,   C VPD ( % ) , and   C REW ( % ) are the contribution rates of Rn, VPD, and REW to T, respectively.

3. Results

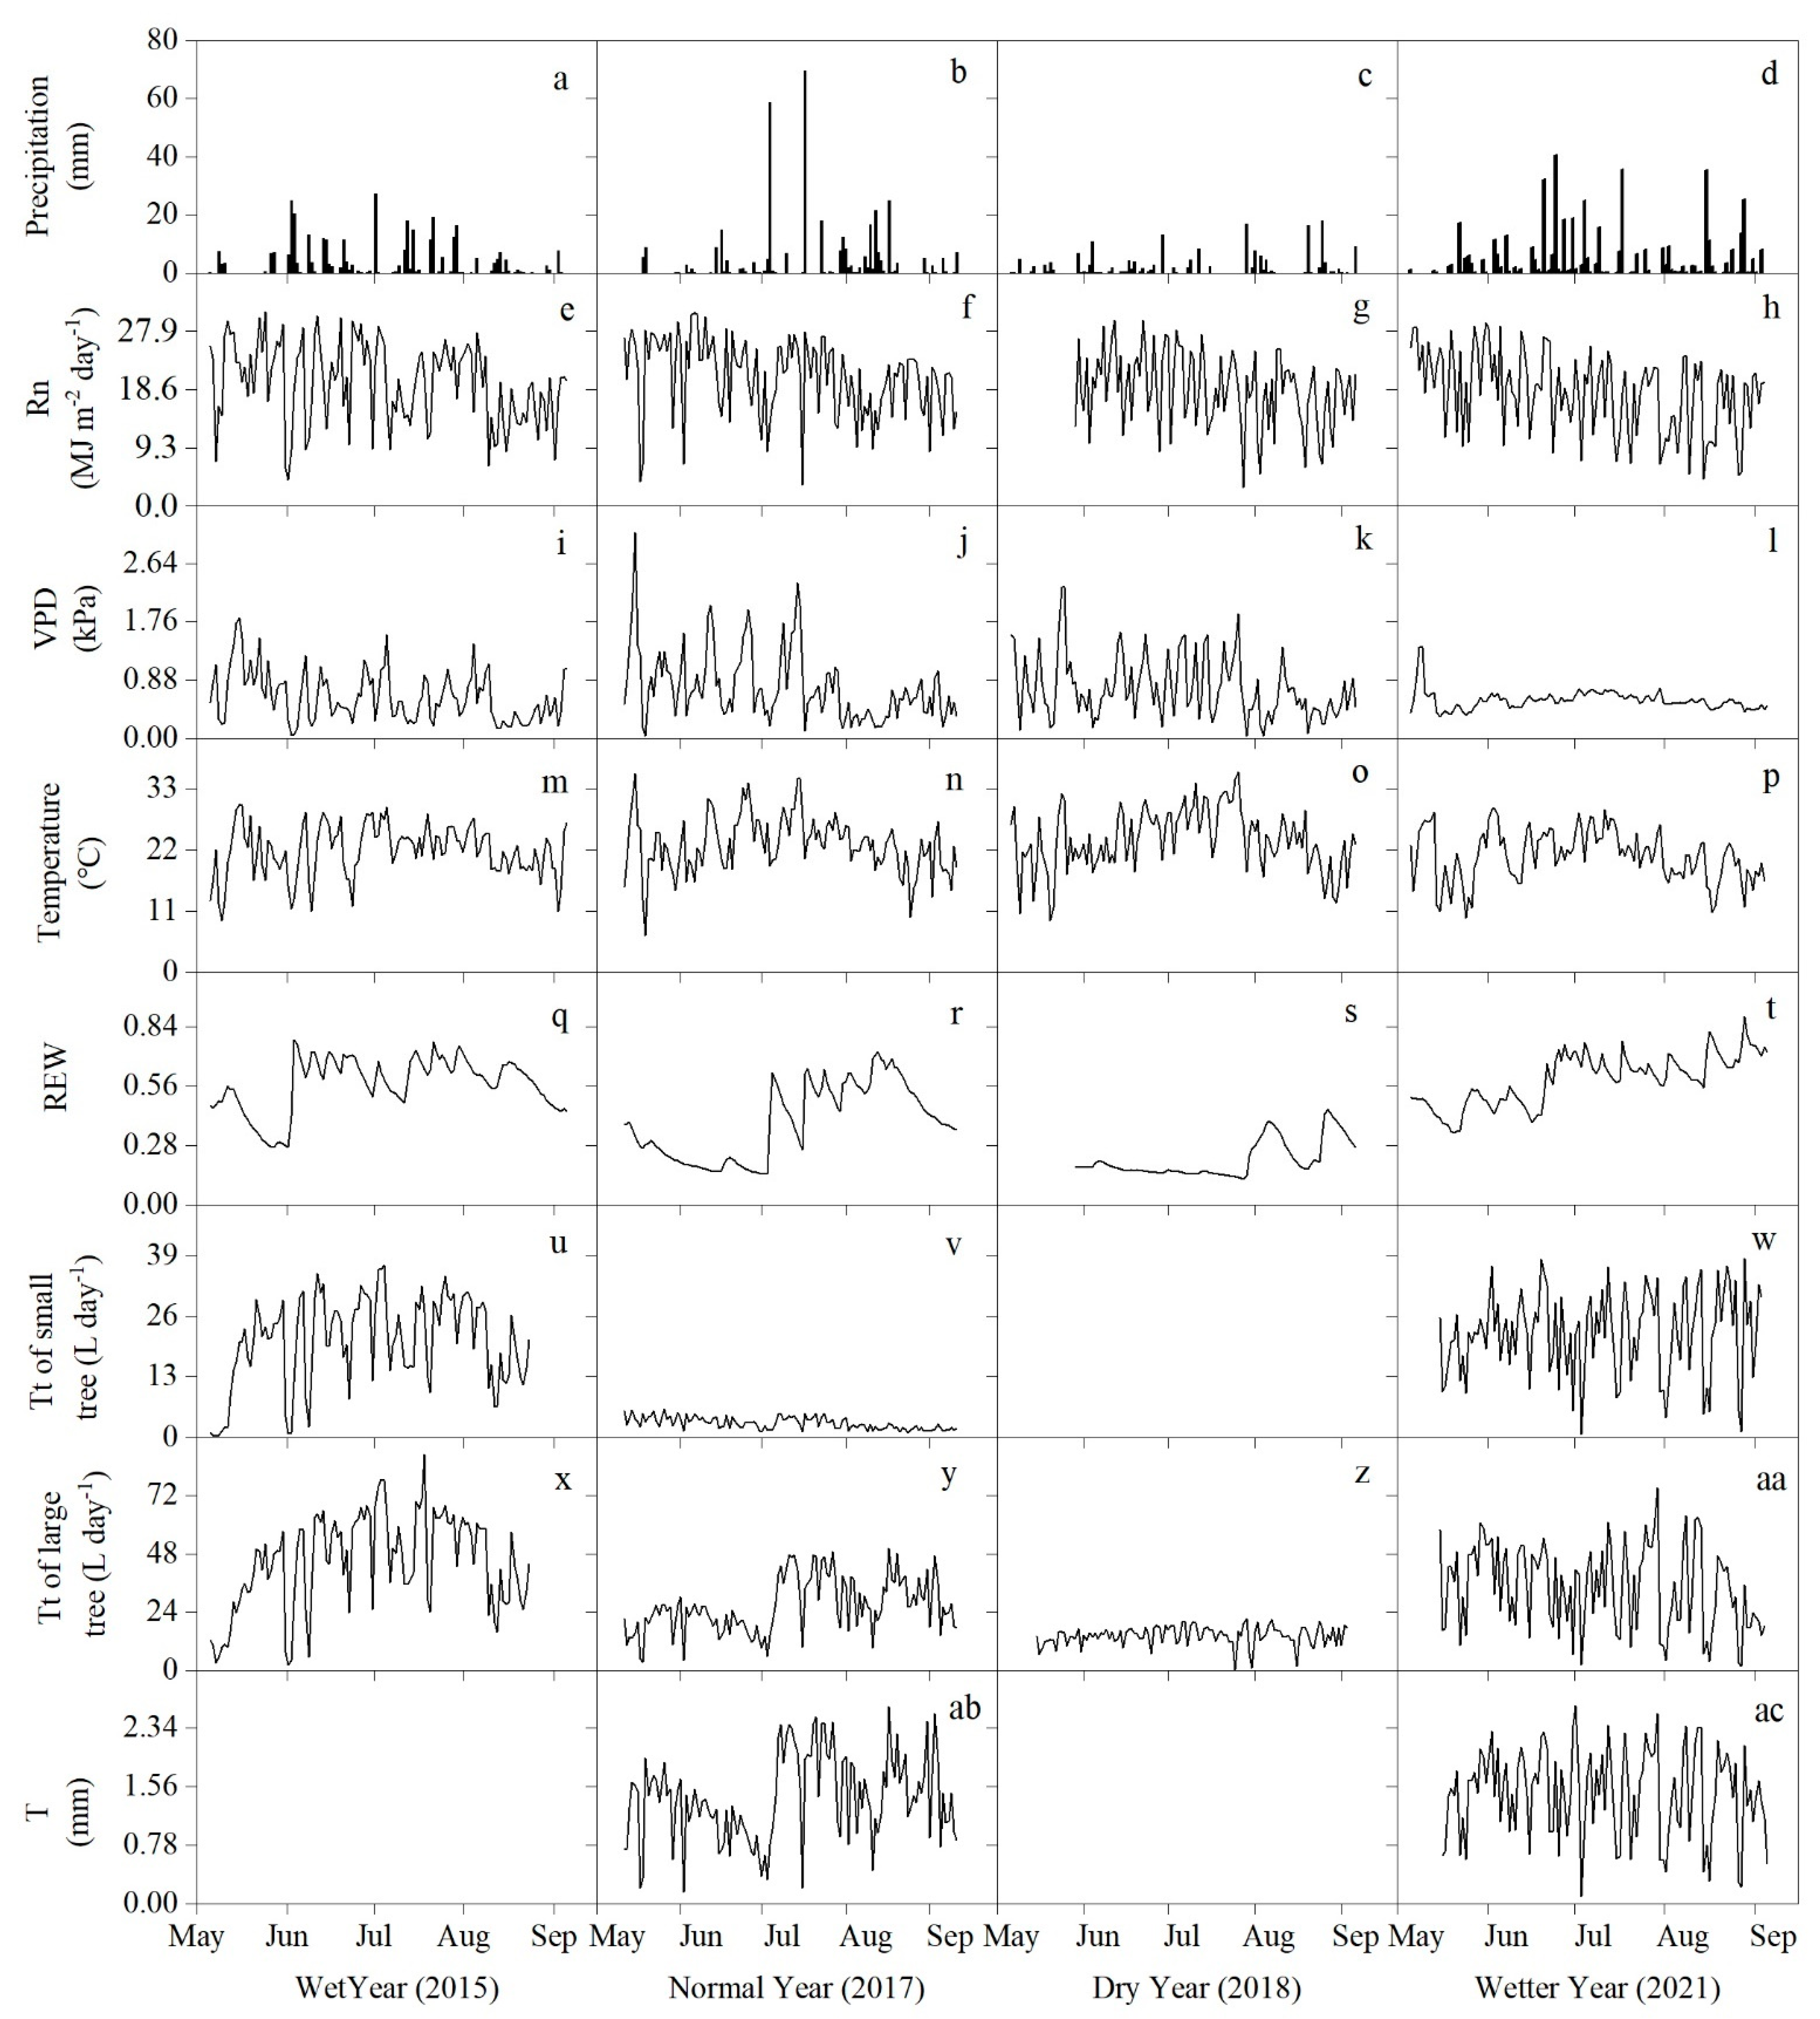
3.1. Environmental Characteristics of the Growing Season in Different Hydrological Years

The variations in precipitation in the white birch plantation during the study periods in the ‘wet’, ‘normal’, ‘dry’, and ‘wetter’ year are presented in Figure 2a–d, respectively. The total precipitation in the growing season was 334, 361, and 472 mm during the study periods in the ‘wet’ year, ‘normal’ year, and ‘wetter’ year, which was 84% above, 99% above, and 161% above the total precipitation, respectively, in the growing season of the ‘dry’ year (181 mm). The daily solar radiation (Rn, MJ m−2 day−1) in the growing season of different hydrological years had no significant difference (p < 0.05) (Figure 2e–h). The VPD of the ‘dry’ year was not significantly different (p < 0.01) from that of the ‘normal’ year (the mean daily VPD the in growing season was 0.77 kPa and 0.78 kPa, respectively) was but significantly different from that in the ‘wet’ and ‘wetter’ years (p < 0.01), with the VPD of the ‘dry’ year being 18% (0.63 kPa) and 25% (0.58 kPa) higher than that in the ‘wet’ and ‘wetter’ years (Figure 2i–l), respectively. The air temperature of the ‘dry’ year (23.9 °C) was not significantly different from that of the ‘normal’ year (23 °C, p < 0.01). The ‘wet’ and ‘wetter’ years were significantly different from the ‘dry’ year (p < 0.01), with a mean daily air temperature of 22 °C and 21 °C, respectively (Figure 2m–p). Due to the impact of rainfall, the REW in the growing season of the ‘dry’ year always had a low value, which was significantly lower than that of the other hydrological years (p < 0.01). The daily mean REW during the growing season was 0.21 in the ‘dry’ year, which was 167% below, 86% below, and 181% below the REW in the ‘wet’ (0.56), ‘normal’ (0.39), and ‘wetter’ (0.59) years, respectively (Figure 2q–t).

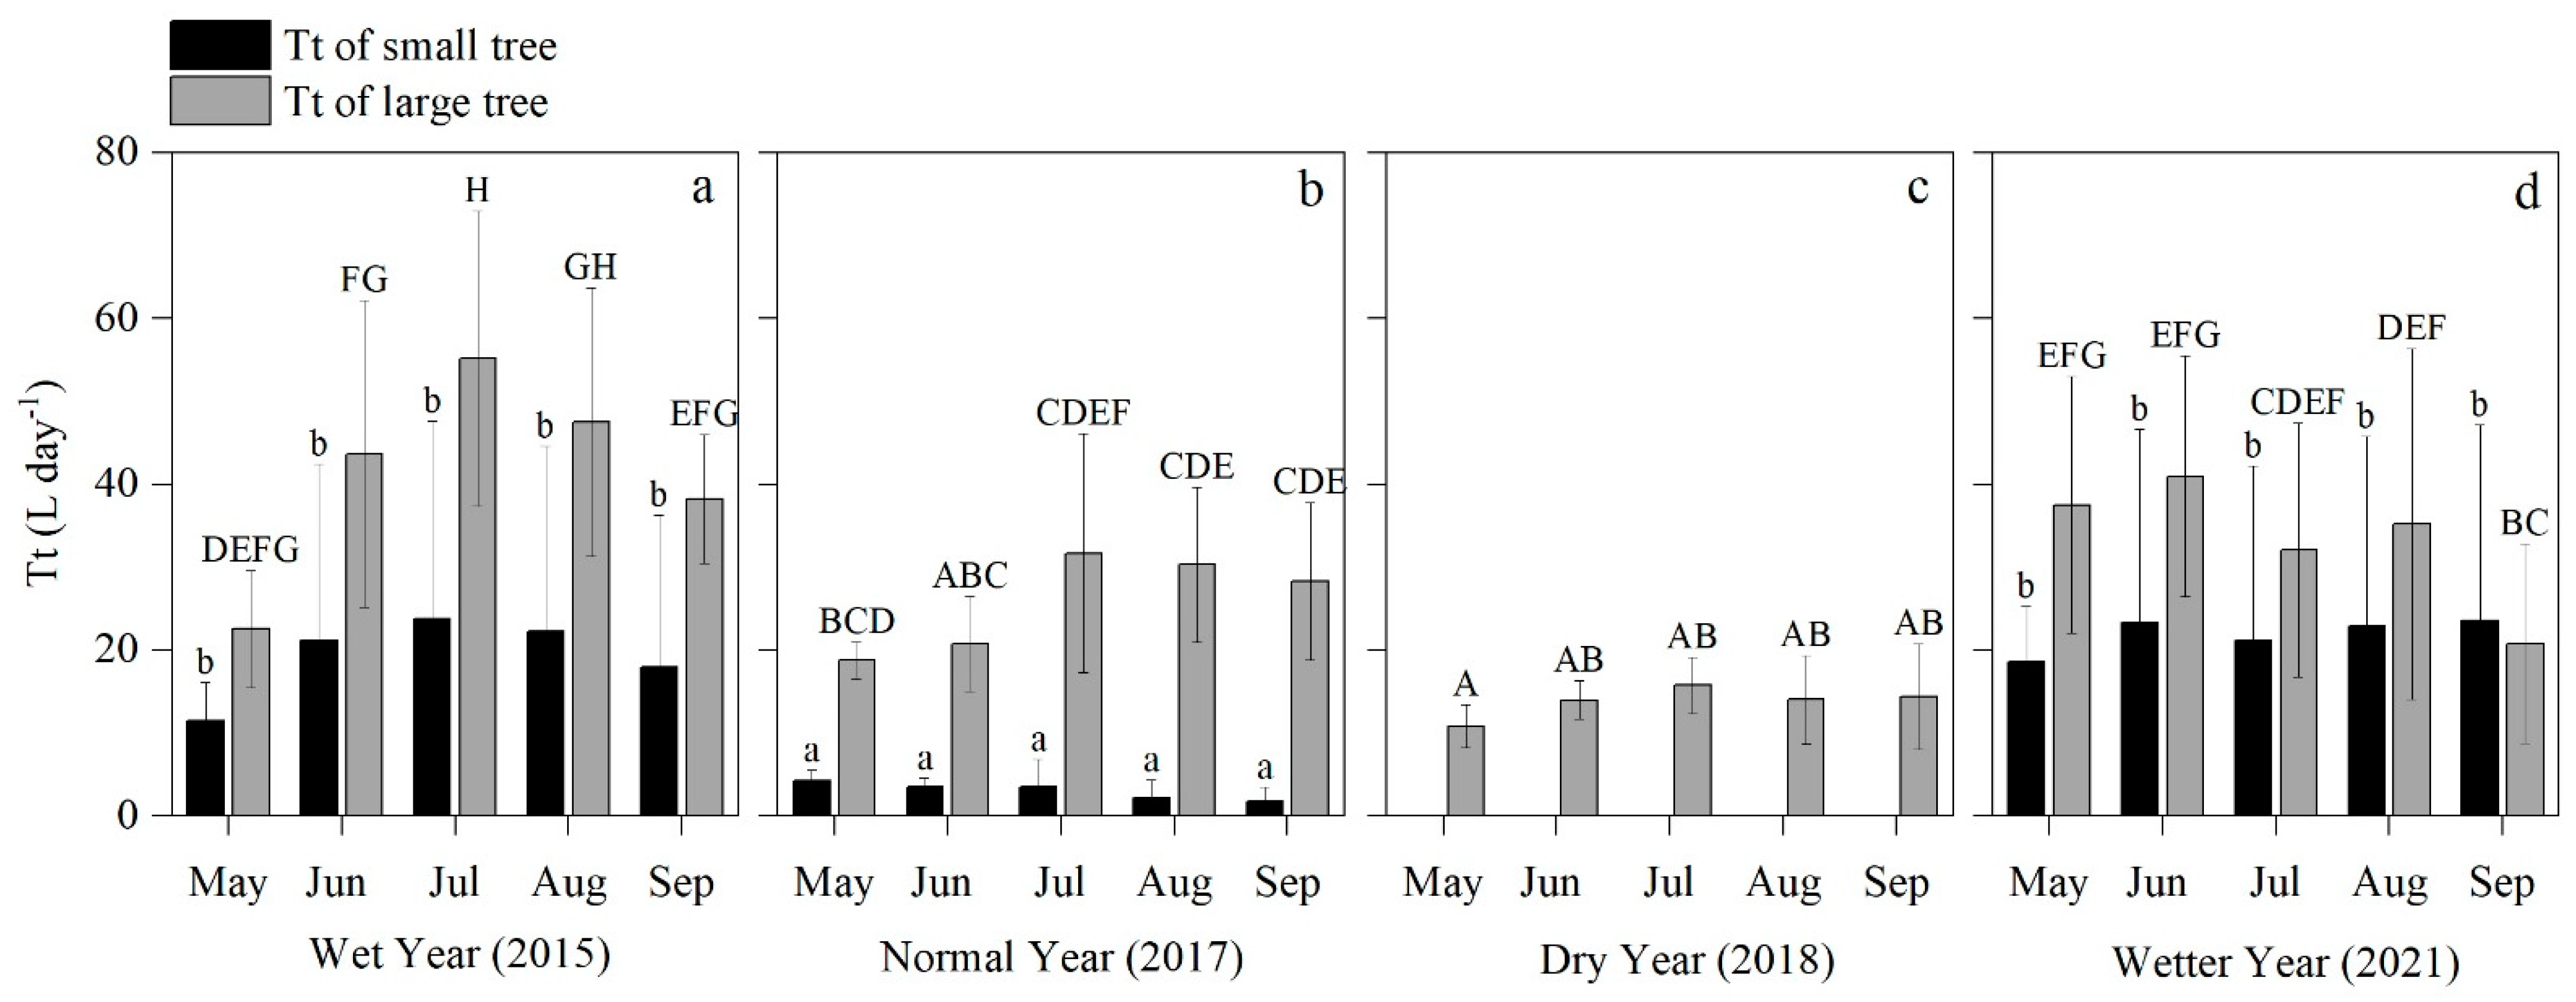
3.2. Variation of Tt and T in Different Hydrological Years

The monthly average Tt in different hydrological years was significantly different, and the transpiration of the ‘dry’ year were significantly lower than that in other hydrological years (Figure 3). The Tt of small trees in the ‘normal’ year was significantly different from that in the ‘wet’ and ‘wetter’ years, while there was no significant difference between ‘wet’ and ‘wetter’ years. The Tt of large trees differed from month to month in the other hydrological years except that there was no significant difference between each month in the ‘dry’ year (Figure 3c). In the growing season of the ‘normal’ year, the average daily tree transpiration of small trees was 3.04 L day−1, with a small temporal variation within the season, which was about one-fifth of the average daily Tt in the ‘wet’ year and ‘wetter’ year (Figure 2u–w). The Tt of large trees in the ‘dry’ year was 13.78 L day−1, which was 48% lower than that in the ‘normal’ year, and its temporal change (across months of the season) was the smallest; the Tt of large trees in the ‘wet’ and ‘wetter’ years was 68% and 18% higher, respectively, than that in the ‘normal’ year (Figure 3a,d), and their changes were also larger (Figure 2x–aa). The Tt of small trees was lower than that of large trees in the ‘normal’ year (Figure 3b), with the average Tt of small trees being 89% lower than that of large trees; and in the ‘wet’ and ‘wetter’ years, the Tt of small trees was 54% and 35% lower than that of large trees. Therefore, the difference between small and large trees was greatest in the ‘normal’ year.
The average daily T in the growing season of the ‘normal’ year was 1.31 mm, which was 11% lower than that in the ‘wet’ year. The accumulated T in the ‘normal’ year and ‘wetter’ year was 162 mm and 167 mm, respectively (Figure 2ab,ac), accounting for 42% (386 mm) and 30% (548 mm) of the total precipitation in the same period (Figure 2a–d). Therefore, the Tt and the T of the plots in the ‘dry’ year and ‘normal’ year were lower than those in the ‘wet’ year and ‘wetter’ year, and the Tt and T of the ‘dry’ year were lower than those in the ‘normal’ year.

3.3. Response of T to R n , V P D ,   a n d   R E W

As shown by the upper boundary line in Figure 4a, the T responded to Rn following a binomial relationship (T = a1 + b1·Rn + c1·Rn2), i.e., T increased with Rn until the Rn reached 25 MJ m2 day−1. The T responded to VPD following a saturated exponential relation (T = a2 − b2·c2VPD), i.e., T increased gradually with VPD until its stable maximum (Figure 4b). The T responded to REW following a saturated exponential relationship (T = a3 − b3·c3REW), i.e., T first increased with REW when the REW < 0.4, and then gradually tended to a stable maximum (Figure 4c).

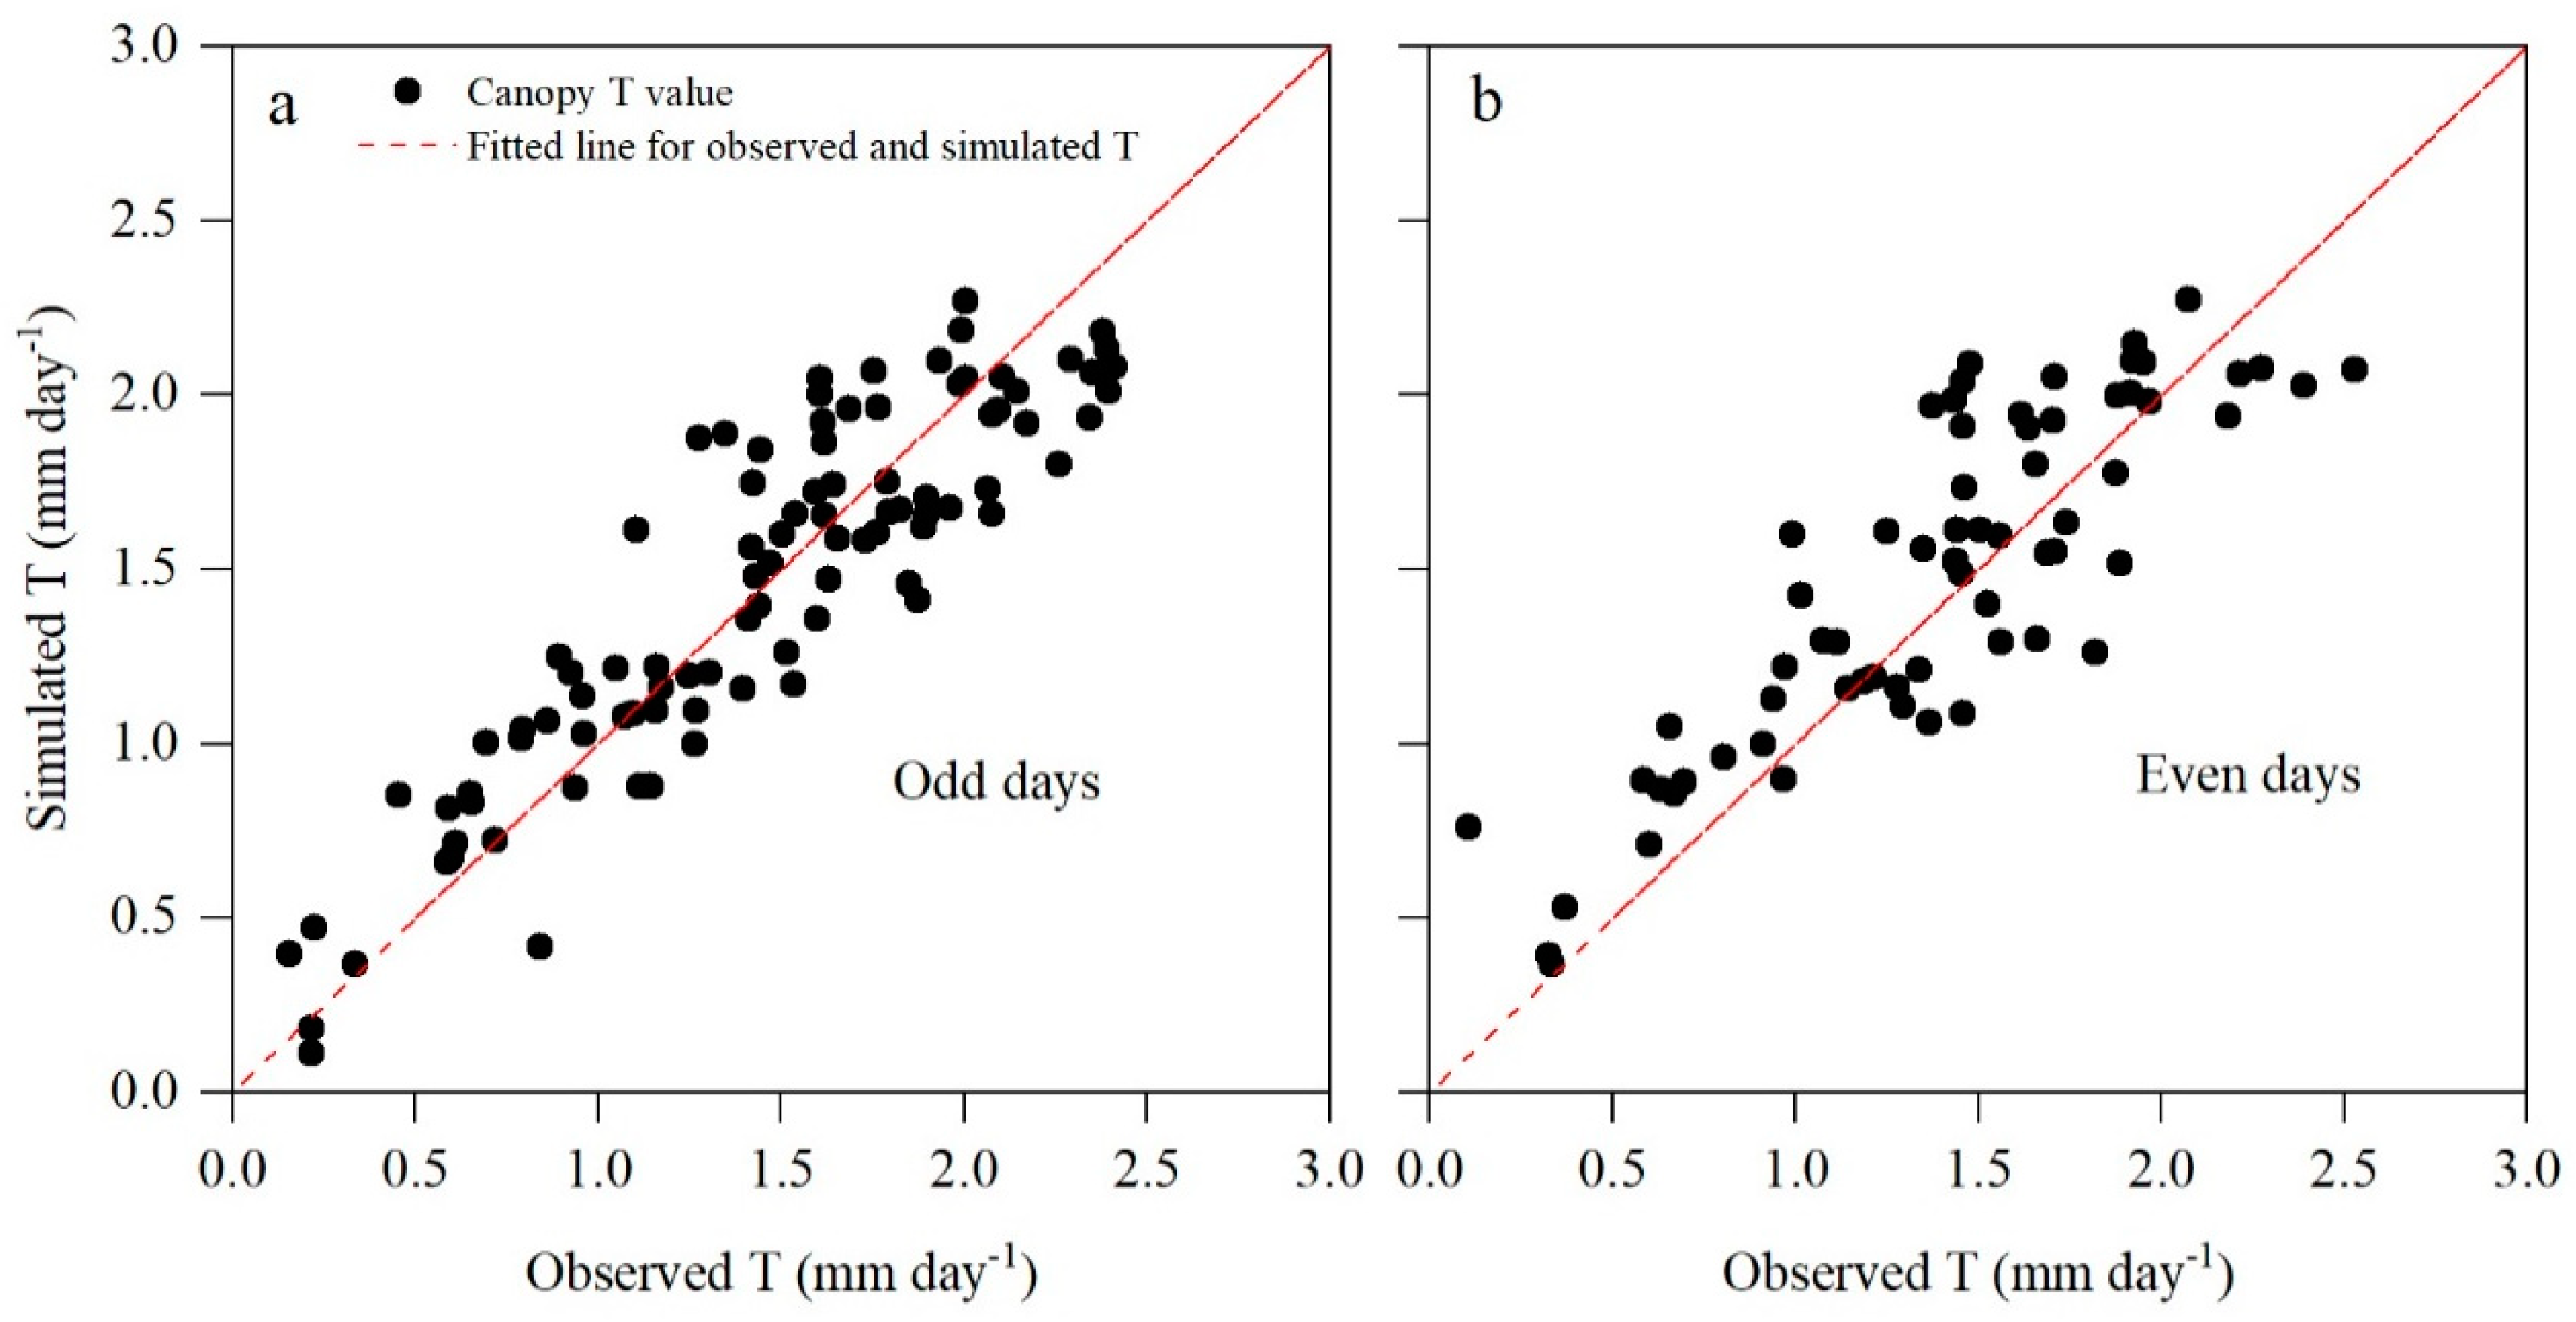
3.4. Construction and Validation of the T Model
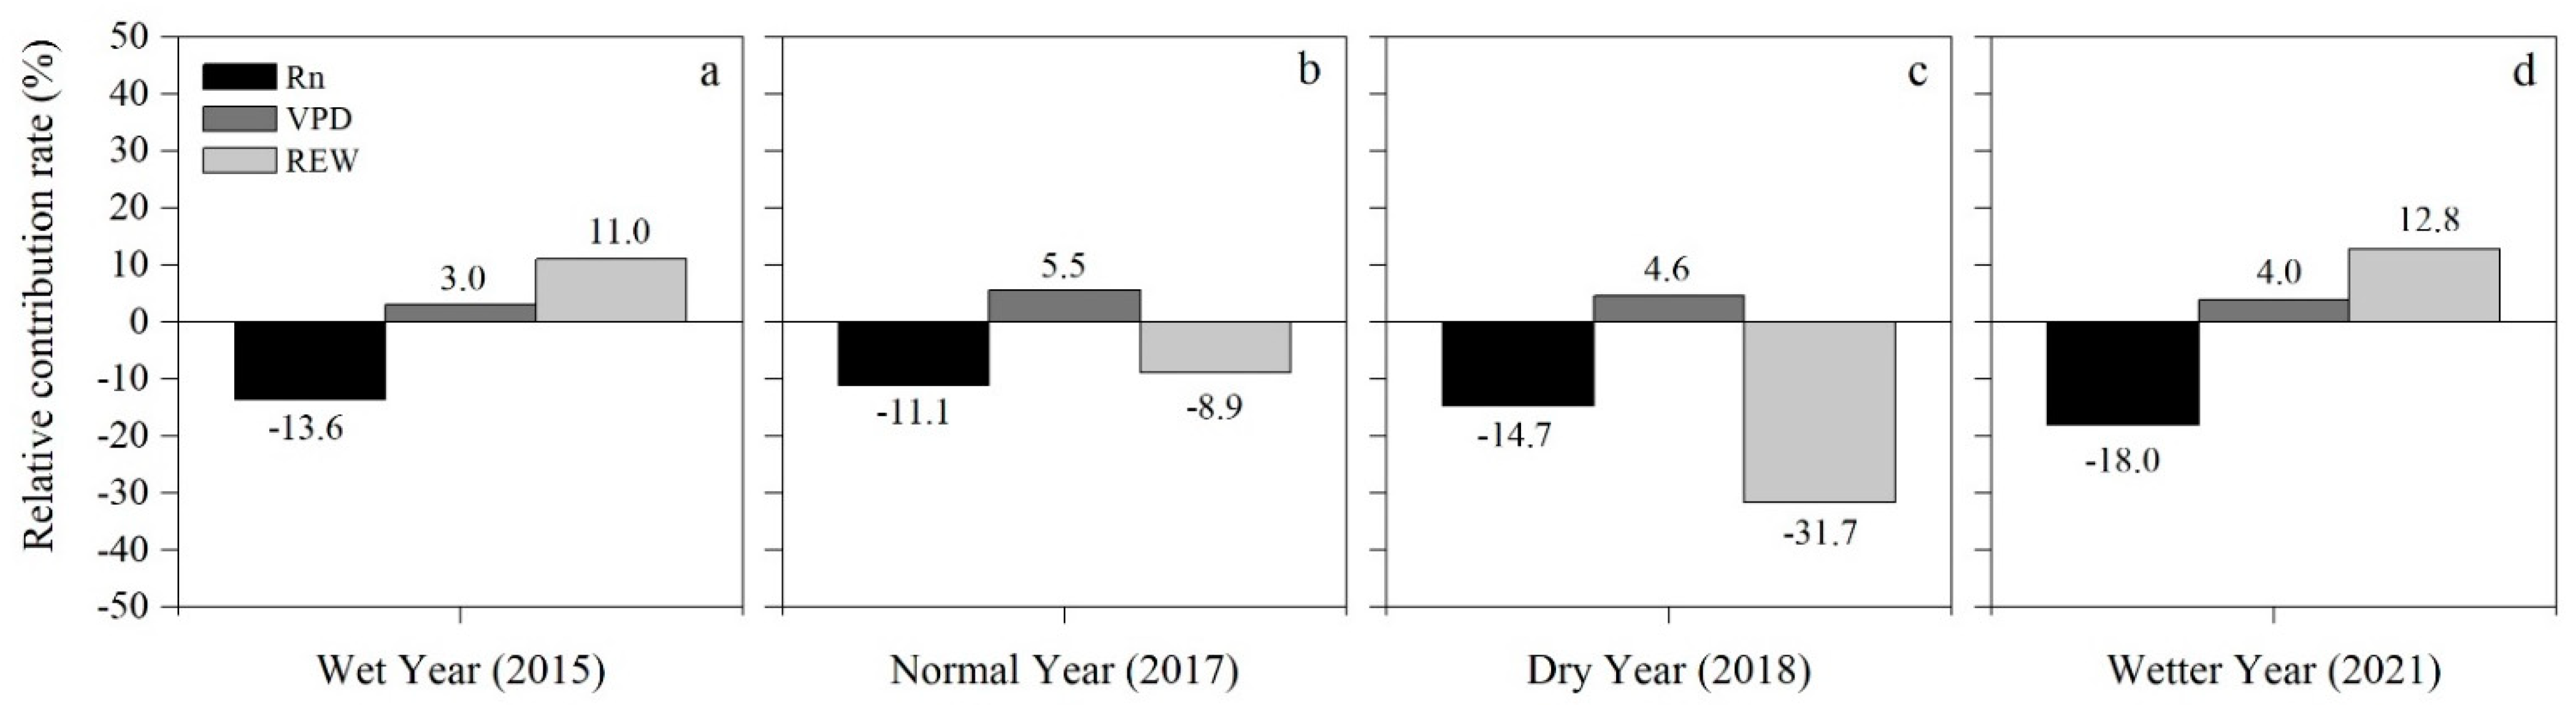
To reflect the integrated effect on T of changes in Rn, VPD, and REW, the T response functions to single factors were coupled to form the T module (T = (a1 + b1 × Rn + c1 × Rn2) × (a2 − b2·c2VPD) × (a3 − b3·c3REW)), and all parameters (i.e., a1, a2, a3, a2, b2,c2, a3, b3, c3) were fitted using measured data from odd days in 2017 and 2021, as shown below in Equation (18):
T = ( 9.376 + 4.026 × Rn 0.07 × Rn 2 ) × ( 0.174 0.059 × 0.187 ^ VPD ) × ( 0.32 0.315 × 0.03 ^ REW )
As shown in Figure 5a, the model simulation values are in good agreement with the measured values (measured via sap flow), with an R2 value of 0.81, an NSE value of 0.81, an RMSE value of 0.25, and an MAE value of 0.21 (n = 94). The model parameters were further verified using the measured data from even days in 2017 and 2021. The model still maintained an acceptable simulation accuracy during the verification stage (Figure 5b), with an R2 value of 0.73, an NSE of 0.70, an RMSE value of 0.29, and an MAE value of 0.23 (n = 67). The proposed model can properly reflect the impact of environmental factors on T.

3.5. Relative Effects of R n , V P D , and   R E W on T

The contribution of each factor to T was quite different in various years. The Rn and REW in the ‘wet’ year exerted negative and positive effects on T, with contribution rates of −13.6% and 11.0%, while VPD exerted slight positive effects on T, with a contribution rate of 3.0% (Figure 6a). The Rn and REW in the ‘normal’ year exerted negative effects on T, with contribution rates of −11.1% and −8.9%; VPD imposed a lesser positive effect on T, with a contribution rate of 5.5% (Figure 6b). The REW in the ‘dry’ year imposed an obvious negative effect on T, with a contribution rate of −31.7%; Rn also imposed a negative effect on T, with a contribution rate of −14.7%, while VPD exerted a slight positive effect on T, with a contribution rate of 4.6% (Figure 6c). The Rn and REW in the ‘wetter’ year exerted negative and positive effects on T, with contribution rates of −18.0% and 12.8%, while VPD exerted slight positive effects on T, with a contribution rate of 4.0% (Figure 6d). The dominant factor contributing to the changes in T was Rn in the ‘wet’ year, Rn in the ‘normal’ year, REW in the ‘dry’ year, and Rn in the ‘wetter’ year. Except for the ‘dry’ year, the contribution rates of Rn and REW to T were not much different in other hydrological years, but REW had a positive impact in the ‘wet’ and ‘wetter’ years and a negative impact in the ‘normal’ and ‘dry’ years. The VPD had only a small positive effect in each hydrological year. In the ‘dry’ year, the negative effect of REW on T was very obvious, and the contribution rate was also the highest (−31.7%, Figure 6c).

4. Discussion

4.1. Effects of Drought on Transpiration

With global climate change, drought occurrences are more and more frequent [57]. When droughts occur, higher temperatures often lead to higher evapotranspiration (the sum of evaporation and plant transpiration), with severe impacts on ecosystems [58]. Therefore, it is necessary to understand water use patterns at tree and stand levels in different hydrological years. In our study, both tree transpiration (Tt) and stand transpiration (T) responded differently to drought in different hydrological years. Tt was reduced by 48% during the dry year compared to the ‘normal’ year. This may be because trees close stomata to retain safe levels of xylem pressure, stop most photosynthesis, and rely on stored carbohydrates to support the metabolic costs of maintaining tissues [59]. In different hydrological years, the transpiration of small and large trees was significantly different, and the transpiration of small trees was lower than that of large trees. This is mainly due to the larger canopy and deeper root system, which allows for easier access to water sources [60]. Our result is consistent with the results of Dawson et al. [61]. However, some studies have come to different conclusions. Small trees are more likely to absorb deep soil water than large trees [62]. In terms of T, the T in normal years was 11% lower than that in wetter years, and the difference was not large, but the rainfall in the ‘normal’ years was nearly 42% lower than that in wetter years. Therefore, T did not show a high value in the case of high precipitation, which indicated that in addition to soil water, other environmental factors also affect T.

4.2. Assessing T Responses to Different Hydrological Years

Our result confirmed that T is jointly affected by various environmental factors, and we quantified the contributions and changes of each factor in the drought years. We used a modeling method to quantify the influence of the main drivers on T in different hydrological years. The developed T model can be used to assess the independent effects of varying meteorological conditions and soil water conditions (i.e., REW) on T. For example, compared to the reference T under the long-term means of the daily Rn, VPD, and REW, the maximum contribution factor for the mean daily T change during the growing season was REW (with a relative contribution rate of 31.7%) in the ‘dry’ year of 2018 and Rn (18.0%) in the ‘wetter’ year of 2021. The results showed that REW was the main driving factor affecting T in the ‘dry’ year. This is consistent with the results of Li et al. [28] for a semi-arid region. This is due to the fact that Tt is reduced during periods of insufficient soil moisture when the soil is dry. In the ‘normal’ year, Rn and REW were the main drivers affecting T. The main driving factor affecting T in the ‘wet’ and ‘wetter’ years was Rn. The effect of VPD on T was not obvious in any hydrological year. The previous research results on the influence of Rn and VPD on T are different. Some studies suggest that the influence of VPD is greater than that of Rn [63,64], while other studies show that the contribution rate of Rn to T is greater than that of VPD [65]. This difference may be due to the climatic conditions of the study area and the physiological characteristics of trees. In addition, compared with those in the ‘normal’ year in 2017, Rn and REW limited the T variation in the ‘wet’ year in 2015 by 2.5% and 2.1%, respectively; and REW limited the T variation in the ‘dry’ year in 2018 by 22.8%; Rn and REW limited the T variation in the ‘wetter’ year in 2021 by 6.9% and 3.9%. This indicates that soil moisture has an important or the largest effect on T, especially when drought occurs, and low soil moisture will suppress T. When there is sufficient precipitation, Rn will become the main environmental factor limiting T. At present, extreme weather occurs frequently, which will seriously threaten forest water resources in semi-arid areas. Increased evapotranspiration demand and reduced soil moisture can promote water stress and weaken tree health [66]. Therefore, when drought occurs, special attention should be paid to the dynamics of the available soil water content.

4.3. Limitations

This study was focused on tree transpiration and its responses to environmental factors, with the transpiration being measured by the sap flow method and its relations to driving factors being empirically modeled. Soil evaporation was not included in the study or modeling. However, soil evaporation uses and responds to soil water, and this connection of soil evaporation and soil water may affect the calculation of the relationship between tree transpiration and soil water. Soil evaporation was not measured or estimated for our study site. A full study of evapotranspiration including both tree transpiration and soil evaporation could improve research in the future.
Ideally, a net radiometer for measuring net radiation should have been installed on top of the studied tree canopy, whereas the radiometer was installed in an opening beside our tree stand. This should be corrected in our next study.
Air or leaf temperature is an important factor for tree transpiration, but it was not directly expressed in the proposed transpiration model (Equation (8)). Although the influence or function of air temperature was partially reflected by the vapor pressure deficit, VPD (using air temperature to calculate VPD in Equation (2)), and measured net radiation (including the long-wave radiation that is affected by temperature), the temperature was not directly evaluated as done for the VPD, Rn, and REW. Future studies may add temperature as an independent driver.

5. Conclusions

Daily tree transpiration, Tt, was significantly different in different hydrological years and was the lowest in the ‘dry’ year. The Tt of small trees in the ‘normal’ year was only one-fifth of that in the ‘wetter’ year, and the Tt of large trees in the ‘dry’ year was 48% lower than that in the ‘normal’ year. In the ‘normal’ year, the Tt of small trees was 89% lower than that of large trees. Daily plot T was also 11% lower in the ‘normal’ year than in the ‘wetter’ year. The relative importance of Rn, VPD, and REW to T in different hydrological years was further examined using the developed empirical T model. The average contribution of Rn, VPD, and REW to T varied in various years, and REW was the key factor that contributed to the T changes in the ‘dry’ year. Rn and REW were the two main factors that contributed to the T changes in the ‘wet’, ‘normal’, and ‘wetter’ years; their contribution rates were not that different, but REW had a positive effect in the ‘wet’ and ‘wetter’ years and a negative effect in other years compared with the reference T under the long-term mean values of daily Rn, VPD, and REW. The newly developed T model provides a feasible approach for predicting the total T response to environmental factors (Rn, VPD, and REW) and for quantifying the independent effect of each factor on the T of forest stands.

Author Contributions

Conceptualization, Y.W., M.Z., P.Z., H.Y. and Z.L.; instrument installation, Y.W., C.X. and L.Z.; investigation, Y.W., Y.S., C.X. and L.Z.; formal analysis, Y.W.; writing—original draft preparation, Y.W. and M.Z.; writing—review and editing, Y.W., M.Z., P.Z., H.Y., Z.L., J.W. and J.L. All authors have read and agreed to the published version of the manuscript.

Funding

This work was financially supported by the National Natural Science Foundation of China (41861005 and 41530747) and by project ‘The Introduction Program of High-qualified Foreign Experts, Inner Mongolia Autonomous Region’ (Response mechanism of water use characteristics of typical tree species to drought stress in semi-arid area of Inner Mongolia, no item number for the project) funded by the Department of Science and Technology of Inner Mongolia.

Institutional Review Board Statement

Not applicable.

Informed Consent Statement

Not applicable.

Data Availability Statement

Not applicable.

Acknowledgments

We thank Guilin Li, Teer Ba, He Meng, Shuli Feng, and other staff members of the Inner Mongolia Saihanwula National Natural Reserve Administration for their assistance with the field work.

Conflicts of Interest

The authors declare no conflict of interest.

References

  1. Clark, J.S.; Iverson, L.; Woodall, C.W.; Allen, C.D.; Bell, D.M.; Bragg, D.C.; D’Amato, A.W.; Davis, F.W.; Hersh, M.H.; Ibanez, I.; et al. The impacts of increasing drought on forest dynamics, structure, and biodiversity in the United States. Glob. Chang. Biol. 2016, 22, 2329–2352. [Google Scholar] [CrossRef] [PubMed] [Green Version]
  2. Weed, A.S.; Ayres, M.P.; Hicke, J.A. Consequences of climate change for biotic disturbances in North American forests. Ecol. Monogr. 2013, 83, 441–470. [Google Scholar] [CrossRef]
  3. Adams, H.D.; Macalady, A.; Breshears, D.D.; Allen, C.D. Climate-induced tree mortality: Earth system consequences for carbon, energy, and water exchanges. AGU Fall Meet. Abstr. 2010, 91, 153–154. [Google Scholar] [CrossRef]
  4. Boisvenue, C.; Running, S.W. Impacts of climate change on natural forest productivity—Evidence since the middle of the 20th century. Glob. Chang. Biol. 2006, 12, 862–882. [Google Scholar] [CrossRef]
  5. Zeng, N.; Yao, H.; Zhou, M.; Zhao, P.; Dech, J.P.; Zhang, B.; Lu, X. Species-specific determinants of mortality and recruitment in the forest-steppe ecotone of northeast China. For. Chron. 2016, 92, 336–344. [Google Scholar] [CrossRef] [Green Version]
  6. Xu, C.; Liu, H.; Hampe, A. Hydraulic adaptability promotes tree life spans under climate dryness. Glob. Ecol. Biogeogr. 2021, 31, 51–61. [Google Scholar] [CrossRef]
  7. Chang, X.; Zhao, W.; Liu, H.; Wei, X.; Liu, B.; He, Z. Qinghai spruce (Picea crassifolia) forest transpiration and canopy conductance in the upper Heihe River Basin of arid northwestern China. Agric. For. Meteorol. 2014, 198–199, 209–220. [Google Scholar] [CrossRef]
  8. Ungar, E.D.; Rotenberg, E.; Raz-Yaseef, N.; Cohen, S.; Yakir, D.; Schiller, G. Transpiration and annual water balance of Aleppo pine in a semiarid region: Implications for forest management. For. Ecol. Manag. 2013, 298, 39–51. [Google Scholar] [CrossRef]
  9. Forner, A.; Aranda, I.; Granier, A.; Valladares, F. Differential impact of the most extreme drought event over the last half century on growth and sap flow in two coexisting Mediterranean trees. Plant Ecol. 2014, 215, 703–719. [Google Scholar] [CrossRef] [Green Version]
  10. Granier, A.; Biron, P.; Lemoine, D.G. Water balance, transpiration and canopy conductance in two beech stands. Agric. For. Meteorol. 2000, 100, 291–308. [Google Scholar] [CrossRef]
  11. Steppe, K.; Vandegehuchte, M.W.; Tognetti, R.; Mencuccini, M. Sap flow as a key trait in the understanding of plant hydraulic functioning. Tree Physiol 2015, 35, 341–345. [Google Scholar] [CrossRef] [PubMed] [Green Version]
  12. Tie, Q.; Hu, H.; Tian, F.; Guan, H.; Lin, H. Environmental and physiological controls on sap flow in a subhumid mountainous catchment in North China. Agric. For. Meteorol. 2017, 240–241, 46–57. [Google Scholar] [CrossRef]
  13. Kunert, N.; Schwendenmann, L.; Hölscher, D. Seasonal dynamics of tree sap flux and water use in nine species in Panamanian forest plantations. Agric. For. Meteorol. 2010, 150, 411–419. [Google Scholar] [CrossRef]
  14. Granier, A.; Bréda, N. Modelling canopy conductance and stand transpiration of an oak forest from sap flow measurements. Ann. Des Sci. For. 1996, 53, 537–546. [Google Scholar] [CrossRef] [Green Version]
  15. Phillips, N.G.; Ryan, M.G.; Bond, B.J.; McDowell, N.G.; Hinckley, T.M.; Cermak, J. Reliance on stored water increases with tree size in three species in the Pacific Northwest. Tree Physiol. 2003, 23, 237–245. [Google Scholar] [CrossRef] [Green Version]
  16. Ewers, B.E.; Mackay, D.S.; Tang, J.; Bolstad, P.V.; Samanta, S. Intercomparison of sugar maple (Acer saccharum Marsh.) stand transpiration responses to environmental conditions from the Western Great Lakes Region of the United States. Agric. For. Meteorol. 2008, 148, 231–246. [Google Scholar] [CrossRef]
  17. Bretfeld, M.; Ewers, B.E.; Hall, J.S. Plant water use responses along secondary forest succession during the 2015–2016 El Nino drought in Panama. New Phytol. 2018, 219, 885–899. [Google Scholar] [CrossRef] [PubMed] [Green Version]
  18. Du, S.; Wang, Y.-L.; Kume, T.; Zhang, J.-G.; Otsuki, K.; Yamanaka, N.; Liu, G.-B. Sapflow characteristics and climatic responses in three forest species in the semiarid Loess Plateau region of China. Agric. For. Meteorol. 2011, 151, 1–10. [Google Scholar] [CrossRef]
  19. Oogathoo, S.; Houle, D.; Duchesne, L.; Kneeshaw, D. Vapour pressure deficit and solar radiation are the major drivers of transpiration of balsam fir and black spruce tree species in humid boreal regions, even during a short-term drought. Agric. For. Meteorol. 2020, 291, 108063. [Google Scholar] [CrossRef]
  20. Llorens, P.; Poyatos, R.; Latron, J.; Delgado, J.; Oliveras, I.; Gallart, F. A multi-year study of rainfall and soil water controls on Scots pine transpiration under Mediterranean mountain conditions. Hydrol. Process. 2010, 24, 3053–3064. [Google Scholar] [CrossRef]
  21. Mitchell, P.J.; Benyon, R.G.; Lane, P.N.J. Responses of evapotranspiration at different topographic positions and catchment water balance following a pronounced drought in a mixed species eucalypt forest, Australia. J. Hydrol. 2012, 440–441, 62–74. [Google Scholar] [CrossRef]
  22. da Silva Sallo, F.; Sanches, L.; de Morais Dias, V.R.; da Silva Palácios, R.; de Souza Nogueira, J. Stem water storage dynamics of Vochysia divergens in a seasonally flooded environment. Agric. For. Meteorol. 2017, 232, 566–575. [Google Scholar] [CrossRef]
  23. Wang, H.; Tetzlaff, D.; Dick, J.J.; Soulsby, C. Assessing the environmental controls on Scots pine transpiration and the implications for water partitioning in a boreal headwater catchment. Agric. For. Meteorol. 2017, 240–241, 58–66. [Google Scholar] [CrossRef] [Green Version]
  24. Lagergren, F.; Lindroth, A. Transpiration response to soil moisture in pine and spruce trees in Sweden. Agric. For. Meteorol. 2002, 112, 67–85. [Google Scholar] [CrossRef]
  25. Granier, A.; Breda, N.; Biron, P.; Villette, S. A lumped water balance model to evaluate duration and intensity of drought constraints in forest stands. Ecol. Model. 1999, 116, 269–283. [Google Scholar] [CrossRef]
  26. Al-Yahyai, R.; Schaffer, B.; Davies, F.S. Physiological Response of Carambola Trees to Soil Water Depletion in Krome Soils. HortScience 2004, 39, 857B-857. [Google Scholar] [CrossRef] [Green Version]
  27. Wan, Y.; Yu, P.; Wang, Y.; Wang, B.; Yu, Y.; Wang, X.; Liu, Z.; Liu, X.; Wang, S.; Xiong, W. The Variation in Water Consumption by Transpiration of Qinghai Spruce among Canopy Layers in the Qilian Mountains, Northwestern China. Forests 2020, 11, 845. [Google Scholar] [CrossRef]
  28. Li, Z.; Yu, P.; Wang, Y.; Webb, A.A.; He, C.; Wang, Y.; Yang, L. A model coupling the effects of soil moisture and potential evaporation on the tree transpiration of a semi-arid larch plantation. Ecohydrology 2016, 10, e1764. [Google Scholar] [CrossRef]
  29. Li, Z.; Zhang, Y.; Wang, S.; Yuan, G.; Yang, Y.; Cao, M. Evapotranspiration of a tropical rain forest in Xishuangbanna, southwest China. Hydrol. Process. 2010, 24, 2405–2416. [Google Scholar] [CrossRef]
  30. Huang, J.; Zhou, Y.; Yin, L.; Wenninger, J.; Zhang, J.; Hou, G.; Zhang, E.; Uhlenbrook, S. Climatic controls on sap flow dynamics and used water sources of Salix psammophila in a semi-arid environment in northwest China. Environ. Earth Sci. 2014, 73, 289–301. [Google Scholar] [CrossRef]
  31. Thomas, F.M.; Foetzki, A.; Arndt, S.K.; Bruelheide, H.; Gries, D.; Li, X.; Zeng, F.; Zhang, X.; Runge, M. Water use by perennial plants in the transition zone between river oasis and desert in NW China. Basic Appl. Ecol. 2006, 7, 253–267. [Google Scholar] [CrossRef]
  32. Liu, Z.; Wang, Y.; Tian, A.; Webb, A.A.; Yu, P.; Xiong, W.; Xu, L.; Wang, Y. Modeling the Response of Daily Evapotranspiration and its Components of a Larch Plantation to the Variation of Weather, Soil Moisture, and Canopy Leaf Area Index. J. Geophys. Res. Atmos. 2018, 123, 7354–7374. [Google Scholar] [CrossRef]
  33. Asbjornsen, H.; Campbell, J.L.; Jennings, K.A.; Vadeboncoeur, M.A.; McIntire, C.; Templer, P.H.; Phillips, R.P.; Bauerle, T.L.; Dietze, M.C.; Frey, S.D.; et al. Guidelines and considerations for designing field experiments simulating precipitation extremes in forest ecosystems. Methods Ecol. Evol. 2018, 9, 2310–2325. [Google Scholar] [CrossRef] [Green Version]
  34. Vilhar, U. Comparison of drought stress indices in beech forests: A modelling study. Iforest Biogeosci. For. 2016, 9, 635–642. [Google Scholar] [CrossRef] [Green Version]
  35. Wang, Y.; Xiong, W.; Yu, P.; Shen, Z.; Guo, M.; Guan, W.; Ma, C.; Ye, B.; Guo, H. Study on the evapotranspiration of forest and vegetation in dryland. Sci. Soil Water Conserv. 2006, 4, 19–26. [Google Scholar] [CrossRef]
  36. Whitley, R.; Zeppel, M.; Armstrong, N.; Macinnis-Ng, C.; Yunusa, I.; Eamus, D. A modified Jarvis-Stewart model for predicting stand-scale transpiration of an Australian native forest. Plant Soil 2007, 305, 35–47. [Google Scholar] [CrossRef] [Green Version]
  37. Jarvis, P.G. The interpretation of the variations in leaf water potential and stomatal conductance found in canopies in the field. Philos. Trans. R. Soc. Lond. B Biol. Sci. 1997, 273, 593–610. [Google Scholar] [CrossRef]
  38. Yu, S.; Guo, J.; Liu, Z.; Wang, Y.; Ma, J.; Li, J.; Liu, F. Assessing the Impact of Soil Moisture on Canopy Transpiration Using a Modified Jarvis-Stewart Model. Water 2021, 13, 2720. [Google Scholar] [CrossRef]
  39. Petzold, R.; Schwärzel, K.; Feger, K.-H. Transpiration of a hybrid poplar plantation in Saxony (Germany) in response to climate and soil conditions. Eur. J. For. Res. 2010, 130, 695–706. [Google Scholar] [CrossRef]
  40. Li, H. Under Saihanwula Nature Reserve Different Vegetation Types in the Comparative Study of Soil Physical and Chemical Properties. Master’s Thesis, Inner Mongolia Agricultural University, Hohhot, China, 2010. [Google Scholar]
  41. Campbell, G.S.; Norman, J. An Introduction to Environmental Biophysics; Springer: New York, NY, USA, 1998. [Google Scholar]
  42. Qin, J. Drought and Salinity Resistant Physiology and Water Consumption Characteristics of Main Plantation Tree Species in High-Cold Region of Loess Plateau; Beijing Forestry University: Beijing, China, 2011. [Google Scholar]
  43. Granier, A. Une nouvelle methode pour la mesure dy flux de seve brute dans le trons des arbres. Ann. Sci. 1985, 22, 193–200. [Google Scholar] [CrossRef]
  44. Samuelson, L.J.; Stokes, T.A.; Ramirez, M.R.; Mendonca, C.C. Drought tolerance of a Pinus palustris plantation. For. Ecol. Manag. 2019, 451, 117557. [Google Scholar] [CrossRef]
  45. Wang, L.; Liu, Z.; Guo, J.; Wang, Y.; Ma, J.; Yu, S.; Yu, P.; Xu, L. Estimate canopy transpiration in larch plantations via the interactions among reference evapotranspiration, leaf area index, and soil moisture. For. Ecol. Manag. 2021, 481, 118749. [Google Scholar] [CrossRef]
  46. Granier, A.; Loustau, D.; Bréda, N. A generic model of forest canopy conductance dependent on climate, soil water availability and leaf area index. Ann. For. Sci. 2000, 57, 755–765. [Google Scholar] [CrossRef]
  47. Loritz, R.; Bassiouni, M.; Hildebrandt, A.; Hassler, S.K.; Zehe, E. Leveraging sap flow data in a catchment-scale hybrid model to improve soil moisture and transpiration estimates. Hydrol. Earth Syst. Sci. 2022, 26, 4757–4771. [Google Scholar] [CrossRef]
  48. She, D.; Xia, Y.; Shao, M.; Peng, S.; Yu, S. Transpiration and canopy conductance of Caragana korshinskii trees in response to soil moisture in sand land of China. Agrofor. Syst. 2012, 87, 667–678. [Google Scholar] [CrossRef]
  49. Liu, Z.; Wang, Y.; Wang, Y.; Guo, J.; Yu, P.; Wang, L.; Yu, S.; Liu, F. Separating meteorological condition and soil moisture controls on the variation in stand evapotranspiration of a larch plantation during three hydrological years. Glob. Ecol. Conserv. 2021, 27, e01548. [Google Scholar] [CrossRef]
  50. Schmidt, U.; Thöni, H.; Kaupenjohann, M. Using a boundary line approach to analyze N2O flux data from agricultural soils. Nutr. Cycl. Agroecosyst. 2000, 57, 119–129. [Google Scholar] [CrossRef]
  51. Ma, J.; Guo, J.; Liu, Z.; Wang, Y.; Zhang, Z. Diurnal variations of stand transpiration of Larix principis-rupprechtii forest and its response to environmental factors in Liupan Mountains of northwestern China. J. Beijing For. Univ. 2020, 42, 1–11. [Google Scholar] [CrossRef]
  52. Wilby, R.L. Uncertainty in water resource model parameters used for climate change impact assessment. Hydrol. Process. 2005, 19, 3201–3219. [Google Scholar] [CrossRef]
  53. Mitchell, P.L. Misuse of regression for empirical validation of models. Agric. Syst. 1997, 54, 313–326. [Google Scholar] [CrossRef]
  54. Rudiyanto; Minasny, B.; Setiawan, B.I.; Saptomo, S.K.; McBratney, A.B. Open digital mapping as a cost-effective method for mapping peat thickness and assessing the carbon stock of tropical peatlands. Geoderma 2018, 313, 25–40. [Google Scholar] [CrossRef]
  55. Whitley, R.; Taylor, D.; Macinnis-Ng, C.; Zeppel, M.; Yunusa, I.; O’Grady, A.; Froend, R.; Medlyn, B.; Eamus, D. Developing an empirical model of canopy water flux describing the common response of transpiration to solar radiation and VPD across five contrasting woodlands and forests. Hydrol. Process. 2013, 27, 1133–1146. [Google Scholar] [CrossRef]
  56. Zhang, K.; Kimball, J.S.; Nemani, R.R.; Running, S.W.; Hong, Y.; Gourley, J.J.; Yu, Z. Vegetation Greening and Climate Change Promote Multidecadal Rises of Global Land Evapotranspiration. Sci. Rep. 2015, 5, 15956. [Google Scholar] [CrossRef] [PubMed] [Green Version]
  57. Knutti, R.; Rogelj, J.; Plattner, G.-K.; Sedláček, J.; Allen, S.K.; Stocker, T.F. IPCC. Climate Change 2013: The Physical Science Basis. Contribution of Working Group I to the Fifth Assessment Report of the Intergovernmental Panel on Climate Change; Cambridge University Press: Cambridge, UK; New York, NY, USA, 2013. [Google Scholar] [CrossRef] [Green Version]
  58. Duan, H.; Duursma, R.A.; Huang, G.; Smith, R.A.; Choat, B.; O’Grady, A.P.; Tissue, D.T. Elevated [CO2] does not ameliorate the negative effects of elevated temperature on drought-induced mortality in Eucalyptus radiata seedlings. Plant Cell Environ. 2014, 37, 1598–1613. [Google Scholar] [CrossRef] [PubMed]
  59. Adams, H.D.; Guardiola, M.; Barron-Gafford, G.; Villegas, J.C.; Breshears, D.D.; Zou, C.B.; Troch, P.A.; Huxman, T.E. Temperature sensitivity of drought-induced tree mortality portends increased regional die-off under global-change-type drought. Proc. Natl. Acad. Sci. USA 2009, 106, 7063–7066. [Google Scholar] [CrossRef] [Green Version]
  60. David, T.S.; Henriques, M.O.; Kurz-Besson, C.; Nunes, J.; Valente, F.; Vaz, M.; Pereira, J.S.; Siegwolf, R.; Chaves, M.M.; Gazarini, L.C.; et al. Water-use strategies in two co-occurring Mediterranean evergreen oaks: Surviving the summer drought. Tree Physiol. 2007, 27, 793–803. [Google Scholar] [CrossRef] [PubMed] [Green Version]
  61. Dawson, T. Determining water use by trees and forests from isotopic, energy balance and transpiration analyses: The roles of tree size and hydraulic lift. Tree Physiol. 1996, 16, 263–272. [Google Scholar] [CrossRef] [Green Version]
  62. Meinzer, F.C.; Andrade, J.L.; Goldstein, G.; Holbrook, N.M.; Cavelier, J.; Wright, S.J. Partitioning of soil water among canopy trees in a seasonally dry tropical forest. Oecologia 1999, 121, 293–301. [Google Scholar] [CrossRef]
  63. Sinacore, K.; Asbjornsen, H.; Hernandez-Santana, V.; Hall, J.S. Differential and dynamic water regulation responses to El Niño for monospecific and mixed species planted forests. Ecohydrology 2020, 13, e2238. [Google Scholar] [CrossRef]
  64. Chen, L.; Zhang, Z.; Li, Z.; Tang, J.; Caldwell, P.; Zhang, W. Biophysical control of whole tree transpiration under an urban environment in Northern China. J. Hydrol. 2011, 402, 388–400. [Google Scholar] [CrossRef]
  65. Han, C.; Chen, N.; Zhang, C.; Liu, Y.; Khan, S.; Lu, K.; Li, Y.; Dong, X.; Zhao, C. Sap flow and responses to meteorological about the Larix principis-rupprechtii plantation in Gansu Xinlong mountain, northwestern China. For. Ecol. Manag. 2019, 451, 117519. [Google Scholar] [CrossRef]
  66. Fried, J.S.; Torn, M.S.; Mills, E. The Impact of Climate Change on Wildfire Severity: A Regional Forecast for Northern California. Clim. Chang. 2004, 64, 169–191. [Google Scholar] [CrossRef]
Figure 1. Location of the study area in Northeast China, and the pictures of the Betula platyphylla Sukaczev Forest; equipment for measuring sap flow and the weather station.
Forests 13 01729 g001
Figure 2. The daily variation in weather parameters (precipitation (ad), solar radiation (Rn) (eh), vapor pressure deficit (VPD) (il), and air temperature (mp), relative extractable water (REW) of the 0 to 80 cm soil layer (qt), and T t of small trees (uw), T t of large trees (xaa), and T (ab,ac) in the Betula platyphylla Sukaczev plot from May to September of the ‘wet’ year, ‘normal’ year, ‘dry’ year, and ‘wetter’ year. No available data of T t for small trees and no T data in the ‘wet’ year, and ‘dry’ year.
Forests 13 01729 g002
Figure 3. Mean value ± standard deviation of monthly mean T t of small and large trees in the ‘wet’ (a), ‘normal’ (b), ‘dry’ (c), and ‘wetter’ (d) years. Lower case letters indicate the difference in the T t of small trees in different hydrological years (n = 331, p < 0.001), upper case letters denote differences in the T t of large tree in different hydrological years (n = 434, p < 0.001).
Forests 13 01729 g003
Figure 4. Response of the daily T of the white birch stand to the varying Rn (a), VPD (b), and REW (c) during odd days in 2017, 2021 (May–September).
Forests 13 01729 g004
Figure 5. Comparison of the observed and simulated T during the calibration (odd days in 2017 and 2021, (a)) and validation (even days in 2017 and 2021, (b)) phases.
Forests 13 01729 g005
Figure 6. The relative contribution rates of Rn, VPD, and REW to T in the ‘wet’ (a), ‘normal’ (b), ‘dry’ (c), and ‘wetter’ (d) years compared to the reference total T.
Forests 13 01729 g006
Table 1. Characteristics of sample trees selected for the measurement of sap flow.
YearSample Tree No.Tree Height
(m)
Diameter at Breast
Height (cm)
Sapwood Thickness (cm)Sapwood Area
(cm2)
2015, 2017114.5153.0685.06
213.617.63.67121.58
31519.14.03145.97
415.2214.49180.44
2018511.314.12.8574.07
615.117.43.62118.52
714.519.94.22159.99
816.221.34.56186.25
2021915.814.32.9076.44
1013.215.53.1791.53
111420.94.46178.52
1215.622.74.90214.73
Note: The same four sample trees of different diameter classes were used for observations in 2015 and 2017, and another four sample trees of different diameter classes were reselected for observations in 2018 and 2021.
Table 2. Division of hydrological years.
YearHydrological YearsAnnual Precipitation (mm)Percentage Difference from the Multi-Year Average
2015Wet year445+18.5%
2017Normal year394+5%
2018Dry year223−40.7%
2021Wetter year561+49.3%
Publisher’s Note: MDPI stays neutral with regard to jurisdictional claims in published maps and institutional affiliations.

