

The Impact of Thinning and Clear Cut on the Ecosystem Carbon Storage of Scots Pine Stands under Maritime Influence in Flanders, Belgium
Abstract
:1. Introduction
2. Materials and Methods
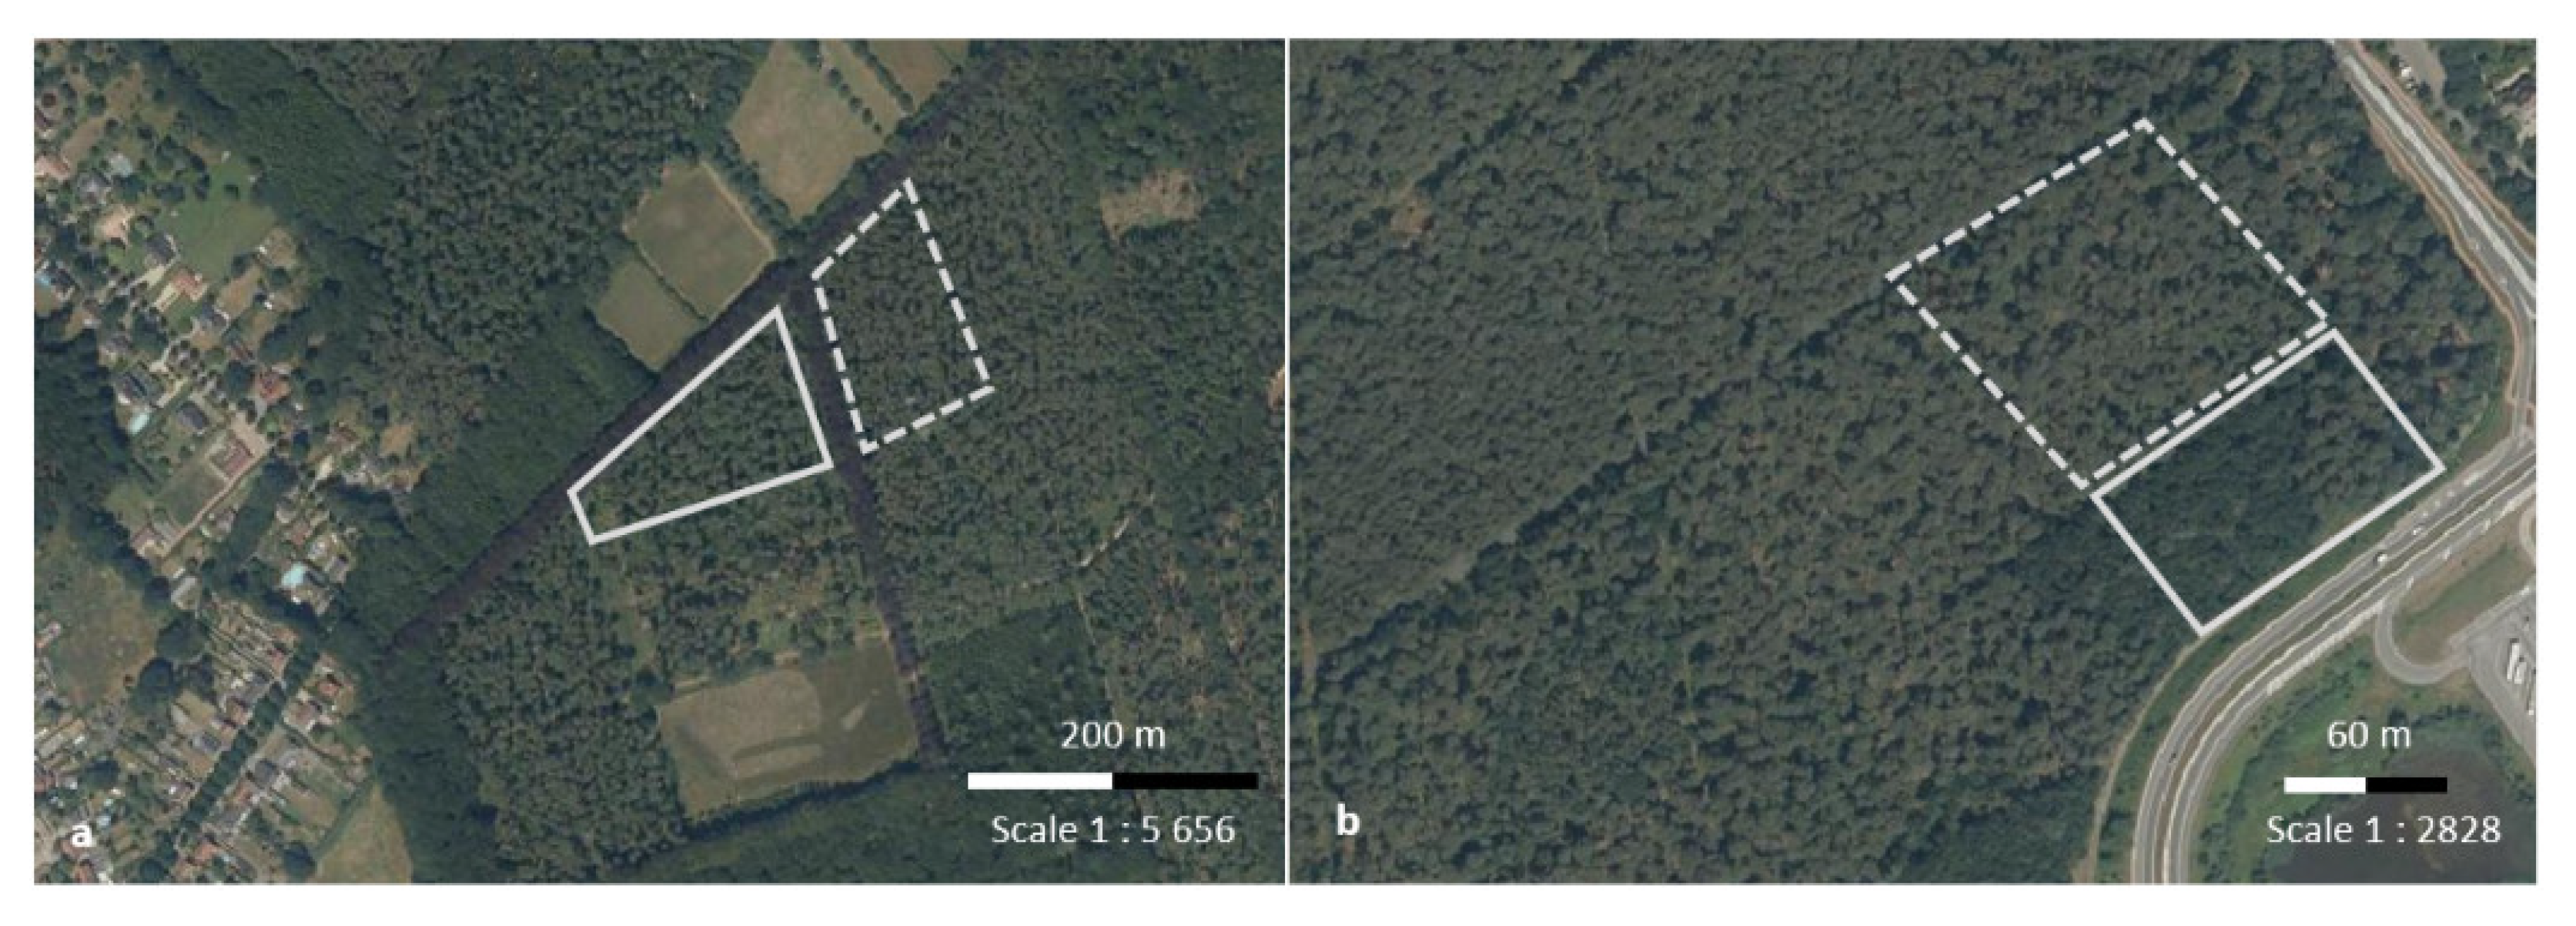
2.1. Site Description
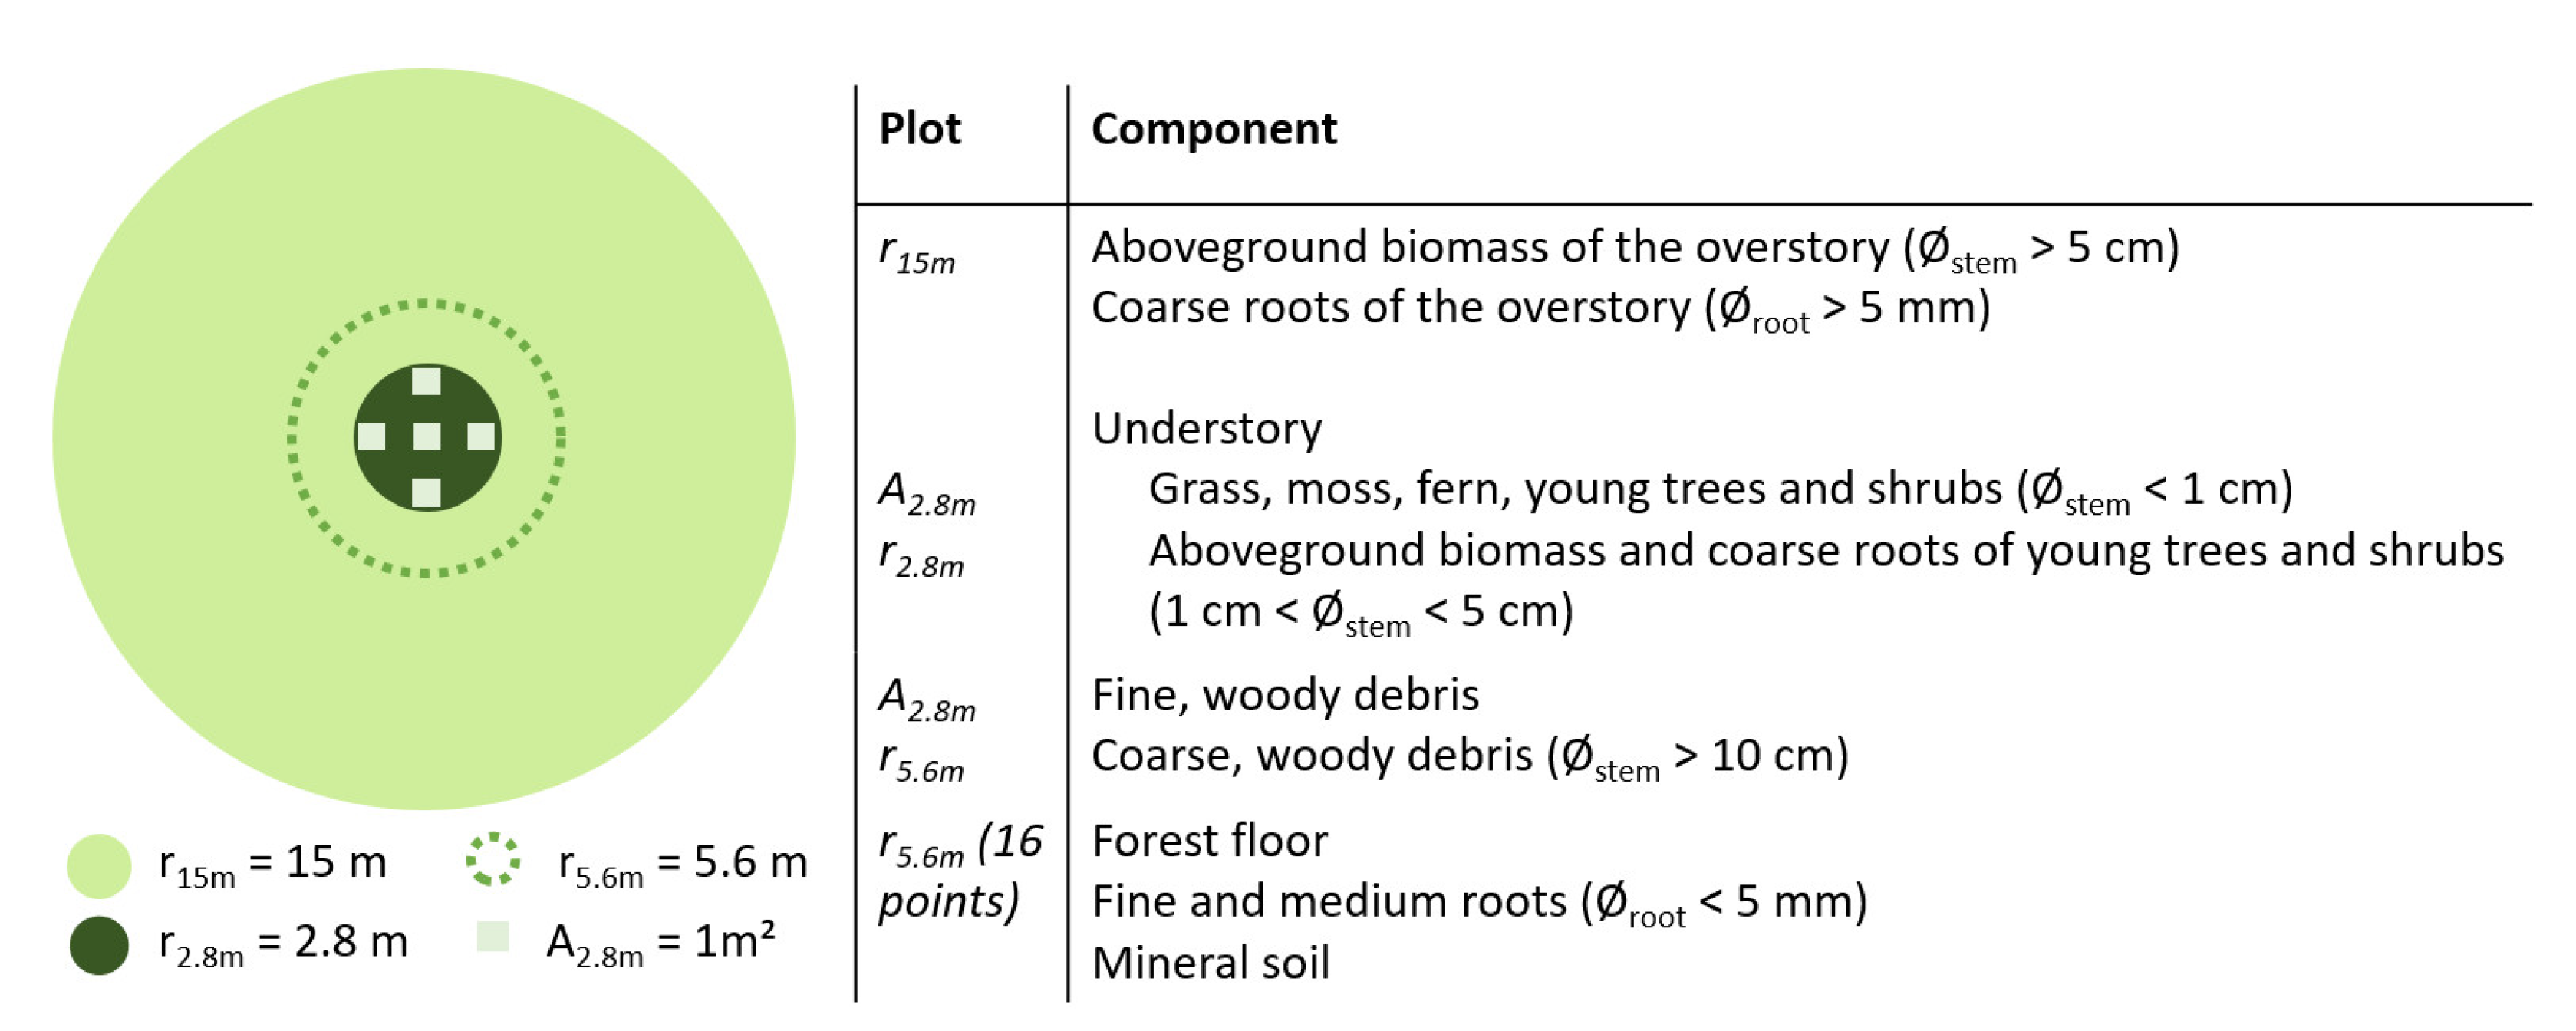
2.2. Data Collection
2.3. Measurements of Phytomass
2.3.1. Aboveground Biomass of the Overstory
2.3.2. Understory
2.3.3. Belowground Biomass
2.4. Litter
2.4.1. Forest Floor
2.4.2. Woody Debris
2.5. Mineral Soil
2.6. C Content and C Stocks
2.7. Data Analysis
2.7.1. Allometric Relationships
2.7.2. Statistics
3. Results
3.1. Phytomass
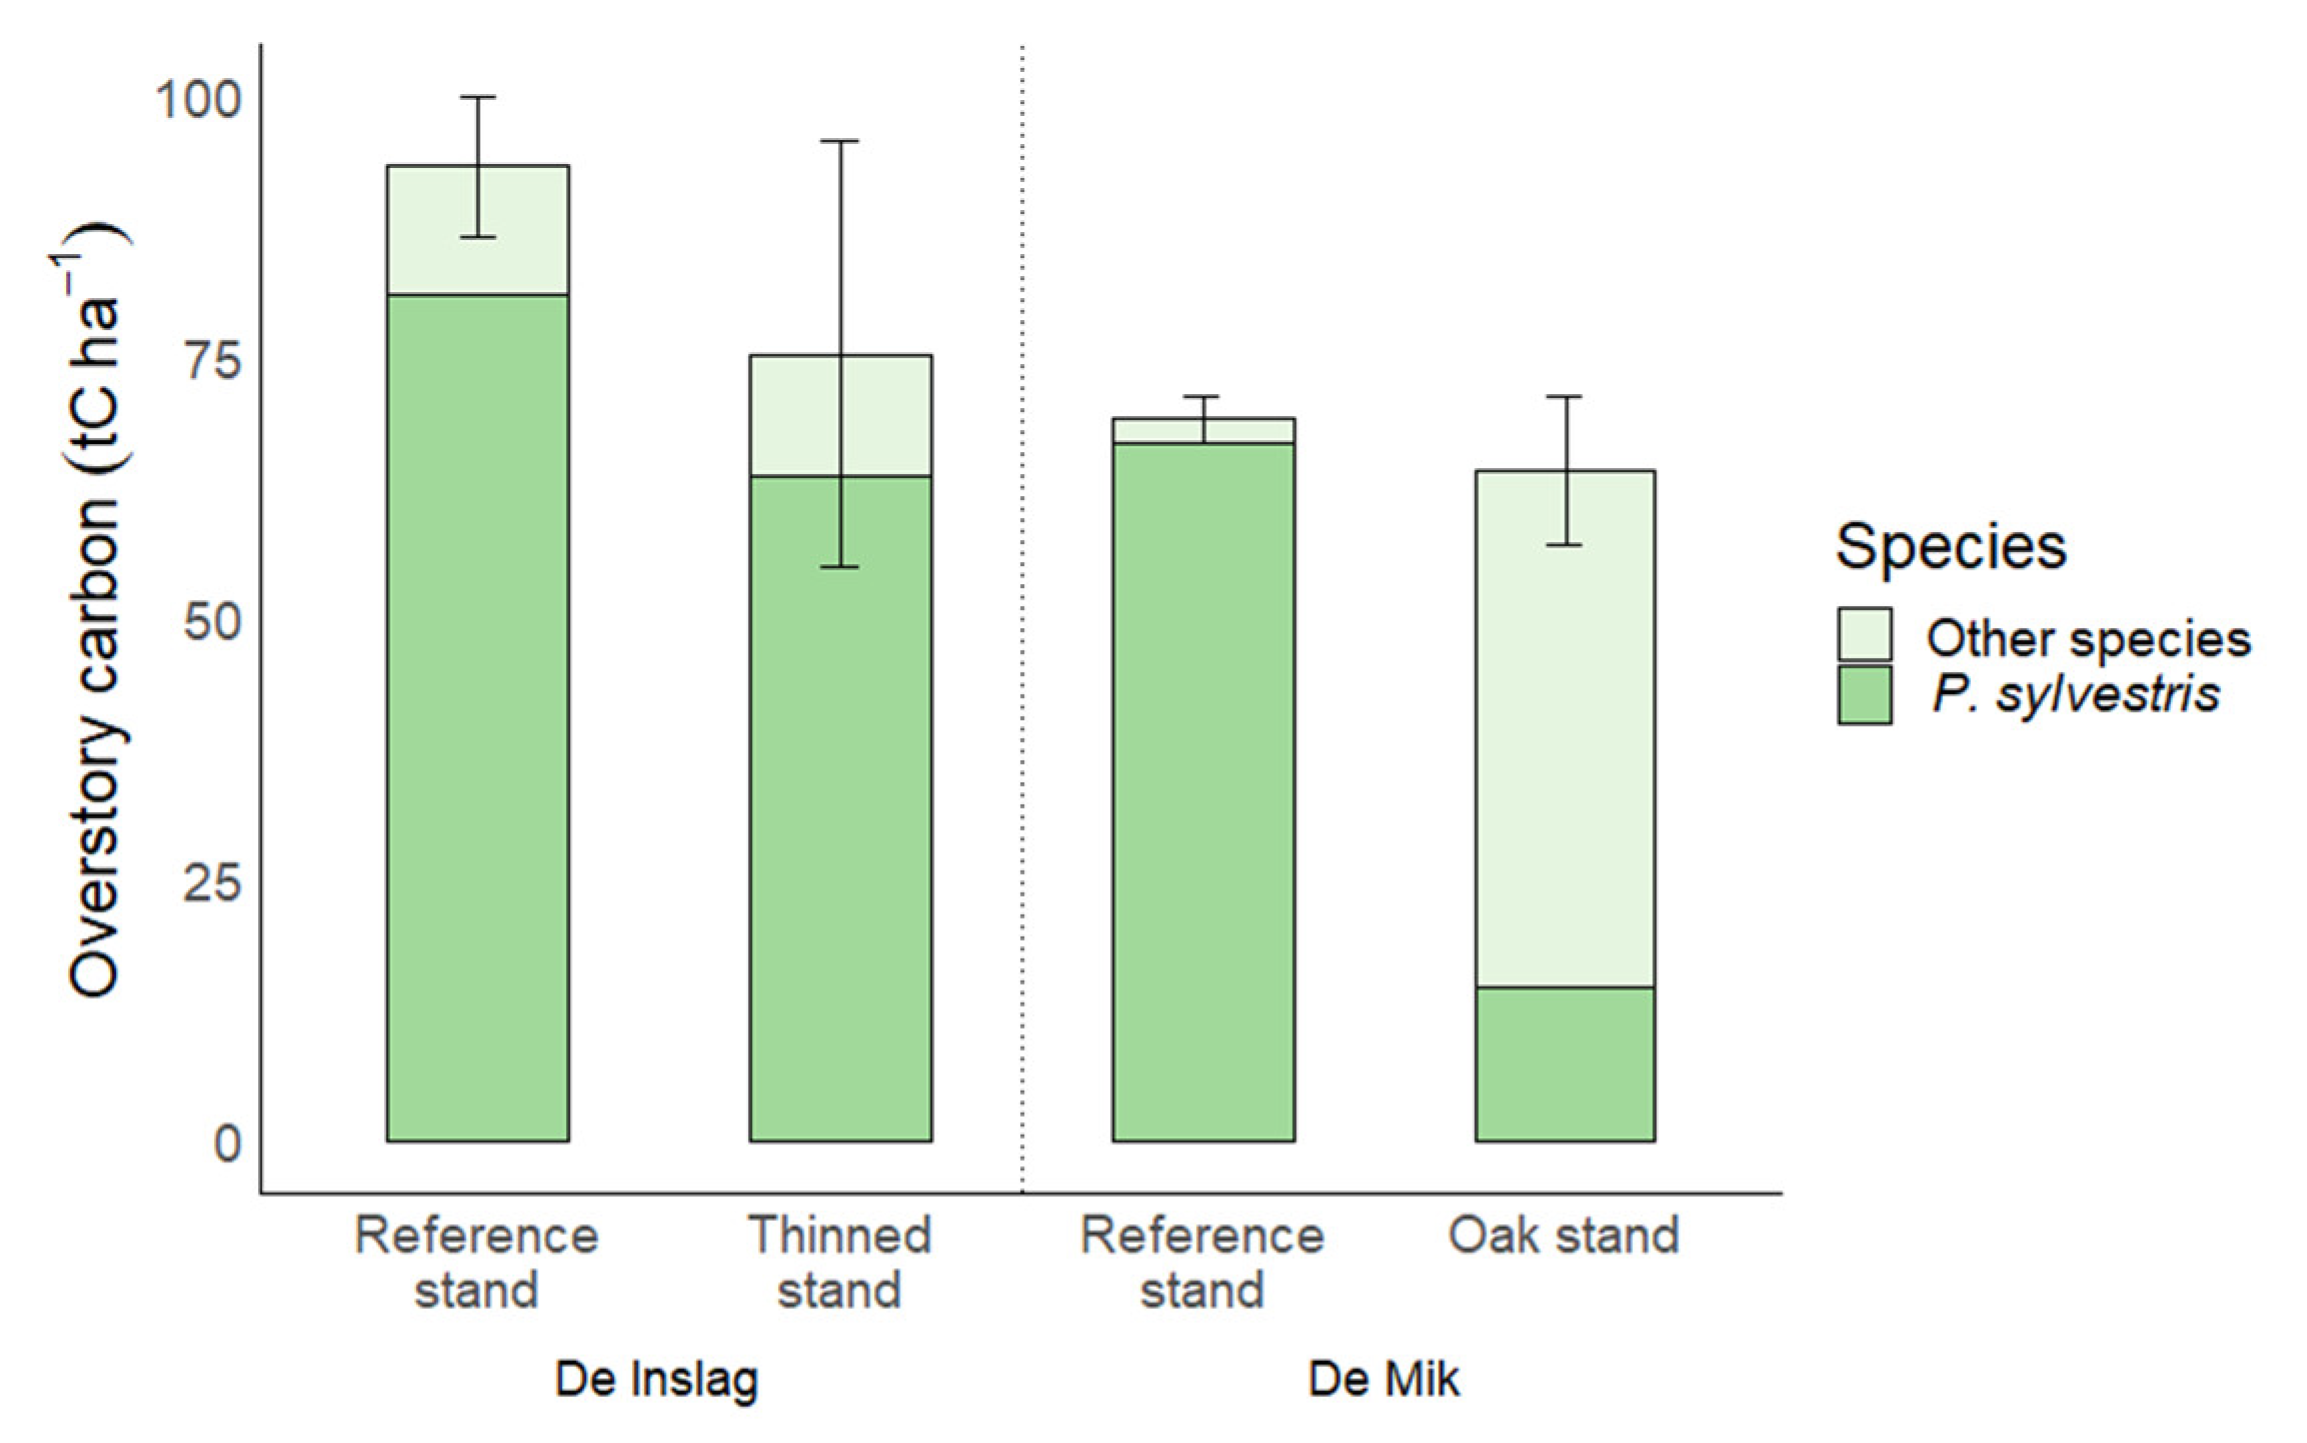
3.1.1. Overstory
3.1.2. Understory
3.1.3. Belowground Biomass
3.2. Litter
3.2.1. Forest Floor
3.2.2. Woody Debris
3.3. Mineral Soil
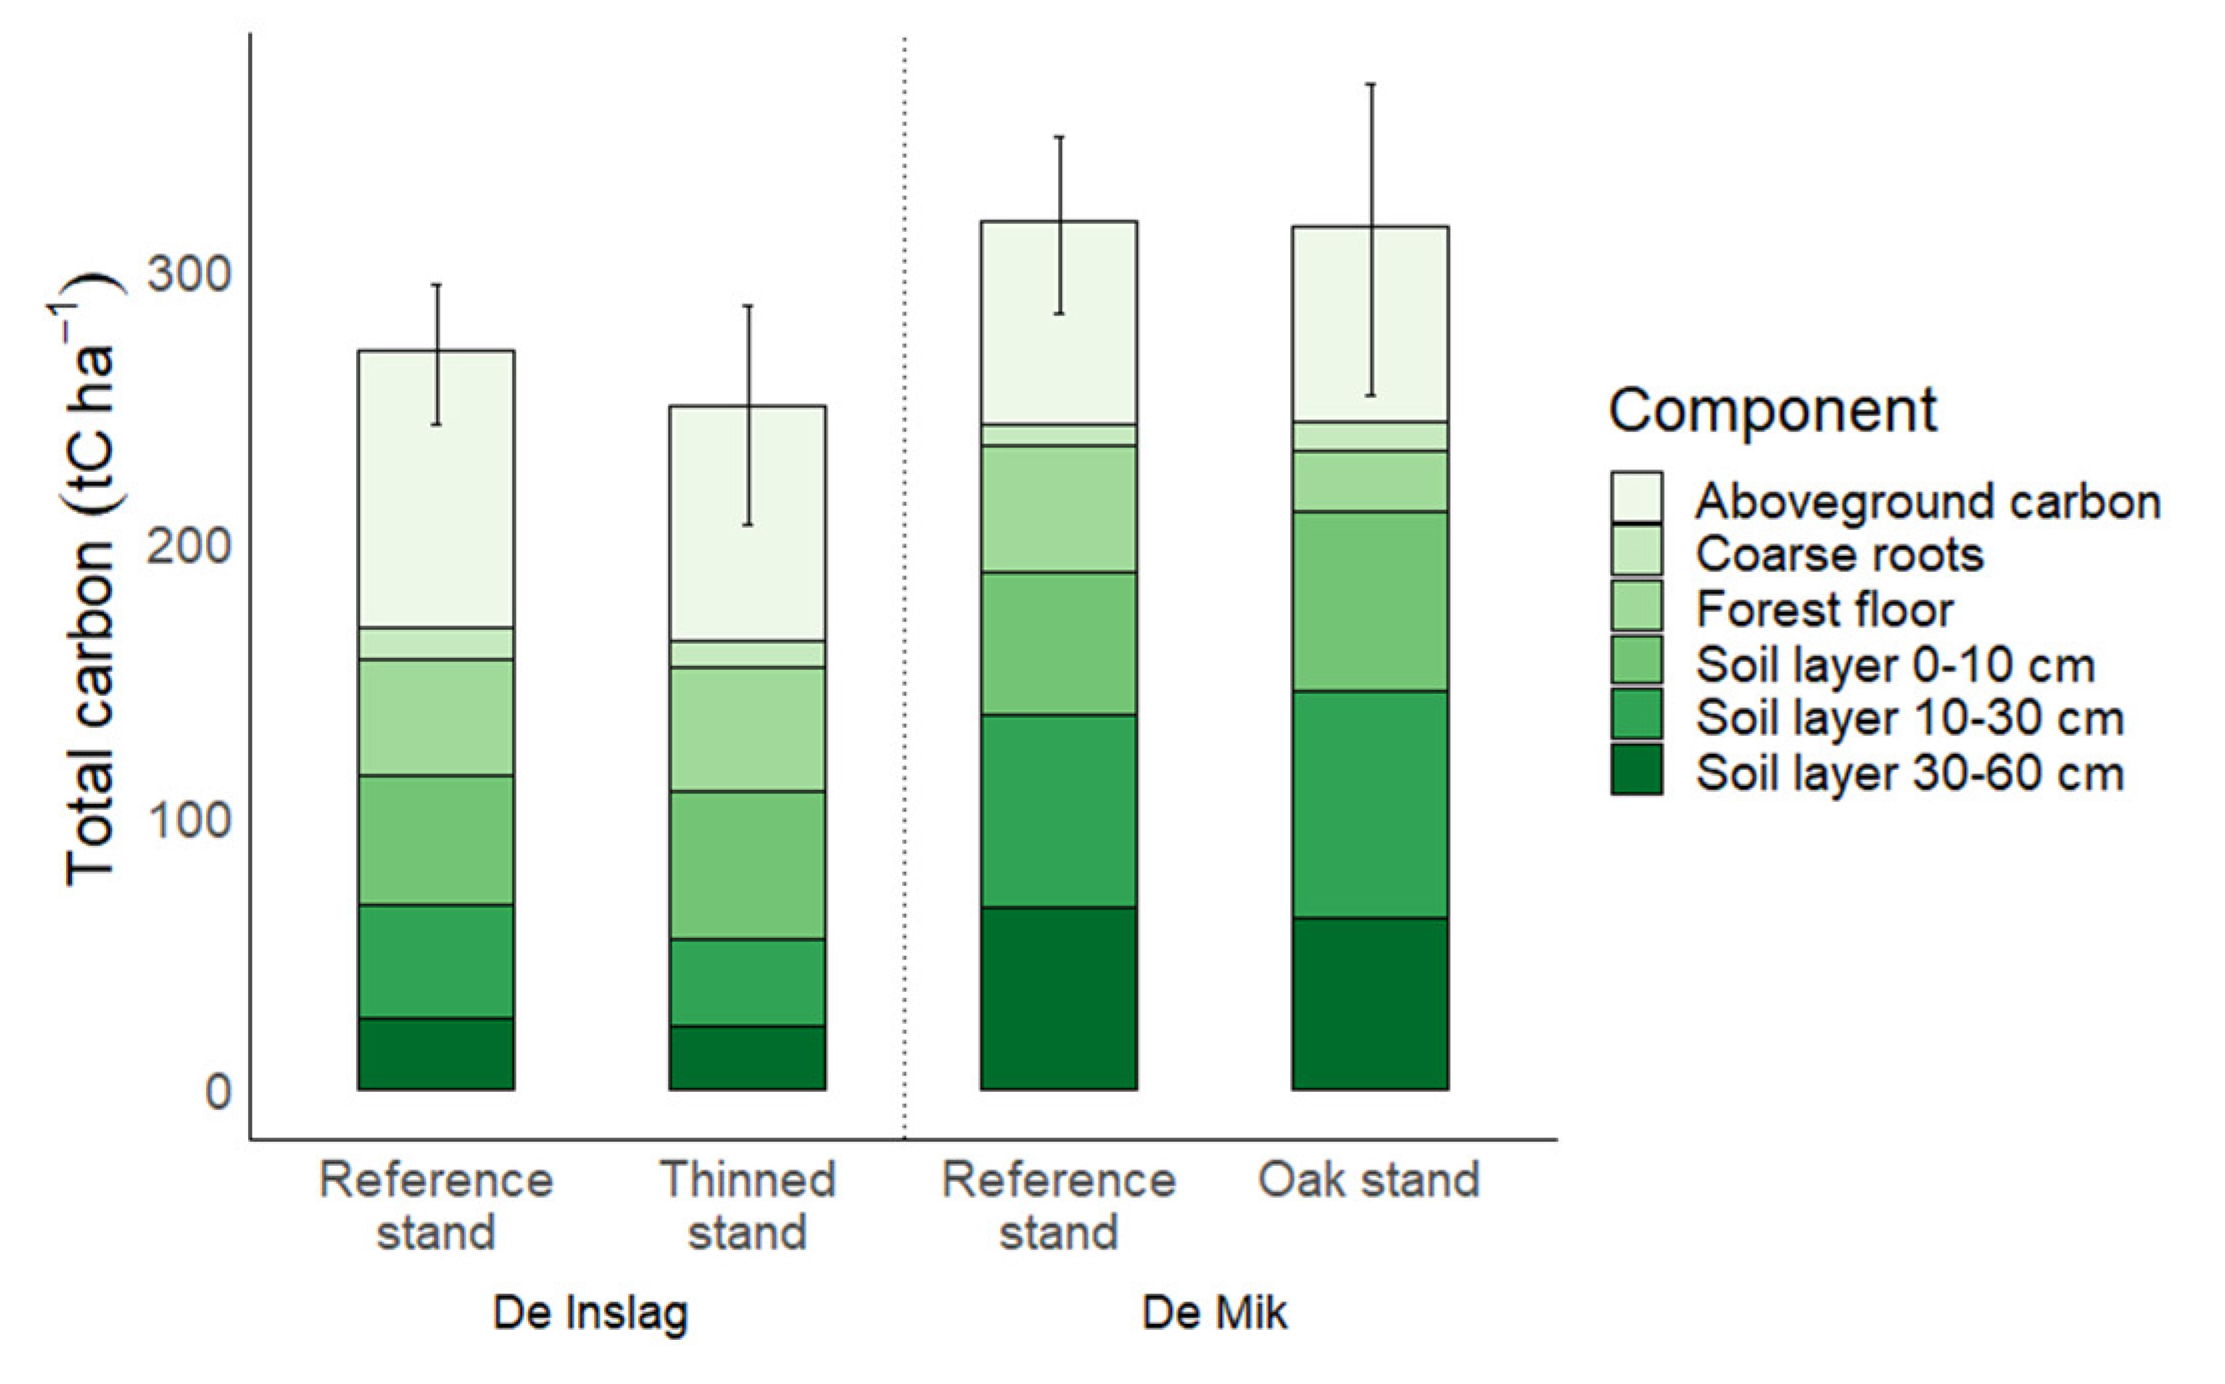
3.4. Total Ecosystem
4. Discussion
4.1. Aboveground Biomass
4.2. Roots
4.3. Forest Floor
4.4. Mineral Soil
4.5. Woody Debris
4.6. Total Ecosystem
4.7. Methodological Limitations
5. Conclusions
Author Contributions
Funding
Data Availability Statement
Acknowledgments
Conflicts of Interest
Appendix A. Allometric Relations

| Species | Aboveground Biomass (AGB) (kg/Tree) | Biomass Coarse Roots (BGB) (kg/Tree) | Remarks |
|---|---|---|---|
| Overstory(D > 5 cm) | |||
| Acer pseudoplantanus L. | AGBleave s= 10(−1.1619)+1.2237 × LOG(DBH) (Q. robur) [59] AGBtotal = e(−2.7018)+2.5751 × ln(DBH) + AGBleaves [60] | BGB = 0.040113 × DBH2.227842 (Q. robur) [61] | a |
| Amelanchier arborea Fernald | AGBLeaves = 10(−1.1619)+1.2237 × LOG(DBH) (Q. robur) [59] AGBTotal = 0.0927 × DBH2.5097+ AGBLeaves (Q. robur) [62] | BGB = 0.040113 × DBH2.227842 (Q. robur) [61] | a |
| Betula pendula | AGBLeaves, Inslag = 0.80 kg/tree AGBLeaves, Mik = 1.06 kg/tree [63] AGBBranches = 0.0742 × DBH2,24 AGBStem = 0.193 × DBH2,25 AGBTotal = 0.2511 × DBH2.29 + AGBleaves [64] | BGB = 0.04582 × DBH2.23951 [61] | AGBTotal: De Inslag AGBBranches and AGBStem: Mik a |
| Castanea sativa Mill. | AGBLeaves = 10(−1.1619)+1.2237 × LOG(DBH) (Q. robur) [59] AGBTotal = 0.0927 × DBH2.5097+ AGBLeaves (Q. robur) [62] | BGB = 0.040113 × DBH2.227842 (Q. robur) [61] | a |
| Corylus avellana | AGBTotal = 0.068 × DBH2.745 [65] | BGB = 0.040113 × DBH2.227842 (Q. robur) [61] | a |
| Fagus sylvatica | AGBLeaves = 0.0167 × DBH2.951 × H−1.101 AGBBranches = 0.0114 × DBH3.682 × H−1.031 AGBStem = 0.0109 × DBH1.951 × H1.262 AGBTotal = 0.0306 × DBH2.347 × H0.590 [66] | BGB = e(−4.1302)+2.6099 × ln(DBH) [67] | AGBTotal: De Inslag AGBLeaves AGBBranches and AGBStem: Mik |
| Frangula alnus Mill. | AGBTotal = 0.121 × DBH2.480 [65] | BGB = 0.040113 × DBH2.227842 (Q. robur) [61] | a |
| Ilex aquifolium | AGBLeaves = 10(−1.1619)+1.2237 × LOG(DBH) (Q. robur) [59] AGBTotal = 0.0927 × DBH2.5097+ AGBLeaves (Q. robur) [62] | BGB = 0.040113 × DBH2.227842 (Q. robur) [61] | a |
| Pinus sylvestris L. | AGBbranches = 0.0022 × DBH2.9123 AGBLeaves = 0.0045 × DBH2.2372 AGBStem = 0.1227 × DBH2.3272 AGBtotal = AGBbranches + AGBLeaves + AGBStem [40] | BGB = 0.3399 × DBH1.4728 [40] | |
| Prunus serotina Ehrh. | AGBLeaves = 10(−1.1619)+1.2237 × LOG(DBH) (Q. robur) [59] AGBTotal = 0.0927 × DBH2.5097+ AGBLeaves (Q. robur) [62] | BGB = 0.040113 × DBH2.227842 (Q. robur) [61] | a |
| Pseudotsuga menziesii (Mirb.) Franco | AGB = e(−1.620)+2.410 × ln(DBH) [66] | BGB = 0.040113 × DBH2.227842 (Q. robur) [61] | a |
| Quercus robur | AGBLeaves = 10(−1.1619)+1.2237 × LOG(DBH) [59] AGBBranches = 0.0149 × DBH2.5994 AGBstem = 0.0722 × DBH2.5135 AGBTotal = 0.0927 × DBH2.5097+ AGBLeaves [62] | BGB = 0.040113 × DBH2.227842 [61] | AGBTota: De Inslag AGBBranches, AGBstem: De Mik a |
| Quercus rubra | AGBLeaves = 10(−1.1619)+1.2237 × LOG(DBH) (Q. robur) [59] AGBTotal = 0.0927 × DBH2.5097+ AGBLeaves (Q. robur) [62] | BGB = 0.040113 × DBH2.227842 (Q. robur) [61] | a |
| Salix caprea L. | AGBLeaves = 10(−1.1619)+1.2237 × LOG(DBH) (Q. robur) [59] AGBTotal = 0.0927 × DBH2.5097+ AGBLeaves (Q. robur) [62] | BGB = 0.040113 × DBH2.227842 (Q. robur) [61] | a |
| Sorbus aucuparia | AGBTotal = 0.164 × DBH2.047 (De Inslag) [65] AGBLeaves = 10(−1.1619)+1.2237 × LOG(DBH) (Mik, Q. robur) [59] AGBBranches = 0.0149 × DBH2.5994 AGBstem = 0.0722 × DBH2.5135 (Mik, Q. robur) [62] | BGB = 0.040113 × DBH2.227842 (Q. robur) [61] | a |
| Taxus baccata L. | AGBbranches = 0.0022 × DBH2.9123 AGBLeaves = 0.0045 × DBH2.2372 AGBStem = 0.1227 × DBH2.3272 AGBtotal = AGBbranches + AGBLeaves + AGBStem (P. sylvestris) [40] | BGB = 0.3399 × DBH1.4728 (P. sylvestris) [40] | |
| Young trees (D > 5 cm) | |||
| Betula pendula | AGBLeaves = e(−1.6938)+1.7455 × ln(D) (Q. robur) [68] AGBTotal = (0.259 × D2.132)/1000 + AGBLeaves [69] | BGB = 0.16 × AGB | |
| Frangula alnus | AGBLeaves = e(−1.6938)+1.7455 × ln(D) [68] AGBTotal = (0.027 × (D)2.769)/1000 + AGBLeaves [69] | BGB = 0.21 × AGB | |
| Quercus robur | AGBLeaves = e(−1.6938)+1.7455 × ln(D) [68] AGBTotal = (0.027 × (D)2.769)/1000 + AGBLeaves [69] | BGB = 0.23 × AGB | |
| Pinus sylvestris L. | AGBLeaves = e(−5.478)+2,494 × ln(DBH) [70] AGBTotal = (0.015 × D2.881)/1000 + AGBLeaves [69] | BGB = 0.17 × AGB | Needles: Eq. from literature uses DBH; here, D was used, resulting in a small error |
| Sorbus aucuparia | AGBLeaves = e(−1.6938)+1.7455 × ln(D) (Q. robur) [68] AGBTotal = (0.143 × D2.064)/1000+AGBLeaves [69] | BGB = 0.23 × AGB | |
| Rhododendron | Biomass per volume-unit (Appendix B): AGBTotal = 68,131.70 g/m3 | Root/shoot = 0.68 [71] | BGB: root/shoot ratio of Phillyrea latifolia L |
Appendix B. Calculations of the Allometric Relationships for Rhododendron
References
- Fahey, T.J.; Woodbury, P.B.; Battles, J.J.; Goodale, C.L.; Hamburg, S.P.; Ollinger, S.V.; Woodall, C.W. Forest carbon storage: Ecology, management, and policy. Front. Ecol. Environ. 2010, 8, 245–252. [Google Scholar] [CrossRef] [Green Version]
- Hui, D.; Deng, Q.; Tian, H.; Luo, Y. Climate change and carbon sequestration in forest ecosystems. In Handbook of Climate Change Mitigation and Adaptation, 2nd ed.; Chen, W.-Y., Suzuki, T., Lackner, M., Eds.; Springer International Publishing: Cham, Switserland, 2017; Volume 555, p. 594. [Google Scholar] [CrossRef]
- Falkowski, P.; Scholes, R.J.; Boyle, E.E.A.; Canadell, J.; Canfield, D.; Elser, J.; Gruber, N.; Hibbard, K.; Högberg, P.; Linder, S.; et al. The global carbon cycle: A test of our knowledge of earth as a system. Science 2000, 290, 291–296. [Google Scholar] [CrossRef] [PubMed] [Green Version]
- Campioli, M.; Vicca, S.; Luyssaert, S.; Bilcke, J.; Ceschia, E.; Iii, F.S.C.; Ciais, P.; Fernández-Martínez, M.; Malhi, Y.; Obersteiner, M.; et al. Biomass production efficiency controlled by management in temperate and boreal ecosystems. Nat. Geosci. 2015, 8, 843–846. [Google Scholar] [CrossRef]
- Anderson-Teixeira, K.J.; Herrmann, V.; Morgan, R.B.; Bond-Lamberty, B.; Cook-Patton, S.C.; Ferson, A.E.; Muller-Landau, H.C.; Wang, M.M. Carbon cycling in mature and regrowth forests globally. Environ. Res. Lett. 2021, 16, 053009. [Google Scholar] [CrossRef]
- De Deyn, G.B.; Cornelissen, J.H.; Bardgett, R.D. Plant functional traits and soil carbon sequestration in contrasting biomes. Ecol. Lett. 2008, 11, 516–531. [Google Scholar] [CrossRef]
- Cotrufo, M.F.; Wallenstein, M.D.; Boot, C.M.; Denef, K.; Paul, E. The Microbial Efficiency-Matrix Stabilization (MEMS) framework integrates plant litter decomposition with soil organic matter stabilization: Do labile plant inputs form stable soil organic matter? Glob. Chang. Biol. 2013, 19, 988–995. [Google Scholar] [CrossRef] [Green Version]
- Ameray, A.; Bergeron, Y.; Valeria, O.; Montoro Girona, M.; Cavard, X. Forest Carbon Management: A Review of Silvicultural Practices and Management Strategies Across Boreal, Temperate and Tropical Forests. Curr. For. Rep. 2021, 7, 245–266. [Google Scholar] [CrossRef]
- Bonan, G.B. Forests and climate change: Forcings, feedbacks, and the climate benefits of forests. Science 2008, 320, 1444–1449. [Google Scholar] [CrossRef] [Green Version]
- Pan, Y.; Birdsey, R.A.; Fang, J.; Houghton, R.; Kauppi, P.E.; Kurz, W.A.; Phillips, O.L.; Shvidenko, A.; Lewis, S.L.; Canadell, J.G.; et al. A large and persistent carbon sink in the world’s forests. Science 2011, 333, 988–993. [Google Scholar] [CrossRef]
- Mayer, M.; Prescott, C.E.; Abaker, W.E.; Augusto, L.; Cécillon, L.; Ferreira, G.W.; James, J.; Jandl, R.; Katzensteiner, K.; Laclau, J.-P.; et al. Tamm Review: Influence of forest management activities on soil organic carbon stocks: A knowledge synthesis. For. Ecol. Manag. 2020, 466, 118127. [Google Scholar] [CrossRef]
- den Ouden, J.; Muys, B.; Mohren, G.M.J.; Verheyen, K. Bosecologie en Bosbeheer; Acco: Leuven, Belgium, 2010. [Google Scholar]
- Van der Meijden, R. Heukels Flora van Nederland 23e Druk; Wolters-Noordhoff: Groningen, The Netherlands, 2005. [Google Scholar]
- Alonso, I.; Weston, K.; Gregg, R.; Morecroft, M. Carbon storage by habitat: Review of the evidence of the impacts of management decisions and condition of carbon stores and sources. In Natural England Research Reports; Number NERR043; Natural England: Pitlochry, UK, 2012. [Google Scholar]
- Adriaens, T.; Cartuyvels, E.; Denys, L.; Devisscher, S.; Oldoni, D.; Packet, J.; Provoost, S.; Scheers, K.; Soors, J.; Vandevoorde, B.; et al. Invasieve Exoten in Vlaanderen: Toestand en beleidsaanbevelingen. Uitgebreid achtergrondrapport bij het Natuurrapport 2020. In Rapporten van Het Instituut voor Natuur- en Bosonderzoek 2020; Instituut voor Natuur- en Bosonderzoek: Belgium, Brussel, 2020; Volume 41. [Google Scholar] [CrossRef]
- Agency for Nature and Forest (ANB). Meetvraag 3: Bestandsopbouw. Vlaamse Bosinventaris (1997–1999, 2009–2019). Available online: https://www.natuurenbos.be/vlaamse-bosinventaris/oppervlakteperbestandstype.html (accessed on 21 December 2021).
- Verheyen, K.; De Schrijver, A.; Wuyts, K.; Gielis, M.; Van Gossum, P.; Geudens, G.; Van Herzele, A.; De Boever, L.; Vanhellemont, M. Van dennenplantages naar een beloofd land?! Theoretische en praktische aspecten van bosomvorming. Silva Belg. 2007, 114, 20–26. [Google Scholar]
- Agency for Nature and Forest (ANB). Bosomvorming [Brochure]; Agency for Nature and Forest: Brussels, Belgium, 2008. [Google Scholar]
- Saha, S.; Kuehne, C.; Kohnle, U.; Brang, P.; Ehring, A.; Geisel, J.; Leder, B.; Muth, M.; Peterson, R.; Peter, J.; et al. Growth and quality of young oaks (Quercus robur and Quercus petraea) grown in cluster plantings in central Europe: A weighted meta-analysis. For. Ecol. Manag. 2012, 283, 106–118. [Google Scholar] [CrossRef]
- del Río, M.; Bravo-Oviedo, A.; Pretzsch, H.; Löf, M.; Ruiz-Peinado, R. A review of thinning effects on Scots pine stands: From growth and yield to new challenges under global change. For. Syst. 2017, 26, eR03S. [Google Scholar] [CrossRef]
- Zhou, D.; Zhao, S.Q.; Liu, S.; Oeding, J. A meta-analysis on the impacts of partial cutting on forest structure and carbon storage. Biogeosciences 2013, 10, 3691–3703. [Google Scholar] [CrossRef] [Green Version]
- Ruiz-Peinado, R.; Bravo-Oviedo, A.; Montero, G.; Del Río, M. Carbon stocks in a Scots pine afforestation under different thinning intensities management. Mitig. Adapt. Strateg. Glob. Chang. 2016, 21, 1059–1072. [Google Scholar] [CrossRef]
- Seedre, M.; Felton, A.; Lindbladh, M. What is the impact of continuous cover forestry compared to clearcut forestry on stand-level biodiversity in boreal and temperate forests? A systematic review protocol. Environ. Evid. 2018, 7, 28. [Google Scholar] [CrossRef] [Green Version]
- Davis, S.C.; Hessl, A.E.; Scott, C.J.; Adams, M.B.; Thomas, R.B. Forest carbon sequestration changes in response to timber harvest. For. Ecol. Manag. 2009, 258, 2101–2109. [Google Scholar] [CrossRef]
- Nave, L.E.; Vance, E.D.; Swanston, C.W.; Curtis, P.S. Harvest impacts on soil carbon storage in temperate forests. For. Ecol. Manag. 2010, 259, 857–866. [Google Scholar] [CrossRef]
- Hughes, J.W.; Fahey, T.J. Litterfall dynamics and ecosystem recovery during forest development. For. Ecol. Manag. 1994, 63, 181–198. [Google Scholar] [CrossRef]
- Royal Meteorological Institute of Belgium (KMI). Klimaatstatistieken van de Belgische Gemeenten: Brasschaat (NIS 11008); Royal Meteorological Institute of Belgium (KMI): Brussels, Belgium, 2020. [Google Scholar]
- Polunin, O.; Walters, M. Guide to the Vegetation of Britain and Europe; Oxford University Press: Oxford, UK, 1985. [Google Scholar]
- Janssens, I.A.; Sampson, D.A.; Cermak, J.; Meiresonne, L.; Riguzzi, F.; Overloop, S.; Ceulemans, R. Above-and belowground phytomass and carbon storage in a Belgian Scots pine stand. Ann. For. Sci. 1999, 56, 81–90. [Google Scholar] [CrossRef]
- Gielen, B.; De Vos, B.; Campioli, M.; Neirynck, J.; Papale, D.; Verstraeten, A.; Ceulemans, R.; Janssens, I.A. Biometric and eddy covariance-based assessment of decadal carbon sequestration of a temperate Scots pine forest. Agric. For. Meteorol. 2013, 174, 135–143. [Google Scholar] [CrossRef]
- Jansen, J.J.; Sevenster, J.A.; Faber, J. Opbrengsttabellen voor Belangrijke Boomsoorten in Nederland; IBN-Rapport 221, Hinkeloord rapport No. 17; Institute for Forestry and Nature Research: Wageningen, The Netherlands, 1996; pp. 1–240. [Google Scholar]
- Carrara, A.; Kowalski, A.S.; Neirynck, J.; Janssens, I.A.; Yuste, J.C.; Ceulemans, R. Net ecosystem CO2 exchange of mixed forest in Belgium over 5 years. Agric. For. Meteorol. 2003, 119, 209–227. [Google Scholar] [CrossRef]
- Databank Ondergrond Vlaanderen—Vlaamse Overheid, Departement Omgeving, Vlaams Planbureau voor Omgeving (VPO). Digitale bodemkaart van het Vlaams Gewest: Bodemtypes. Available online: https://www.dov.vlaanderen.be (accessed on 5 October 2021).
- Integrated Carbon Observation System (ICOS) Research Infrastructure. ICOS Handbook: Knowledge through Observations, 2nd ed.; ICOS ERIC: Helsinki, Finland, 2020. [Google Scholar]
- Geopunt. Orthofotomozaïek, Middenschalig, Zomeropnamen. 2018, Vlaanderen. Available online: www.geopunt.be (accessed on 21 October 2021).
- Gielen, B.; Acosta, M.; Altimir, N.; Buchmann, N.; Cescatti, A.; Ceschia, E.; Fleck, S.; Hörtnagl, L.; Klumpp, K.; Kolari, P.; et al. Ancillary vegetation measurements at ICOS ecosystem stations. Int. Agrophys. 2018, 32, 645–664. [Google Scholar] [CrossRef]
- Mokany, K.; Raison, R.J.; Prokushkin, A.S. Critical analysis of root: Shoot ratios in terrestrial biomes. Glob. Chang. Biol. 2006, 12, 84–96. [Google Scholar] [CrossRef]
- Sleutel, S.; D’Hose, T.; Lettens, S.; Ruysschaert, G.; De Vos, B. Monitoring Koolstofgehalte in Vlaamse Bodems in Openbaar Domein en Particuliere Tuinen (Opdracht VPO-OMG_VPO_2018_15-F02)–Eindrapport; Vlaams Planbureau voor Omgeving: Belgium, Brussel, 2020. [Google Scholar]
- Berhongaray, G.; King, J.S.; Janssens, I.A.; Ceulemans, R. An optimized fine root sampling methodology balancing accuracy and time investment. Plant Soil 2013, 366, 351–361. [Google Scholar] [CrossRef]
- Xiao, C.W.; Yuste, J.C.; Janssens, I.A.; Roskams, P.; Nachtergale, L.; Carrara, A.; Sanchez, B.Y.; Ceulemans, R. Above- and belowground biomass and net primary production in a 73-year-old Scots pine forest. Tree Physiol. 2003, 23, 505–516. [Google Scholar] [CrossRef] [PubMed] [Green Version]
- IBM Corp. IBM SPSS Statistics for Windows; Version 28.0; IBM Corp: Armonk, NY, USA, 2021. [Google Scholar]
- R Core Team. R: A Language and Environment for Statistical Computing; R Foundation for Statistical Computing: Vienna, Austria, 2020. [Google Scholar]
- Campioli, M.; Gielen, B.; Göckede, M.; Papale, D.; Bouriaud, O.; Granier, A. Temporal variability of the NPP-GPP ratio at seasonal and interannual time scales in a temperate beech forest. Biogeosciences 2011, 8, 2481–2492. [Google Scholar] [CrossRef] [Green Version]
- Moreno-Fernandez, D.; Diaz-Pines, E.; Barbeito, I.; Sanchez-Gonzalez, M.; Montes, F.; Rubio, A.; Canellas, I. Temporal carbon dynamics over the rotation period of two alternative management systems in Mediterranean mountain Scots pine forests. For. Ecol. Manag. 2015, 348, 186–195. [Google Scholar] [CrossRef]
- Collalti, A.; Trotta, C.; Keenan, T.F.; Ibrom, A.; Bond-Lamberty, B.; Grote, R.; Vicca, S.; Reyer, C.P.; Migliavacca, M.; Veroustraete, F.; et al. Thinning can reduce losses in carbon use efficiency and carbon stocks in managed forests under warmer climate. J. Adv. Model. Earth Syst. 2018, 10, 2427–2452. [Google Scholar] [CrossRef]
- Augusto, L.; De Schrijver, A.; Vesterdal, L.; Smolander, A.; Prescott, C.; Ranger, J. Influences of evergreen gymnosperm and deciduous angiosperm tree species on the functioning of temperate and boreal forests. Biol. Rev. 2015, 90, 444–466. [Google Scholar] [CrossRef]
- Pretzsch, H.; del Río, M.; Ammer, C.; Avdagic, A.; Barbeito, I.; Bielak, K.; Brazaitis, G.; Coll, L.; Dirnberger, G.; Drössler, L.; et al. Growth and yield of mixed versus pure stands of Scots pine (Pinus sylvestris L.) and European beech (Fagus sylvatica L.) analysed along a productivity gradient through Europe. Eur. J. For. Res. 2015, 134, 927–947. [Google Scholar] [CrossRef] [Green Version]
- Jandl, R.; Lindner, M.; Vesterdal, L.; Bauwens, B.; Baritz, R.; Hagedorn, F.; Johnson, D.W.; Minkkinen, K.; Byrne, K.A. How strongly can forest management influence soil carbon sequestration? Geoderma 2007, 137, 253–268. [Google Scholar] [CrossRef]
- Noormets, A.; Epron, D.; Domec, J.C.; McNulty, S.G.; Fox, T.; Sun, G.; King, J.S. Effects of forest management on productivity and carbon sequestration: A review and hypothesis. For. Ecol. Manag. 2015, 355, 124–140. [Google Scholar] [CrossRef] [Green Version]
- Ruiz-Peinado, R.; Bravo-Oviedo, A.; López-Senespleda, E.; Montero, G.; Río, M. Do thinnings influence biomass and soil carbon stocks in Mediterranean maritime pinewoods? Eur. J. For. Res. 2013, 132, 253–262. [Google Scholar] [CrossRef]
- Zhang, X.; Guan, D.; Li, W.; Sun, D.; Jin, C.; Yuan, F.; Wang, A.; Wu, J. The effects of forest thinning on soil carbon stocks and dynamics: A meta-analysis. For. Ecol. Manag. 2018, 429, 36–43. [Google Scholar] [CrossRef]
- Brunner, I.; Godbold, D.L. Tree roots in a changing world. J. For. Res. 2007, 12, 78–82. [Google Scholar] [CrossRef] [Green Version]
- Buchholz, T.; Friedland, A.J.; Hornig, C.E.; Keeton, W.S.; Zanchi, G.; Nunery, J. Mineral soil carbon fluxes in forests and implications for carbon balance assessments. Glob. Chang. Biol. Bioenergy 2014, 6, 305–311. [Google Scholar] [CrossRef]
- Gruba, P.; Socha, J. Exploring the effects of dominant forest tree species, soil texture, altitude, and pHH2O on soil carbon stocks using generalized additive models. For. Ecol. Manag. 2019, 447, 105–114. [Google Scholar] [CrossRef]
- Van Damme, F. Invloed van de Omschakeling van Groenblijvend Naaldblad naar Bladverliezende Breedbladerige Bossen op de Koolstofopslag. Master’s Thesis, Antwerp University, Antwerp, Belgium, 2021. [Google Scholar]
- Wardenaar, E.C.; Sevink, J. A comparative study of soil formation in primary stands of Scots pine (planted) and poplar (natural) on calcareous dune sands in the Netherlands. Plant Soil 1992, 140, 109–120. [Google Scholar] [CrossRef]
- Øyen, B.H.; Blom, H.H.; Gjerde, I.; Myking, T.; Sætersdal, M.; Thunes, K.H. Ecology, history and silviculture of Scots pine (Pinus sylvestris L.) in western Norway–a literature review. Forestry 2006, 79, 319–329. [Google Scholar] [CrossRef]
- Janecka, K.; Harvey, J.E.; Trouillier, M.; Kaczka, R.J.; Metslaid, S.; Metslaid, M.; Buras, A.; Wilmking, M. Higher winter-spring temperature and winter-spring/summer moisture availability increase scots pine growth on coastal dune microsites around the South Baltic Sea. Front. For. Glob. Chang. 2020, 3, 578912. [Google Scholar] [CrossRef]
- Schroeder, J.; Klinner, S.; Koerner, M. A New Set of Biomass Functions for Quercus petraea in Western Pomerania. Balt. For. 2017, 23, 449–462. [Google Scholar]
- Zianis, D.; Muukkonen, P.; Mäkipää, R.; Mencuccini, M. Biomass and stem volume equations for tree species in Europe. Silva Fenn. Monogr. 2005, 4, 63. [Google Scholar] [CrossRef]
- Röhling, S.; Demant, B.; Dunger, K.; Neubauer, M.; Oehmichen, K.; Riedel, T.; Stümer, W. Equations for estimating belowground biomass of Silver Birch, Oak and Scots Pine in Germany. iForest 2019, 12, 166. [Google Scholar] [CrossRef]
- Suchomel, C.; Pyttel, P.; Becker, G.; Bauhus, J. Biomass equations for sessile oak (Quercus petraea (Matt.) Liebl.) and hornbeam (Carpinus betulus L.) in aged coppiced forests in southwest Germany. Biomass Bioenergy 2012, 46, 722–730. [Google Scholar] [CrossRef]
- Uri, V.; Varik, M.; Aosaar, J.; Kanal, A.; Kukumägi, M.; Lõhmus, K. Biomass production and carbon sequestration in a fertile silver birch (Betula pendula Roth) forest chronosequence. For. Ecol. Manag. 2012, 267, 117–126. [Google Scholar] [CrossRef]
- Hughes, M.K. Tree biocontent, net production and litter fall in a deciduous woodland. Oikos 1971, 22, 62–73. [Google Scholar] [CrossRef]
- Škėma, M.; Mikšys, V.; Aleinikovas, M.; Šilinskas, B.; Varnagirytė-Kabašinskienė. Biomass Structure and morphometric parameters for non-destructive biomass estimation of common forest underbrush species in Lithuania. Pol. J. Environ. Stud. 2018, 27, 325–333. [Google Scholar] [CrossRef]
- Bartelink, H.H. Allometric relationship for biomass and leaf area of beech (Fagus sylvatica L). Ann. For. Sci. 1997, 54, 39–50. [Google Scholar] [CrossRef] [Green Version]
- le Goff, N.; Ottorini, J.M. Root biomass and biomass increment in a beech (Fagus sylvatica L.) stand in North-East France. Ann. For. Sci. 2001, 58, 1–13. [Google Scholar] [CrossRef]
- Blujdea, V.N.B.; Pilli, R.; Dutca, I.; Ciuvat, L.; Abrudan, I.V. Allometric biomass equations for young broadleaved trees in plantations in Romania. For. Ecol. Manag. 2012, 264, 172–184. [Google Scholar] [CrossRef]
- Annighöfer, P.; Ameztegui, A.; Ammer, C.; Balandier, P.; Bartsch, N.; Bolte, A.; Coll, L.; Collet, C.; Ewald, J.; Frischbier, N.; et al. Species-specific and generic biomass equations for seedlings and saplings of European tree species. Eur. J. For. Res. 2016, 135, 313–329. [Google Scholar] [CrossRef] [Green Version]
- Oleksyn, J.; Reich, P.B.; Chalupka, W.; Tjoelker, M.G. Differential above-and below-ground biomass accumulation of European Pinus sylvestris populations in a 12-year-old provenance experiment. Scand. J. For. Res. 1999, 14, 7–17. [Google Scholar] [CrossRef]
- Marziliano, P.A.; Lafortezza, R.; Medicamento, U.; Lorusso, L.; Giannico, V.; Colangelo, G.; Sanesi, G. Estimating belowground biomass and root/shoot ratio of Phillyrea latifolia L. in the Mediterranean forest landscapes. Ann. For. Sci. 2015, 72, 585–593. [Google Scholar] [CrossRef]


| De Inslag Ref. | De Inslag Thin. | Mik Ref. | Mik Oak | |
|---|---|---|---|---|
| Total basal area (m2 ha−1) | 31.0 | 26.5 | 23.2 | 23.9 |
| Dominant species | P. sylvestris | P. sylvestris | P. sylvestris | Q. robur |
| Basal area dominant species (m2 ha−1) | 26.8 | 20.2 | 22.5 | 18.9 |
| Stand age (years) | 91 | 91 | 77 | 14 |
| Density (trees ha−1) | 375 | 184 | 255 | 1225 |
| Tree height (m, mean ± SE) | 17.9 ± 0.7 | 20.5 ± 0.7 | 18.1 ± 0.5 | 12.4 ± 0.2 |
| Diameter breast height (cm, mean ± SE) | 31.1 ± 1.4 | 37.3 ± 1.7 | 33.2 ± 1.0 | 14.0 ± 0.3 |
| De Inslag Ref. | De Inslag Thin. | Mik Ref. | Mik Oak | |||||||
|---|---|---|---|---|---|---|---|---|---|---|
| Mean ± SE (tC ha−1) | % | Mean ± SE (tC ha−1) | % | p | Mean ± SE (tC ha−1) | % | Mean ± SE (tC ha−1) | % | p | |
| Aboveground biomass | ||||||||||
| Overstory | 93.3 ± 3.4 | 34 | 75.3 ± 10.2 | 30 | 0.15 | 69.1 ± 1.1 | 22 | 64.2 ± 3.6 | 20 | 0.27 |
| Understory | ||||||||||
| Grass, moss, and fern | 0.21 ± 0.05 | <1 | 0.21 ± 0.11 | 1 | 1.00 | 1.38 ± 0.12 | <1 | 0.35 ± 0.06 | <1 | <0.001 * |
| Young trees and shrubs a | 4.1 ± 2.0 | 2 | 4.6 ± 0.7 | 2 | 0.81 | 0 | 0 | 0 | 0 | NA |
| Belowground biomass | ||||||||||
| Coarse roots of overstory | 10.8 ± 0.3 | 4 | 8.8 ± 1.0 | 4 | 0.10 | 7.8 ± 0.2 | 2 | 10.9 ± 0.4 | 3 | <0.001 |
| Coarse roots of young trees and shrubs | 0.88 ± 0.4 | <1 | 1.1 ± 0.2 | <1 | 0.62 | 0 | 0 | 0 | 0 | NA |
| Fine and medium roots | ||||||||||
| 0–10 cm | 2.3 ± 0.4 | 1 | 1.8 ± 0.3 | 1 | 0.37 | 1.5 ± 0.3 | <1 | 1.8 ± 0.2 | 1 | 0.05 + |
| 10–30 cm | 2.1 ± 0.6 | 1 | 2.2 ± 0.6 | 1 | 0.79 | 2.1 ± 0.4 | 1 | 3.2 ± 0.7 | 1 | 0.24 |
| 30–60 cm | 3.0 ± 0.9 | 1 | 0.71 ± 0.23 | <1 | 0.040 * | 1.0 ± 0.1 | <1 | 1.9 ± 0.4 | 1 | 0.25 |
| Forest floor | 41.9 ± 2.7 | 15 | 44.7 ± 3.7 | 18 | 0.54 | 46.2 ± 2.1 | 15 | 21.7 ± 1.0 | 7 | <0.001 * |
| Woody debris | ||||||||||
| Fine woody debris | 2.5 ± 1.2 | 1 | 2.6 ± 1.2 | 1 | 0.57 | 0.80 ± 0.16 | <1 | 1.36 ± 0.30 | <1 | 0.08 + |
| Coarse woody debris | 2.1 ± 1.7 | 1 | 3.0 ± 2.8 | 1 | 0.89 | 3.2 ± 1.4 | 1 | 5.9 ± 1.7 | 2 | 0.27 |
| Mineral soil | ||||||||||
| 0–10 cm | 44.9 ± 4.8 | 17 | 52.7 ± 7.3 | 21 | 0.47 | 50.8 ± 3.5 | 16 | 63.8 ± 4.8 | 20 | 0.036 * |
| 10–30 cm | 39.7 ± 2.1 | 15 | 29.7 ± 2.2 | 12 | <0.001 * | 68.1 ± 5.8 | 21 | 80.3 ± 3.6 | 25 | 0.08 + |
| 30–60 cm | 22.9 ± 3.1 | 8 | 22.1 ± 3.8 | 9 | 0.88 | 65.8 ± 7.7 | 21 | 60.4 ± 25.6 | 19 | 0.85 |
| De Inslag Ref. | De Inslag Thin. | Mik Ref. | Mik Oak | |||
|---|---|---|---|---|---|---|
| Mean ± SE (tC ha−1) | Mean ± SE (tC ha−1) | p | Mean ± SE (tC ha−1) | Mean ± SE (tC ha−1) | p | |
| 0–10 cm | ||||||
| Ø < 2 mm | 1.12 ± 0.13 | 1.08 ± 0.10 | 0.82 | 0.78 ± 0.07 | 1.26 ± 0.09 | <0.001 * |
| 2 < Ø < 5 mm | 1.18 ± 0.30 | 0.67 ± 0.31 | 0.06 + | 0.69 ± 0.30 | 0.52 ± 0.12 | 0.57 |
| 10–30 cm | ||||||
| Ø < 2 mm | 0.71 ± 0.08 | 0.66 ± 0.11 | 0.84 | 1.27 ± 0.20 | 1.38 ± 0.22 | 0.61 |
| 2 < Ø < 5 mm | 1.40 ± 0.56 | 1.54 ± 0.51 | 0.83 | 0.85 ± 0.34 | 1.86 ± 0.53 | 0.18 |
| 30–60 cm | ||||||
| Ø < 2 mm | 1.91 ± 0.75 | 0.53 ± 0.15 | 0.029 * | 0.70 ± 0.27 | 1.28 ± 0.32 | 0.15 |
| 2 < Ø < 5 mm | 1.12 ± 0.47 | 0.18 ± 0.14 | 0.11 | 0.31 ± 0.27 | 0.60 ± 0.17 | 0.25 |
| De Inslag Ref. | De Inslag Thin. | Mik Ref. | Mik Oak | |||
|---|---|---|---|---|---|---|
| Mean ± SE | Mean ± SE | p | Mean ± SE | Mean ± SE | p | |
| 0–10 cm | ||||||
| bulk density (g cm−3) | 1.18 ± 0.03 | 1.23 ± 0.02 | 0.19 | 1.20 ± 0.04 | 1.23 ± 0.04 | 0.37 |
| C content (%) | 3.80 ± 0.38 | 4.36 ± 0.65 | 0.76 | 4.30 ± 0.28 | 5.26 ± 0.39 | 0.05 + |
| 10–30 cm | ||||||
| bulk density (g cm−3) | 1.28 ± 0.01 | 1.22 ± 0.03 | 0.07 + | 1.23 ± 0.05 | 1.21 ± 0.03 | 0.60 |
| C content (%) | 1.55 ± 0.09 | 1.22 ± 0.09 | 0.004 * | 2.82 ± 0.23 | 3.39 ± 0.19 | 0.06 + |
| 30–60 cm | ||||||
| bulk density (g cm−3) | 1.29 ± 0.02 | 1.17 ± 0.05 | 0.78 | 1.45 ± 0.04 | 1.33 ± 0.04 | 0.07 + |
| C content (%) | 0.59 ± 0.08 | 0.64 ± 0.13 | 0.09 + | 1.53 ± 0.22 | 1.51 ± 0.62 | 0.97 |
Publisher’s Note: MDPI stays neutral with regard to jurisdictional claims in published maps and institutional affiliations. |
© 2022 by the authors. Licensee MDPI, Basel, Switzerland. This article is an open access article distributed under the terms and conditions of the Creative Commons Attribution (CC BY) license (https://creativecommons.org/licenses/by/4.0/).
Share and Cite
Van Damme, F.; Mertens, H.; Heinecke, T.; Lefevre, L.; De Meulder, T.; Portillo-Estrada, M.; Roland, M.; Gielen, B.; Janssens, I.A.; Verheyen, K.; et al. The Impact of Thinning and Clear Cut on the Ecosystem Carbon Storage of Scots Pine Stands under Maritime Influence in Flanders, Belgium. Forests 2022, 13, 1679. https://doi.org/10.3390/f13101679
Van Damme F, Mertens H, Heinecke T, Lefevre L, De Meulder T, Portillo-Estrada M, Roland M, Gielen B, Janssens IA, Verheyen K, et al. The Impact of Thinning and Clear Cut on the Ecosystem Carbon Storage of Scots Pine Stands under Maritime Influence in Flanders, Belgium. Forests. 2022; 13(10):1679. https://doi.org/10.3390/f13101679
Chicago/Turabian StyleVan Damme, Freke, Hana Mertens, Thilo Heinecke, Lodewijk Lefevre, Tim De Meulder, Miguel Portillo-Estrada, Marilyn Roland, Bert Gielen, Ivan A. Janssens, Kris Verheyen, and et al. 2022. "The Impact of Thinning and Clear Cut on the Ecosystem Carbon Storage of Scots Pine Stands under Maritime Influence in Flanders, Belgium" Forests 13, no. 10: 1679. https://doi.org/10.3390/f13101679