
Thermal Modification and Alkyl Ketene Dimer Effects on the Surface Protection of Deodar Cedar (Cedrus deodara Roxb.) Wood
 , ,
, , 
Abstract
:1. Introduction
2. Materials and Methods
2.1. Sample Preparation
2.1.1. Thermal Modification
2.1.2. Irradiation Test
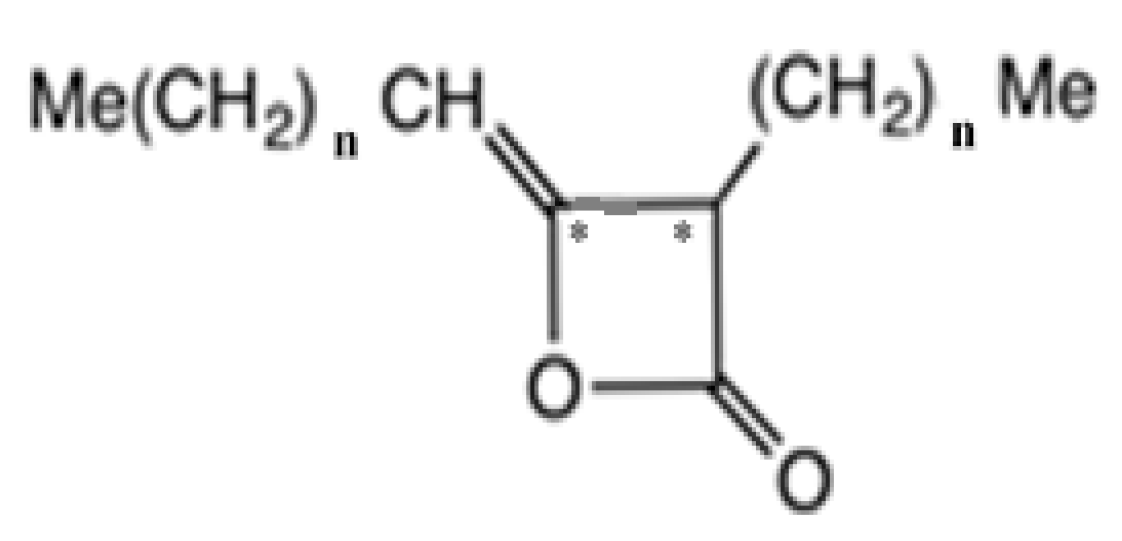
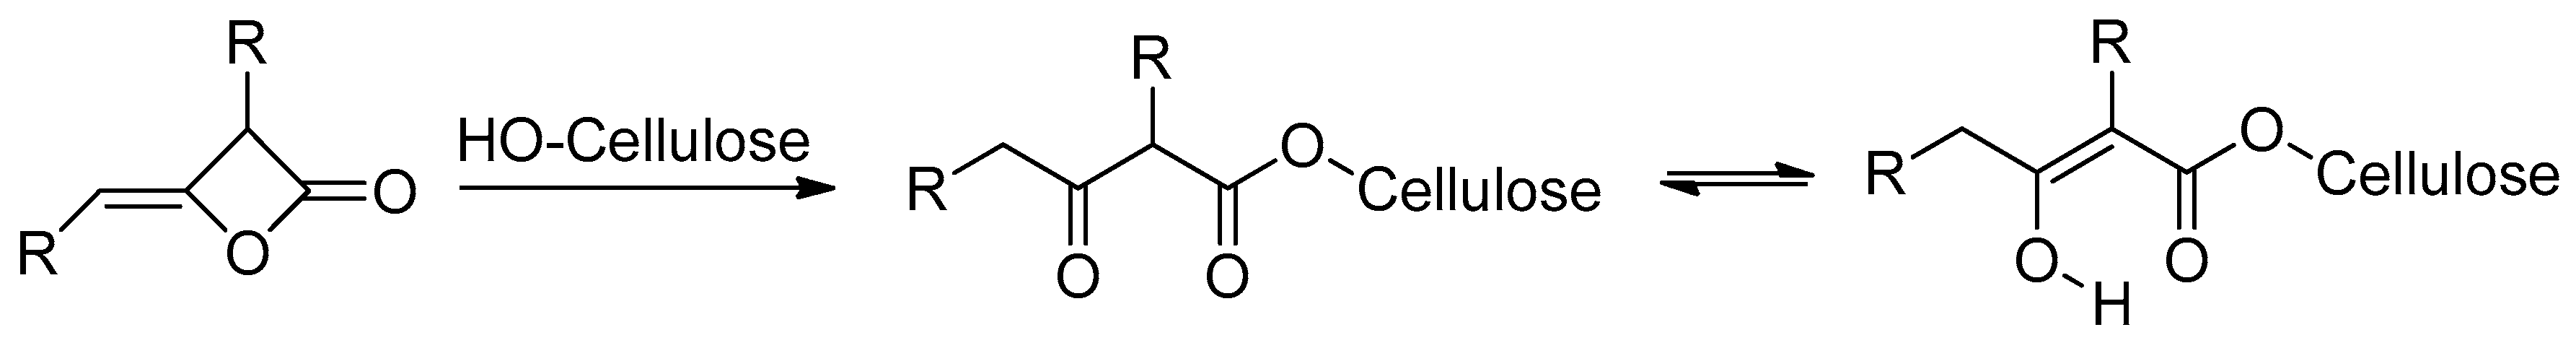
2.2. AKD
2.3. Water Contact Angle (WCA)
2.4. ATR FTIR Spectroscopy
2.5. Colour
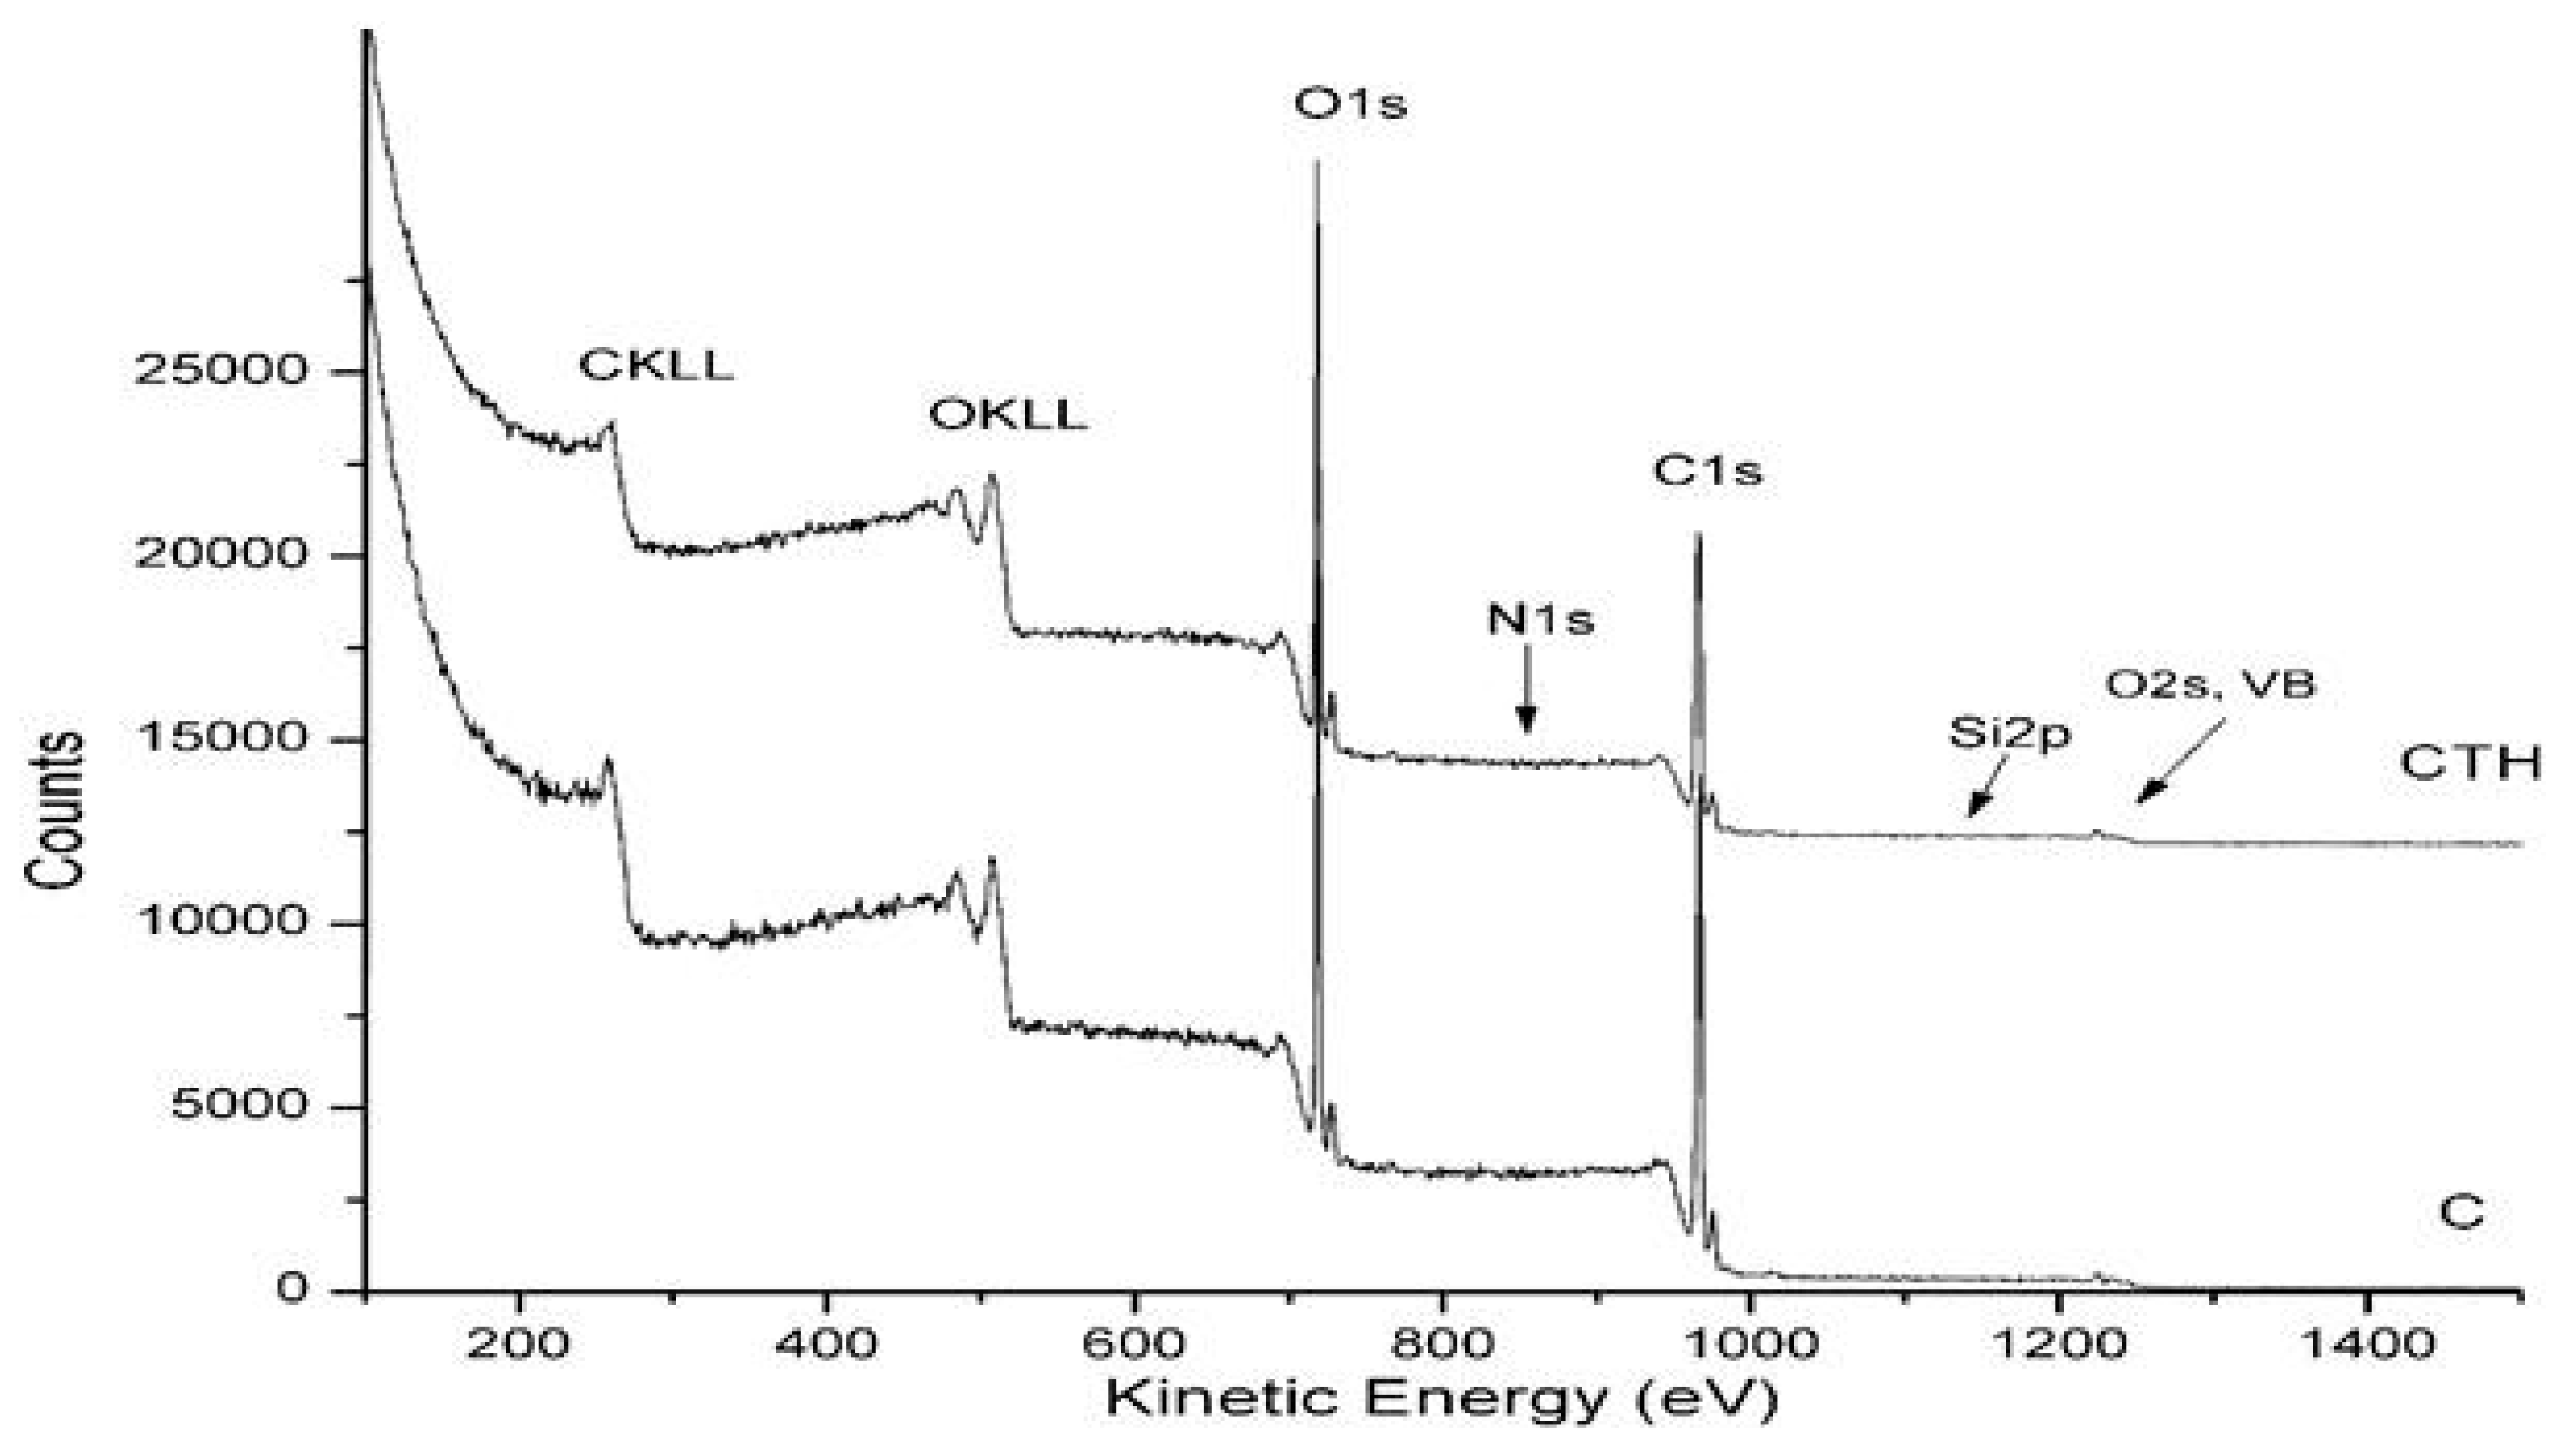
2.6. X-ray Photoelectron Spectroscopy (XPS)
3. Results and Discussion
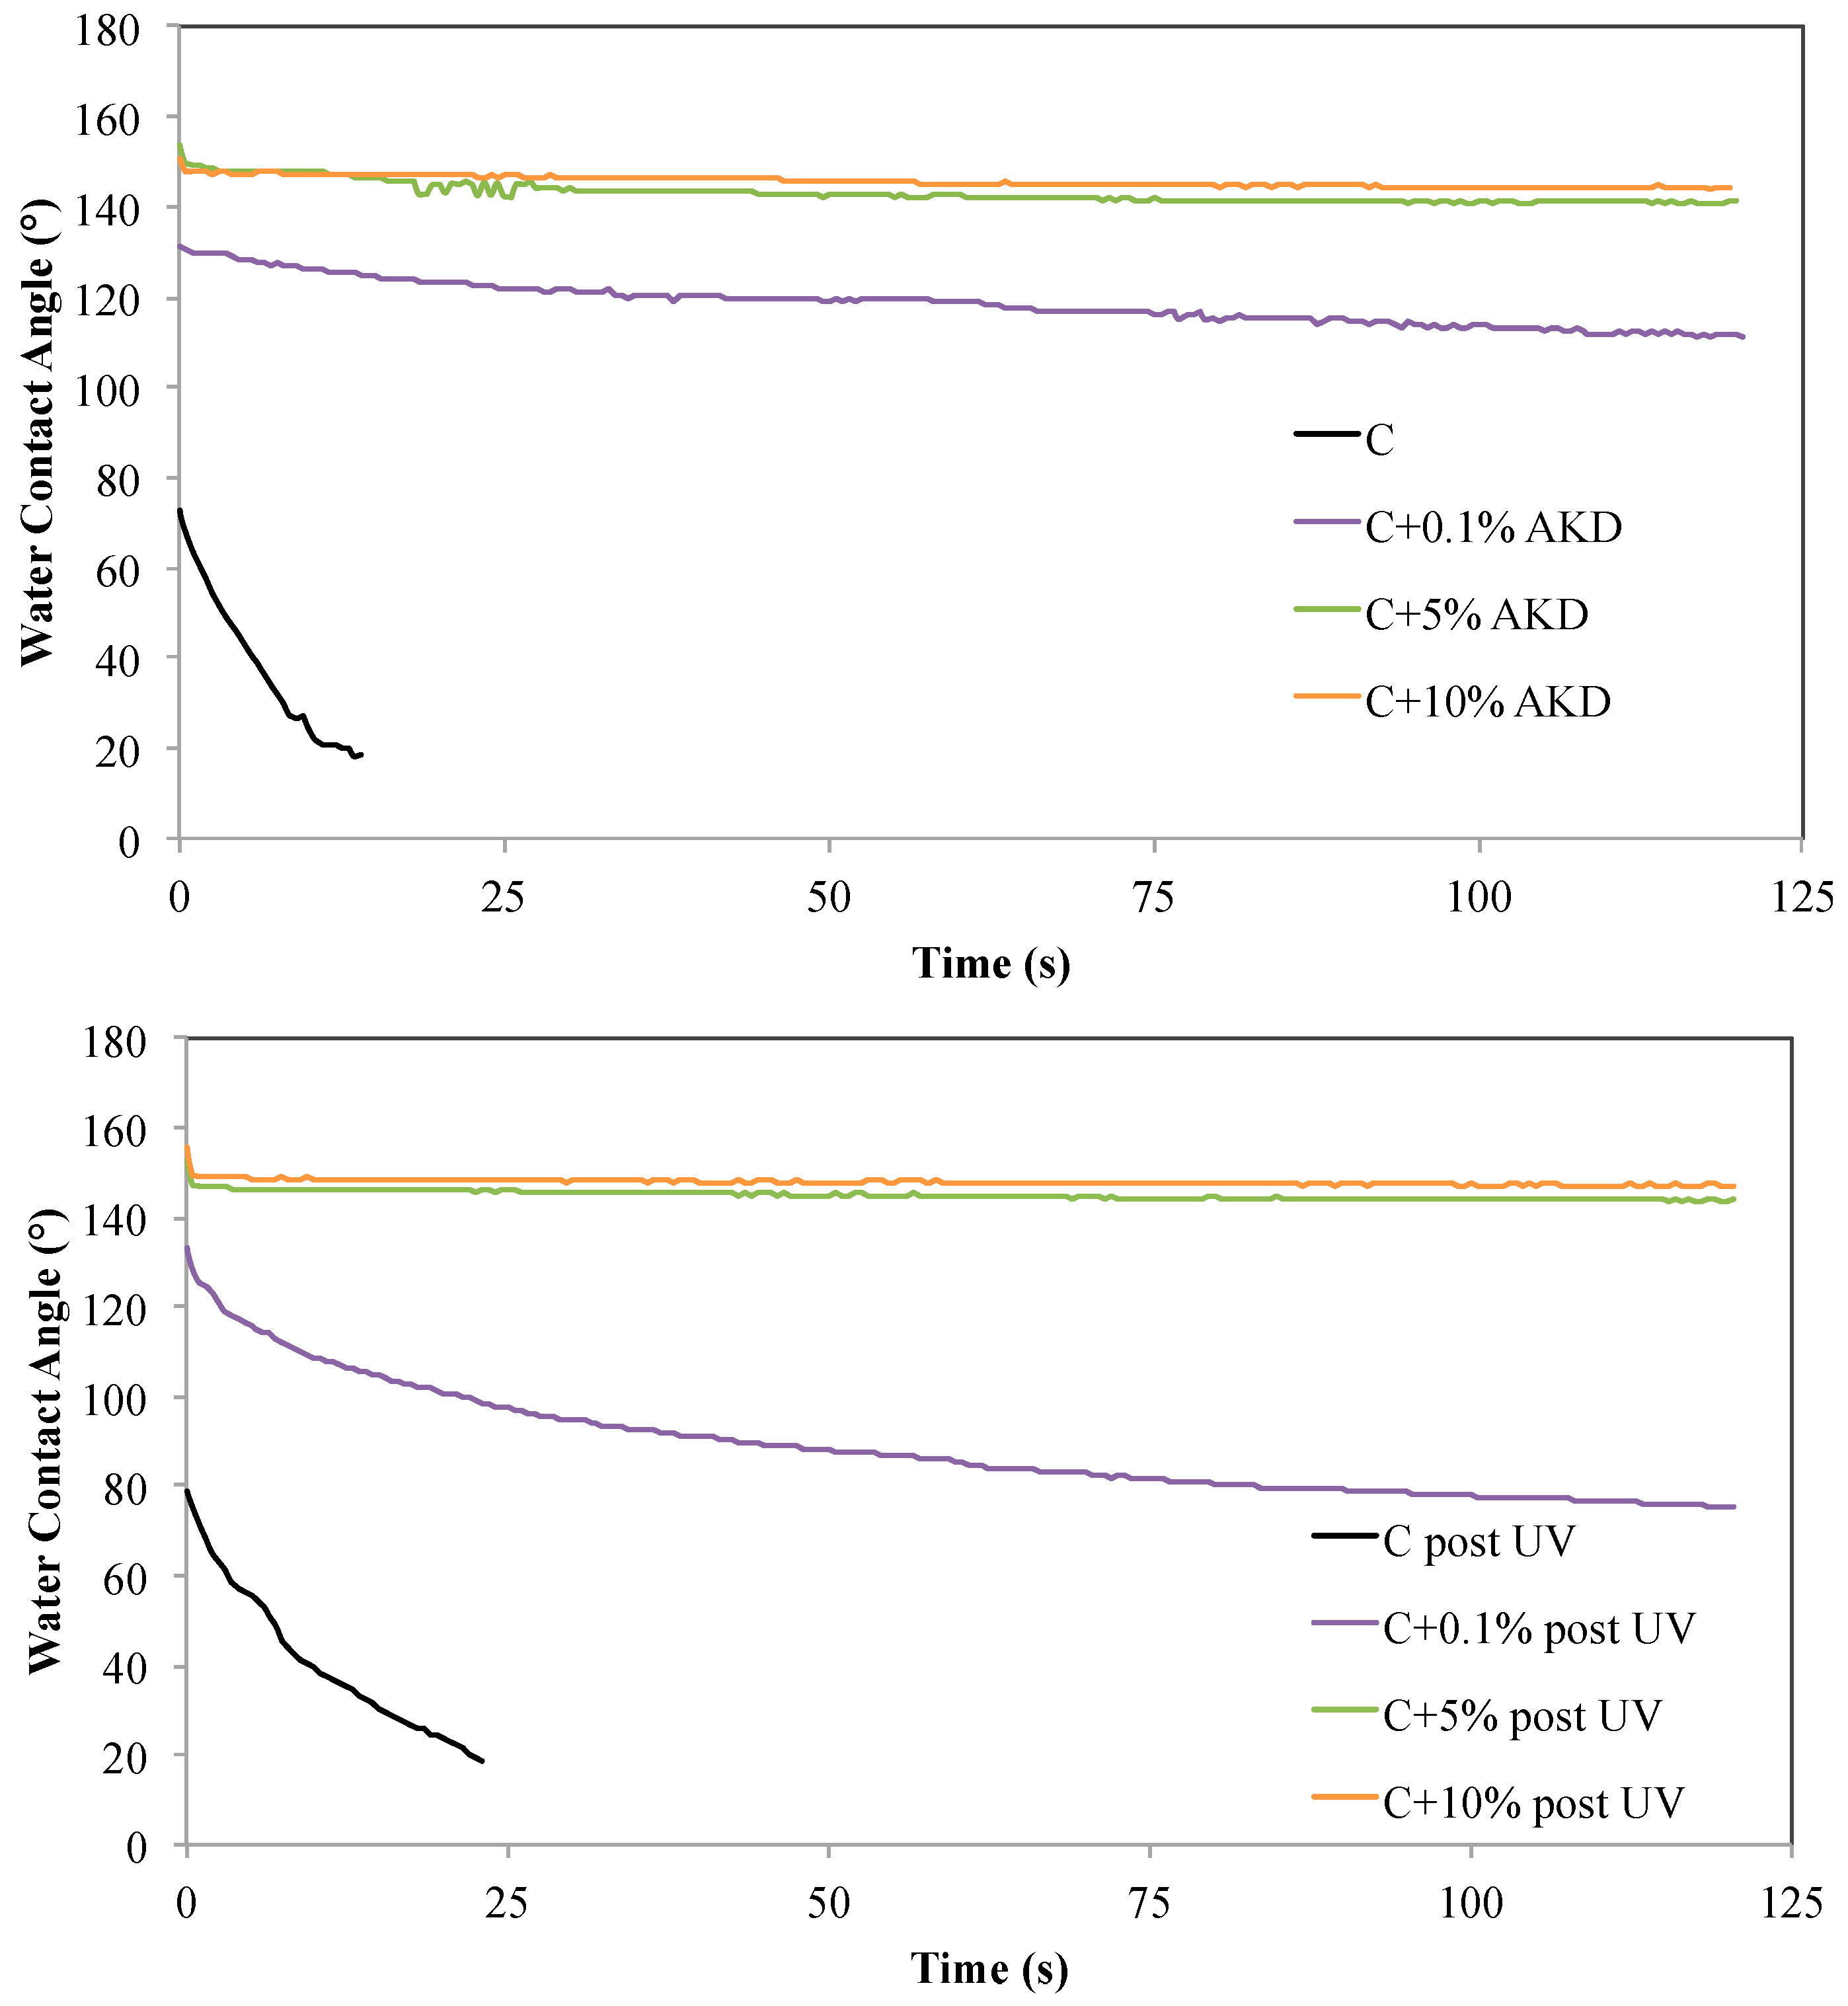
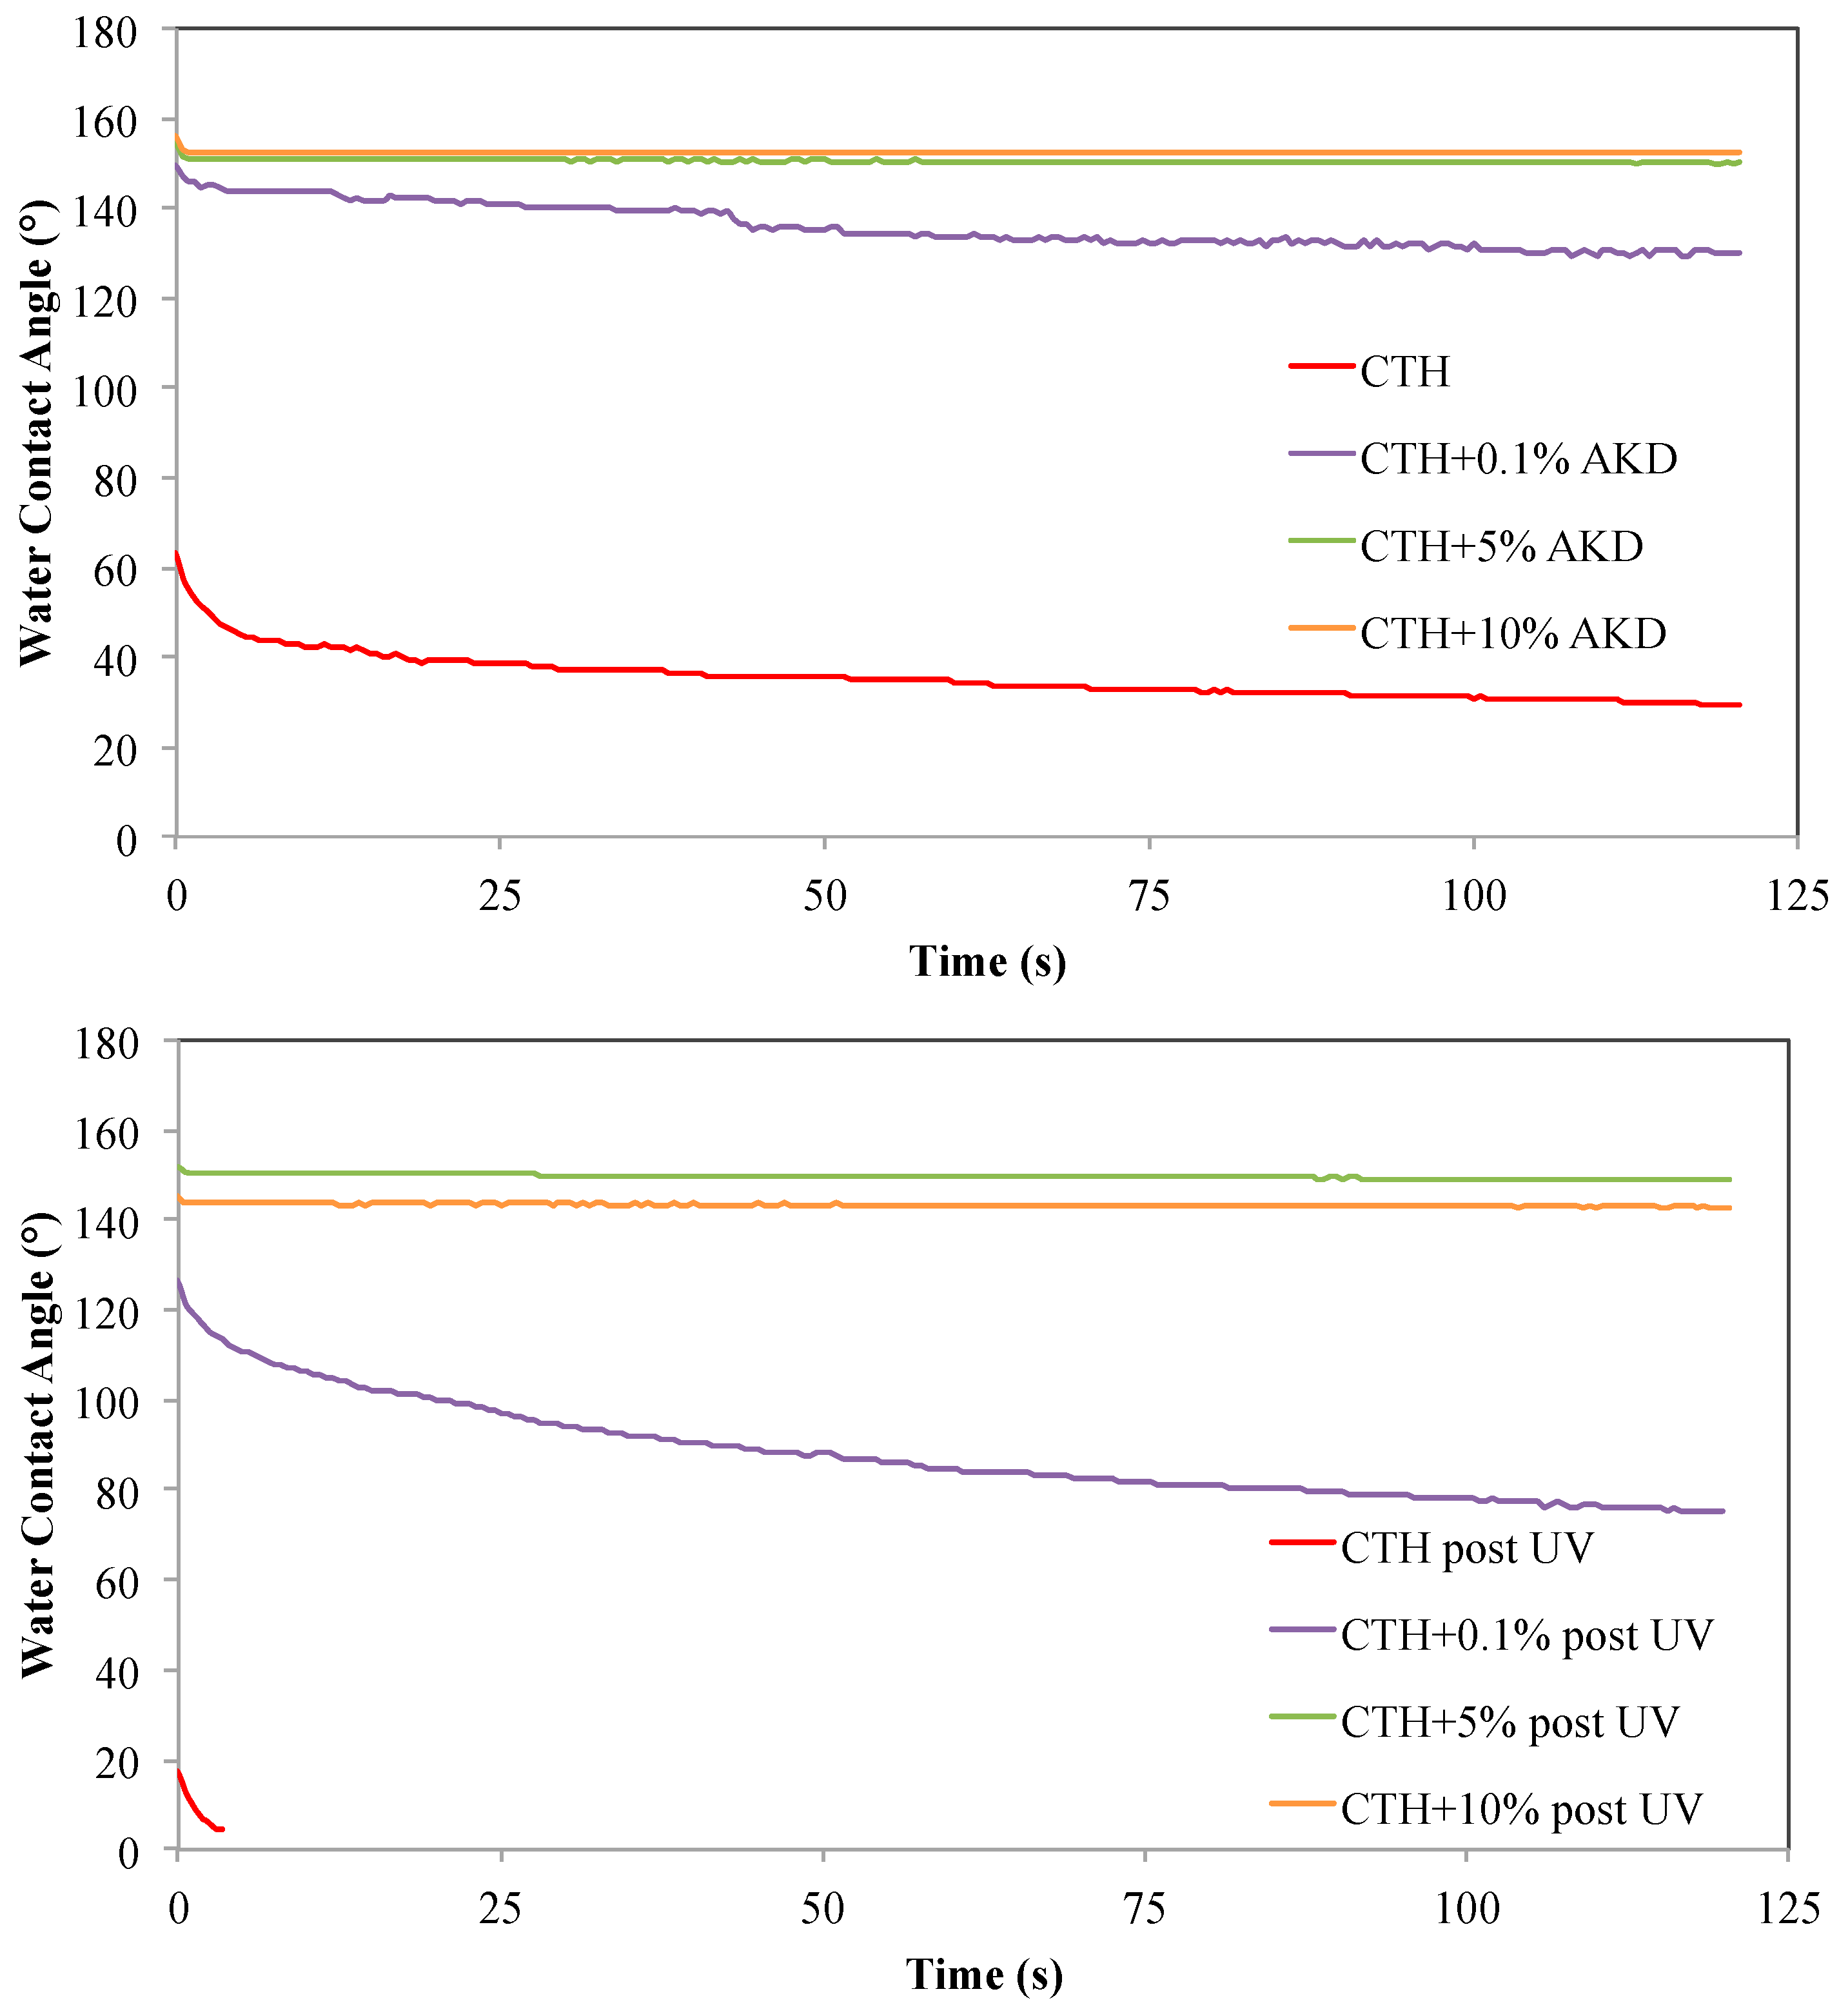
3.1. Water Contact Angle (WCA)
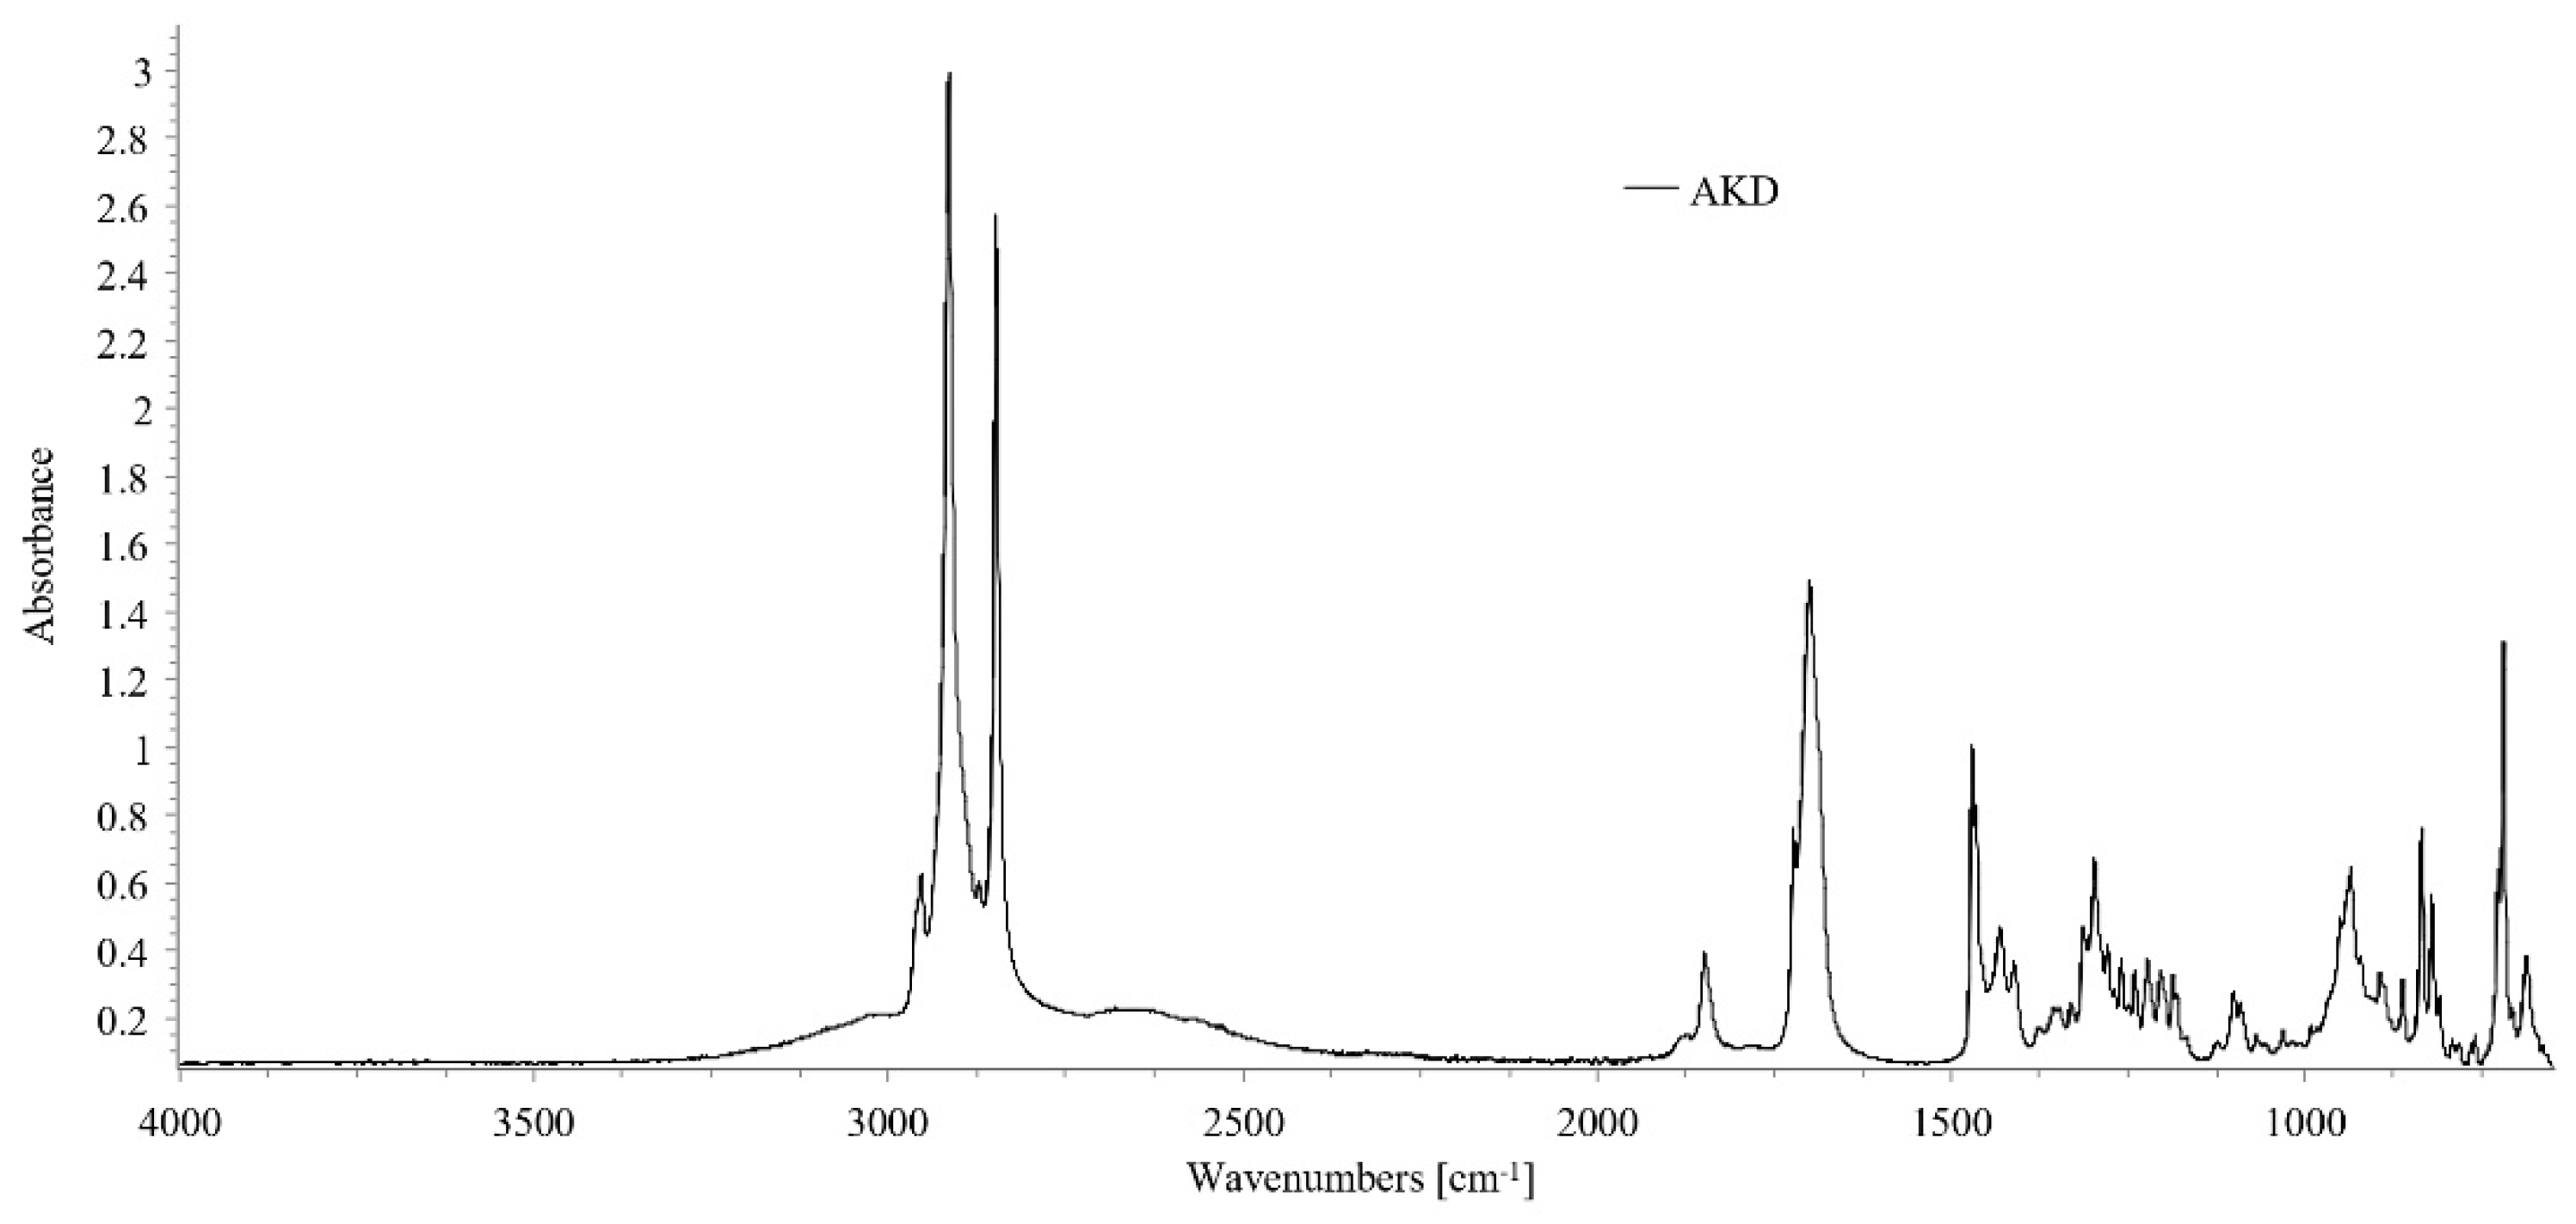
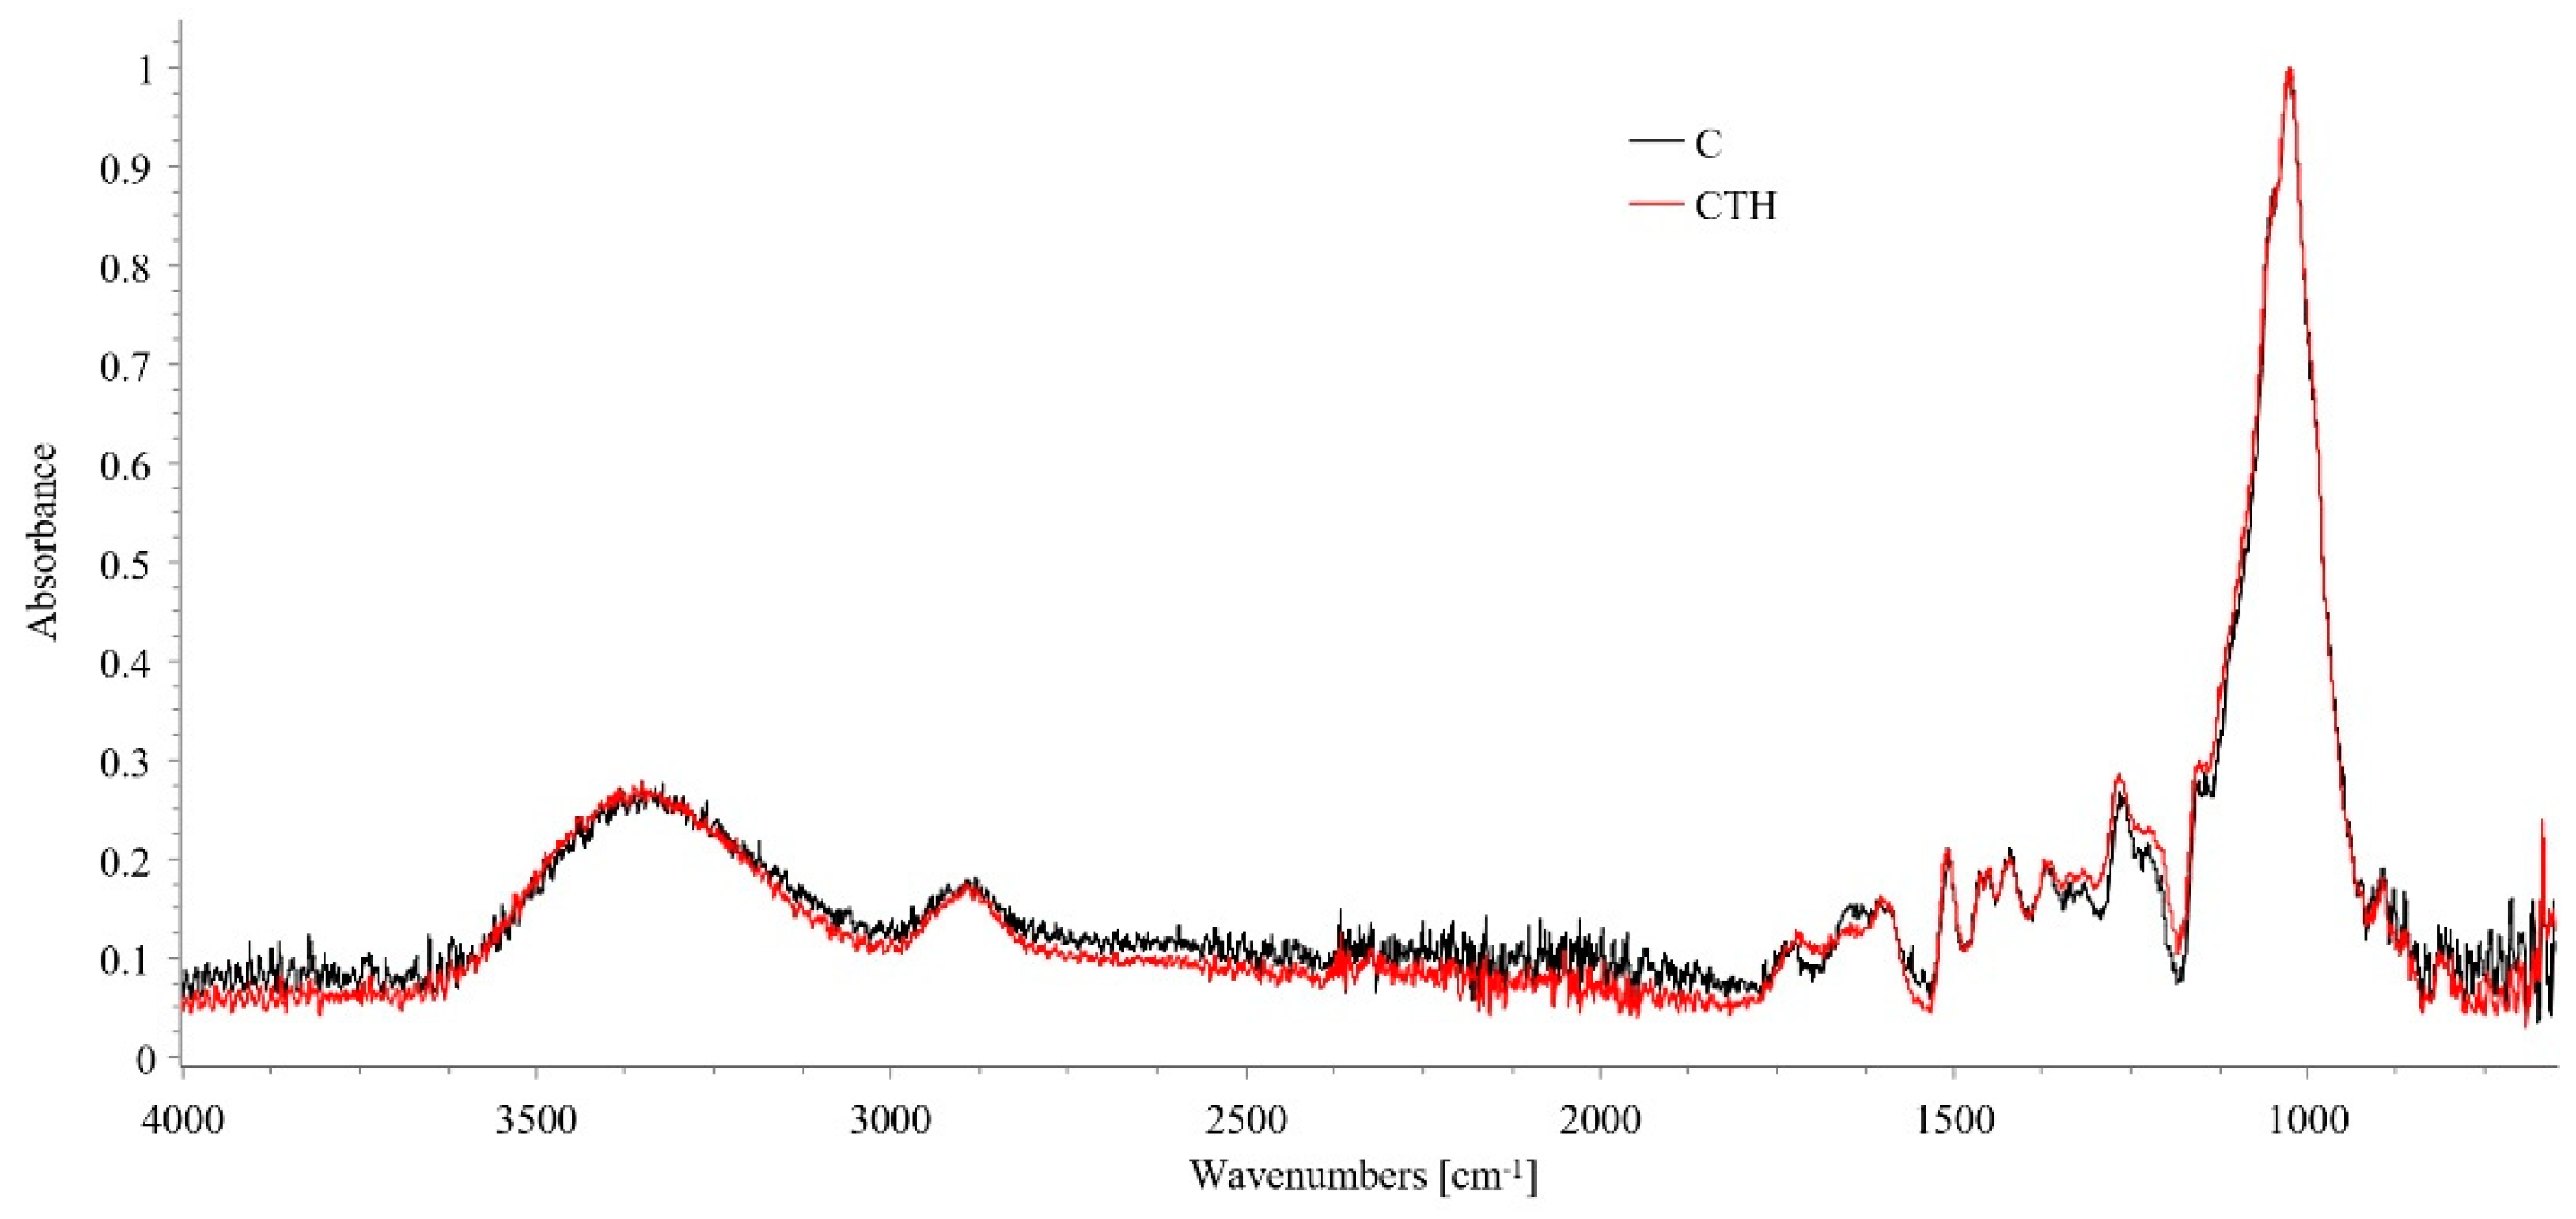
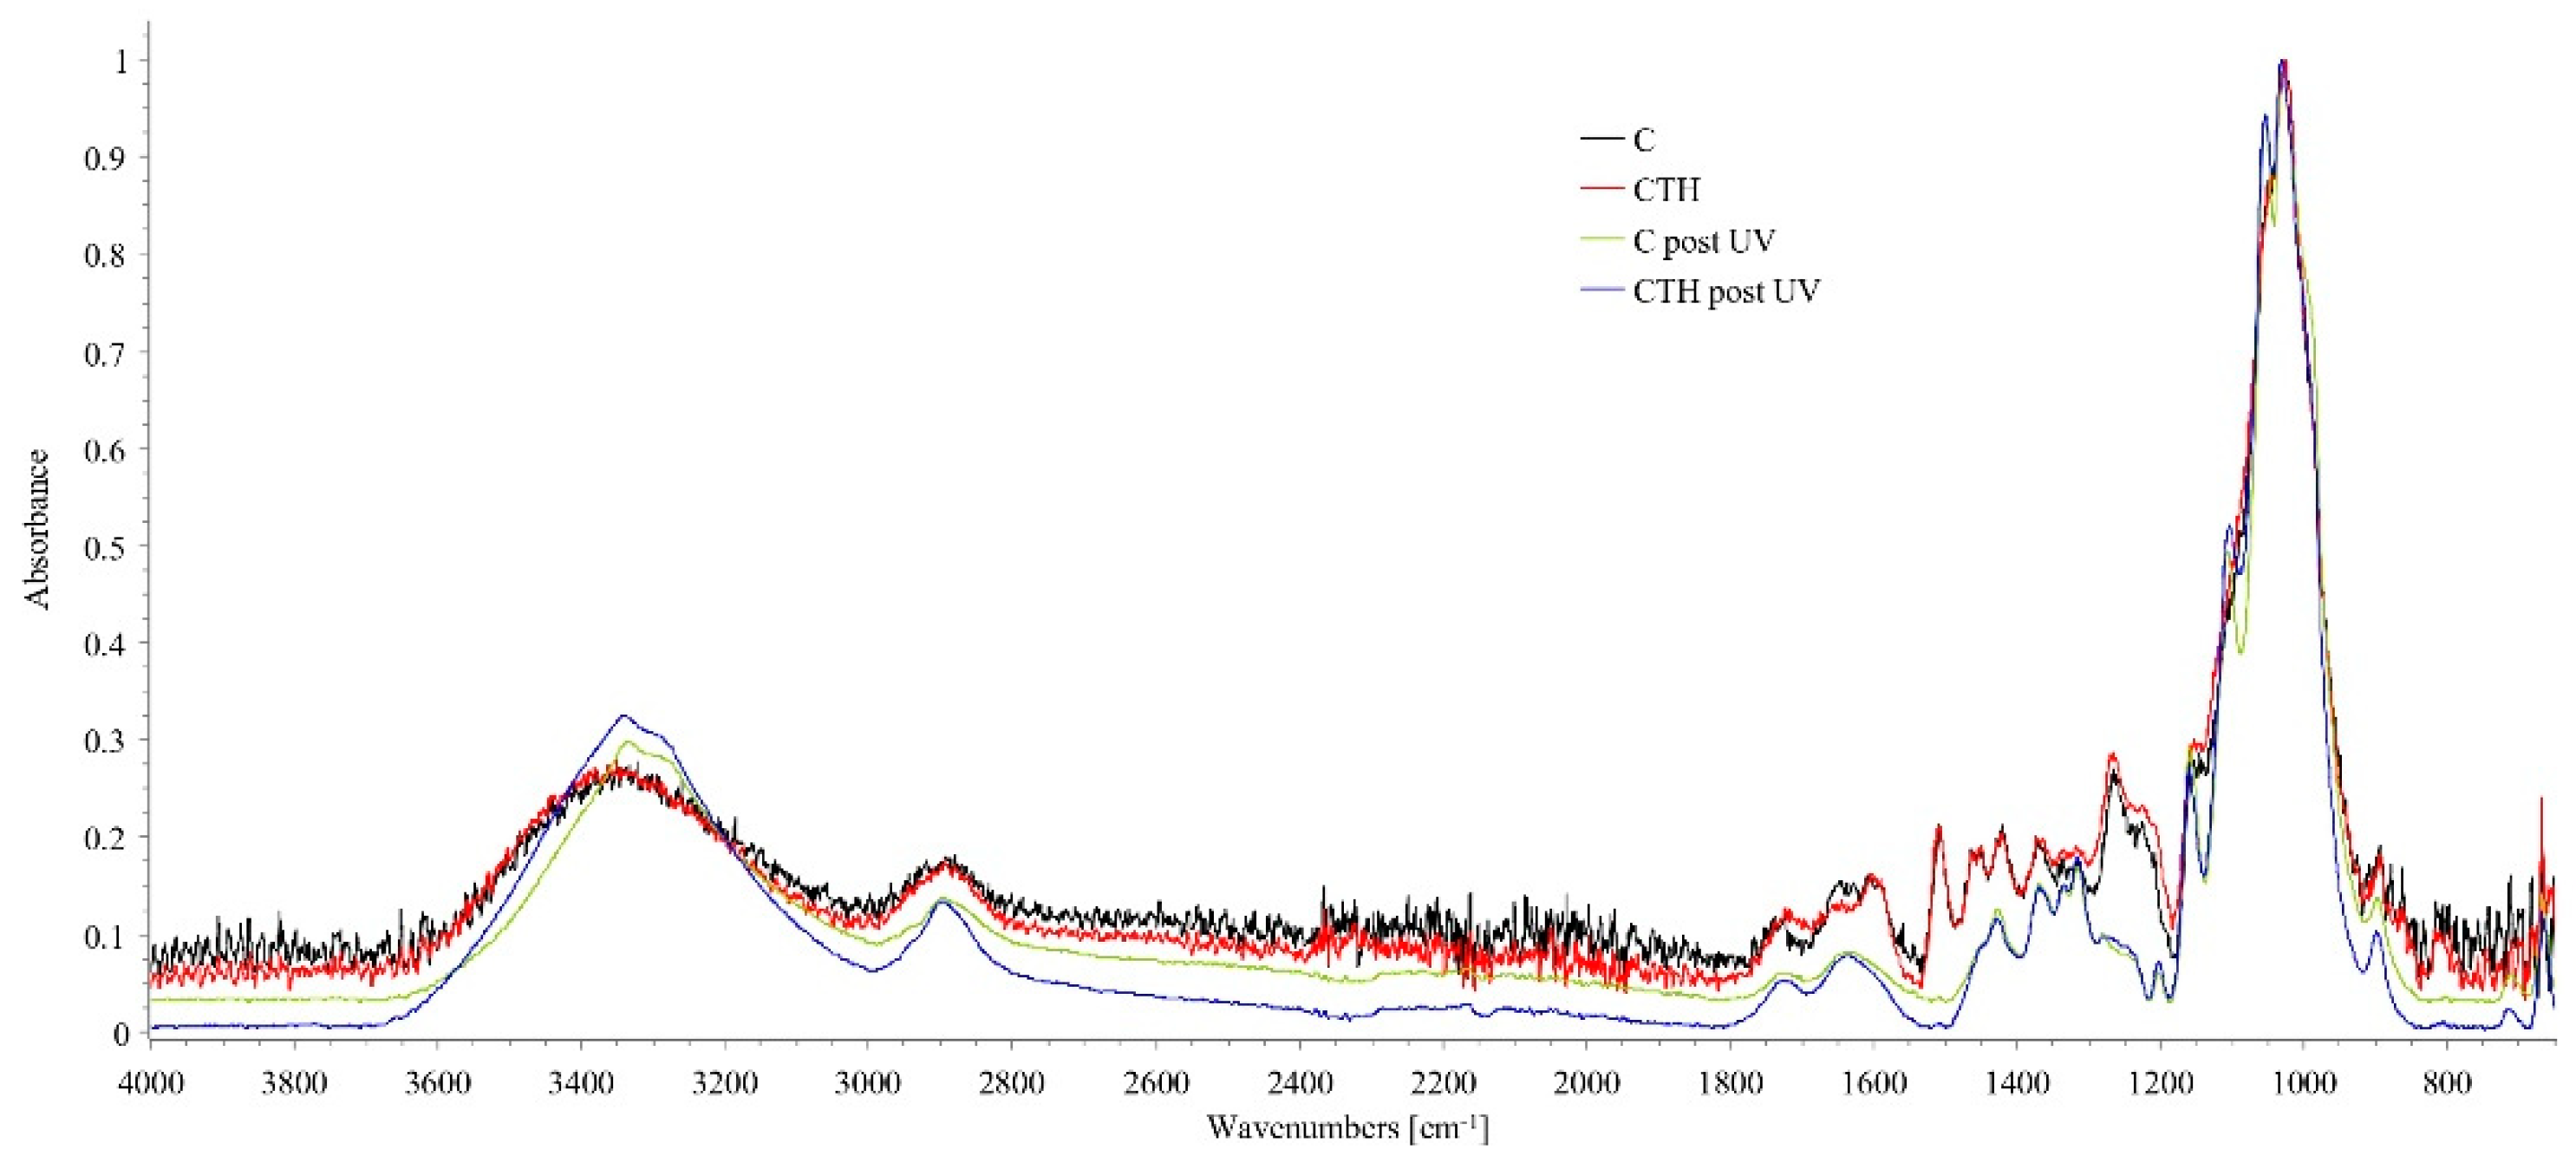
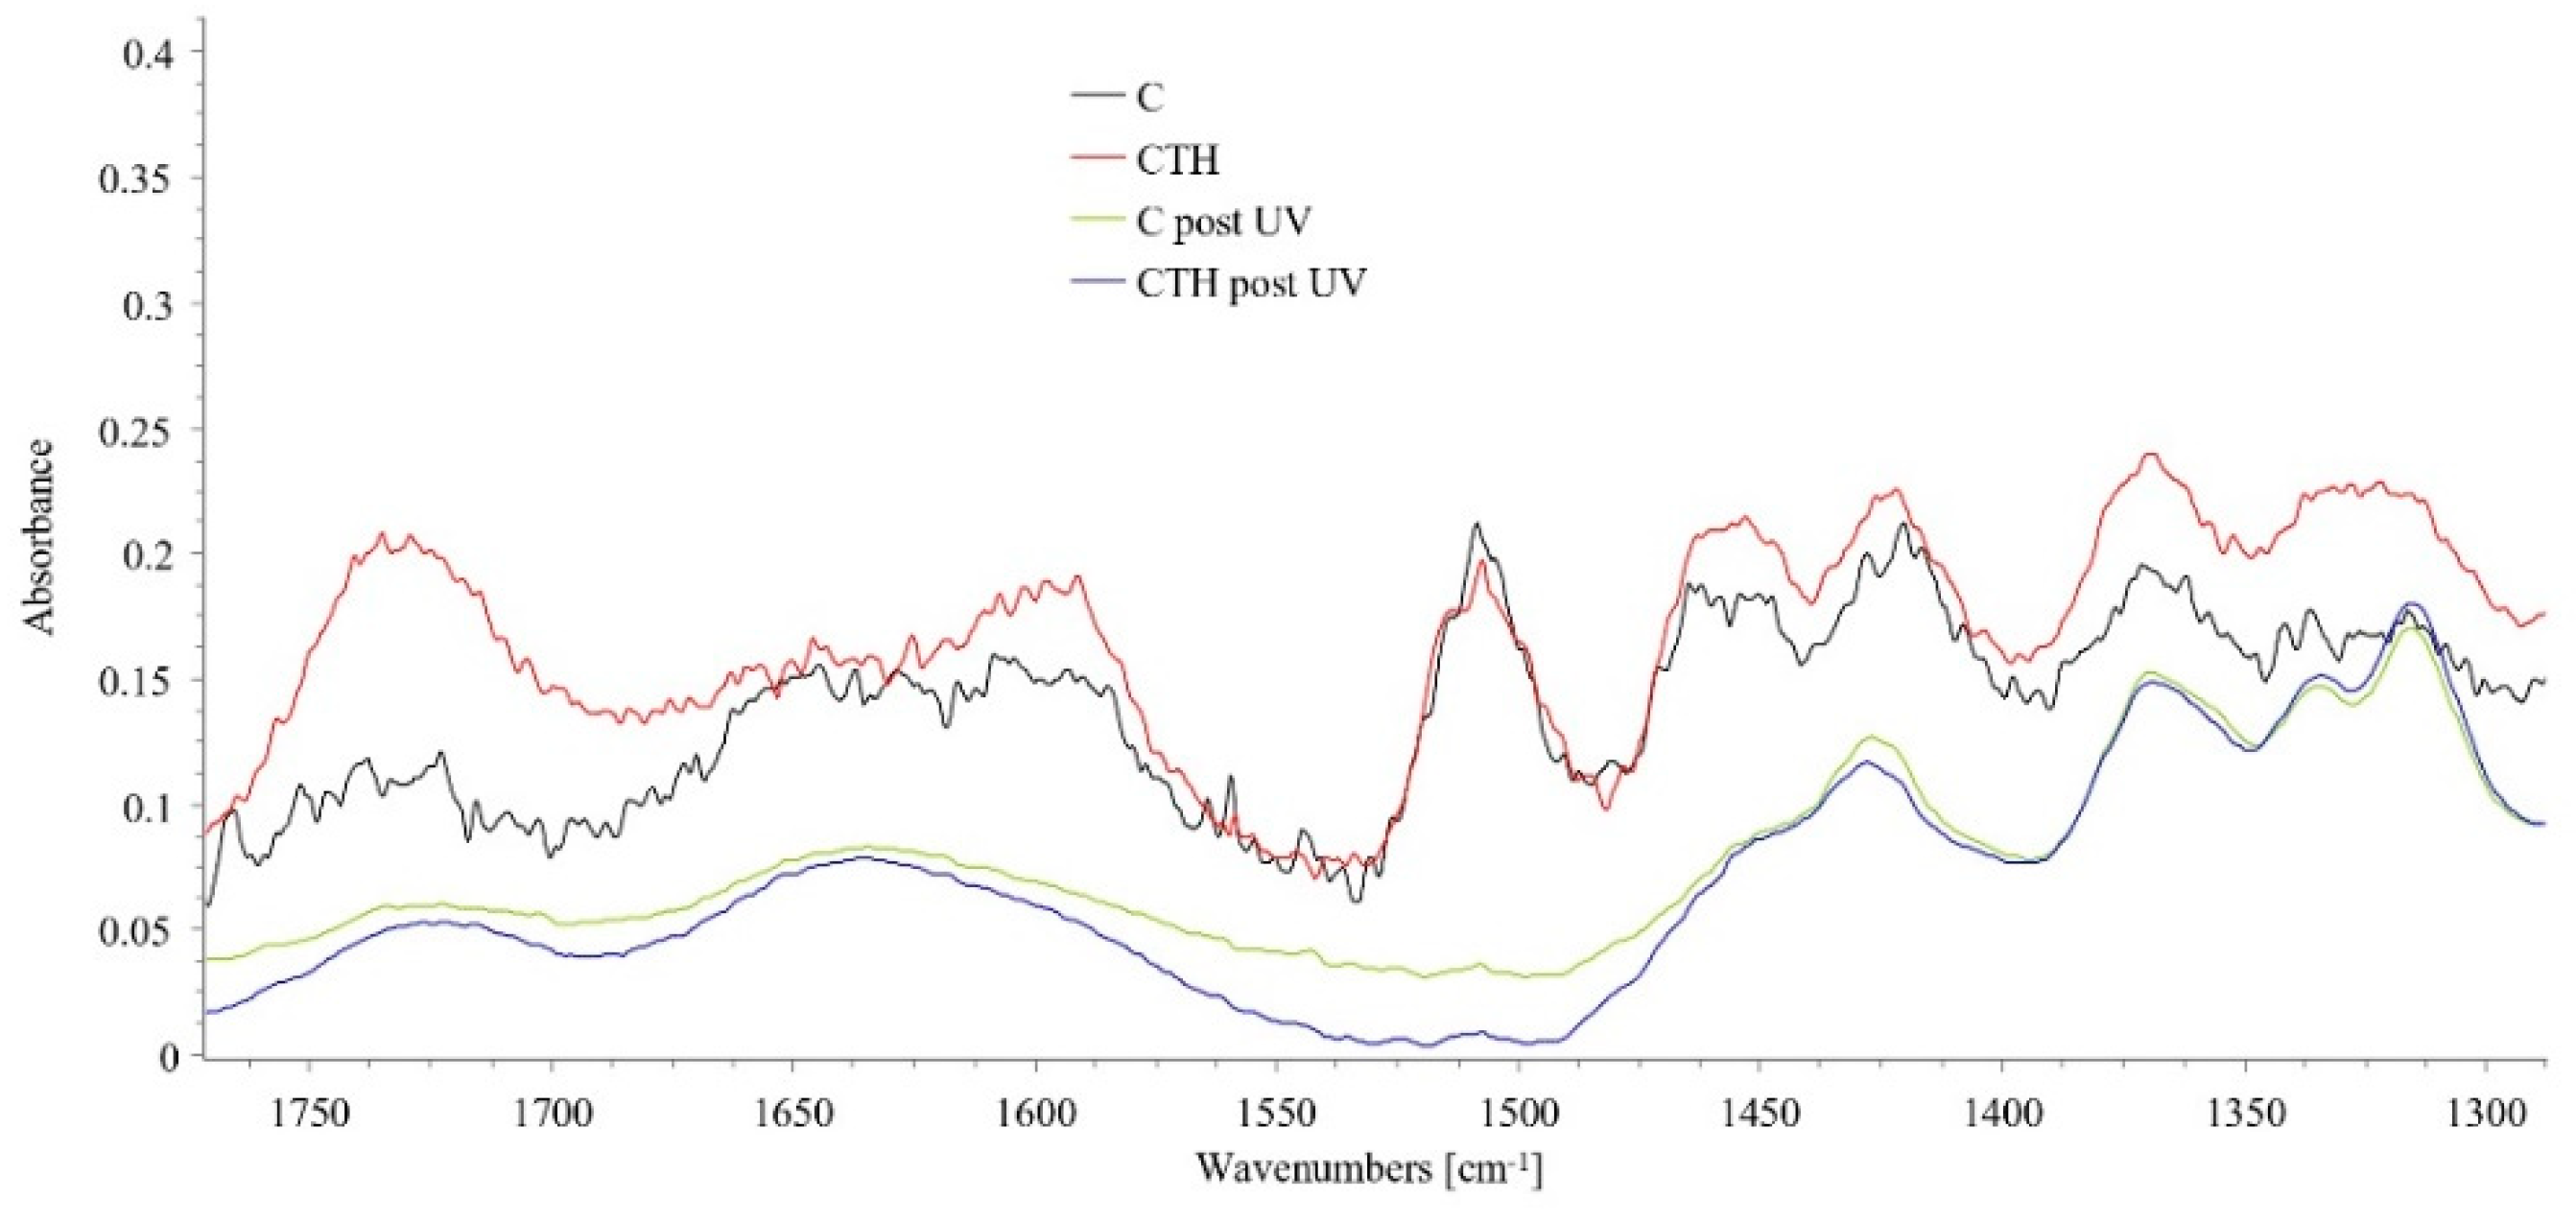
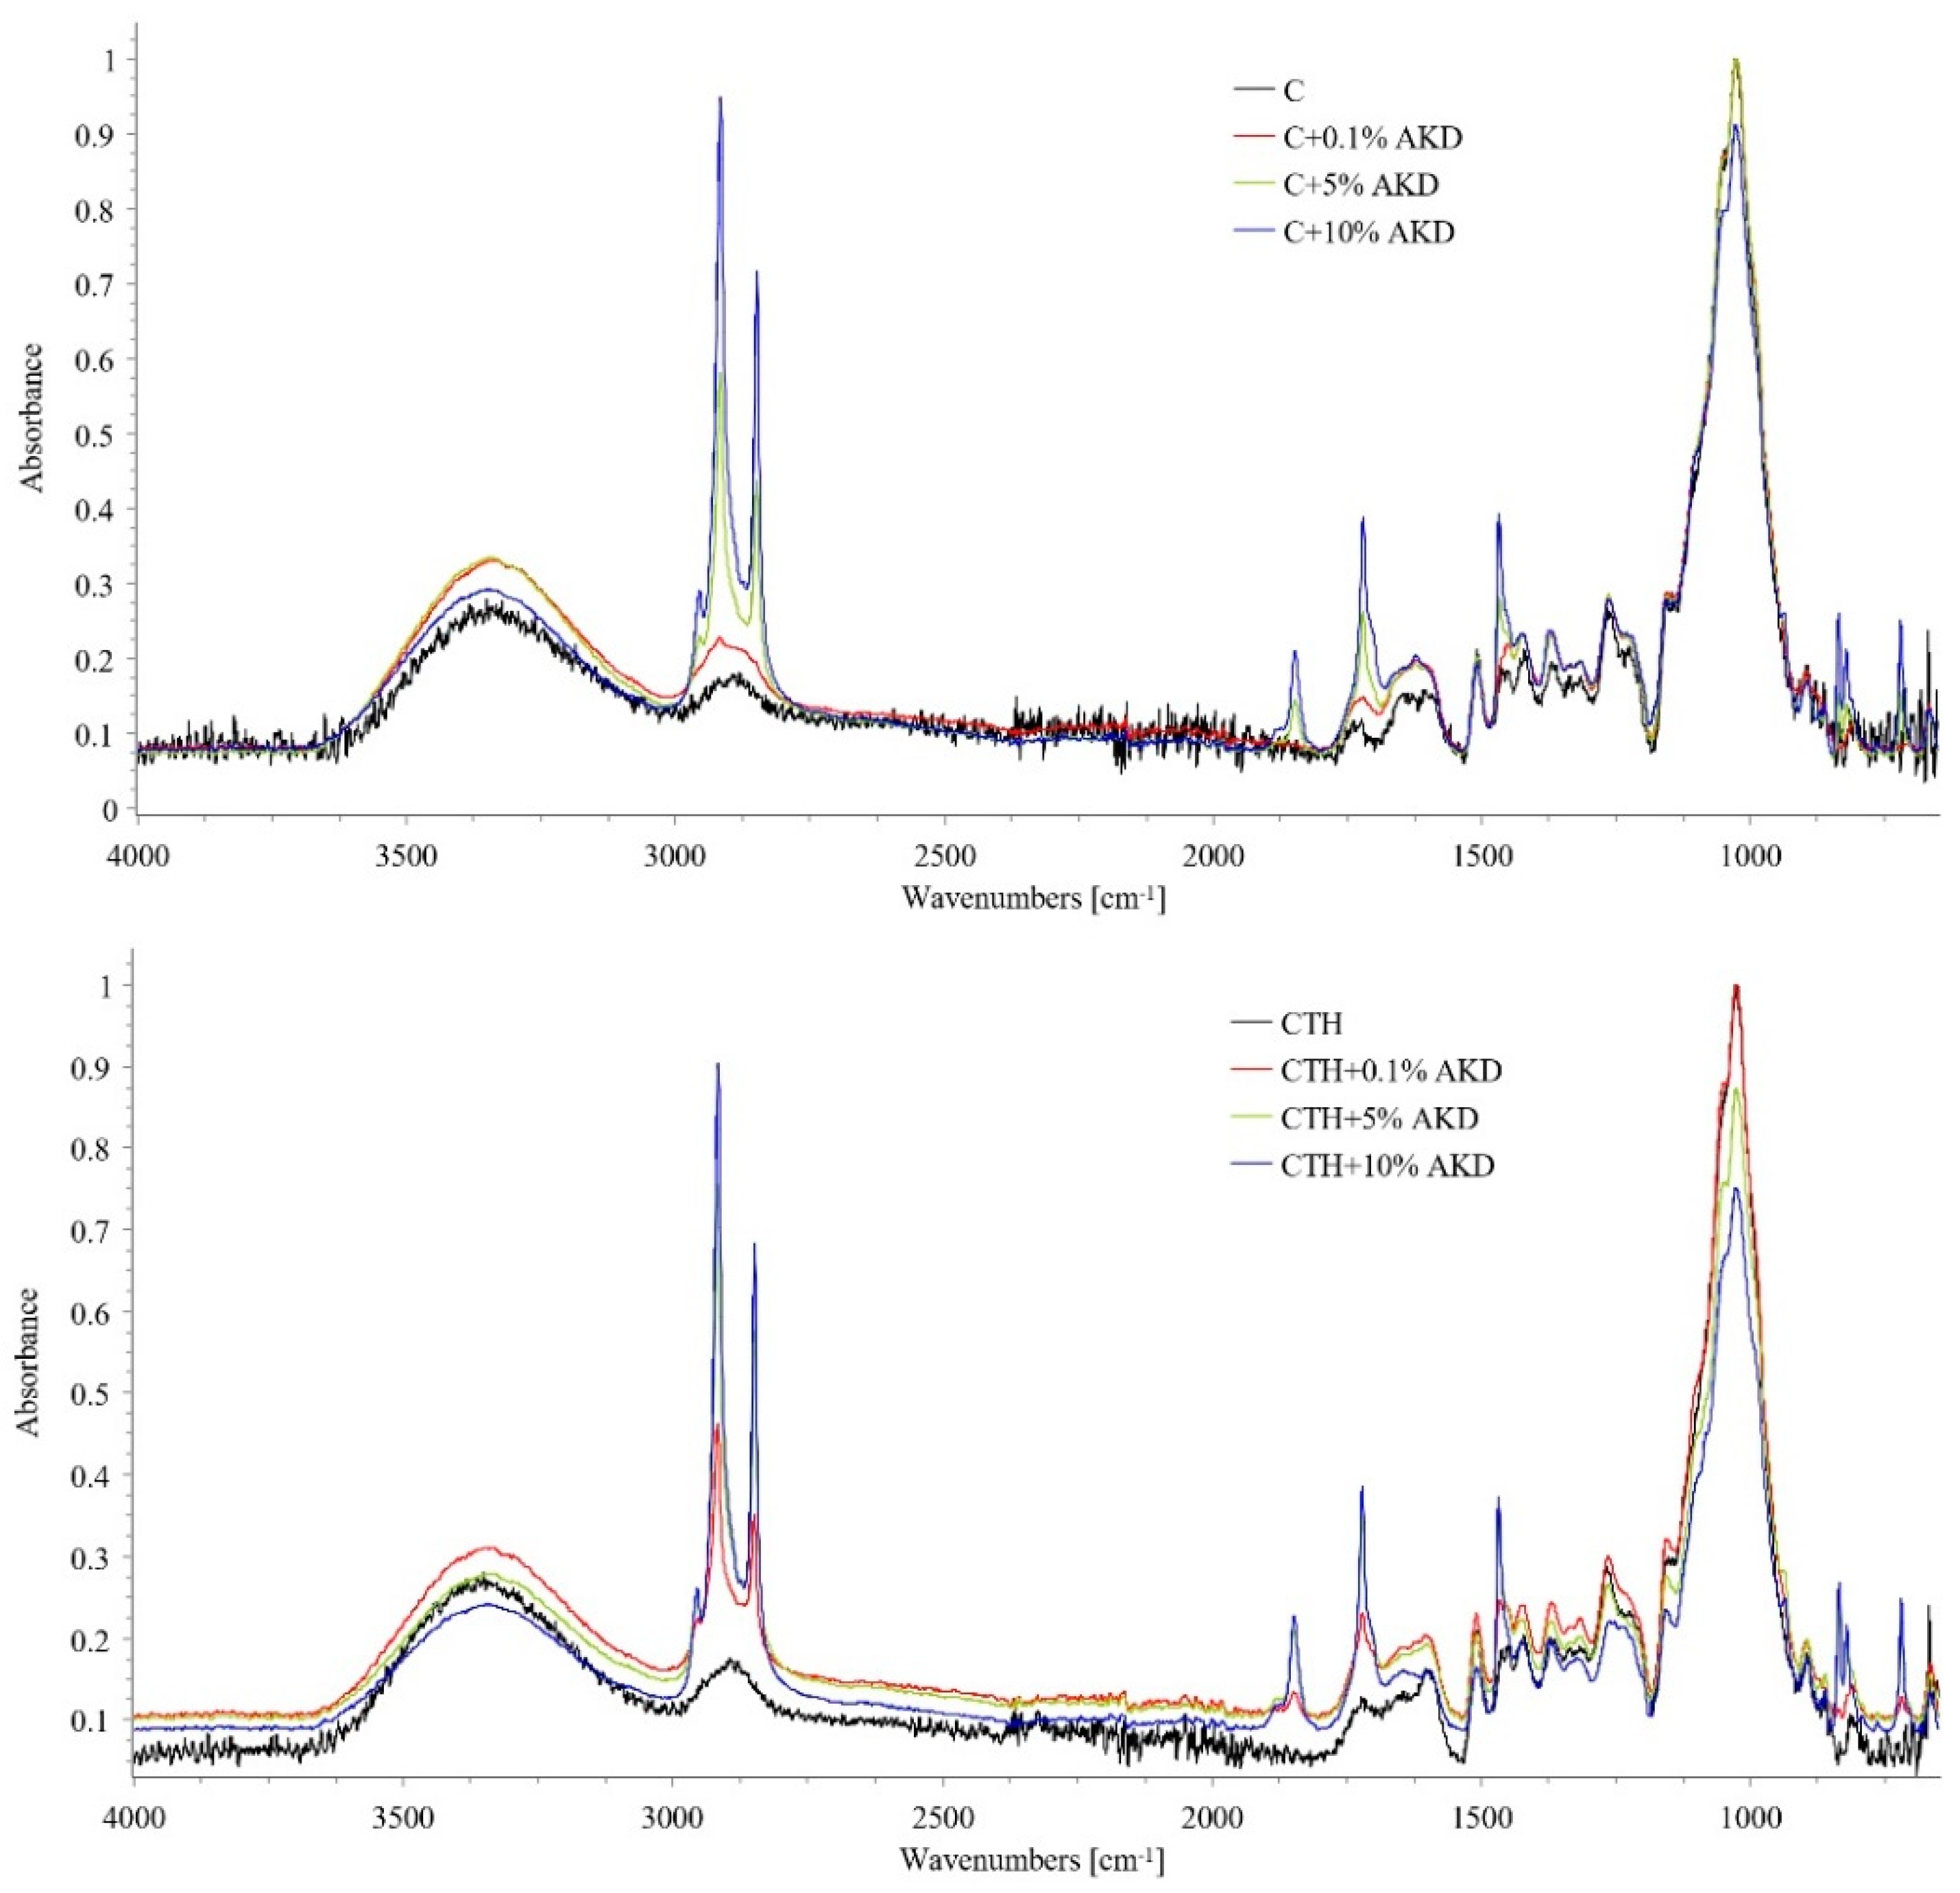
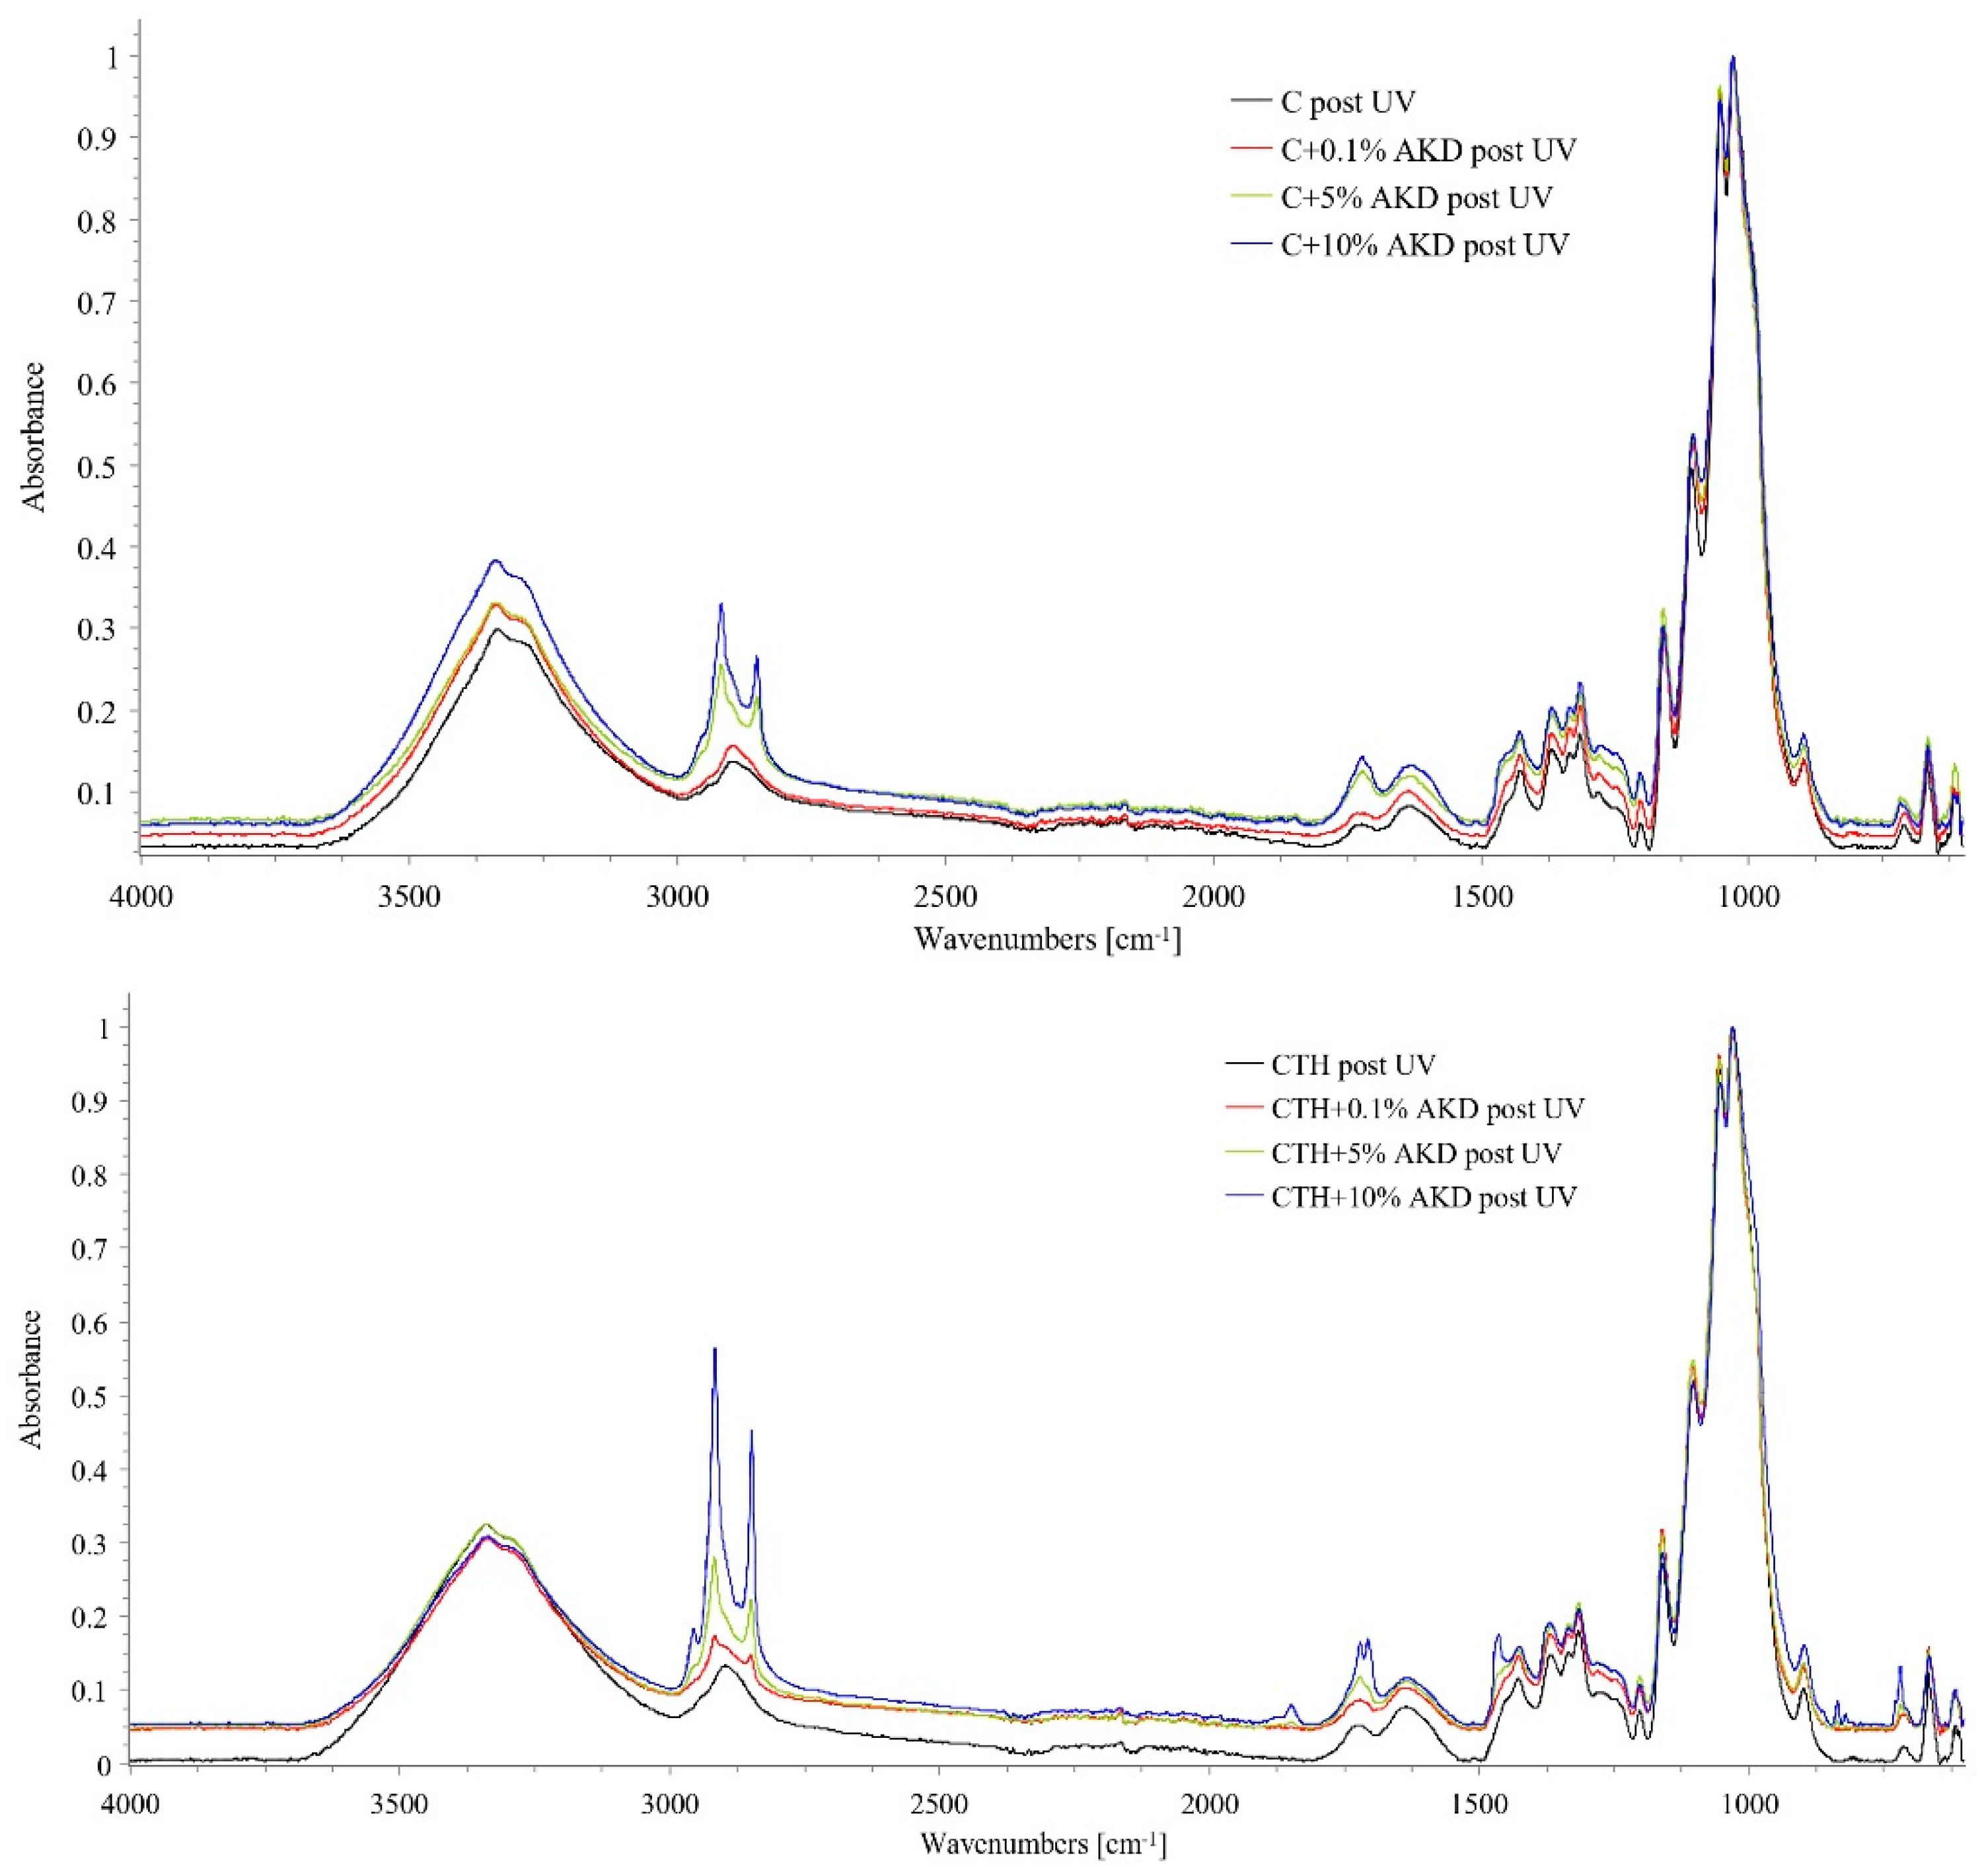
3.2. ATR-FTIR Analysis
3.3. Colour
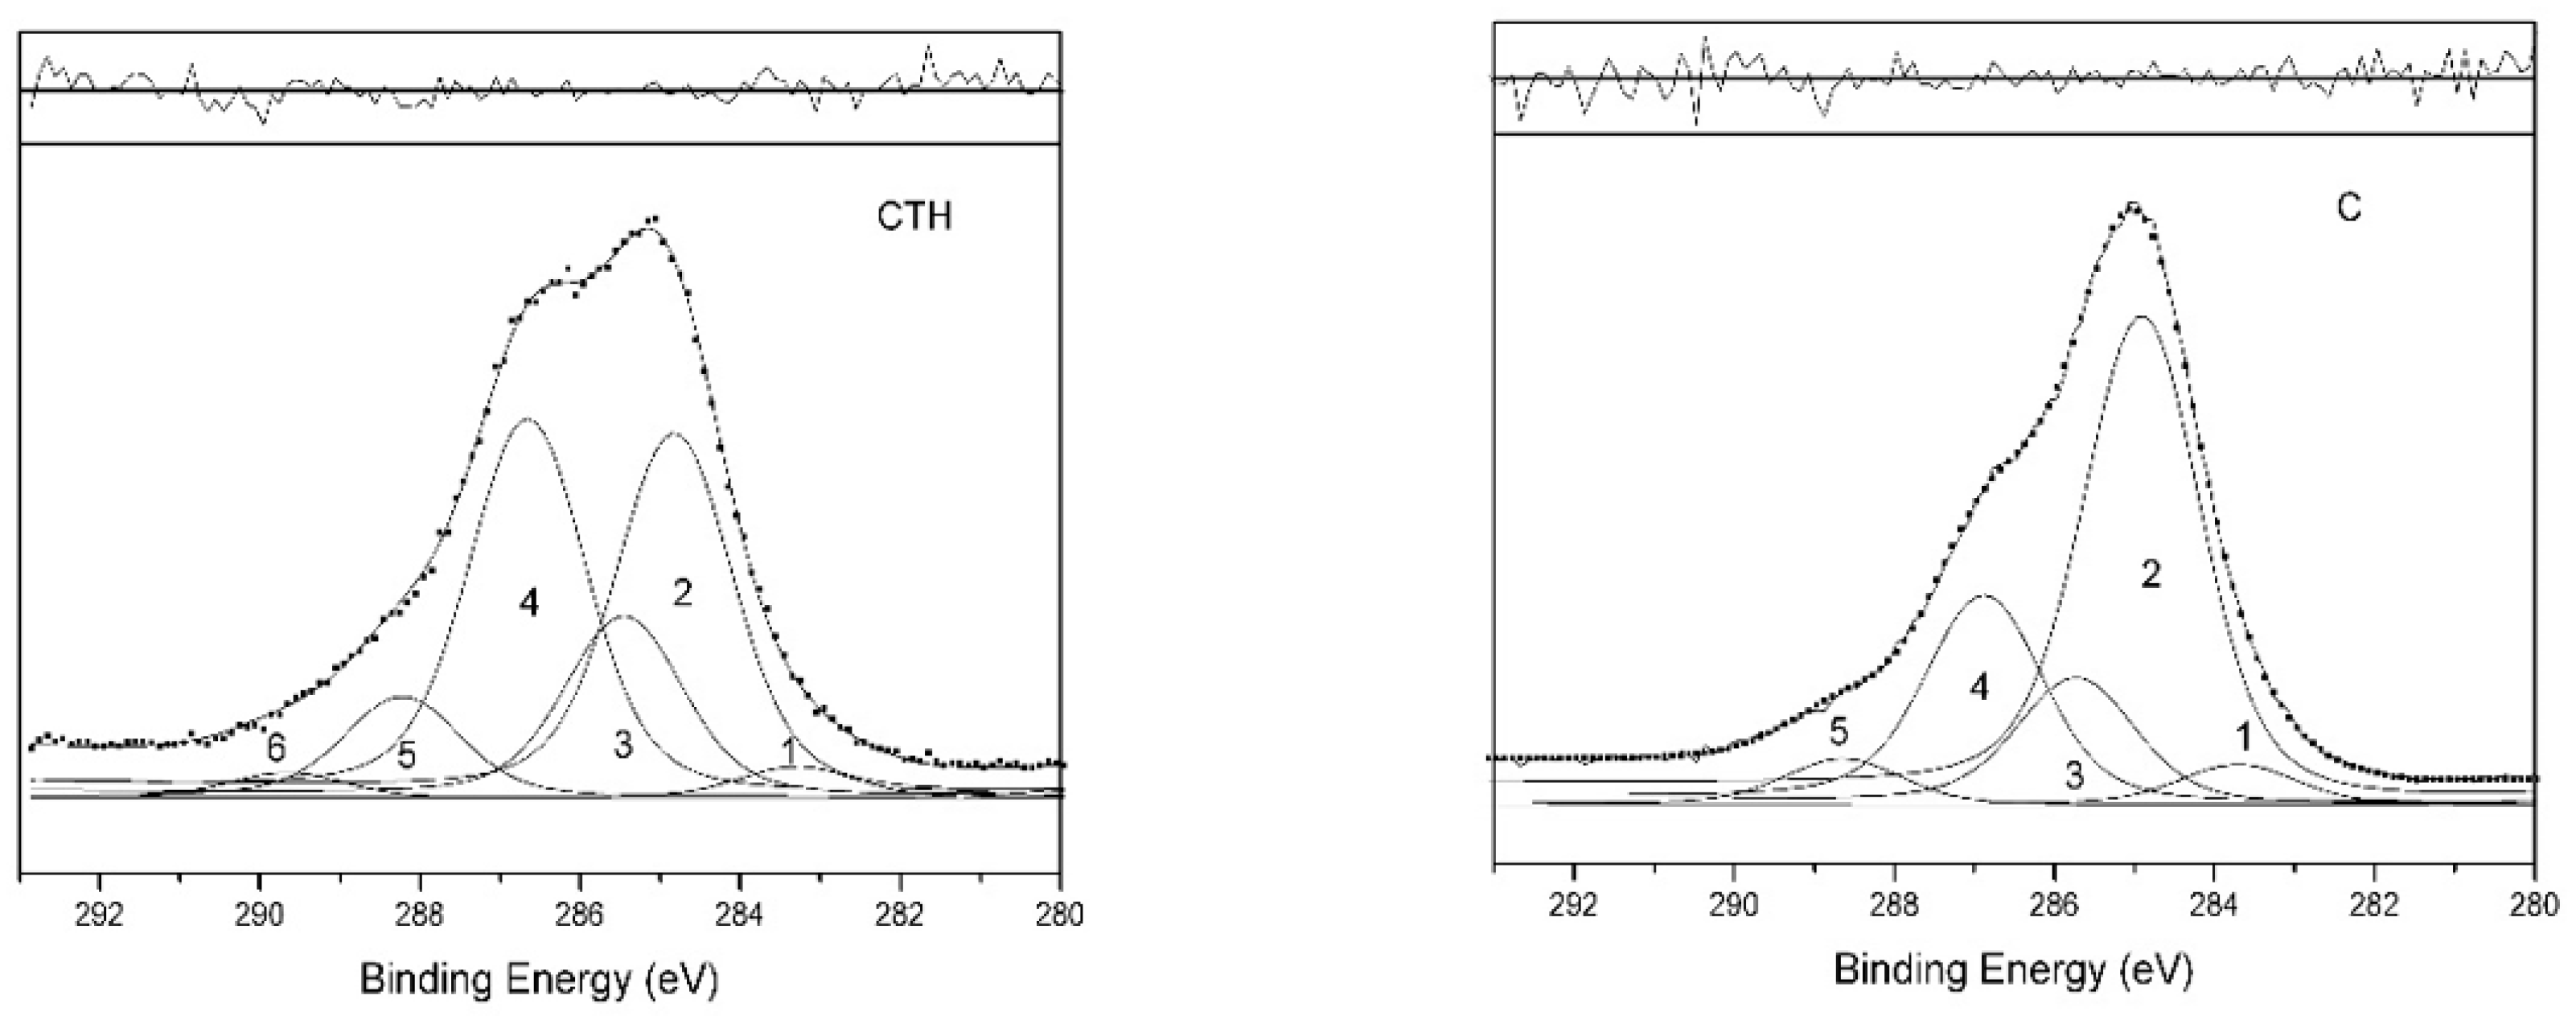
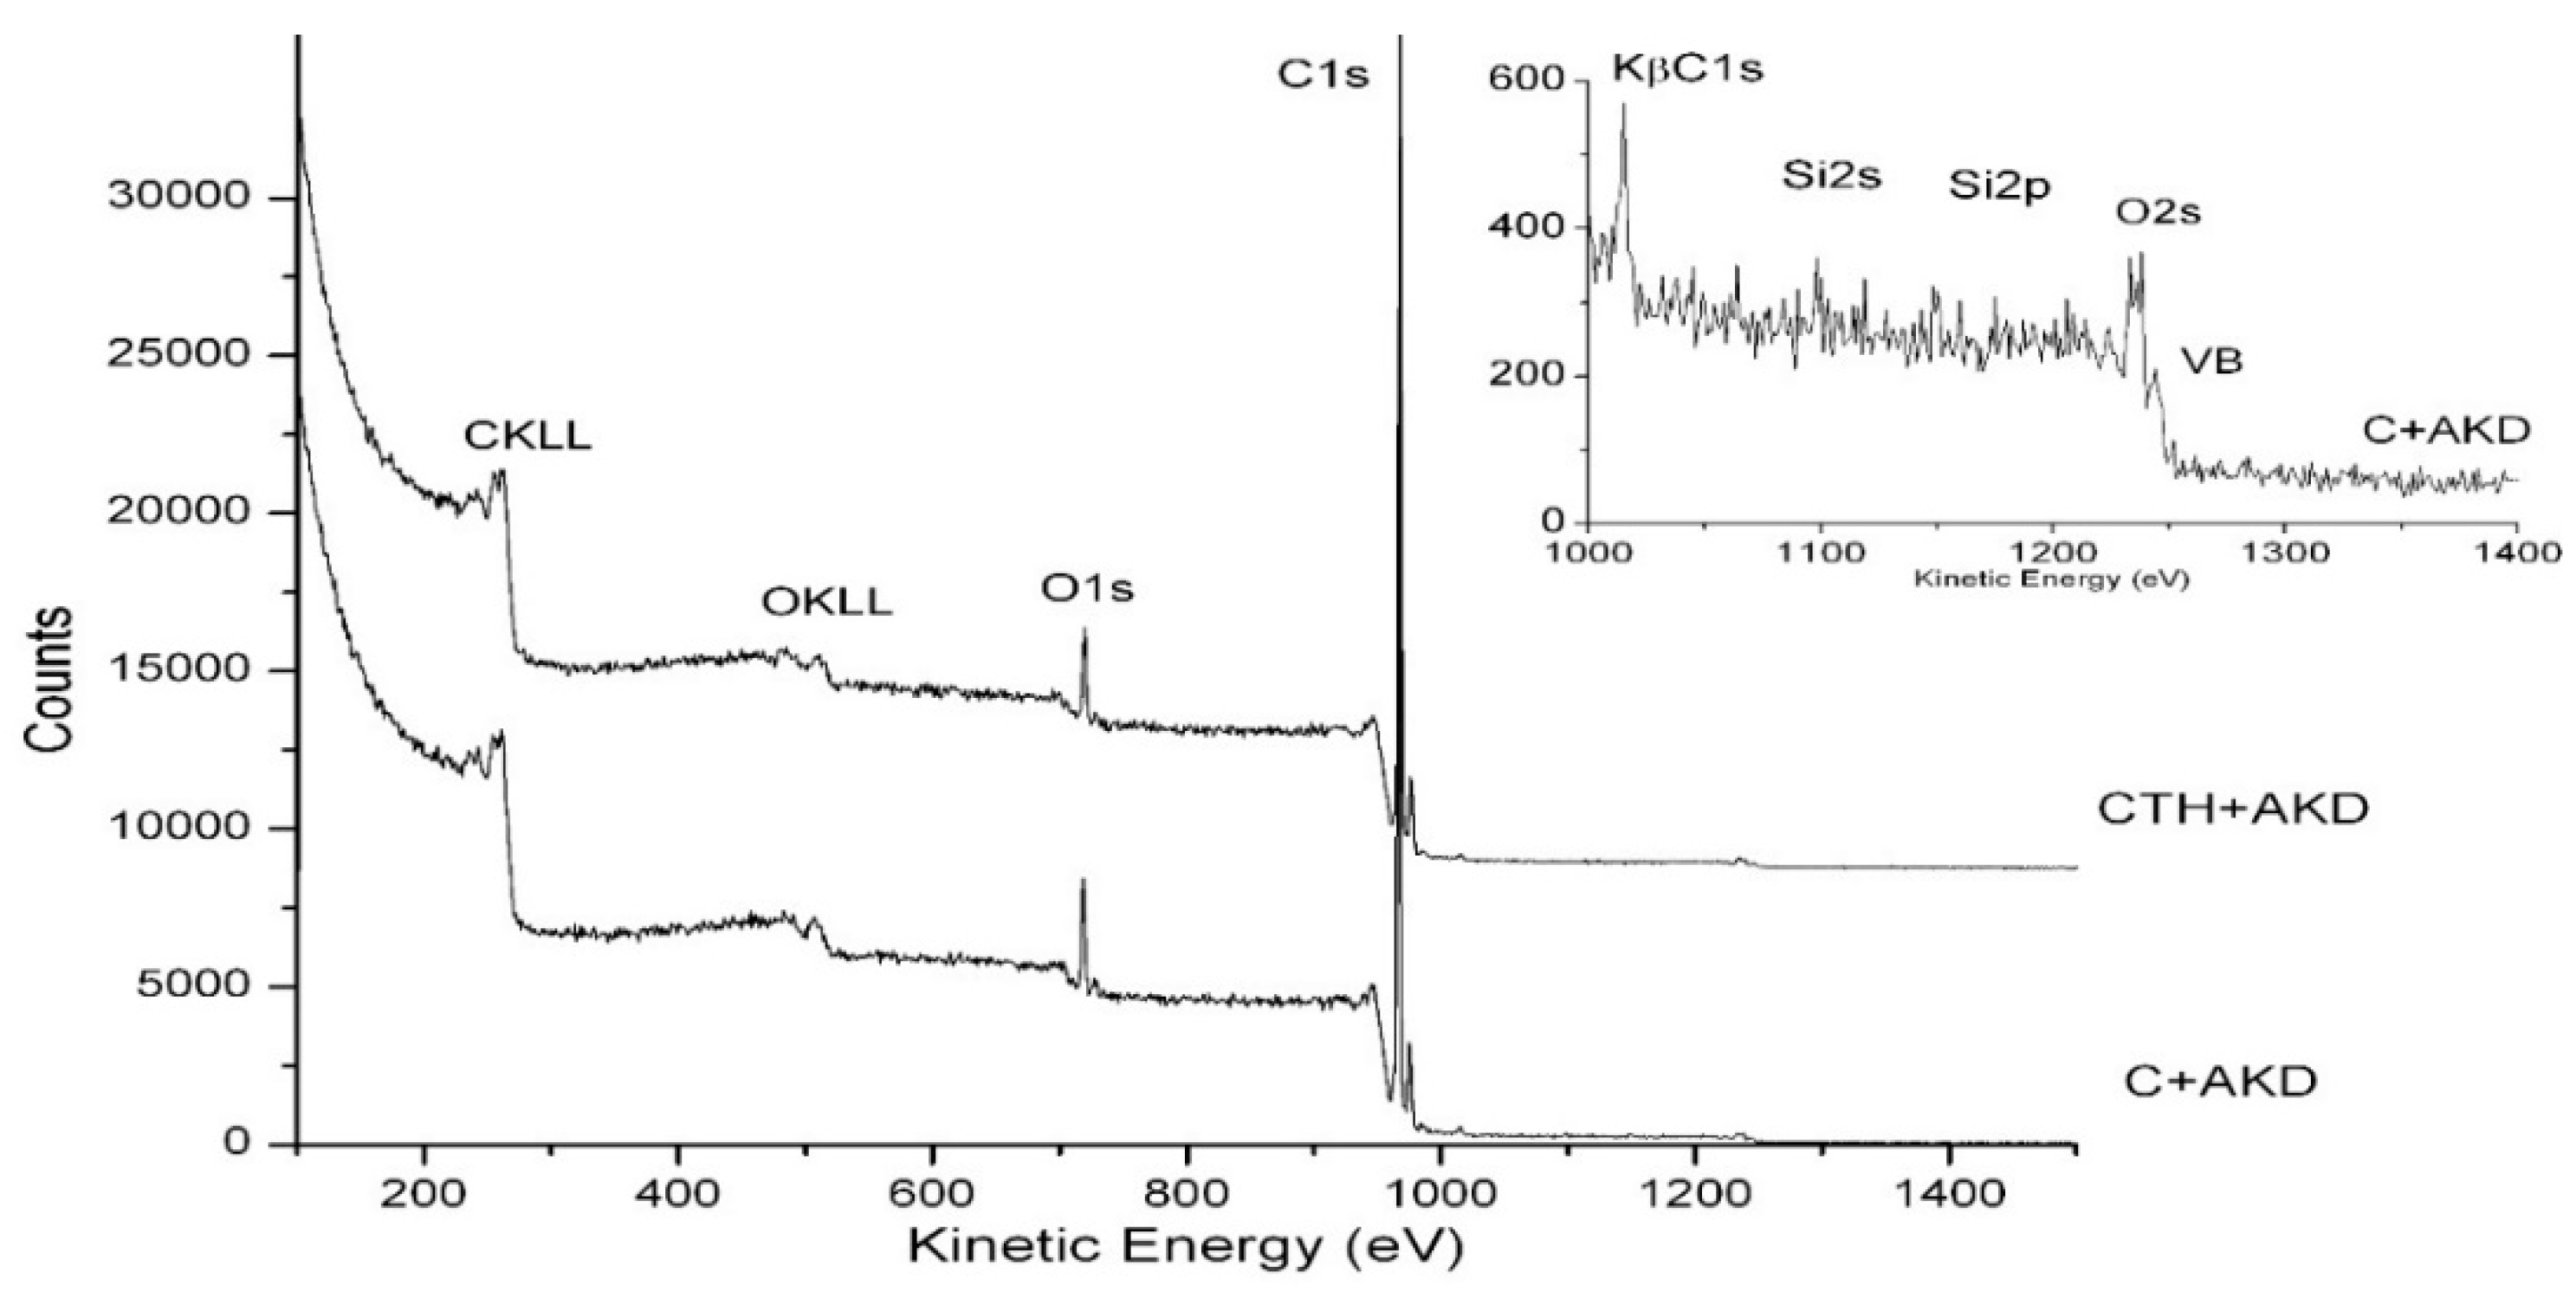
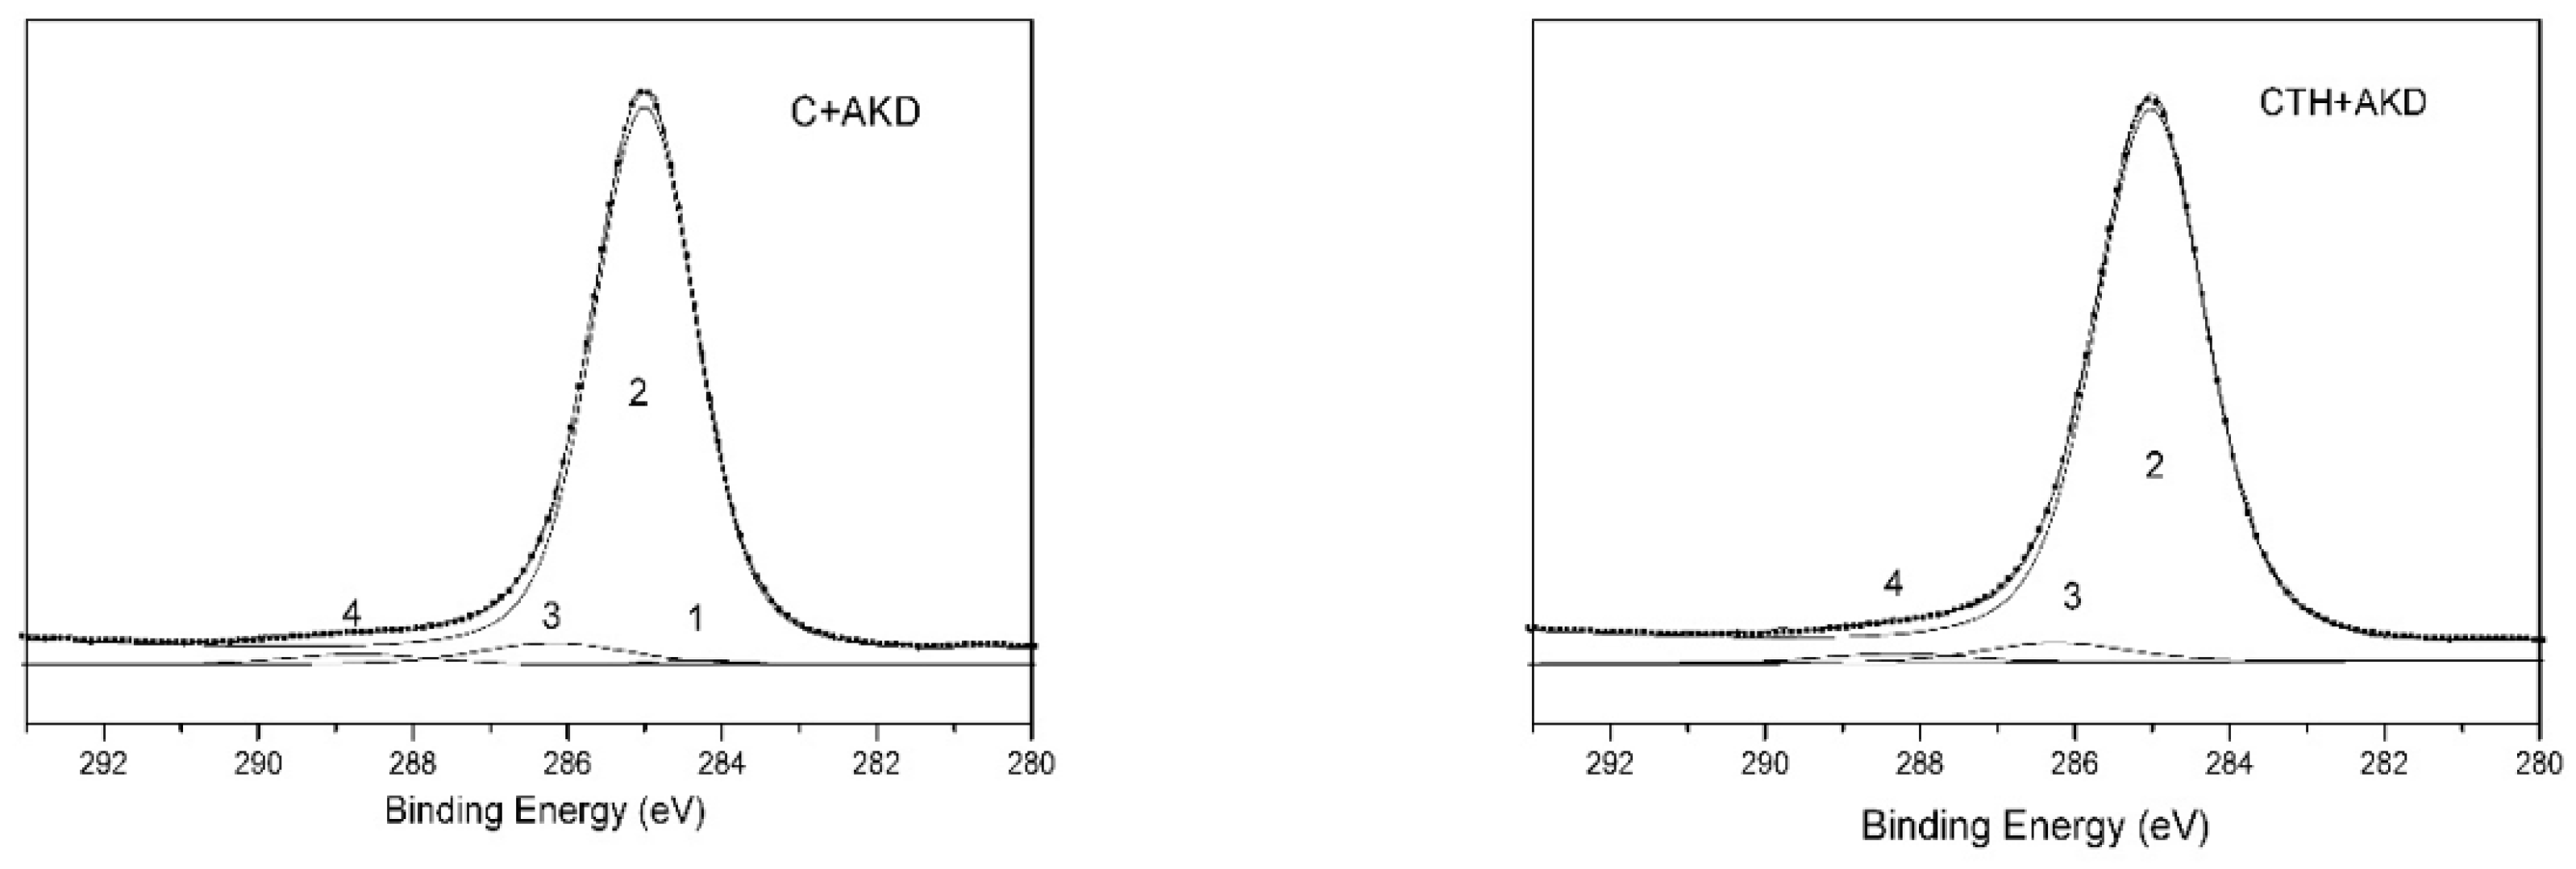
3.4. XPS Analysis
- A peak that was assigned to oxygen that was doubly bonded to carbon.
- A peak that was assigned to oxygen that was singly bonded to carbon.
- A peak that is assigned to oxygen that is doubly bonded to carbon.
- A peak that is assigned to oxygen that is singly bonded to carbon.
4. Conclusions
Author Contributions
Funding
Data Availability Statement
Conflicts of Interest
References
- Chen, C.J.; Kuang, Y.D.; Zhu, S.Z.; Burgert, I.; Keplinger, T.; Gong, A.; Li, T.; Berglund, L.; Eichhorn, S.J.; Hu, L.B. Structure-property-function relationships of natural and engineered wood. Nat. Rev. Mater. 2020, 5, 642–666. [Google Scholar] [CrossRef]
- Krišťáková, S.; Neykov, N.; Antov, P.; Sedliačiková, M.; Reh, R.; Halalisan, A.F.; Hajdúchová, I. Efficiency of wood-processing enterprises. Evaluation based on DEA and MPI: A comparison between Slovakia and Bulgaria for the period 2014–2018. Forests 2021, 12, 1026. [Google Scholar] [CrossRef]
- Feist, W.C. Outdoor wood weathering and protection. Archaeological wood, properties, chemistry, and preservation. Adv. Chem. Ser. 1990, 225, 263–298. [Google Scholar]
- Giordano, G. Tecnologia Del Legno 1981; UTET: Torino, Italy, 1981; Volume 1, pp. 938–939. [Google Scholar]
- Scheffer, T.C.; Morrell, J.J. Natural Durability of Wood: A Worldwide Checklist of Species; Oregon State University edition; College of Forestry, Forest Research Laboratory: Corvallis, OR, USA, 1998. (In English) [Google Scholar]
- Sandak, J.; Goli, G.; Cetera, P.; Sandak, A.; Cavalli, A.; Todaro, L. Machinability of minor wooden species before and after modification with thermo-vacuum technology. Materials 2017, 10, 121. [Google Scholar] [CrossRef]
- Lovaglio, T.; D’Auria, M.; Rita, A.; Todaro, L. Compositions of compounds extracted from thermo-treated wood using solvents of different polarities. IForest 2017, 10, 824. [Google Scholar] [CrossRef]
- Nabil, E.; Mahmoud, N.; Youssef, A.; Saber, E.; Kamel, S. Evaluation of physical, mechanical and chemical properties of Cedar and Sycamore woods after heat treatment. Egypt. J. Chem. 2018, 61, 1131–1149. [Google Scholar] [CrossRef]
- Bal, B.C. Effects of heat treatment on the physical properties of heartwood and sapwood of Cedruslibani. Bioresources 2013, 8, 211–219. [Google Scholar]
- Barkai, H.; Sadiki, M.; El Abed, S.; Moustakhim, M.; Houssaini, M.I.; Koraichi, S.I. Comparison of the evolution of physicochemical properties due to the single and combined adhesion of two species of the Penicillium genus on cedar wood. J. Mater. Environ. Sci. 2015, 6, 749–755. [Google Scholar]
- Ibnsouda, S.K.; Barkai, H.; Elabed, S.; Sadiki, M.; Boutahari, S.; Mounyr, B.; Omar, E.F. The Effect of Cellulase Treatment Time on the Cedar Wood Surface Physicochemical Properties. Am. J. Adv. Sci. Res. 2016, 3, 296–304. [Google Scholar]
- Hakkou, M.; Pétrissans, M.; Gérardin, P.; Zoulalian, A. Investigations of the reasons for fungal durability of heat-treated beech wood. Polym. Degrad. Stabilty 2006, 91, 393–397. [Google Scholar] [CrossRef]
- Taylor, A.M.; Gartner, B.L.; Morrell, J.J. Heartwood formation and natural durability-a review. Wood Fiber. Sci. 2002, 34, 587–611. [Google Scholar]
- Kirker, G.T.; Blodgett, A.B.; Arango, R.A.; Lebow, P.K.; Clausen, C.A. The role of extractives in naturally durable wood species. Int. Biodeterior. Biodegrad. 2013, 82, 53–58. [Google Scholar] [CrossRef]
- Papp, E.A.; Csiha, C.; Makk, A.N.; Hofmann, T.; Csoka, L. Wettability of wood surface layer examined from chemical change perspective. Coatings 2020, 10, 257. [Google Scholar] [CrossRef]
- Kamperidou, V.; Barboutis, I.; Vasileiou, V. Influence of thermal treatment on mechanical strength of scots pine (Pinus sylvestris L.) wood. Wood Res. 2014, 59, 373–378. [Google Scholar]
- Esteves, B.; Pereira, H. Wood modification by heat treatment: A review. BioResources 2009, 4, 370–404. [Google Scholar] [CrossRef]
- Hingston, J.A.; Collins, C.D.; Murphy, R.J.; Lester, J.N. Leaching of chromated copper arsenate wood preservatives: A review. Environ. Pollut. 2001, 111, 53–66. [Google Scholar] [CrossRef]
- Hubbe, M.A. Paper’s resistance to wetting–A review of internal sizing chemicals and their effects. BioResources 2007, 2, 106–145. [Google Scholar]
- Yan, Y.; Amer, H.; Rosenau, T.; Zollfrank, C.; Dörrstein, J.; Jobst, C.; Zimmermann, T.; Keckes, J.; Veigel, S.; Gindl-Altmutter, W.; et al. Dry, hydrophobic microfibrillated cellulose powder obtained in a simple procedure using alkyl ketene dimer. Cellulose 2016, 23, 1189–1197. [Google Scholar] [CrossRef]
- Arminger, B.; Gindl-Altmutter, W.; Keckes, J.; Hansmann, C. Facile preparation of superhydrophobic wood surfaces via spraying of aqueous alkyl ketene dimer dispersions. RSC Adv. 2019, 9, 24357–24367. [Google Scholar] [CrossRef]
- Lovaglio, T.; Gindl-Altmutter, W.; Meints, T.; Moretti, N.; Todaro, L. Wetting behaviour of alder (Alnus cordata (Loisel) Duby) wood surface: Effect of thermo-treatment and Alkyl Ketene Dimer (AKD). Forests 2019, 10, 770. [Google Scholar] [CrossRef]
- Pouzet, M.; Gautier, D.; Charlet, K.; Dubois, M.; Beakou, A. How to decrease the hydrophilicity of wood flour to process efficient composite materials. Appl. Surf. Sci. 2015, 353, 1234–1241. [Google Scholar] [CrossRef]
- Hui, B.; Li, Y.; Huang, Q.; Li, G.; Li, J.; Cai, L.; Yu, H. Fabrication of smart coatings based on wood substrates with photoresponsive behavior and hydrophobic performance. Mater. Des. 2015, 84, 277–284. [Google Scholar] [CrossRef]
- Ferrari, S.; Cuccui, I.; Allegretti, O. Thermo-vacuum modification of some European softwood and hardwood species treated at different conditions. BioResources 2013, 8, 1100–1109. [Google Scholar] [CrossRef]
- CSN EN 927-6; Paints and Varnishes—Coating Materials and Coating Systems for Exterior Wood—Part 6: Exposure of Wood Coatings to Artificial Weathering Using Fluorescent UV Lamps and Water. European Committee for Standardization: Brussels, Belgium, 2006.
- de Meijer, M.; Haemers, S.; Cobben, W.; Militz, H. Surface energy determinations of wood: Comparison of methods and wood species. Langmuir 2000, 16, 9352–9359. [Google Scholar] [CrossRef]
- Meints, T.; Teischinger, A.; Stingl, R.; Hansmann, C. Wood colour of central European wood species: CIELAB characterisation and colour intensification. Eur. J. Wood Wood Prod. 2017, 75, 499–509. [Google Scholar] [CrossRef]
- Watts, J.F. An Introduction to Surface Analysis by Electron Spectroscopy; (Royal Microscopical Society Microscopy Handbooks, 22); Oxford University Press: New York, NY, USA, 1990; Volume 22, p. 96. [Google Scholar]
- Briggs, D. Practical surface analysis. Auger X-Ray Photoelecton Spectrosc. 1990, 1, 151–152. [Google Scholar]
- Matthew, J. Surface Analysis by Auger and X-ray Photoelectron Spectroscopy; Briggs, D., Grant, J.T., Eds.; IMPublications: Chichester, UK; SurfaceSpectra: Manchester, UK, 2004; p. 900. [Google Scholar]
- Castle, J.E.; Salvi, A.M. Chemical state information from the near-peak region of the X-ray photoelectron background. J. Electron Spectrosc. 2001, 114, 1103–1113. [Google Scholar] [CrossRef]
- Castle, J.E.; Chapman-Kpodo, H.; Proctor, A.; Salvi, A.M. Curve-fitting in XPS using extrinsic and intrinsic background structure. J. Electron Spectrosc. 2000, 106, 65–80. [Google Scholar] [CrossRef]
- Vogler, E.A. Structure and reactivity of water at biomaterial surfaces. Adv. Colloid. Interfac. 1998, 74, 69–117. [Google Scholar] [CrossRef]
- Podgorski, L.; Chevet, B.; Onic, L.; Merlin, A. Modification of wood wettability by plasma and corona treatments. Int. J. Adhes. Adhes. 2000, 20, 103–111. [Google Scholar] [CrossRef]
- Fengel, D.; Wegener, G. Wood: Chemistry, ultrastructure, reactions. Walter Gruyter 1984, 613, 1960–1982. [Google Scholar]
- Tjeerdsma, B.F.; Militz, H. Chemical changes in hydrothermal treated wood: FTIR analysis of combined hydrothermal and dry heat-treated wood. Holz Roh Werkst. 2005, 63, 102–111. [Google Scholar] [CrossRef]
- Hillis, W.E. High temperature and chemical effects on wood stability. Wood. Sci. Technol. 1984, 18, 281–293. [Google Scholar] [CrossRef]
- Shi, Z.; Fu, F.; Wang, S.; He, S.; Yang, R. Modification of Chinese fir with al-kyl ketene dimer (AKD): Processing and characterization. BioResources 2013, 8, 581–591. [Google Scholar]
- Kocaefe, D.; Poncsak, S.; Doré, G.; Younsi, R. Effect of heat treatment on the wettability of white ash and soft maple by water. Holz Roh Werkst. 2008, 66, 355–361. [Google Scholar] [CrossRef]
- Rowell, R.M. Chemical Modification of Wood. In Handbook of Wood Chemistry and Wood Composites, 1st ed.; CRC Press: Boca Raton, FL, USA, 2005; p. 381. [Google Scholar] [CrossRef]
- Evans, P.A. Differentiating “hard” from “soft” woods using Fourier transform infrared and Fourier transform spectroscopy. Spectrochim. Acta Part A Mol. Spectrosc. 1991, 47, 1441–1447. [Google Scholar] [CrossRef]
- Colom, X.; Carrillo, F.; Nogués, F.; Garriga, P. Structural analysis of photodegraded wood by means of FTIR spectroscopy. Polym. Degrad. Stabilty 2003, 80, 543–549. [Google Scholar] [CrossRef]
- Hon, N.S. Surface Chemistry of Oxidized Wood. Cellulose and Wood Chemistry and Technology; Schuerch, C., Ed.; John Wiley and Sons: New York, NY, USA, 1989; p. 1401. [Google Scholar]
- Markov, P.; Shishkova, L.; Radushev, A. Effect of UV irradiation on some β-dicarbonyl compounds in solution. Tetrahedron 1973, 29, 3203–3205. [Google Scholar] [CrossRef]
- Veierov, D.; Bercovici, T.; Fischer, E.; Mazur, Y.; Yogev, A. Photoisomerization of the enol form of 1, 3-dicarbonyl compounds. J. Am. Chem. Soc. 1977, 99, 2723–2729. [Google Scholar] [CrossRef]
- Lozada-Garcia, R.R.; Ceponkus, J.; Chin, W.; Chevalier, M.; Crépin, C. Acetylacetone in hydrogen solids: IR signatures of the enol and keto tautomers and UV induced tautomerization. Chem. Phys. Lett. 2011, 504, 142–147. [Google Scholar] [CrossRef]
- Mitsui, K.; Takada, H.; Sugiyama, M.; Hasegawa, R. Changes in the Properties of Light-Irradiated Wood with Heat Treatment. Part 1. Effect of Treatment Conditions on the Change in Color. Wood Res. Technol. Holzforsch. 2001, 55, 601–605. [Google Scholar] [CrossRef]
- Bekhta, P.; Niemz, P. Effect of High Temperature on the Change in Color, Dimensional Stability and Mechanical Properties of Spruce Wood. Holzforschung 2003, 57, 539–546. [Google Scholar] [CrossRef]
- Lebo, S.E.; Lonsky, W.F.; McDonough, T.J.; Medvecz, P.J.; Dimmel, D.R. The occurrence and light-induced formation of ortho-quinonoid lignin structures in white spruce refiner mechanical pulp. J. Pulp Paper Sci. 1990, 16, 139–143. [Google Scholar]
- Pandey, K.K. Study of the effect of photo-irradiation on the surface chemistry of wood. Polym. Degrad. Stabilty 2005, 90, 9–20. [Google Scholar] [CrossRef]
- Miklecic, J.; Jirouš-Rajković, V.; Antonović, A.; Španić, N. Discolouration of thermally modified wood during simulated indoor sunlight exposure. BioResources 2011, 6, 434–446. [Google Scholar] [CrossRef]
- Todaro, L.; D’Auria, M.; Langerame, F.; Salvi, A.M.; Scopa, A. Surface characterization of untreated and hydro-thermally pre-treated Turkey oak woods after UV-C irradiation. Surf. Interface Anal. 2015, 47, 206–215. [Google Scholar] [CrossRef]
- Kamdem, D.P.; Riedl, B.; Adnot, A.; Kaliaguine, S. ESCA spectroscopy of poly (methyl methacrylate) grafted onto wood fibers. J. Appl. Polym. Sci. 1991, 43, 1901–1912. [Google Scholar] [CrossRef]
- Hantsche, H. High Resolution XPS of Organic Polymers, the Scienta ESCA300 Database; Beamson, G., Briggs, D., Eds.; Wiley: Chichester, UK, 1992; p. 295. ISBN 0-471-93592-1. [Google Scholar]
- Kocaefe, D.; Huang, X.; Kocaefe, Y.; Boluk, Y. Quantitative characterization of chemical degradation of heat-treated wood surfaces during artificial weathering using XPS. Surf. Interface Anal. 2013, 45, 639–649. [Google Scholar] [CrossRef]
- Lindfors, J. Adhesion of Reactive Sizes and Paper Machine Fouling; University of Technology: Helsinki, Finland, 2007; p. 61. [Google Scholar]
- Shen, W.; Zhang, H.; Ettl, R. Chemical composition of “AKD vapour” and its implication to AKD vapour sizing. Cellulose 2005, 12, 641–652. [Google Scholar] [CrossRef]
- Lindfors, J.; Salmi, J.; Laine, J.; Stenius, P. AKD and ASA model surfaces: Preparation and characterization. BioResources 2007, 2, 652–670. [Google Scholar]


| Pre-UV Test | Post-UV Test | |
|---|---|---|
| Treatment | Cedar Code Abbreviation | Cedar Code Abbreviation |
| Unmodified | C | C post-UV |
| TH | CTH | CTH post-UV |
| Unmodified + 0.1% AKD | C + 0.1% AKD | C + 0.1% AKD post-UV |
| CTH + 0.1% AKD | CTH + 0.1% AKD | CTH + 0.1% AKD post-UV |
| Unmodified + 5% AKD | C + 5% AKD | C + 5% AKD post-UV |
| CTH + 5% AKD | CTH + 5% AKD | CTH + 5% AKD post-UV |
| Unmodified + 10% AKD | C + 10% AKD | C + 10% AKD post-UV |
| CTH + 10% AKD | CTH + 10% AKD | CTH + 10% AKD post-UV |
| ΔL | Δa | Δb | ΔE | |
|---|---|---|---|---|
| Unmodified samples | ||||
| C | 0 | 0 | 0 | 0 |
| C + 0.1% AKD | 0.36 a | −0.35 a | −2.27 c | 2.40 a |
| C + 5% AKD | 1.77 b | −0.44 b | −1.86 b | 2.95 b |
| C + 10% AKD | 2.69 c | 0.47 b | −0.40 a | 2.97 b |
| Thermomodified | ||||
| CTH | −22.64 b | 2.21 c | −1.43 b | 22.81 c |
| CTH + 0.1% AKD | 2.52 a | −0.50 b | 1.56 b | 3.03 a |
| CTH + 5% AKD | 2.75 a | −1.90 a,b | −9.8 a | 10.40 b |
| CTH + 10% AKD | 2.12 a | −2.28 a | −11.21c | 11.65 b |
| Cedar Post-UV | ΔL | Δa | Δb | ΔE |
|---|---|---|---|---|
| Unmodified samples | ||||
| C | −7.50 b | 1.73 b | −0.80 a,b | 8.01 a |
| C + 0.1% AKD | −9.39 b | 1.32 a | −1.54 a | 9.63 a,b |
| C + 5% AKD | −11.17 a | 1.57 a,b | −0.95 a,b | 11.42 b |
| C + 10% AKD | −8.91 b | 1.70 b | −0.14 b | 9.40 a,b |
| Thermomodified | ||||
| CTH | 5.80 b | −2.23 a,b | −5.36 b | 8.23 b |
| CTH + 0.1% AKD | 5.75 b | −3.20 a | −9.2 a | 11.35 b |
| CTH + 5% AKD | 2.66 a | −1.56 b | 1.30 c | 3.69 a |
| CTH + 10% AKD | 3.53 a,b | −1.43 b | 4.23 d | 5.75 a,b |
| Region | Peak Number | C | CTH | ||
|---|---|---|---|---|---|
| Binding Energy (BE) (Ev) | Norm. Area (a.u.) | BE (Ev) | Norm. Area (a.u.) | ||
| C1S | 1 | 283.6 | 1861.2 | 283.3 | 1194.2 |
| 2 | 284.8 | 22,246.1 | 284.8 | 13,621.0 | |
| 3 | 285.6 | 5806.5 | 285.4 | 6813.1 | |
| 4 | 286.7 | 9550.4 | 286.6 | 14,162.4 | |
| 5 | 288.5 | 2120.6 | 288.2 | 3797.9 | |
| 6 | - | - | 289.6 | 975.24 | |
| O1s | 1 | 532.0 | 1753.4 | 531.6 | 2044.9 |
| 2 | 533.0 | 12,821.7 | 533.1 | 17,190.45 | |
| N1s * | - | - | - | 400.0 | 354.3 |
| Region | Peak Number | C + 5% AKD | CTH + 5% AKD | ||
|---|---|---|---|---|---|
| BE (Ev) | Norm. Area (a.u.) | BE (Ev) | Norm. Area (a.u.) | ||
| 1S | 1 | 284.3 | 498.5.0 | - | - |
| 2 | 285.0 | 50614.4 | 285.0 | 52104.0 | |
| 3 | 286.2 | 2954.9 | 286.2 | 2477.4 | |
| 4 | 288.7 | 1477.4 | 288.3 | 1238.7 | |
| O1s | 1 | 532.4 | 1430.5 | 532.3 | 1321.7 |
| 2 | 533.4 | 1430.5 | 533.5 | 1321.7 | |
| Si2p | - | 102.0 | 162.1 | - | - |
Publisher’s Note: MDPI stays neutral with regard to jurisdictional claims in published maps and institutional affiliations. |
© 2022 by the authors. Licensee MDPI, Basel, Switzerland. This article is an open access article distributed under the terms and conditions of the Creative Commons Attribution (CC BY) license (https://creativecommons.org/licenses/by/4.0/).
Share and Cite
Lovaglio, T.; D’Auria, M.; Gindl-Altmutter, W.; Lo Giudice, V.; Langerame, F.; Salvi, A.M.; Todaro, L. Thermal Modification and Alkyl Ketene Dimer Effects on the Surface Protection of Deodar Cedar (Cedrus deodara Roxb.) Wood. Forests 2022, 13, 1551. https://doi.org/10.3390/f13101551
Lovaglio T, D’Auria M, Gindl-Altmutter W, Lo Giudice V, Langerame F, Salvi AM, Todaro L. Thermal Modification and Alkyl Ketene Dimer Effects on the Surface Protection of Deodar Cedar (Cedrus deodara Roxb.) Wood. Forests. 2022; 13(10):1551. https://doi.org/10.3390/f13101551
Chicago/Turabian StyleLovaglio, Teresa, Maurizio D’Auria, Wolfgang Gindl-Altmutter, Valentina Lo Giudice, Fausto Langerame, Anna Maria Salvi, and Luigi Todaro. 2022. "Thermal Modification and Alkyl Ketene Dimer Effects on the Surface Protection of Deodar Cedar (Cedrus deodara Roxb.) Wood" Forests 13, no. 10: 1551. https://doi.org/10.3390/f13101551