Article

Vertical Variation in Leaf Traits and Crown Structure Promote the Coexistence of Forest Tree Species

1
Key Laboratory of Vegetation Restoration and Management of Degraded Ecosystems, Guangdong Provincial Key Laboratory of Applied Botany, South China Botanical Garden, Center for Plant Ecology, Core Botanical Gardens, Chinese Academy of Sciences, Xingke Road 723, Guangzhou 510650, China
2
Southern Marine Science and Engineering Guangdong Laboratory (Guangzhou), Haibin Road 1119, Guangzhou 511458, China
*
Author to whom correspondence should be addressed.
Forests 2022, 13(10), 1548; https://doi.org/10.3390/f13101548
Submission received: 30 June 2022 / Revised: 5 September 2022 / Accepted: 14 September 2022 / Published: 22 September 2022
(This article belongs to the Special Issue Long-Term Monitoring of Forest Biodiversity and Dynamics in China)

Abstract

:
Vertical stratification in trees may respond to selective pressures to enhance light interception and utilization; therefore, the vertical functional variation in leaf traits may indicate niche partitioning within forests. In this study, vertical variations in leaf and crown structure traits of seven common tree species were analysed with respect to differences between species in different height groups, within the same height range, in the same species across tree height, and different parts of the individual tree crown to reveal coexistence mechanisms in subtropical forest tree species. There were multiple levels of trait variation in the vertical dimension, validating the existence of vertical niche differentiation in subtropical forest species. The functional trait differences arose among different height groups, among species co-occurring within the same height range, in the same species across tree height, and among different parts of the individual tree crown. Variation in comparative advantages, which was characterised by those traits between species across different height ranges, was also one of the manifestations of niche differentiation in the vertical dimension. Moreover, contrasting results between lower height ranges and higher ranges in the relationship between species’ differences in functional traits and species’ difference of abundance were found, further confirming that there was obvious vertical niche separation in the community. This study emphasised the importance of vertical variation in species’ performances in elucidating the mechanisms of tree species coexistence in subtropical forests.

1. Introduction

The mechanisms of species coexistence have long been a research hotspot in community ecology. Classical ecological theory states that stable coexistence between competing species requires them to occupy different niches. Competing species will diverge, leading to a reduction in niche overlap. However, high levels of species diversity in tropical and sub-tropical forests cannot always be explained by variations in species’ characteristics, indicating that there may be niche differences between plants that have been overlooked [1]. Coincidentally, characteristics related to patterns of aboveground vertical variation in species’ performances have been less frequently explored. Although several researchers have proposed that functional trait variation in the vertical dimension can help elucidate the mechanisms underlying species coexistence in communities [2,3,4,5], more research is needed to explore the significance of aboveground vertical differentiation to achieve a deeper understanding of community assembly rules. The vertical variation of key plant traits in response to limited resources should be especially considered.
Leaf functional traits play an important role in leaf and plant functioning and are associated with species’ strategies of resource acquisition and use [6,7]. Photosynthetic traits and related traits are key features, and their variation is important for the study of species coexistence [8]. Shade tolerance is one of the most important traits for understanding community assembly and forest dynamics [9]. The rate of leaf dark respiration (Rd) is supposed to be a good estimator of the shade tolerance of tree species [10]. Chlorophyll (Chl) fluorescence acts as an indicator of energy conversion of photosynthetic organisms and has been a powerful tool to study photosynthesis performance [11]. The maximum relative electron transport rate (rETRmax), initial slope (α), photoinhibition coefficient (β), and half saturating irradiance (Ik) are Chl fluorescence parameters derived from rapid light curves (RLCs; relative electron transport rate versus photosynthetic photon flux density (PPFD) curve), which reflect the expressed intrinsic capacity of photosynthesis [12]. rETRmax determines the photosynthetic capacity, while α reflects the light utilisation efficiency of the leaf. Assessments of Ik represent the tolerance of the leaf to high light [13]. Leaf dry mass (LDM) is the basic calculation index that represents the physiological activities of plant leaves and an important reference variable to study the competition pattern of forest plant species [7]. Leaf area (LA) reflects the ability of leaves to capture light and perform photosynthesis and is also related to the energy and water balance of leaves [14]. The specific leaf area (SLA) is associated with the leaf economic spectrum and the metabolic and growth rates of the species [7]. Leaf dry matter content (LDMC) is correlated with the average density of the leaf tissue, potential RGR, and water balance of the leaf [15]. Leaf thickness (LT) is associated with photosynthesis and growth rate [16].
Tree crown architecture characteristics are important for the exploitation of the vertical height resource gradient. The crown depth (Dc) of a tree has been associated with the capability for capture and utilisation of light since a deeper crown largely means that the crown covers a more complex light environment and consequently has a higher variability of traits in the vertical dimension, and vice versa. Crown breadth (Bc) and crown volume (Vc) can reflect the pattern of competition for space between a tree and its neighbours. Bc and Vc are also closely related to the total number of leaves in a tree and thereby the photosynthetic capacity of the tree, which in turn affects the growth level and competition status of the tree in the stand [17,18].
In a vertically well-developed, mature forest, species tend to develop different heights, which is an important manifestation of the spatial segregation of tree crowns along the vertical gradient of resource availability. Species with different heights should be characterised by different survival strategies, and variations in key traits should be found in the vertical direction of the community [19,20]. Moreover, photosynthetic performance plasticity within an individual crown in the vertical dimension is also believed to allow species to diverge along the vertical gradient of light availability within the canopy and contribute to a stable coexistence among neighbours [3,20].
The divergence of comparative advantages between species pairs in different vertical spaces may be an important factor that leads to complementary resource utilisation and subsequently enhanced species coexistence. One species might be found to exhibit superior performance within a specific vertical range, producing a relative advantage over other species, while it might be average or even inferior in performance to other species within another vertical range. Furthermore, intuitive and persuasive evidence to verify the existence of vertical niche differentiation is that species with different strategies prefer different vertical spaces, which was revealed by differences in abundance across different height ranges [21]. Numerous studies have found that the density of tree species differs across environmental gradients [22,23,24]. Nevertheless, few studies have examined the role of vertical variation in the ability to utilise resources in the context of promoting plant coexistence.
To explore the patterns of species coexistence and enrich niche differentiation theory, we aimed to confirm the vertical niche differentiation of tree species in a natural subtropical forest by detecting variation in important leaf traits and crown structure characteristics within the vertical structure of trees. To this end, we examined vertical variation:
  • Between height groups (lower height group (LG), middle height group (MG), and higher height group (HG)) and within the same height range (shrub canopy (1.4–4 m), sub-shrub canopy (4–6.8 m), lower canopy (6.8–11.3 m), middle canopy (11.3–17.4 m), and upper canopy (17.4–27.1 m)) of different species;
  • In the same species across tree height;
  • At different parts of the tree crown (lower part (LP), middle part (MP), and upper part (UP)).
We also present the result of variation in different parts of the tree crown in the five height ranges and in each target species. The differences in traits and abundance of species across the five height ranges were also investigated to determine if there was complementarity among plants in the vertical dimension and if the existence of niche differentiation between species along the vertical gradient was substantiated.

2. Materials and Methods

2.1. Study Site

The study was conducted at a vertical plot in the DHS Biosphere Reserve (112°30′39″–112°33′41″ E, 23 09′21″–23°11′30″ N), which is in Zhaoqing City, Guangdong Province, China. The study area features a typical monsoonal climate with an annual average temperature of 20.9 °C. The annual average relative humidity is 80.3%, and the annual average precipitation is 1972 mm. The vertical plot covers an area of 1.44 ha (120 × 120 m), centred on a 60 m high canopy crane with a 60 m long arm (Figure 1). The 4140 individual plants in the plot that were greater than 1 cm in diameter at breast height comprised 121 woody species, belonging to 50 families and 84 genera. The mean height of trees in the forest was about 5.88 m. The vertical structure of the forest was stratified into five height ranges: shrub canopy (1.4–4 m), sub-shrub canopy (4–6.8 m), lower canopy (6.8–11.3 m), middle canopy (11.3–17.4 m), and upper canopy (17.4–27.1 m). These categories were established according to the results of optimum tree height clustering and correspond to the traditionally defined vertical levels of the forest community. Furthermore, the vertical structure of the canopy of each tree was stratified into three equal parts (from bottom to top: LP, MP, and UP).

2.2. Functional Trait Measurement

Data on three families (Fagaceae, Lauraceae, and Theaceae), including seven species (Castanopsis chinensis (Cach), Castanopsis fissa (Cafi), Cryptocarya concinna (Crco), Cryptocarya chinensis (Crch), Machilus breviflora (Mabr), Machilus chinensis (Mach), and Schima superba (Scsu)), were collected to explore the vertical variation in traits of plants in the study plot (Table 1). As important dominant families in the forest, Fagaceae, Lauraceae, and Theaceae were also the only three families distributed in all five height ranges, with an abundance >10 in each height range, and were among the top 10 largest families in the community (Figure A1 and Figure A2). To fully explore the variation among plants in the vertical dimension, we chose Fagaceae, Lauraceae, and Theaceae as target families. In our study plot, S. superba was the only species in the Theaceae family, and Ca. chinensis and Ca. fissa were the only species in the Fagaceae family. Cryptocarya chinensis, Cr. concinna, M. breviflora, and M. chinensis were 4 of the 12 species in the Lauraceae family in the study plot but accounted for 92.98% of all individuals in the family (Table 1). Since the other eight species in the Lauraceae family were extremely rare (≤13) in the study plot, we excluded them from the study. Furthermore, the seven target species are relatively common, and some are important common species in the community (Table A1), which contributed to their suitability as target species in this study.
The seven target species are evergreen tree species. Castanopsis fissa is a pioneer fast-growing species. Schima superba, Ca. chinensis and M. chinensis are also described as heliophytes. M. breviflora, Cr. chinensis, and Cr. concinna are mesophytes, which are considered more adapted to low light environments. In our study plot, Schima superba grew largely in the middle and upper canopies. Machilus breviflora and Ca. chinensis were relatively evenly distributed throughout the five canopy levels. Machilus chinensis was mainly distributed in the shrub canopy. Castanopsis fissa, Cr. concinna, and Cr. chinensis were most often found in the shrub and sub-shrub canopies (Table 1, Figure A3).
The leaf respiration (Rd) and Chl fluorescence parameters (β, α, rETRmax, Ik) were measured in July and August 2019, the growing season of the subtropical forest. Samples were collected between 09:00 and 16:00 on a sunny day using a lopper where the height was ≤3 m and a canopy crane where the height was >3 m. Ten individuals were randomly sampled for each target species as far as possible, taking practical considerations into account, since at least a 1.5 × 1.5 m canopy gap (or horizontal space with relatively sparse branches and leaves) was needed for the crane to descend into the canopy interior.
One healthy branch with at least three healthy, current-season-growth leaves was cut as a sample branch for each part of the tree crown, for each target stem. Several samples were lacking due to a shortage of eligible leaves or a lack of accessibility (Table A2). Sample branches were inserted in water as soon as they were cut from the trees to maintain the cut below the surface, and these branches were then immediately pruned obliquely below the water surface. The seven target species were separated into three different height groups according to their tree height and distribution in different height ranges (Table A2 and Figure A3). Machilus chinensis and Ca. fissa were classified into LG species, Cr. concinna and Cr. chinensis were categorised as MG species, and S. superba, M. breviflora, and Ca. chinensis were considered HG species.
Three healthy, current-season growth leaves from each sample branch were selected to measure Chl fluorescence parameters. RLCs were recorded for fluorescence using the PAM-2500 Chl fluorescence analyzer (Walz GmbH, Effeltrich, Germany) with the pre-installed software routine for light curve plotting to obtain the sequence for 0–3000 μmol m−2 s−1 PPFD for each target leaf. The intensity of the actinic light was automatically increased every 30 s in eight steps. RLCs were fitted according to the statistical models proposed by Platt et al. [25]. With rETR fitted vs. PPFD, the cardinal points were determined: rETRmax (μmol electrons m−2 s−1), α, β, and Ik (μmol m−2 s−1). Ik was calculated as follows:
I k = r E T R m a x α ,
The same three leaves were used to measure Rd after the measurement of Chl fluorescence traits.
Rd (μmol m−2 s−1) was measured for each target leaf three times using a portable photosynthetic system (LI-6400; LI-COR, Lincoln, NE, USA). The CO2 concentration in the sample room was set to 400 mmol m−2 s1 by the CO2 control module (6400-01 CO2 Mixer; LI-COR, Lincoln, NE, USA). Leaf temperature was set to 25 °C, and relative humidity was set to 75–85%. Rd is defined as the photosynthesis rate when no light resource is available; therefore, the PPFD was set to 0 mmol m−2 s−1 with a red–blue light resource module (6400-02B LED Light Source; LI-COR, Lincoln, NE, USA). Before each measurement, 2–3 min was allocated for the target leaf to reach a stable photosynthetic state. Each target leaf was adapted in a darkroom for at least 120 min immediately before Rd was measured. In this study, only Rd and Chl fluorescence traits were assessed to examine vertical variation at different parts of the tree crown.
Dc, Bc, Vc, LA, SLA, LDMC, and LT were measured from September to October 2014. These traits were measured for each individual of the seven target species. We only selected data from the tree used to measure Rd and Chl fluorescence parameters in 2019. Six healthy, intact, and mature leaves were randomly chosen in each sample individual for measuring LA, SLA, LDMC, and LT. The measuring method was based on the standard method used in Cornelissen et al. [14]. Each sample lamina (without petiole) was scanned (by CanoScan LiDE 700F, Beijing, China), and then LA (cm2) was measured by ImageJ (ImageJ 1.43u National Institute of Mental Health, Bethesda, MD, USA). LT (mm) was measured with a micrometre, avoiding the main and large secondary vein. Leaves were then oven-dried at 60 °C for at least 72 h, and their dry weight (mg) was determined. The fresh weight (g) of leaves was measured before measuring dry weight. From these measurements, values of SLA (cm2 g−1) and LDMC (mg g−1) were calculated. Tree height (m), height to crown base (m), and Bc (m) were measured by tapeline, with the help of the crane for measuring high trees. Dc (m) was the difference between tree height and height to the crown of each tree. The estimation formula used for Vc (m3) was as follows:
V c = π ( B c 2 ) 2 × D c ,

2.3. Statistical Analyses

We first assessed if the target functional traits and tree height are related to phylogeny with Blomberg’s K and found that there was no significant phylogenetic signal in all of the traits in the seven target species in our study (Table 2). Then, tree height and trait differences among species height groups were tested by one-way analysis of variance (ANOVA). ANOVA was also used to test the interspecific variability of each trait and intra-specific variability across the tree height and part of the tree crown of each trait. Moreover, species differences in traits in the five different height ranges were tested by ANOVA. Differences in traits among different parts of tree crown for all target species, among different parts of the tree crown within each species, and among different parts of the tree crown within five different height ranges were also tested by ANOVA. Then, Tukey’s test was used to determine which pairs differed if there was a significant difference found in ANOVA. The relationship between tree height and functional traits was tested using Spearman’s rank correlation test. The Spearman’s rank correlation test was used to assess associations between species’ differences in functional traits and differences of abundance in the five height ranges. The difference in functional traits was expressed as the difference between the values of traits between target species. The difference in abundance was the difference in abundance between target species in the specific height range. A total of 70 target trees were involved, with 600 leaves samples for Rd data measurement and 591 leaves samples for Chl fluorescence parameter measurement in this study. For the other traits, 402 samples involving 67 individuals were measured (Tables S1–S4 in Supplementary materials). All analyses were implemented using R software [26].

3. Results

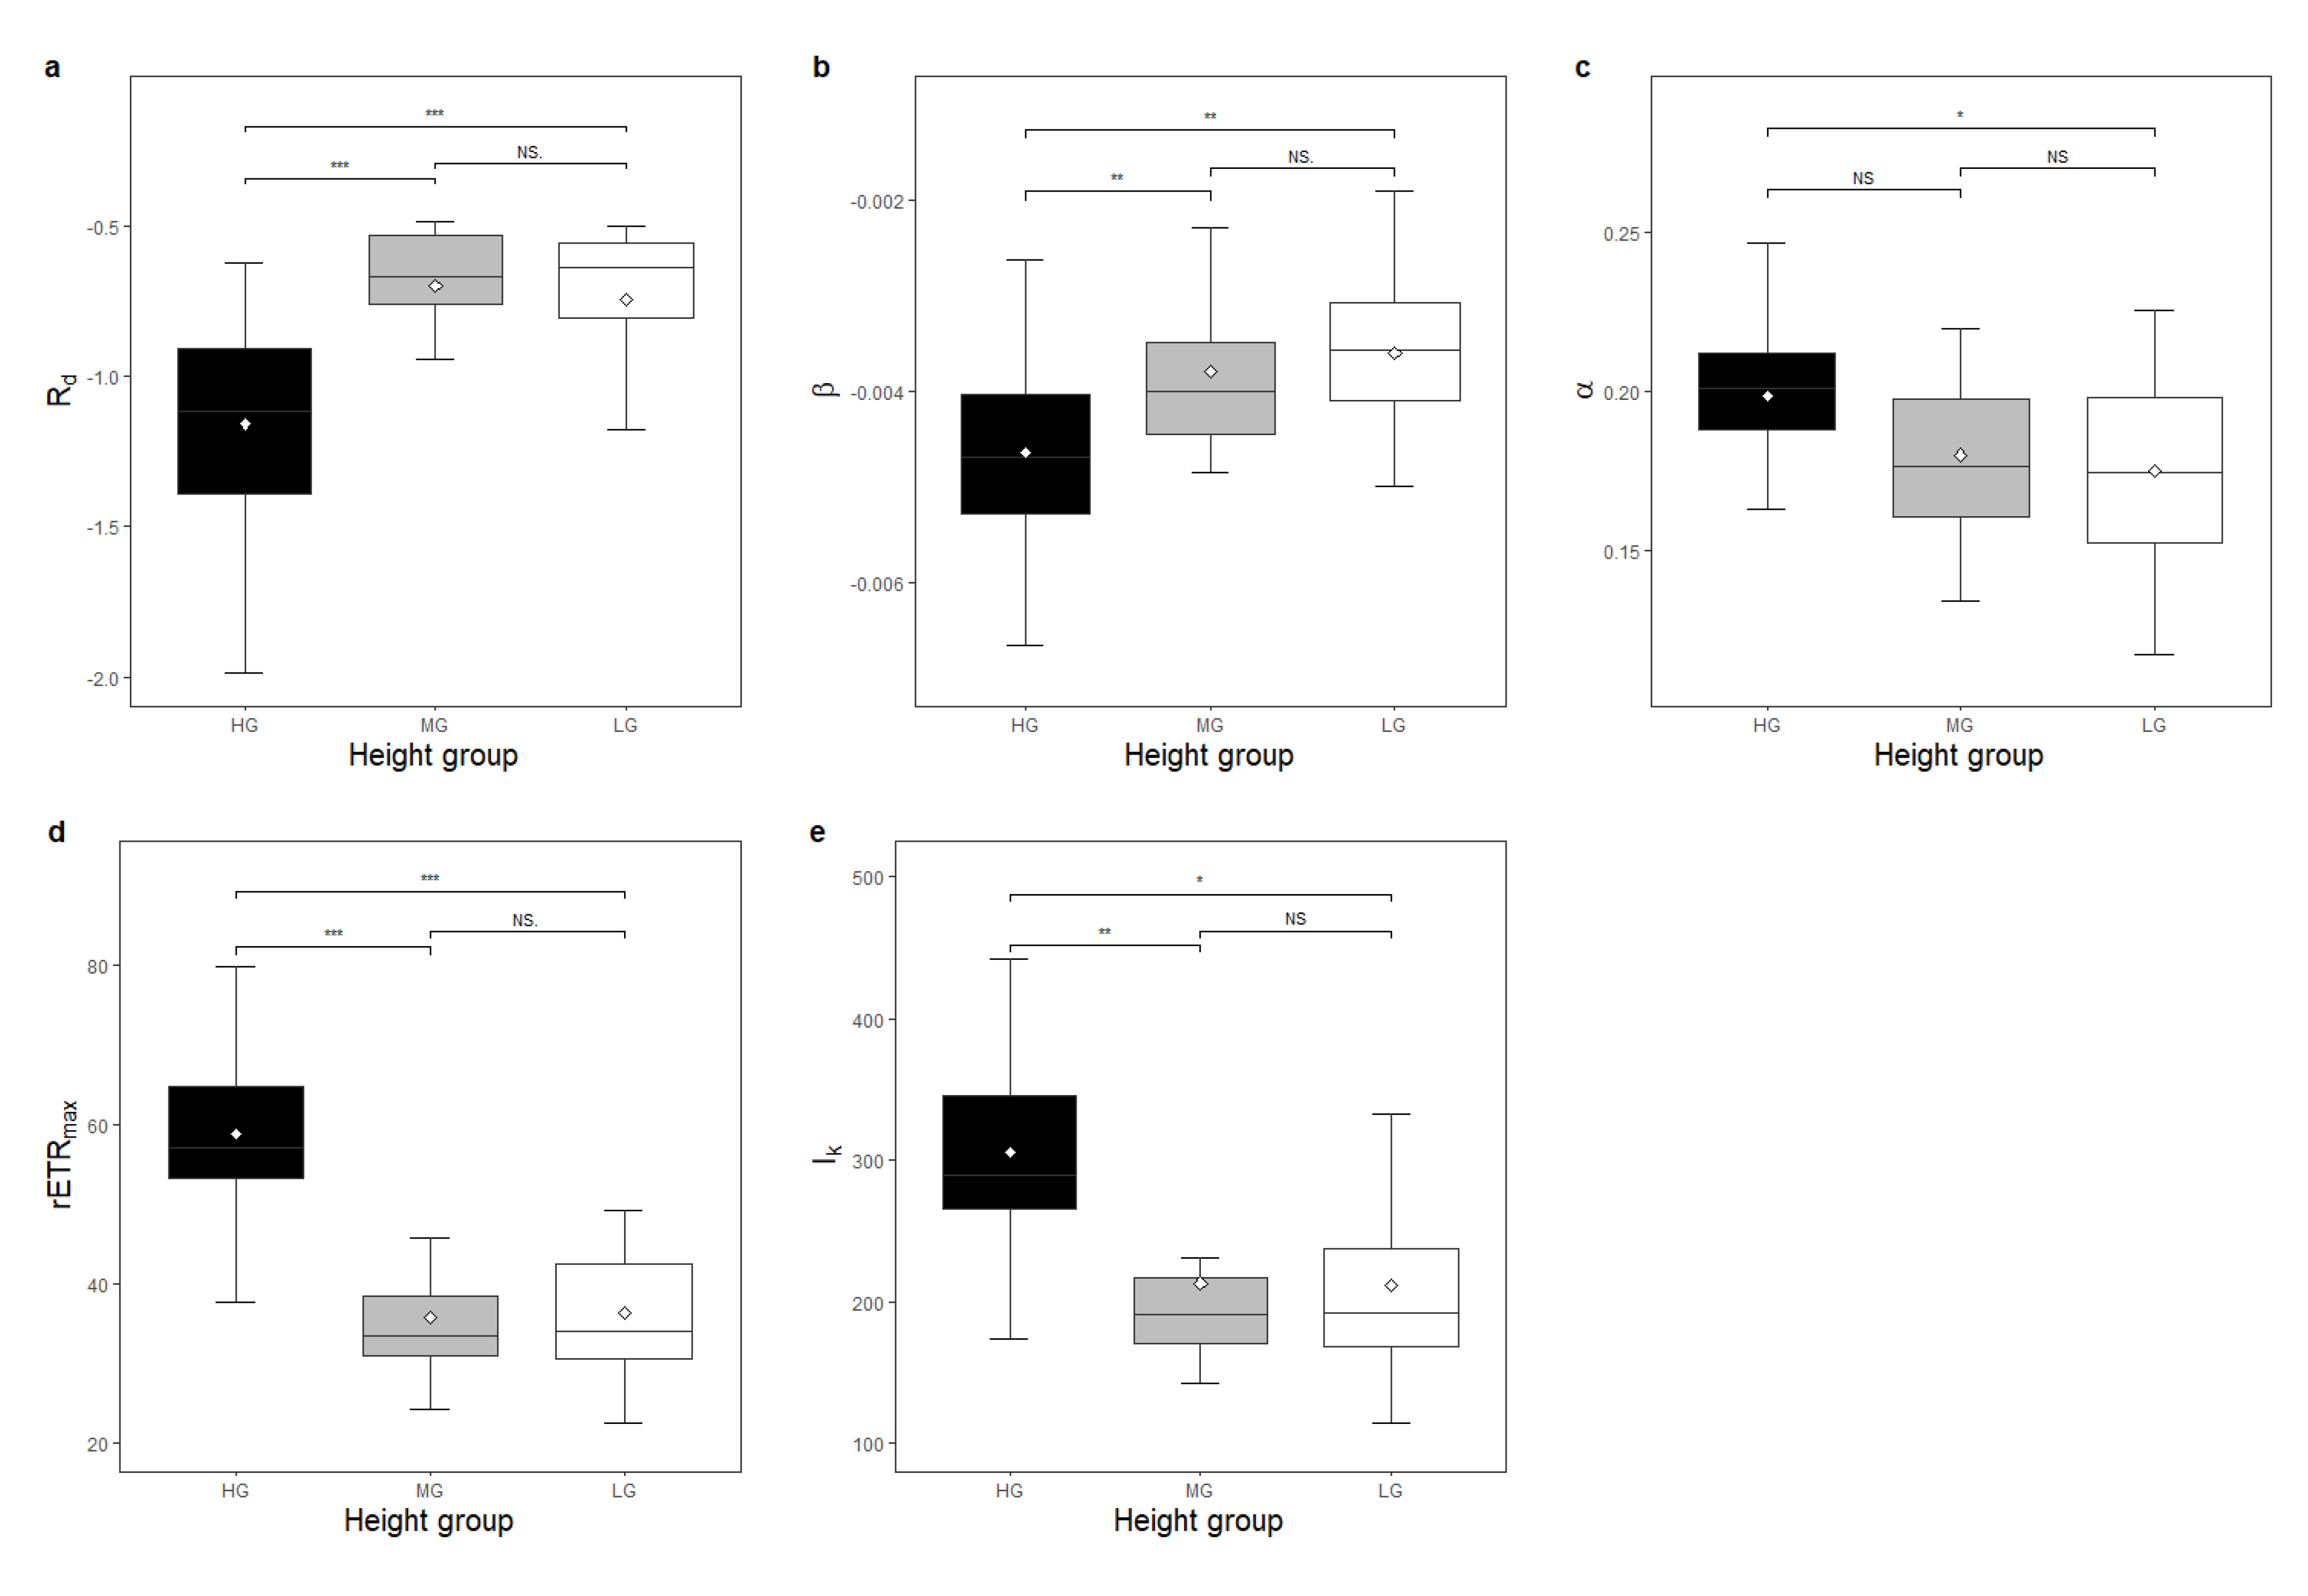
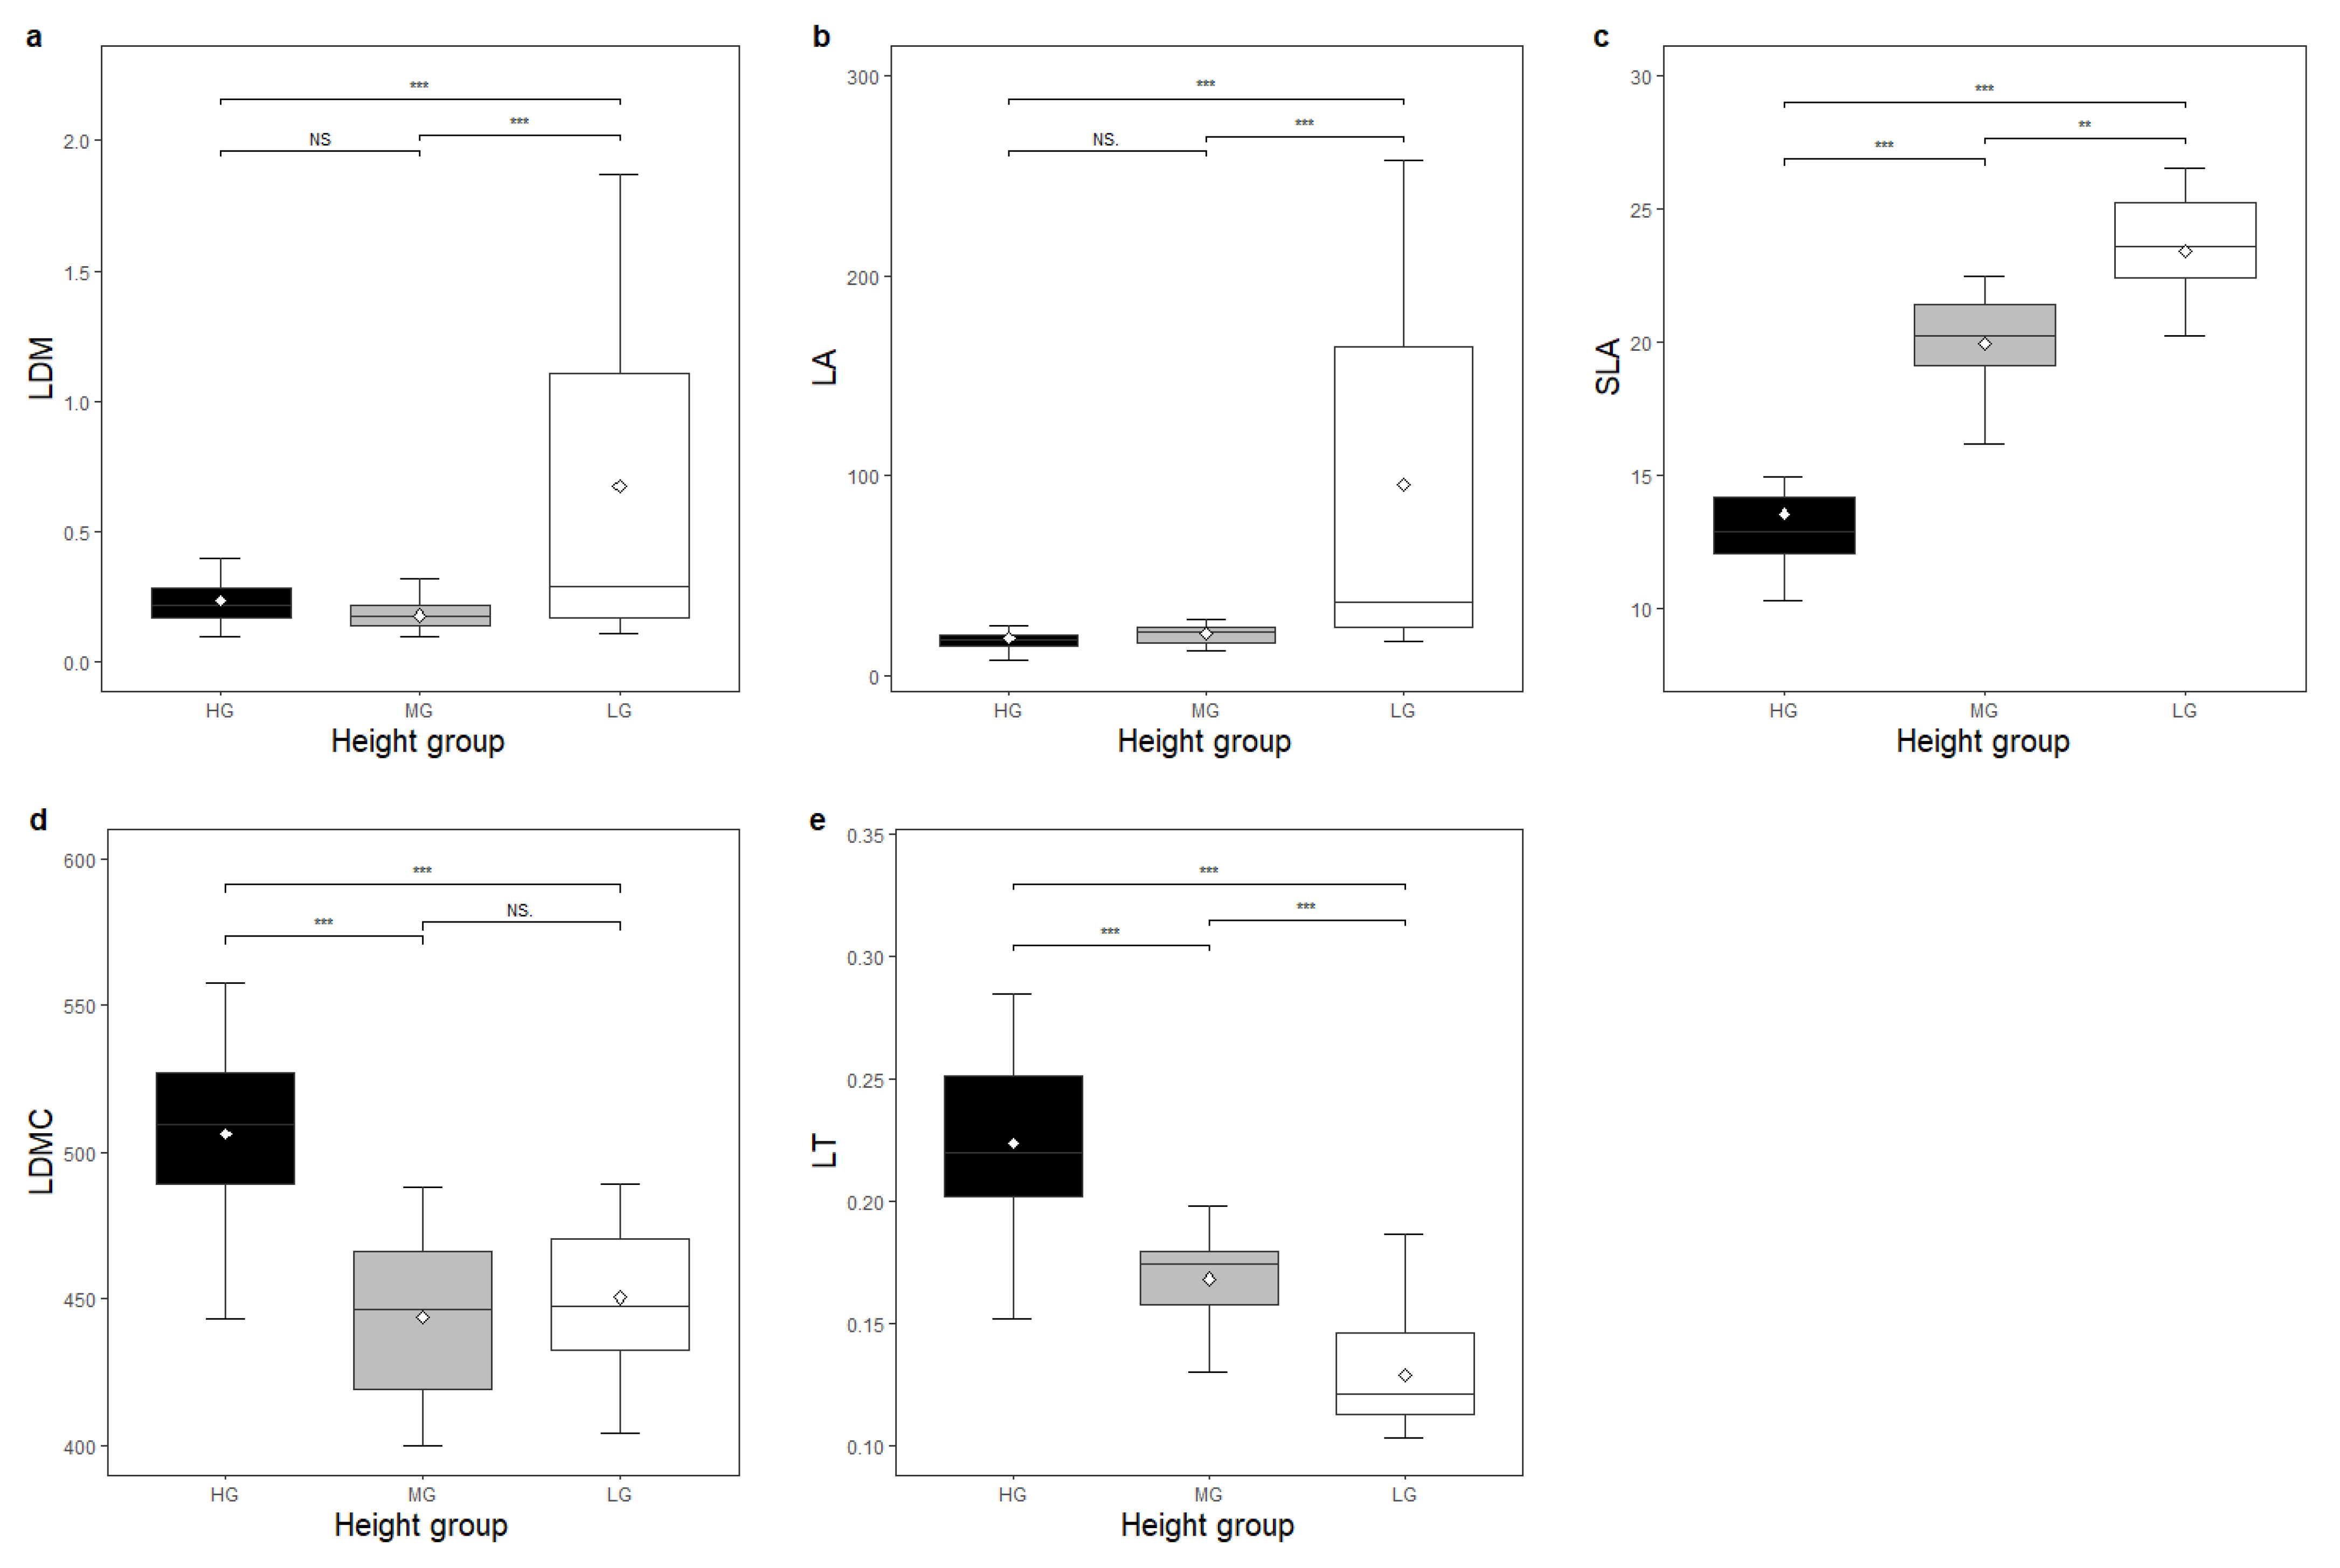
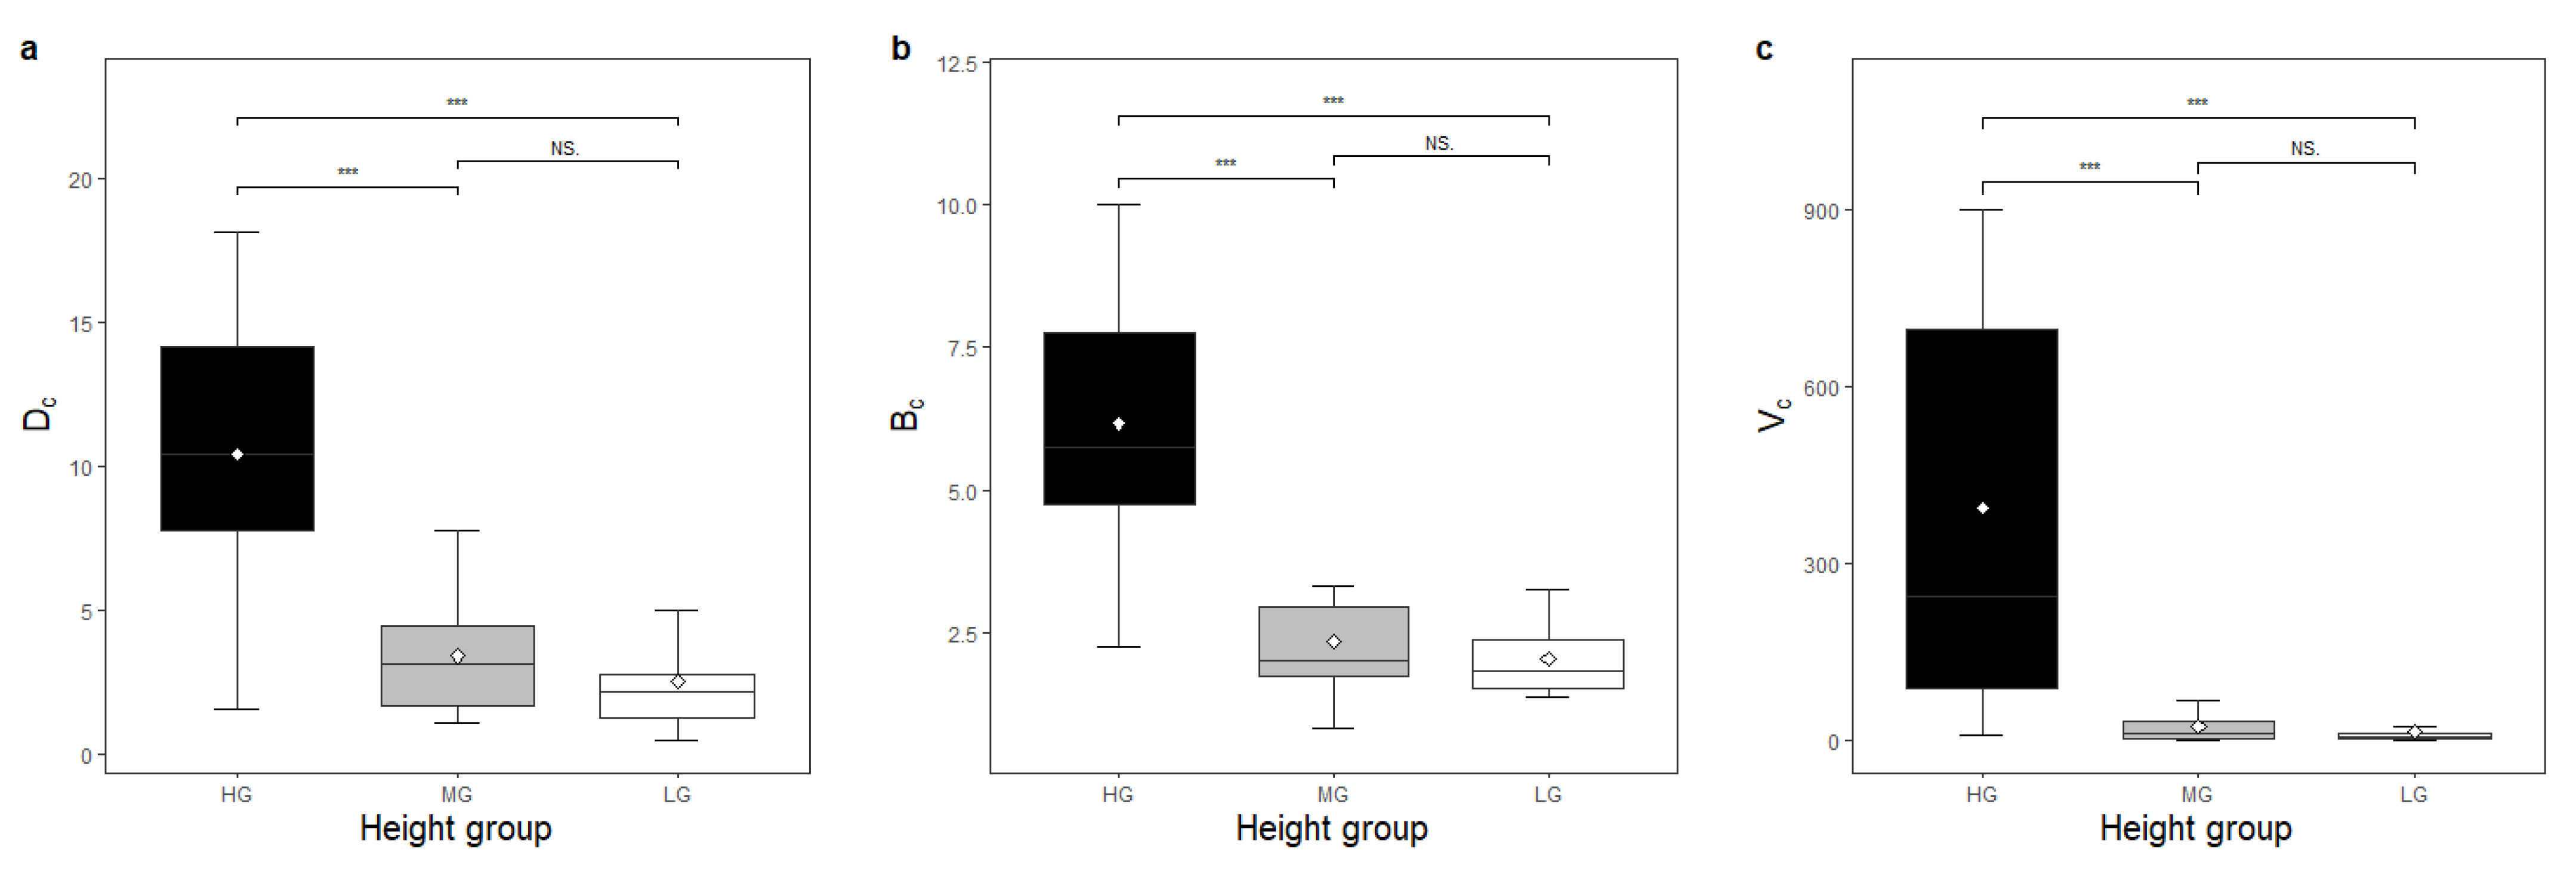
Functional traits showed significant differences between species height groups (Table A3, Figure 2, Figure 3 and Figure 4). The Rd, LDM, LA, SLA, and β of LG species was significantly higher than that of species in HG (Figure 2a,b and Figure 3a–c). The Rd, SLA, and β of MG species was significantly higher than that of HG species (Figure 2a,b and Figure 3c). The LDM, LA, and SLA of LG species was significantly higher than that of MG species (Figure 3a–c). The α, rETRmax, Ik, LDMC, LT, Dc, Bc, and Vc of LG species was lower than that of species in HG (Figure 2c–e, Figure 3d,e and Figure 4). The rETRmax, Ik, LDMC, LT, Dc, Bc, and Vc of MG species was lower than that of HG species (Figure 2d,e, Figure 3d,e and Figure 4). The LT of LG species was lower than that of MG species (Figure 3e). Tree height showed significant differences in each combination of height groups (p < 0.05). Rd, LDM, LA, SLA, and β were negatively related to tree height, while rETRmax, Ik, LDMC, LT, Dc, Bc, and Vc were positively related to tree height (p < 0.05).
For species pairs co-existing in the same height range, species differences in traits were not consistent across different height ranges (Table A3 and Table A4). For instance, the SLA and Dc of Cr. chinensis was only lower than that of Ca. fissa in the shrub canopy, and the LT of Cr. chinensis was higher than that of Ca. fissa in the shrub and sub-shrub canopies but not in the lower canopy. The LT of Cr. concinna was higher than that of Ca. fissa in the sub-shrub canopy but not in the other height ranges. Cryptocarya concinna had a significantly lower β than Cr. chinensis in the lower canopy. Machilus breviflora had a lower Rd and LDM than Ca. chinensis in the upper canopy. The LDM and LT of S. superba was only lower than that of Ca. chinensis in the upper canopy. Schima superba had a significantly higher Rd, LDM, LA, and α than that of M. breviflora in the upper canopy but not in the middle canopy. The β of M. breviflora was significantly lower than that of Cr. chinensis in the lower canopy. Machilus chinensis only had a higher SLA and lower LT than Cr. chinensis in the shrub canopy (Table A4).
Intra-specific variabilities across tree height were found in our study (Table A5). There were intra-specific variations in at least one trait for each species. Castanopsis fissa, Cr. chinensis and M. chinensis showed intra-specific variations in relative more traits.
Species differences in rETRmax, Ik, LDMC, LT, Dc, Bc, and Vc were positively related with differences in species abundance in higher height ranges (mainly in the middle and upper canopies) but inversely associated with differences in abundance in lower ranges (in the shrub and sub-shrub canopies) (Table 3). Species differences in SLA and β showed a positive correlation with species differences in abundance in lower height ranges and a negative correlation with species differences in abundance in higher ranges. Species differences in Rd were positively correlated with species differences in abundance in the shrub and sub-shrub canopies.
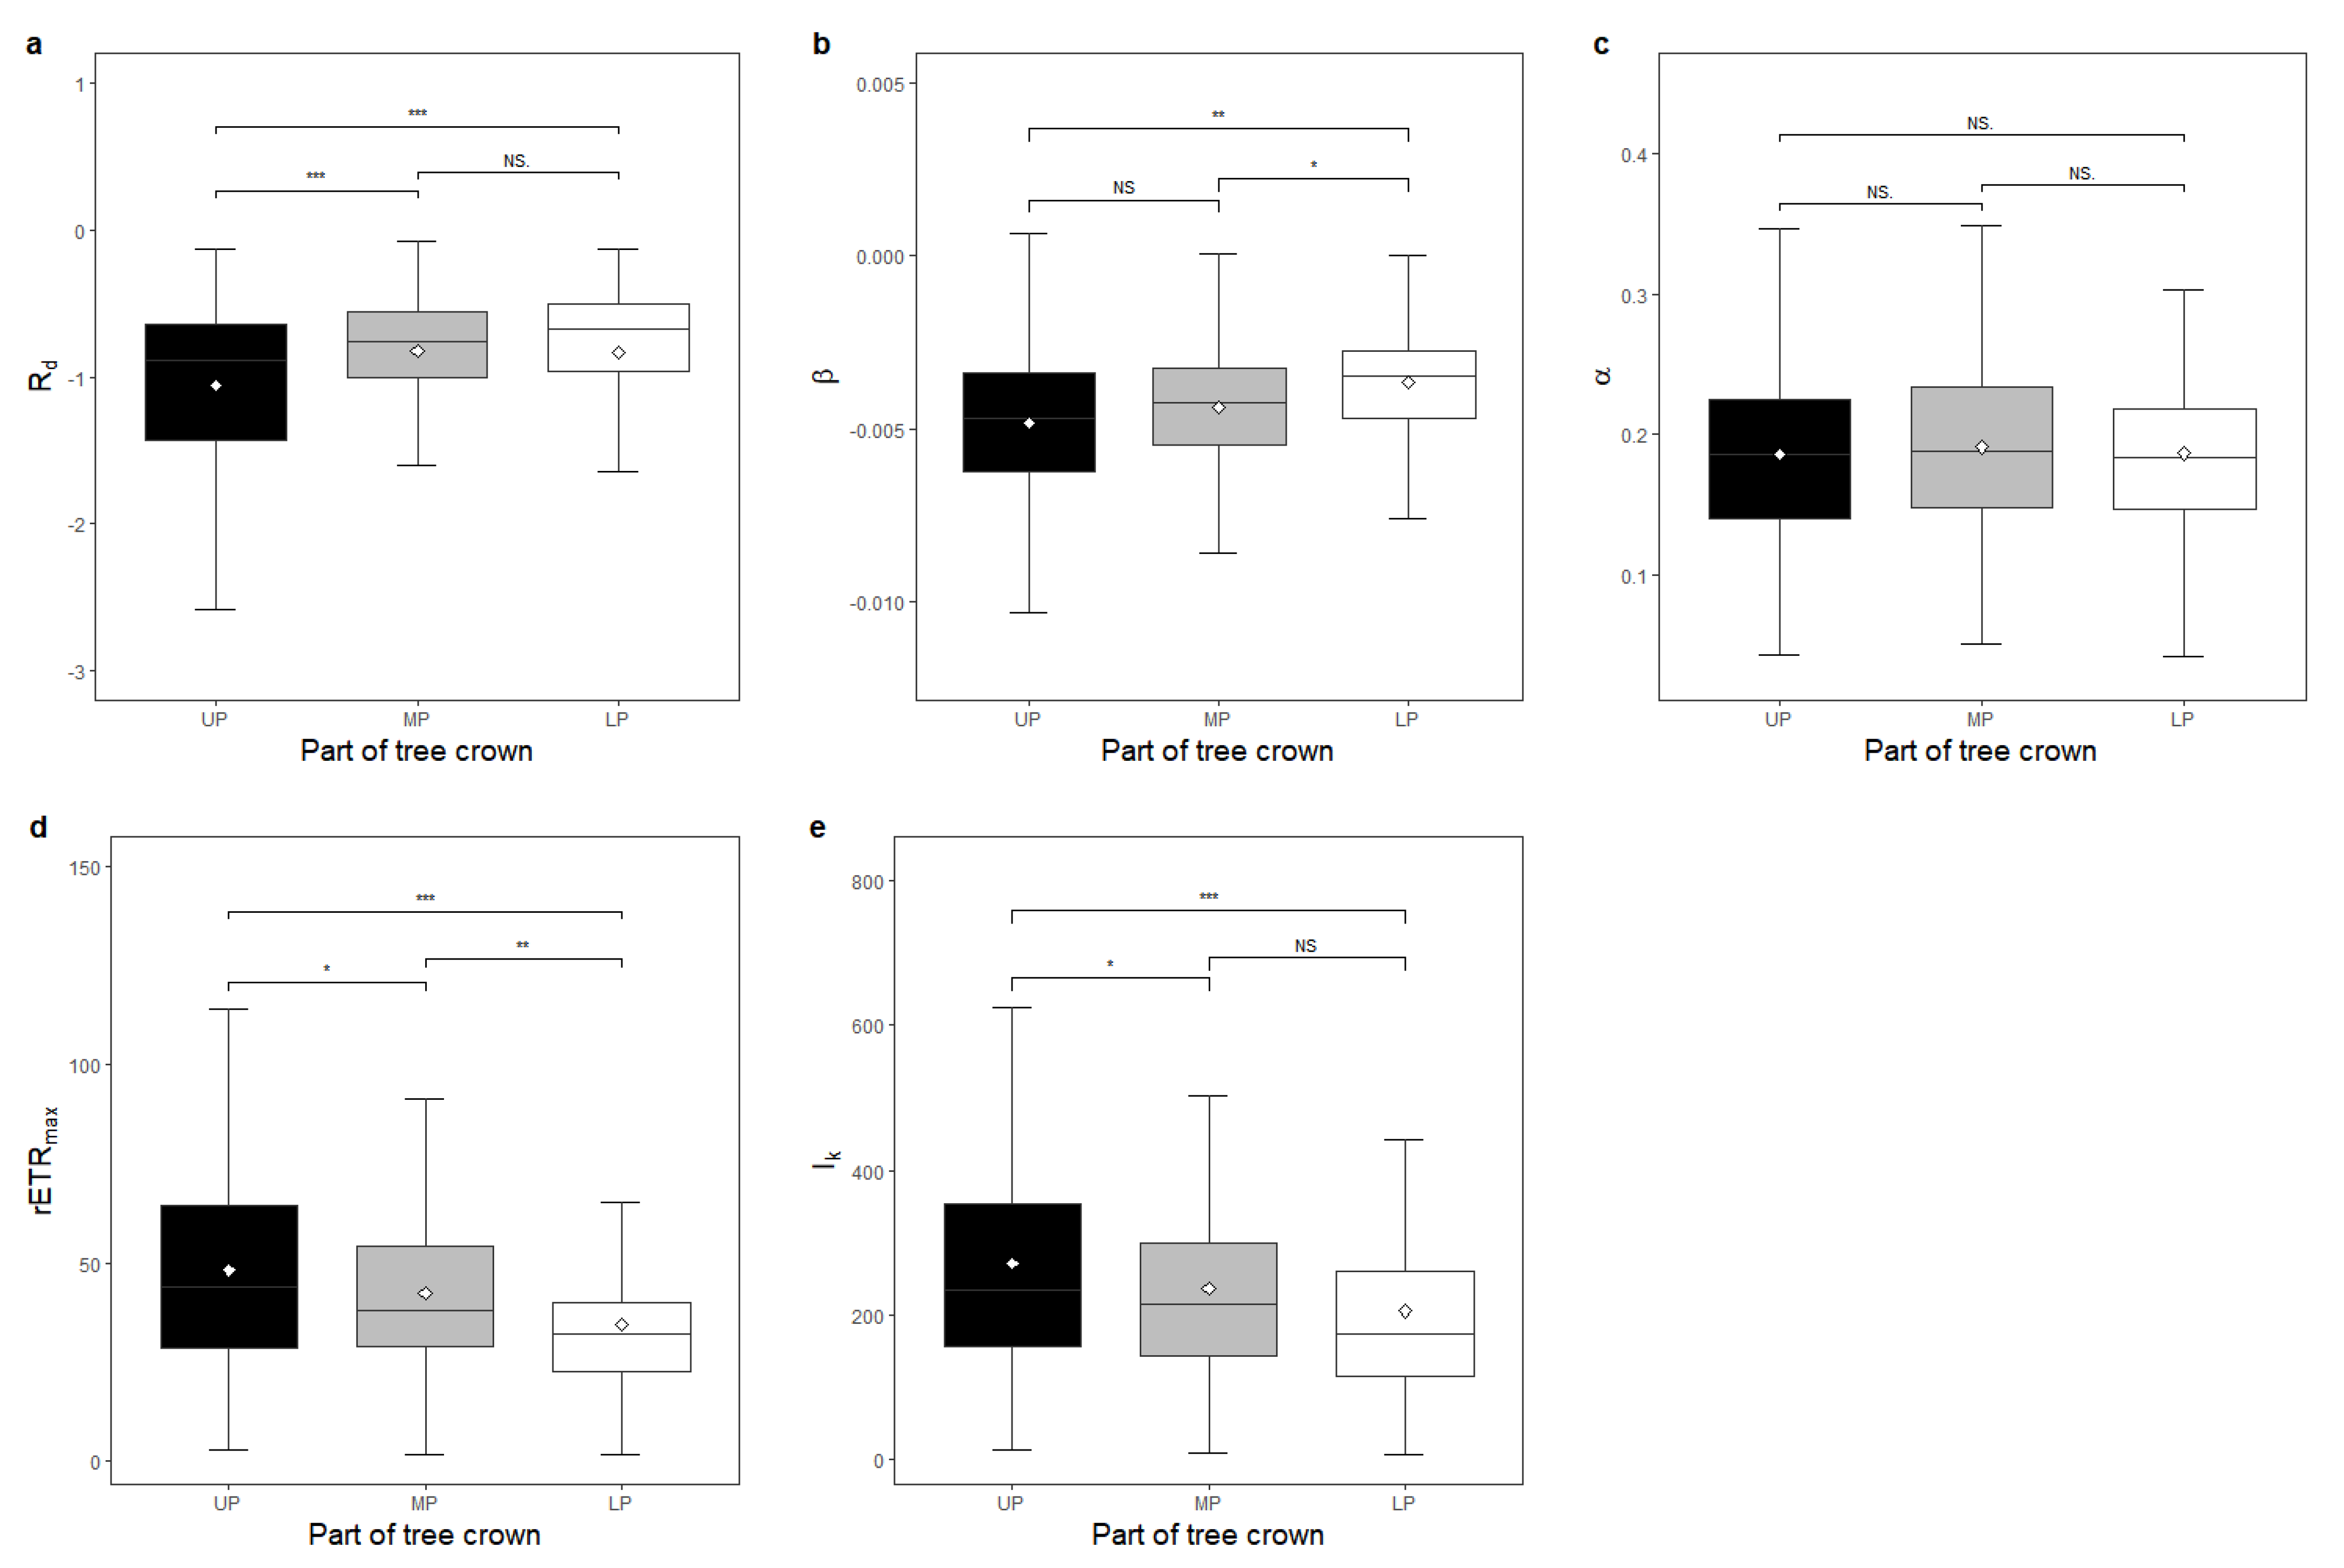
The results regarding different parts of the tree crown for all species are shown in Table A6 and Figure 5. The β of LP was significantly higher than that of MP (Figure 5b), while rETRmax showed the opposite trend (Figure 5d). The Rd and β of LP was higher than that of UP (Figure 5a,b), but rETRmax and Ik showed the opposite trend (Figure 5d,e). The Rd of MP was higher than that of UP (Figure 5a), but rETRmax and Ik showed the opposite trend (Figure 5d,e).
With respect to individual species, significant differences of Rd between different parts of the tree crown were found in Ca. chinensis, Cr. Concinna, and S. superba (Table A6). Differences in rETRmax were observed in Ca. chinensis and S. superba. Differences in β were found in Ca. chinensis and M. chinensis. The difference in α was found in M. breviflora, while differences in Ik were found in Ca. chinensis (Table A6).
For each height range scenario, a difference in Rd between parts of the tree crown appeared in the sub-shrub, middle, and upper canopies of the forest. Differences in β were observed in the lower and middle canopies. Differences in rETRmax were found in the shrub, middle, and upper canopies. Differences in Ik were found in the shrub and upper canopies (Table A7). Intraspecific variabilities of photosynthetic traits were found among different parts of crown in all target species except Ca. fissa and Cr. Chinensis (Table A8).

4. Discussion

The main results of the present study support the hypothesis that there is vertical niche differentiation among tree species in subtropical forests. Significant differences in functional traits between different height groups (Table A3, Figure 2) confirmed the existence of niche differentiation in the vertical dimension of the forest. In the present study, the Rd of HG species was found to be significantly lower than that of LG and MG species (Figure 2a), demonstrating that there was significant vertical variation in shade tolerance among the species in these groups, as Rd is often used as a reliable surrogate measuring tree species’ shade tolerance [10]. Species occupying the top layer of the forest canopy tended to be less shade tolerant compared to species at lower strata, which was consistent with previous studies [5,23]). The conclusion was further confirmed by the result that Rd was negatively related to tree height in the present study. Species gain competitive advantages through prior access to light by being taller than their neighbours, which requires more investment in non-productive structures and physiological activity that sustains essential consumption [27], also resulting in a lower Rd.
The species in the lower height group had a higher LDM, LA, SLA, and β than those in the higher group, but a lower α, rETRmax, Ik, LDMC, LT, Dc, Bc, and Vc (Figure 2, Figure 3 and Figure 4). The relationship between these traits and tree height supported these results. This confirmed that leaves were larger in species occupying habitats with low light. Larger leaves are conducive for adapting to low-light conditions by increasing light interception. Moreover, the pattern that low-light species have larger leaves and high-light species have smaller leaves satisfied the demand for increasing the efficiency of water utilisation, which was the ratio of CO2 uptake to water loss, ensuring the leaf energy and water balance in each light environment [14,28]. As a mass-based area of the leaf, SLA was more sensitive to showing differences between different height groups (Figure 3c). Numerous studies have found that SLA decreases from the bottom of the canopy to its top [29,30,31]. These variations are considered either an adaptation to a varying light environment, allowing the optimisation of carbon gains, or as a result of increased leaf water stress [32]. Moreover, species at higher height ranges had thicker and denser leaves, regardless of the leaf area (Figure 3e,d), which may also contribute to resisting low water availability and maintaining a higher modulus of elasticity and greater resistance to cell wall collapse under extreme water deficit conditions [33].
Leaves in HG species had a higher intrinsic capacity of photosynthesis, capacity of high-light tolerance, photochemical reaction initiation rate, and light utilisation efficiency than in MG and LG species (Figure 2c–e). These results were consistent with previous studies [34,35]. In contrast to our expectation, the β of HG species was lower than that of LG and MG, demonstrating that HG species were more likely to decrease their photosynthetic potential when light intensity exceeded their saturation point than those at a lower height. One possible explanation for this paradox could be that in different light intensity ranges, the effect of the same amount of light intensity increases in the two groups of plants was not equal. Photoinhibition occurred at a higher light intensity level in HG species than in the other groups of species (Figure 2e), and the light intensity that triggered photoinhibition in HG species was closer to the threshold for the plant to cease physiological activities. An increase in excess light of one unit in the high-light range is more potentially harmful to plants than that in the low-light range, and it will inevitably cause more intense adverse factors to the HG species. As a result, HG species have evolved more rapid responses to adapt to excess light and to protect plant tissues (or have simply suffered damage due to exposure to excess high light), resulting in a rapid decline in photosynthetic function.
HG species tend to have a larger crown size than LG and MG species, either in crown depth, breadth, or crown volume (Figure 4). It is quite conceivable that tall trees have a larger respiration load, and they could compensate for this by making larger and deeper crowns with a larger amount of photosynthesising leaf area. Compared to a larger LA and SLA in shorter species, a larger tree crown in HG species is likely an alternative to ensure sufficient area to capture enough light energy since the size of the tree crown is closely related to the total number of leaves on a tree [17,18]. The photosynthetic capacity of the tree in HG and, consequently, the growth level and competition status of the tree in the stand can be ensured.
For species pairs in which tree crowns coexist in the same height range, trait differences between them were not consistent across different height groups (Table A3 and Table A4 ). Some significant differences in traits between species were only found in particular height ranges, even though those species grew together in multiple height ranges. For example, significant differences in SLA and Dc between Cr. chinensis and Ca. fissa were found only in the shrub canopy, while no significant difference between these species was found in the sub-shrub and lower canopies, although the crowns of both species were present in the shrub, sub-shrub, and lower canopies. Significant differences in Rd, LDM, LA, and α between S. superba and M. breviflora were only shown in the upper canopy, although the crowns of both species occurred in the middle and upper canopies (Table A4). These results demonstrated that some species performed better or worse than their competitors in specific height ranges in certain abilities, while showing no significant difference from their competitors in other height ranges, thereby demonstrating that there was variation in comparative advantages between species across different height ranges. For example, Ca. fissa was superior in terms of enlarging the light-capturing area by increasing the area of each blade per mass and the total light-exposed area of the crown in the vertical dimension, which manifested as a larger SLA and Dc, than Cr. chinensis in the shrub canopy. However, the SLA and Dc between the two species were not different in the sub-shrub and lower canopies, which generally had a higher light level than the shrub canopy. This suggested that Ca. fissa was more adaptive to a relative low-light environment and more competitive at a lower height range than Cr. chinensis. Although it has rarely been considered as the object of research regarding niche segregation, this kind of variation is an important factor that leads to complementary resource use, subsequently enhancing species coexistence. It also suggests that an imprecise or even misleading conclusion might be proposed without considering the vertical variation when comparing species differences.
Trait differences were also found in the same species across tree height (Table A5). At least one trait was found with intra-specific variability for each species. It is understandable that as trees grow taller, the life history of species varies, and the environment to which they respond changes, and with that comes variation in traits. The results that Rd, LDM, LA, SLA, and β were negatively related to tree height while rETRmax, Ik, LDMC, LT, Dc, Bc, and Vc were positively related to tree height show the general trend of trait variation of all species as tree height varies. For certain species, however, it varies according to the ecological strategies of the species. For instance, intra-specific variances of crown breadth were not found in Ca. chinensis, Ca. fissa, Cr. concinna, and M. breviflora in the study. It is interesting that there were more traits that showed intra-specific variations in Ca. fissa, Cr. chinensis, and M. chinensis, which were all mainly distributed in the shrub and sub-shrub canopy in our study plot. This can be coupled with the fact that traits with intra-specific variability of these species were closely related to the acquisition of light resources. This may, therefore, hint at strong intraspecific competition for light resources in these species in the low-light environment. On the other hand, intraspecific variabilities of traits were also shown among different parts of crown (Table A8), indicating that the vertical structure of a tree also contributes to the vertical niche differentiation of the plant.
Contrasting results between lower height ranges and higher ranges in the relationship between species’ differences in functional traits and species difference of abundance (Table 3) demonstrated that there was obvious vertical niche separation between species in the community. Species with a stronger shade tolerance, leaf light-capturing efficiency, and a lower leaf photosynthetic capability, high-light tolerance, leaf dry matter content, leaf thickness, and crown size were more abundant in lower height ranges, and vice versa.
Variations in functional traits were also found in different positions within the crown of each tree in the vertical dimension (Table A6). Shade tolerance in the top part of the tree was lower than that in the interior overall (Figure 5a). This result revealed that the top layer of the crown featured a weaker ability to endure a low-light environment. Meanwhile, the UP had greater capacity to handle high-light conditions (Figure 5e) and a higher photosynthetic potential (Figure 5d). Leaves in LP had a higher β than those of MP and UP, demonstrating a smaller rate of decline in the photosynthetic capacity when the light intensity exceeded its saturation point, which might be due to the increase by the same unit of light in the relatively lower light range being less destructive. Consistent with previous research [36,37], our results confirmed that photosynthetic performance in different parts of the crown differed across the vertical dimension.
A more detailed analysis showed that Ca. chinensis and S. superba were more responsible for functional trait variations between parts of the tree crown in all species scenarios since most of the differences in shade tolerance and photosynthetic capacity between parts of the tree crown were found in these species (Table A6 and Table A8). In the study plot, S. superba, and Ca. chinensis were common species, as the 4th and 17th most abundant of all species, respectively. The vertical variation in shade tolerance and photosynthetic potential within an individual crown may have contributed to the dominance of these species in the light-limited community. In each height range scenario, variations in photosynthetic characteristics mostly occurred in the middle and upper canopies of the forest (Table A7). Differences in traits among parts of the tree crown preformed differently across height ranges, indicating that a change in perspective is required when interpreting niche differentiation patterns between species, and changes in canopy height layer should be considered.

5. Conclusions

Our results confirmed that there were vertical differences in important functional traits, not only between species in different height groups but also between species co-occurring within a height range, and in the same species across tree height, which lends support to the existence of niche differentiation in the vertical dimension among subtropical forest species. Moreover, variation in comparative advantages between species across different height ranges was also one of the manifestations of vertical niche differentiation between species. Contrasting results between lower height ranges and higher ranges in the relationship between species’ differences in functional traits and species difference of abundance further confirmed that there was vertical niche separation between species in the community. Differentiation in photosynthetic characteristics also arose among parts of individual tree crowns, confirming that the vertical structure of a tree also provided a source of variation in species performance and can contribute to the occupancy of a species in a light-limited community. Therefore, vertical variation in species performance, especially for studies involving different layers of the forest canopy, should not be overlooked while exploring the mechanisms underlying tree species coexistence in forest communities. The vertical structure of the forest supplies more potential information than expected.

Supplementary Materials

The following supporting information can be downloaded at: https://www.mdpi.com/article/10.3390/f13101548/s1, Table S1: Functional traits data; Table S2: Rd data; Table S3: Chlorophyll fluorescence parameters data; Table S4: Species abundance in five height ranges.

Author Contributions

J.F., W.Y. and J.L. conceived the ideas and designed methodology; J.F., Q.M. and H.C. collected the data; J.F. analysed the data; J.F. led the writing of the manuscript. All authors have read and agreed to the published version of the manuscript.

Funding

This study was supported by the Strategic Priority Research Program of the Chinese Academy of Sciences (XDB31030000), Key Special Project for Introduced Talents Team of Southern Marine Science and Engineering Guangdong Laboratory (Guangzhou) (GML2019ZD0408), the National Key R&D Program of China (grant No. 2017YFC0505802), and Chinese Forest Biodiversity Monitoring Network.

Data Availability Statement

Acknowledgments

We are grateful to Yuying Zhou, Yunlong Ni, Wenhua Wu, and Yang Yu for their assistance with fieldwork. The constructive comments from Yi Zheng improved the study.

Conflicts of Interest

No potential conflict of interest was reported by the authors.

Appendix A

Figure A1. Proportion of different families in the study plot. Lauraceae was the largest family, while the Theaceae was the 6th and Fagaceae was the 10th largest family in the community. Target species Cryptocarya chinensis, Cr. concinna, Machilus breviflora, and M. chinensis are members of the Lauraceae family; Schima superba belongs to the Theaceae family; Castanopsis chinensis and Ca. fissa are members of the Fagaceae family.
Forests 13 01548 g0a1
Figure A2. Abundance of each family among the top 10 largest families in different height ranges. Only Lauraceae, Theaceae, and Fagaceae were distributed in all five height ranges, with an abundance >10 in each height range, among the top 10 largest families in the community. The abundance of Lauraceae was 326, 166, 62, 22, and 21 in shrub, sub-shrub, lower, middle, and upper canopies, respectively. The abundance of Theaceae was 13, 26, 55, 101, and 111, respectively, and the abundance of Fagaceae was 44, 51, 24, 32, and 17, respectively. The five height ranges were shrub canopy (1.4–4 m); sub-shrub canopy (4–6.8 m); lower canopy (6.8–11.3 m); middle canopy (11.3–17.4 m); upper canopy (17.4–27.1 m).
Forests 13 01548 g0a2
Figure A3. Proportion of each target species in different height ranges. The five height ranges were shrub canopy (1.4–4 m); sub-shrub canopy (4–6.8 m); lower canopy (6.8–11.3 m); middle canopy (11.3–17.4 m); upper canopy (17.4–27.1 m).
Forests 13 01548 g0a3
Table A1. Abundance of the seven target species.
SpeciesAbundanceProportion (%)Ranking
Machilus chinensis250.5528
Cryptocarya chinensis611.3421
Machilus breviflora721.5819
Castanopsis chinensis881.9317
Castanopsis fissa912.0016
Schima superba3557.814
Cryptocarya concinna4269.371
Abundance: the abundance of each species in the study plot; Proportion (%): the abundance ratio of each species compared to all individuals in the community; Ranking: the position of the species in the rank of abundance size of all species (from the most abundant to the rarest species) in the study plot.
Table A2. Tree height and sample number of the seven target species.
SpeciesHeight (m)n
Castanopsis chinensis15.82 ± 5.0388
Machilus breviflora18.49 ± 7.0785
Schima superba19.66 ± 2.2281
Cryptocarya chinensis5.27 ± 3.1789
Cryptocarya concinna6.27 ± 2.1088
Castanopsis fissa4.29 ± 1.9681
Machilus chinensis3.91 ± 3.4688
Height (m): the mean tree height of species; n: the number of samples.
Table A3. The results of one-way analysis of variance (ANOVA) of functional trait differences among height groups, and results of ANOVA of species differences in functional traits in five different height ranges.
TraitsAmong Height Groups Species Differences in Five Height Ranges
ShrubSub-ShrubLowerMiddleUpper
Rd***NSNSNSNS***
LDM************NS***
LA************NS*
SLA*****NSNSNSNS
β***NSNS*NSNS
α*NSNSNSNS*
rETRmax***NSNSNSNSNS
Ik**NSNSNSNSNS
LDMC***NSNSNSNSNS
LT********NS****
Dc*****NSNSNSNS
Bc***NSNSNSNSNS
Vc***NSNSNSNSNS
The five height ranges were shrub canopy (1.4–4 m); sub-shrub canopy (4–6.8 m); lower canopy (6.8–11.3 m); middle canopy (11.3–17.4 m); upper canopy (17.4–27.1 m). Rd: the rate of leaf dark respiration; LDM: leaf dry mass; LA: leaf area; SLA: specific leaf area; β: photoinhibition coefficient of relative electron transport rate versus photosynthetic photon flux density curve (RLCs); α: initial slope of RLCs; rETRmax: maximum relative electron transport rate; Ik: half saturating irradiance; LDMC: leaf dry matter content; LT: leaf thickness; Dc: crown depth; Bc: crown breadth; Vc: crown volume. *** p < 0.001; ** p < 0.01; * p < 0.05; NS for not significant difference.
Table A4. Species differences in functional traits in the five different height ranges. Species differences in each functional trait were checked using a Tukey test at a 95% family-wise confidence level. Species pairs refer to the pairs of species used for comparison in each height range.
Species PairsHeight RangeRdLDMLASLAβαLTDc
Crch-CafiShrub -0.06 −0.93 ***−146.32 ***−5.13 **1.05 × 10⁻³−6.60 × 10−40.07 ***−1.45 **
Crco-CafiShrub −0.18 −1.00 ***−153.43 ***−3.42 --0.04 −1.20
Mach-CafiShrub −0.28 −0.95 ***−144.56 ***−1.37 −6.94 × 10⁻⁴−8.88 × 10−40.02 −1.37 **
Crco-CrchShrub −0.13 −0.07 −7.12 1.71 --−0.03 0.25
Mach-CrchShrub −0.23 −0.02 1.76 3.76 **−1.75 × 10⁻³−2.28 × 10⁻⁴−0.05 ***0.08
Mach-CrcoShrub −0.10 0.05 8.88 2.05 --−0.02 −0.17
Crch-CafiSub-shrub 0.05 −1.24 ***−172.57 ***−2.39 −7.41 × 10⁻⁴−0.01 0.06 **−0.30
Crco-CafiSub-shrub −0.08 −1.34 ***−184.5 2 ***−2.20 −8.84 × 10−40.06 0.03 *0.89
Crco-CrchSub-shrub −0.13 −0.10 −11.95 0.19 −1.43 × 10−40.07 −0.02 1.19
Crch-CafiLower 0.53 −0.65 **−86.78 ***−3.95 1.07 × 10⁻³−0.06 0.03 1.00
Crco-CafiLower 0.45 −0.74 ***−94.47 ***−0.79 −1.15 × 10⁻³−3.28 × 10−30.02 −0.60
Mabr-CafiLower 0.20 −0.71 **−89.90 ***0.15 −1.68 × 10−34.01 × 10−31.67 × 10⁻³−3.00
Crco-CrchLower −0.08 −0.09 −7.69 3.16 −2.21 × 10−3 *0.06 −8.75 × 10⁻³−1.60
Mabr-CrchLower −0.34 −0.07 −3.12 4.10 −2.75 × 10−3 *0.07 −0.03 −4.00
Mabr-CrcoLower −0.26 0.03 4.57 0.94 −5.31 × 10−47.29 × 10−3−0.02 −2.40
Crch-CachMiddle 0.78 −0.08 −0.72 3.83 8.99 × 10⁻⁴−9.64 × 10⁻³−0.08 *−0.65
Mabr-CachMiddle −0.05 −0.17 −6.94 6.86 −9.79 × 10⁻⁴−0.04 −0.07 *−2.90
Mach-CachMiddle 0.73 −0.02 4.54 3.41 1.22 × 10⁻³−0.01 −0.07 *0.35
Scsu-CachMiddle 0.44 −0.06 −3.08 0.88 1.42 × 10⁻³−0.07 −0.06 2.05
Mabr-CrchMiddle −0.82 −0.09 −6.22 3.04 −1.88 × 10⁻³−0.03 8.33 × 10⁻³−2.25
Mach-CrchMiddle −0.05 0.06 5.26 −0.41 3.23 × 10⁻⁴−2.30 × 10−35.00 × 10−31.00
Scsu-CrchMiddle −0.33 0.02 −2.36 −2.94 5.23 × 10⁻⁴−0.06 0.01 2.70
Mach-MabrMiddle 0.77 0.15 11.48 −3.45 2.20 × 10−30.03 −3.33 × 10−33.25
Scsu-MabrMiddle 0.49 0.11 3.86 −5.98 2.40 × 10⁻³−0.02 5.00 × 10−34.95
Scsu-MachMiddle −0.28 −0.04 −7.63 −2.53 2.00 × 10⁻⁴−0.05 8.33 × 10−31.70
Mabr-CachUpper −0.51 *−0.18 ***−10.84 1.64 −1.90 × 10⁻³−0.03 −0.04 **−2.51
Scsu-CachUpper 0.10 −0.08 *−0.41 3.00 −1.47 × 10⁻³−9.06 × 10⁻⁵−0.06 ***−2.27
Scsu-MabrUpper 0.61 ***0.10 **10.43 *1.36 4.22 × 10−40.03 *−0.010.24
Castanopsis chinensis is represented by Cach; Ca. fissa is represented by Cafi; Cryptocarya concinna is represented by Crco; Cr. chinensis is represented by Crch; Machilus breviflora is represented by Mabr; M. chinensis is represented by Mach; Schima superba is represented by Scsu. The five height ranges were: shrub canopy (1.4–4 m); sub-shrub canopy (4–6.8 m); lower canopy (6.8–11.3 m); middle canopy (11.3–17.4 m); upper canopy (17.4–27.1 m). Rd: the rate of leaf dark respiration; LDM: leaf dry mass; LA: leaf area; SLA: specific leaf area; β: photoinhibition coefficient of relative electron transport rate versus photosynthetic photon flux density curve (RLCs); α: initial slope of RLCs; rETRmax: maximum relative electron transport rate; Ik: half saturating irradiance; LDMC: leaf dry matter content; LT: leaf thickness; Dc: crown depth; Bc: crown breadth; Vc: crown volume. The results of rETRmax, Ik, LDMC, Bc, and Vc were not shown in the table, as the results involving these four traits were not significant. There was one sample tree of Cr. Concinna in the shrub canopy, and the data of chlorophyll fluorescence traits (β, α, rETRmax, Ik) of this species were missing. Therefore, the comparing results of these traits between Cr. Concinna and other species in the shrub canopy were missing in the table. *** p < 0.001; ** p < 0.01; * p < 0.05.
Table A5. The results of one-way analysis of variance (ANOVA) of intra-specific variability of functional traits across tree height of each trait.
TraitsCachCafiCrchCrcoMabrMachScsu
RdNS**NSNSNSNSNS
LDMNSNSNSNSNS*NS
LANSNSNSNSNSNSNS
SLANS****NSNS*NS
βNSNSNSNSNSNS***
αNSNSNSNS*NSNS
rETRmaxNSNS*NSNSNSNS
IkNSNSNS*NSNSNS
LDMCNSNS**NSNSNSNS
LTNS***NSNSNS*NS
Dc*******NS****NS
BcNSNS***NSNS****
VcNS*****NSNS****
Rd: the rate of leaf dark respiration; LDM: leaf dry mass; LA: leaf area; SLA: specific leaf area; β: photoinhibition coefficient of relative electron transport rate versus photosynthetic photon flux density curve (RLCs); α: initial slope of RLCs; rETRmax: maximum relative electron transport rate; Ik: half saturating irradiance; LDMC: leaf dry matter content; LT: leaf thickness; Dc: crown depth; Bc: crown breadth; Vc: crown volume. Castanopsis chinensis is represented by Cach; Ca. fissa is represented by Cafi; Cryptocarya concinna is represented by Crco; Cr. chinensis is represented by Crch; Machilus breviflora is represented by Mabr; M. chinensis is represented by Mach; Schima superba is represented by Scsu. *** p < 0.001; ** p < 0.01; * p < 0.05; NS for not significant difference.
Table A6. The results of one-way analysis of variance (ANOVA) of functional trait differences among different parts of the tree crown in all species and within each species.
TraitsAll SpeciesWithin Each Species
CachCafiCrchCrcoMabrMachScsu
Rd******NSNS*NSNS***
β*****NSNSNSNS*NS
αNSNSNSNSNS*NSNS
rETRmax******NSNSNSNSNS*
Ik******NSNSNSNSNSNS
Rd: the rate of leaf dark respiration; β: photoinhibition coefficient of relative electron transport rate versus photosynthetic photon flux density curve (RLCs); α: initial slope of RLCs; rETRmax: maximum relative electron transport rate; Ik: half saturating irradiance. Castanopsis chinensis is represented by Cach; Ca. fissa is represented by Cafi; Cryptocarya concinna is represented by Crco; Cr. chinensis is represented by Crch; Machilus breviflora is represented by Mabr; M. chinensis is represented by Mach; Schima superba is represented by Scsu. *** p < 0.001; ** p < 0.01; * p < 0.05; NS for not significant different.
Table A7. The results of one-way analysis of variance (ANOVA) of functional trait differences between different parts of the tree canopy within five different height ranges.
TraitsShrubSub-ShrubLowerMiddleUpper
RdNS*NS****
βNSNS****NS
αNSNSNSNSNS
rETRmax*NSNS****
Ik*NSNSNS*
The five height ranges were shrub canopy (1.4–4 m); sub-shrub canopy (4–6.8 m); lower canopy (6.8–11.3 m); middle canopy (11.3–17.4 m); upper canopy (17.4–27.1 m). Rd: the rate of leaf dark respiration; β: photoinhibition coefficient of relative electron transport rate versus photosynthetic photon flux density curve (RLCs); α: initial slope of RLCs; rETRmax: maximum relative electron transport rate; Ik: half saturating irradiance. *** p < 0.001; ** p < 0.01; * p < 0.05; NS for not significant difference.
Table A8. The results of one-way analysis of variance (ANOVA) of intra-specific variability of functional traits among different crown part of each trait.
TraitsCachCafiCrchCrcoMabrMachScsu
Rd***NSNS*NSNS***
β***NSNSNSNS*NS
αNSNSNSNS*NSNS
rETRmax***NSNSNSNSNS*
Ik***NSNSNSNSNSNS
Rd: the rate of leaf dark respiration; β: photoinhibition coefficient of relative electron transport rate versus photosynthetic photon flux density curve (RLCs); α: initial slope of RLCs; rETRmax: maximum relative electron transport rate; Ik: half saturating irradiance. Castanopsis chinensis is represented by Cach; Ca. fissa is represented by Cafi; Cryptocarya concinna is represented by Crco; Cr. chinensis is represented by Crch; Machilus breviflora is represented by Mabr; M. chinensis is represented by Mach; Schima superba is represented by Scsu. *** p < 0.001; * p < 0.05; NS for not significant difference.

References

  1. Silvertown, J. Plant coexistence and the niche. Trends Ecol. Evol. 2004, 19, 605–611. [Google Scholar] [CrossRef]
  2. Brown, C.; Cahill, J.F. Vertical size structure is associated with productivity and species diversity in a short-stature grassland: Evidence for the importance of height variability within herbaceous communities. J. Veg. Sci. 2019, 30, 789–798. [Google Scholar] [CrossRef]
  3. Kohyama, T. Size-structured tree populations in gap-dynamic forest--the forest architecture hypothesis for the stable coexistence of species. J. Ecol. 1993, 81, 131–143. [Google Scholar] [CrossRef]
  4. Levine, J.M.; HilleRisLambers, J. The importance of niches for the maintenance of species diversity. Nature 2009, 461, 254–257. [Google Scholar] [CrossRef] [PubMed]
  5. Poorter, L.; Bongers, L.; Bongers, F. Architecture of 54 moist-forest tree species: Traits, trade-offs, and functional groups. Ecology 2006, 87, 1289–1301. [Google Scholar] [CrossRef]
  6. Poorter, L.; Bongers, F. Leaf traits are good predictors of plant performance across 53 rain forest species. Ecology 2006, 87, 1733–1743. [Google Scholar] [CrossRef]
  7. Wright, I.J.; Reich, P.B.; Westoby, M.; Ackerly, D.D.; Baruch, Z.; Bongers, F.; Cavender-Bares, J.; Chapin, T.; Cornelissen, J.H.; Diemer, M.; et al. The worldwide leaf economics spectrum. Nature 2004, 428, 821–827. [Google Scholar] [CrossRef]
  8. Barker, M.G.; Press, M.C.; Brown, N.D. Photosynthetic characteristics of dipterocarp seedlings in three tropical rain forest light environments: A basis for niche partitioning? Oecologia 1997, 112, 453–463. [Google Scholar] [CrossRef]
  9. Comita, L.S.; Hubbell, S.P. Local neighborhood and species’ shade tolerance influence survival in a diverse seedling bank. Ecology 2009, 90, 328–334. [Google Scholar] [CrossRef]
  10. Valladares, F.; Niinemets, Ü. Shade tolerance, a key plant feature of complex nature and consequences. Annu. Rev. Ecol. Evol. Syst. 2008, 39, 237–257. [Google Scholar] [CrossRef] [Green Version]
  11. Baker, N.R.; Oxborough, K. Chlorophyll fluorescence as a probe of photosynthetic productivity. In Chlorophyll a Fluorescence: A Signature of Photosynthesis; Papageorgiou, G.C., Govindjee, Eds.; Springer: Dordrecht, The Netherlands, 2004; Volume 59, pp. 65–82. [Google Scholar] [CrossRef]
  12. Rascher, U.; Liebig, M.; Lüttge, U. Evaluation of instant light-response curves of chlorophyll fluorescence parameters obtained with a portable chlorophyll fluorometer on site in the field. Plant Cell Environ. 2000, 23, 1397–1405. [Google Scholar] [CrossRef]
  13. Dubinsky, Z.; Stambler, N. Photoacclimation processes in phytoplankton: Mechanisms, consequences, and applications. Aquat. Microb. Ecol. 2009, 56, 163–176. [Google Scholar] [CrossRef]
  14. Cornelissen, J.H.C.; Lavorel, S.; Garnier, E.; Díaz, S.; Buchmann, N.; Gurvich, D.E.; Reich, P.B.; ter Steege, H.; Morgan, H.D.; van der Heijden, M.G.A.; et al. A handbook of protocols for standardised and easy measurement of plant functional traits worldwide. Aust. J. Bot. 2003, 51, 335. [Google Scholar] [CrossRef]
  15. Vaieretti, M.V.; Díaz, S.; Vile, D.; & Garnier, E. Two measurement methods of leaf dry matter content produce similar results in a broad range of species. Ann. Bot. 2007, 99, 955–958. [Google Scholar] [CrossRef]
  16. Enríquez, S.; Duarte, C.M.; Sand-Jensen, K.; Nielsen, S.L. Broad-scale comparison of photosynthetic rates across phototrophic organisms. Oecologia 1996, 108, 197–206. [Google Scholar] [CrossRef]
  17. Fu, L.; Sun, H.; Sharma, R.P.; Lei, Y.; Zhang, H.; Tang, S. Nonlinear mixed-effects crown width models for individual trees of Chinese fir (Cunninghamia lanceolata) in south-central China. For. Ecol. Manag. 2013, 302, 210–220. [Google Scholar] [CrossRef]
  18. Jack, S.B.; Long, J.N. Forest production and the organization of foliage within crowns and canopies. For. Ecol. Manag. 1992, 49, 233–245. [Google Scholar] [CrossRef]
  19. Thomas, S.; Bazzaz, F. Asymptotic height as a predictor of photosynthetic characteristics in Malaysian rain forest trees. Ecology 1999, 80, 1607–1622. [Google Scholar] [CrossRef]
  20. Ishii, H.; Azuma, W.; Nabeshima, E. The need for a canopy perspective to understand the importance of phenotypic plasticity for promoting species coexistence and light-use complementarity in forest ecosystems. Ecol. Res. 2013, 28, 191–198. [Google Scholar] [CrossRef]
  21. Yamada, T.; Zuidema, P.A.; Itoh, A.; Yamakura, T.; Ohkubo, T.; Kanzaki, M.; Tan, S.; Ashton, P.S. Strong habitat preference of a tropical rain forest tree does not imply large differences in population dynamics across habitats. J. Ecol. 2007, 95, 332–342. [Google Scholar] [CrossRef]
  22. Bunyavejchewin, S.; LaFrankie, J.V.; Baker, P.J.; Kanzaki, M.; Ashton, P.S.; Yamakura, T. Spatial distribution patterns of the dominant canopy dipterocarp species in a seasonal dry evergreen forest in western Thailand. For. Ecol. Manag. 2003, 175, 87–101. [Google Scholar] [CrossRef]
  23. Poorter, L.; Arets, E.J.M.M. Light environment and tree strategies in a Bolivian tropical moist forest: A test of the light-partitioning hypothesis. Plant Ecol. 2003, 166, 295–306. [Google Scholar] [CrossRef]
  24. Paoli, G.D.; Curran, L.M.; Zak, D.R. Soil nutrients and beta diversity in the Bornean Dipterocarpaceae: Evidence for niche partitioning by tropical rain forest trees. J. Ecol. 2006, 94, 157–170. [Google Scholar] [CrossRef]
  25. Platt, T.; Gallegos, C.L.; Harrison, W.G. Photoinhibition of photosynthesis in natural assemblages of marine phytoplankton. J. Mar. Res. 1980, 38, 687–701. [Google Scholar]
  26. R Core Team. R: A Language and Environment for Statistical Computing. R Foundation for Statistical Computing. 2019. Available online: https://www.R-project.org/ (accessed on 1 October 2019).
  27. Falster, D.S.; Westoby, M. Plant height and evolutionary games. Trends Ecol. Evol. 2003, 18, 337–343. [Google Scholar] [CrossRef]
  28. Parkhurst, D.F.; Loucks, O.L. Optimal leaf size in relation to environment. J. Ecol. 1972, 60, 505–537. [Google Scholar] [CrossRef]
  29. Marshall, J.D.; Monserud, R.A. Foliage height influences specific leaf area of three conifer species. Can. J. For. Res. 2003, 33, 164–170. [Google Scholar] [CrossRef]
  30. Sellin, A.; Kupper, P. Spatial variation in sapwood area to leaf area ratio and specific leaf area within a crown of silver birch. Trees 2006, 20, 311–319. [Google Scholar] [CrossRef]
  31. Weiskittel, A.R.; Temesgen, H.; Wilson, D.S.; Maguire, D.A. Sources of within- and between-stand variability in specific leaf area of three ecologically distinct conifer species. Ann. For. Sci. 2008, 65, 103. [Google Scholar] [CrossRef]
  32. Nouvellon, Y.; Laclau, J.P.; Epron, D.; Kinana, A.; Mabiala, A.; Roupsard, O.; Bonnefond, J.M.; le Maire, G.; Marsden, C.; Bontemps, J.D.; et al. Within-stand and seasonal variations of specific leaf area in a clonal Eucalyptus plantation in the Republic of Congo. For. Ecol. Manag. 2010, 259, 1796–1807. [Google Scholar] [CrossRef]
  33. Ackerly, D.D. Adaptation, niche conservatism, and convergence: Comparative studies of leaf evolution in the California chaparral. Am. Nat. 2004, 163, 654–671. [Google Scholar] [CrossRef]
  34. Osório, M.L.; Osório, J.; Romano, A. Chlorophyll fluorescence in micropropagated Rhododendron ponticum subsp. baeticum plants in response to different irradiances. Biol. Plant. 2010, 54, 415–422. [Google Scholar] [CrossRef]
  35. Yang, L.; Liu, N.; Ren, H.; Wang, J. Facilitation by two exotic Acacia: Acacia auriculiformis and Acacia mangium as nurse plants in South China. For. Ecol. Manag. 2009, 257, 1786–1793. [Google Scholar] [CrossRef]
  36. Niinemets, Ü. Photosynthesis and resource distribution through plant canopies. Plant Cell Environ. 2007, 30, 1052–1071. [Google Scholar] [CrossRef] [PubMed]
  37. Niinemets, Ü.; Keenan, T.F.; Hallik, L. A worldwide analysis of within-canopy variations in leaf structural, chemical and physiological traits across plant functional types. New Phytol. 2015, 205, 973–993. [Google Scholar] [CrossRef] [Green Version]
Figure 1. The vertical plot in the study, which centred on a 60 m high canopy crane with a 60 m long arm.
Forests 13 01548 g001
Figure 2. Photosynthetic trait differences among height groups. Differences in each trait were checked using the Tukey test at a 95% family−wise confidence level. HG refers to the higher height group, comprising Machilus breviflora, Schima superba, and Castanopsis chinensis; MG refers to the middle height group, comprising Cryptocarya concinna and Cr. chinensis; LG refers to the lower height group, comprising Ca. fissa and M. chinensis. Black box represents HG, grey box represents MG and white box represents LG in (ae). Rd: the rate of leaf dark respiration; β: photoinhibition coefficient of relative electron transport rate versus photosynthetic photon flux density curve (RLCs); α: initial slope of RLCs; rETRmax: maximum relative electron transport rate; Ik: half saturating irradiance. *** p < 0.001; ** p < 0.01; * p < 0.05; NS for not significant difference.
Forests 13 01548 g002
Figure 3. Leaf functional trait differences among height groups. Differences in each trait were checked using the Tukey test at a 95% family−wise confidence level. HG refers to the higher height group, comprising Machilus breviflora, Schima superba, and Castanopsis chinensis; MG refers to the middle height group, comprising Cryptocarya concinna and Cr. chinensis; LG refers to the lower height group, comprising Ca. fissa and M. chinensis. Black box represents HG, grey box represents MG and white box represents LG in (ae). LDM: leaf dry mass; LA: leaf area; SLA: specific leaf area; LDMC: leaf dry matter content; LT: leaf thickness. *** p < 0.001; ** p < 0.01; NS for not significant difference.
Forests 13 01548 g003
Figure 4. Canopy trait differences among height groups. Differences in each trait were checked using the Tukey test at a 95% family−wise confidence level. HG refers to the higher height group, comprising Machilus breviflora, Schima superba, and Castanopsis chinensis; MG refers to the middle height group, comprising Cryptocarya concinna and Cr. chinensis; LG refers to the lower height group, comprising Ca. fissa and M. chinensis. Black box represents HG, grey box represents MG and white box represents LG in (ac). Dc: crown depth; Bc: crown breadth; Vc: crown volume. *** p < 0.001; NS for not significant difference.
Forests 13 01548 g004
Figure 5. Differences in functional traits among different parts of the tree crown. Differences in each functional trait were checked using a Tukey test at a 95% family−wise confidence level. LP represents the lower part of tree crown; MP represents the middle part of tree crown; UP represents the upper part of tree crown. Black box represents UP, grey box represents MP and white box represents LP in (ae). Rd: the rate of leaf dark respiration; β: photoinhibition coefficient of relative electron transport rate versus photosynthetic photon flux density curve (RLCs); α: initial slope of RLCs; rETRmax: maximum relative electron transport rate; Ik: half saturating irradiance. *** p < 0.001; ** p < 0.01; * p < 0.05; NS for not significant difference.
Forests 13 01548 g005
Table 1. Information of families, abbreviation and position within the canopy in the study plot of each target species.
Species ListFamiliesAbbreviationPosition within the Canopy
Castanopsis chinensisFagaceaeCachRelatively evenly distributed throughout the five canopy levels
Castanopsis fissaFagaceaeCafiMainly in the shrub and sub-shrub canopies
Cryptocarya concinnaLauraceaeCrcoMainly in the shrub and sub-shrub canopies
Cryptocarya chinensisLauraceaeCrchMainly in the shrub and sub-shrub canopies
Machilus brevifloraLauraceaeMabrRelatively evenly distributed throughout the five canopy levels
Machilus chinensisLauraceaeMachMainly in the shrub canopy
Schima superbaTheaceaeScsuMainly in the middle and upper canopies
The five height ranges were shrub canopy (1.4–4 m); sub-shrub canopy (4–6.8 m); lower canopy (6.8–11.3 m); middle canopy (11.3–17.4 m); upper canopy (17.4–27.1 m).
Table 2. The abbreviation, units, the interspecific variability, phylogenetic signal, and the p-values of Blomberg’s K of functional traits.
TraitAbbreviationUnitsInterspecific VariabilityKp
The rate of leaf dark respirationRdμmol m−2 s−1***0.03 0.86
Leaf dry massLDMmg***0.09 0.43
Leaf areaLAcm2***0.07 0.60
Specific leaf areaSLAcm2 g−1***0.03 0.85
Photoinhibition coefficient of RLCsβ-***0.09 0.36
Initial slope of RLCsα-***0.04 0.73
Maximum relative electron transport raterETRmaxμmol electrons m−2 s−1**0.11 0.31
Half saturating irradianceIkμmol m−2 s−1NS0.11 0.36
Leaf dry matter contentLDMCmg g−1***0.04 0.75
Leaf thicknessLTmm***0.03 0.84
Crown depthDcm***0.03 0.65
Crown breadthBcm***0.03 0.78
Crown volumeVcm3**0.03 0.74
RLCs: Relative electron transport rate versus photosynthetic photon flux density curve. K: Blomberg’s K values. p: p-values of Blomberg’s K. One-way analysis of variance was used to test interspecific variability of each trait. *** p < 0.001; ** p < 0.01; NS for no significant different.
Table 3. Correlation between species differences in functional traits and species differences of abundance in the five different height ranges. Spearman’s rank correlation test was used to assess the relationship.
TraitShrubSub-ShrubLowerMiddleUpper
Rd0.77 ***0.63 **0.14 −0.32 −0.39
LDM0.12 0.12 −0.10 0.07 0.01
LA0.36 0.21 −0.14 −0.11 −0.18
SLA0.76 ***0.49 *−0.15 −0.76 ***−0.77 ***
β0.72 ***0.57 **−0.29 −0.37 −0.45 *
α0.13 0.38 0.17 0.15 0.10
rETRmax−0.82 ***−0.61 **0.44 *0.90 ***0.92 ***
Ik−0.85 ***−0.71 ***0.45 *0.84 ***0.89 ***
LDMC−0.63 **−0.35 0.12 0.65 **0.63 **
LT−0.69 ***−0.47 *−0.04 0.63 **0.63 **
Dc−0.72 ***−0.41 0.33 0.83 ***0.83 ***
Bc−0.72 ***−0.39 0.41 0.80 ***0.81 ***
Vc−0.84 ***−0.58 **0.45 *0.81 ***0.87 ***
The five height ranges were: shrub canopy (1.4–4 m); sub-shrub canopy (4–6.8 m); lower canopy (6.8–11.3 m); middle canopy (11.3–17.4 m); upper canopy (17.4–27.1 m). Rd: the rate of leaf dark respiration; LDM: leaf dry mass; LA: leaf area; SLA: specific leaf area; β: photoinhibition coefficient of relative electron transport rate versus photosynthetic photon flux density curve (RLCs); α: initial slope of RLCs; rETRmax: maximum relative electron transport rate; Ik: half saturating irradiance; LDMC: leaf dry matter content; LT: leaf thickness; Dc: crown depth; Bc: crown breadth; Vc: crown volume. *** p < 0.001; ** p < 0.01; * p < 0.05.
Publisher’s Note: MDPI stays neutral with regard to jurisdictional claims in published maps and institutional affiliations.

