Article

Differences in Transpiration Characteristics among Eucalyptus Plantations of Three Species on the Leizhou Peninsula, Southern China

1
Research Institute of Fast-Growing Trees (RIFT), Chinese Academy of Forestry (CAF), Zhanjiang 524022, China
2
Guangdong Zhanjiang Eucalyptus Plantation Ecosystem Research Station, Zhanjiang 524022, China
3
South Subtropical Crops Research Institute, CATAS, Zhanjiang 524091, China
*
Author to whom correspondence should be addressed.
Forests 2022, 13(10), 1544; https://doi.org/10.3390/f13101544
Submission received: 15 July 2022 / Revised: 18 September 2022 / Accepted: 19 September 2022 / Published: 21 September 2022
(This article belongs to the Special Issue Forest Ecohydrology: From Theory to Practice)

Abstract

:
How much transpiration water consumption varies between eucalyptus species is unknown, making the suitability of a particular eucalyptus species for large-scale planting in a given area, or whether interspecific differences need to be taken into account for eucalyptus water consumption estimates, uncertain. Here, Eucalyptus camaldulensis Dehnh. (Ec), Eucalyptus pellita F. v. Muell. (Ep), the most resistant species, and Eucalyptus urophylla S.T. Blake × Eucalyptus grandis Hill ex Maiden (Eug), the most widely planted species, were monitored for sap flow. Their stand transpiration was also estimated and its relationship to various influencing factors analyzed for the same stand age and site, and predictive models for daily transpiration (T) developed. The results showed that the T of all eucalyptus species was jointly influenced by meteorological factors, soil water content (SWC), and leaf area index (LAI), with great variation in the T response to each influencing factor among species. Accordingly, we developed species-specific transpiration prediction models that could adequately explain the changed T of each species (R2-values: 0.863–0.911). There were significant differences in the stand daily mean sap flow density (JC) and transpiration among the three species. Although Ec had a significantly lower JC than Ep, it was significantly higher than Eug on all timescales, where the mean annual JC of Ep (0.11 cm min−1) was 1.4 and 2.6 times that of Ec (0.08 cm min−1) and Eug (0.042 cm min−1), respectively. Transpiration of Eug was significantly less than Ep, but significantly greater than Ec on all timescales, where the annual transpiration of Ep (743.41 mm) was 2.4 and 1.5 times that of Ec (311.52 mm) and Eug (493.58 mm), respectively. These results suggest that interspecific differences cannot be ignored when estimating transpiration rates in Chinese eucalyptus plantations, whose amount of water use should be considered when choosing the most optimal species to plant regionally.

1. Introduction

Eucalyptus is among the world’s most important tree species cultivated for timber, and over the last 20 years, its plantations in China have expanded to 5.6 million hectares due to its rapid growth performance, high wood yield and strong economic value [1]. However, there is widespread debate and concern in the public sphere and industry regarding the large-scale planting of eucalyptus because of its impact on the regional water cycle and groundwater [2,3,4]. Previous studies had proposed that the higher water consumption by eucalyptus would result in lower water yield in the watershed and the depletion of groundwater resources [5,6,7,8], while others argued that the water used by eucalypt plantations does not severely deplete the local water supply [9,10]. Such ongoing disputes have severely restricted the sustainable development of the eucalyptus industry in some parts of southern China. Therefore, it is imperative that the water use dynamics of eucalyptus be studied using rigorous science.
Transpiration by trees is the most important hydrological process in forest ecosystems and a major cause of water loss from forest ecosystems [11,12]. Therefore, accurate estimation of the transpiration of eucalyptus plantations is crucial for resolving the current debate about their impact on regional water resources [11,13]. Many studies done in China have estimated transpiration for eucalypts, but most of those focused on the main cultivar, Eucalyptus urophylla S.T. Blake × Eucalyptus grandis Hill ex Maiden (Eug) [3,14] or Eucalyptus urophylla S.T. Blake [15], leaving other eucalypt species understudied. With the expansion of eucalyptus plantations in China, the problems of instability and weak disease/pest resistance of monocultures have become increasingly prominent, hence, the diversification of eucalyptus species and popularization of highly resistant species has begun in China [16]. Nevertheless, the differences in transpiration between Eucalyptus species remain unclear. Only by clarifying these differences can we increase the accuracy of estimating regional water consumption by eucalyptus and accordingly assess the suitability of various species for planting.
Tree species identity largely determines the hydraulic structural properties, growth characteristics, leaf longevity, leaf area index, and sapwood area of a stand [17]. Specifically, a tree’s hydraulic structure influences water transport, beginning with root uptake and ending with water dissipation at its crown foliage [18]. The sapwood area determines the potential area of water conduction in the trunk [19], while leaf area index directly determines the transpiration capacity of a tree stand’s canopy [12,20]. Therefore, transpiration by forests tends to considerably vary depending on the tree species.
Because the estimation of transpiration and water consumption in forests on a large spatial scale often involves numerous complex tree species, it is meaningful to explore the differences in transpiration water consumption characteristics among different tree species to increase the accuracy of forest transpiration estimation and refine water use estimation models. In addition, the transpiration of trees is closely related to many environmental factors such as atmospheric temperature, relative humidity, wind speed, vapor pressure deficit, solar radiation, and soil moisture [21,22,23], as well as canopy structural characteristics such as leaf area index (LAI), as demonstrated by many studies [20,24,25,26,27]. Differences among tree species in the biological characteristics can also lead to large differences in the magnitude of their transpiration response to changes in various factors that influence it [28]. In the context of global climate change, it is also essential to clarify the relationship between transpiration and influencing factors across tree species and to predict future changes in their water use via modeling.
Eucalyptus camaldulensis Dehnh (Ec), a perennial single-stemmed tree which can reach heights of 20 to 30 m, has a vigorously growing, deep, and extensive root system which reaches depths of at least 10–30 m with lateral or fan roots and sinker roots extending from the lateral roots, as well as vertical tap roots [29], which makes it highly drought- and wind-tolerant [30]. Eucalyptus pellita F. v. Muell. (Ep) is a well-formed medium-size-to-tall tree species that can reach 40 m or more in height and 1 m in diameter, with the advantages of rapid growth and high resistance to pests and diseases [31,32]. Because of their robust resistance to various factors, both eucalyptus species are increasingly favored for commercial planting in China, and the plantation area dedicated to them is gradually expanding. However, the transpiration and water consumption characteristics of Ec and Ep are not yet known in China, which generates considerable uncertainty regarding their suitability for planting on a large scale and their effect on water security. Therefore, here, we studied the sap flow characteristics of Ec and Ep of the same stand age, under the same site conditions, to estimate their stand-level transpiration as well as analyzing the relationship between their stand transpiration and various influencing factors; for this, Eug, the species with the largest planted area, served as the control. Our study had three objectives: (1) to define the differences in transpiration and sap flow characteristics among the three eucalyptus species; (2) to determine how climatic variables differ in their effects on transpiration by the three species and to develop transpiration prediction models for each; and (3) to test whether it is necessary for regional eucalyptus transpiration estimates to take into account differences in transpiration characteristics between species when choosing what to plant. The results are expected to provide a timely reference for later assessment of the impact that changes to the planting structure of eucalyptus will have on regional water resources, the selection of tree species for regional eucalyptus planting plans, and the refinement of models for estimating how much water is consumed by eucalyptus transpiration.

2. Materials and Methods

2.1. Experimental Site and Plantation

This study was conducted at the Eucalyptus Plantation Ecosystem Research Station (latitude 21°16′ N, longitude 110°05′ E), located in Zhanjiang City, Guangdong Province, China, lying at an elevation of 80–220 m a.s.l. (Figure 1), and which has a typical maritime monsoon climate. The average annual temperature and precipitation at this site is, respectively, 23.1 °C and 1319.5 mm (23.6 °C and 1462.3 mm for the monitoring year) (Figure 1). The extreme minimum temperature was 1.4 °C, which occurred in January, while the extreme maximum temperature was 38.1 °C, which occurred in July. In addition, precipitation is highly concentrated between May and October (the rainy season), which accounts for 77%–85% of the annual precipitation [33]. The soil here is classified as Rhodi-Udic Ferralosols according to the World Reference Base for Soil Resources [34], having been developed from weathered deposits of basalt, and it is acidic (average pH of 4.9 at a depth of 0–80 cm).
The selected plantations of three eucalyptus species (Ep, Ec, and Eug) were all planted in 2008. Given the small distance (<1 km) between the three plantations, there is little difference in the meteorological conditions among them. Three experimental plots with an area of 20 m × 20 m were established in the center of each plantation for sap flow measurements. The trees in the plots were all numbered, and the height and the diameter at breast height (DBH) of each were measured. All three plantations had a flat topography. The details of the three experimental plantations of eucalyptus species are presented in Table 1.

2.2. Measurement of Environmental Factor Parameters

Meteorological parameters: The meteorological parameters were continuously measured in an open area near the experimental plantations. The air temperature (Ta, °C) and relative humidity (RH, %) were quantified using a thermo recorder (HMP155A, Vaisala, Helsinki, Finland); the solar radiation (Rs, W m−2) was measured by a photon sensor (LI-200R, LICOR, Lincoln, NE, USA); the precipitation (P, mm) was recorded with a tilting rain gauge (TE525MM, Campbell, Logan, UT, USA); and the wind speed (WS, m s−1) was measured with an anemometer (ATMOS 22, Decagon, Pullman, WA, USA). All measurements were recorded every minute, and the 10-min average value for each variable was stored in a data logger (CR3000, Campbell, USA). The vapor pressure deficit (VPD, kPa) was calculated from Ta and RH according to the following equation [35]:
VPD = 0 . 611   ×   e   17 . 502 × Ta ( Ta + 240 . 97 )   ×   ( 1 RH )
Soil water content (SWC): The SWC was measured using six soil moisture sensors (CS616, Campbell, USA) buried at soil depths of 10, 20, 40, 60, 80, and 100 cm near the sample trees in each stand. The measured SWC data included the soil volumetric water content (cm3 cm−3) and was recorded every 30 min by a data logger (CR1000, Campbell) that was synchronized with the monitoring of the trees’ sap flow rate, as described below.

2.3. Leaf Area Index (LAI) Measurement

The LAI was measured using a digital plant canopy analysis system (HemiView; Delta-T, Cambridge, UK). On a single day per week, more than 20 points were randomly selected in each experimental plantation to obtain an image of the upper canopy. Images were obtained using a camera with a fish-eye lens at sunset on a sunny day to minimize LAI measurement errors caused by strong light. Then, HemiView software, supported by the digital plant canopy analysis system, was used to analyze the forest canopy images and estimate the LAI at each location. Finally, the LAI for the three plantations was estimated for each day using an interpolation method.

2.4. Sap Flow Measurements

Based on the investigation of each tree in the experimental plots, 18 healthy trees representing the DBH size classes in each test plantation were chosen for the sap flow density measurements using thermal dissipation probes (SF-G, Ecomatik, Munich, Bavaria, Germany), carried out from January to December 2020. Each set of probes consisted of two sensors (S0: the heated probe, S1: the reference probe) that were 23 mm in length and 2 mm in diameter. Each thermal dissipation probe was inserted into the active xylem at breast height (1.3 m) on the north side of the trunk and covered with radiation-proof aluminum foil to not only avoid incurring direct solar radiation and physical damage, but also to reduce the effects of ambient temperature fluctuation and precipitation. The S0-S1 connection provided the temperature differences (ΔT), these recorded every 30 s and averaged over 30 min by the data logger (CR1000, Campbell). The recorded ΔT was then converted into sap flow density (Js) based on the calibration equation of Granier [36]:
J s = 0.714   × Δ T m a x     Δ T Δ T     1 . 231
where Js denotes the sap flow density (cm min−1), ΔTmax denotes the value of ΔT when the sap flow is nil or close to zero. However, because the sap flow density cannot reach zero every day, we recorded the maximum daily ΔT over 7–10 days (ΔTmax) to avoid underestimation [37].

2.5. Sapwood Area Determination

Under the assumption that the stem cross-sections were circular, individual values of sapwood area (SA, cm2) were calculated by measuring DBH, sapwood thickness, and bark thickness. To avoid damaging the sampled trees used for sap flow measurements, 18 non-monitored trees with different DBH classes outside the experimental plots were selected in each eucalyptus species plantation and felled, in order to obtain the cross-sectional at breast height. We identified the boundary between sapwood and heartwood by their visible wood color difference. Following Vertessy et al. [38], we used an allometric equation to relate SA to DBH:
S A = a × D B H b ,
where SA denotes the sapwood area (cm2), and a and b indicate the estimated equation parameters.

2.6. Estimation Methods for Individual Tree and Stand-Level Transpiration

Assuming a consistent sap flow rate throughout the sapwood, the individual tree transpiration Ei (g day−1) was estimated as the product of sap flow density and the sapwood area, according to this published empirical calibration equation [36]:
E i = J d   ×   S A   ×   60   × 24 ,
where Ei denotes the individual tree transpiration (g day−1), and Jd denotes the mean daily sap flow density of a monitored tree (cm min−1).
The daily transpiration (T, mm day−1) was calculated from individual trees to the stand level using the following equation [12]:
T = J C   ×   S A S × 1000   ×   60   ×   24
where T denotes the stand-level daily transpiration (mm day−1), ∑ SA (cm2) denotes the sum of the sapwood area of all trees in a given experimental plot, S (m2) denotes the ground area of an experimental plot, and JC (cm min−1) denotes the stand daily mean sap flow density (the sapwood area-weighted average of Jd for each DBH class). JC was calculated as:
J C = i n J d i × S A i S A
where Jdi is the average Jd of the ith DBH class, SAi is the total sapwood area of the sample trees of the ith DBH class in a given experimental plot, and ∑ SA (cm2) denotes the sum of the sapwood area of all trees in an experimental plot.

2.7. Data Analysis and Statistics

One-way analysis of variance (ANOVA) followed by Tukey’s honestly significant difference (HSD) test was used to examine the differences in JC and T in different months or seasons among eucalyptus species. Regression analysis was used to examine the response of T to different environmental parameters and LAI, and the correspondence between the measured and predicted T values. Using regression, a power function curve was fitted to quantify the relationship between SA and DBH. Stepwise regression analysis was performed with 5% and 10% confidence levels as the threshold values for selection and rejection, respectively, to develop a multivariate linear model of T and f(X) (the relationship between the influencing factor and T is expressed by f(X)). The R v3.6.1 software platform (R Development Core Team 2019) was used to perform all statistical analyses and to draw the figures.

3. Results

3.1. Stands Structure and the Relationship between Sapwood Area and DBH

Despite the similarity in age and stand conditions of the three eucalyptus species, there were differences in the structural characteristics (Table 1). The DBH of Ep varied from 15.5 to 29.7 cm, whose mean value of 22.93 cm was similar to that of Eug (23.52 cm) (p > 0.05), but both were significantly greater than that of Ec (19.1 cm) (p < 0.05). The LAI of Eug stands (2.08) was significantly higher than that of Ec (1.87), but significantly lower than that of Ep (2.43). On average, Eug (27.1 m) was significantly taller than the other two eucalyptus species, whereas Ep and Ec were similar in height (Table 1).
The SA of each eucalyptus species was described well by a power function of DBH (Figure 2). Accordingly, the mean SA of Ep trees was 134.31 cm2, which was significantly greater than that of Ec (70.78 cm2), but significantly less than that of Eug (189.88 cm2) (Table 1). The total SA of the three plantations was 12.34 m2 ha−1 (Ep), 7.18 m2 ha−1 (Ec), and 21.49 m2 ha−1 (Eug) (Table 1).

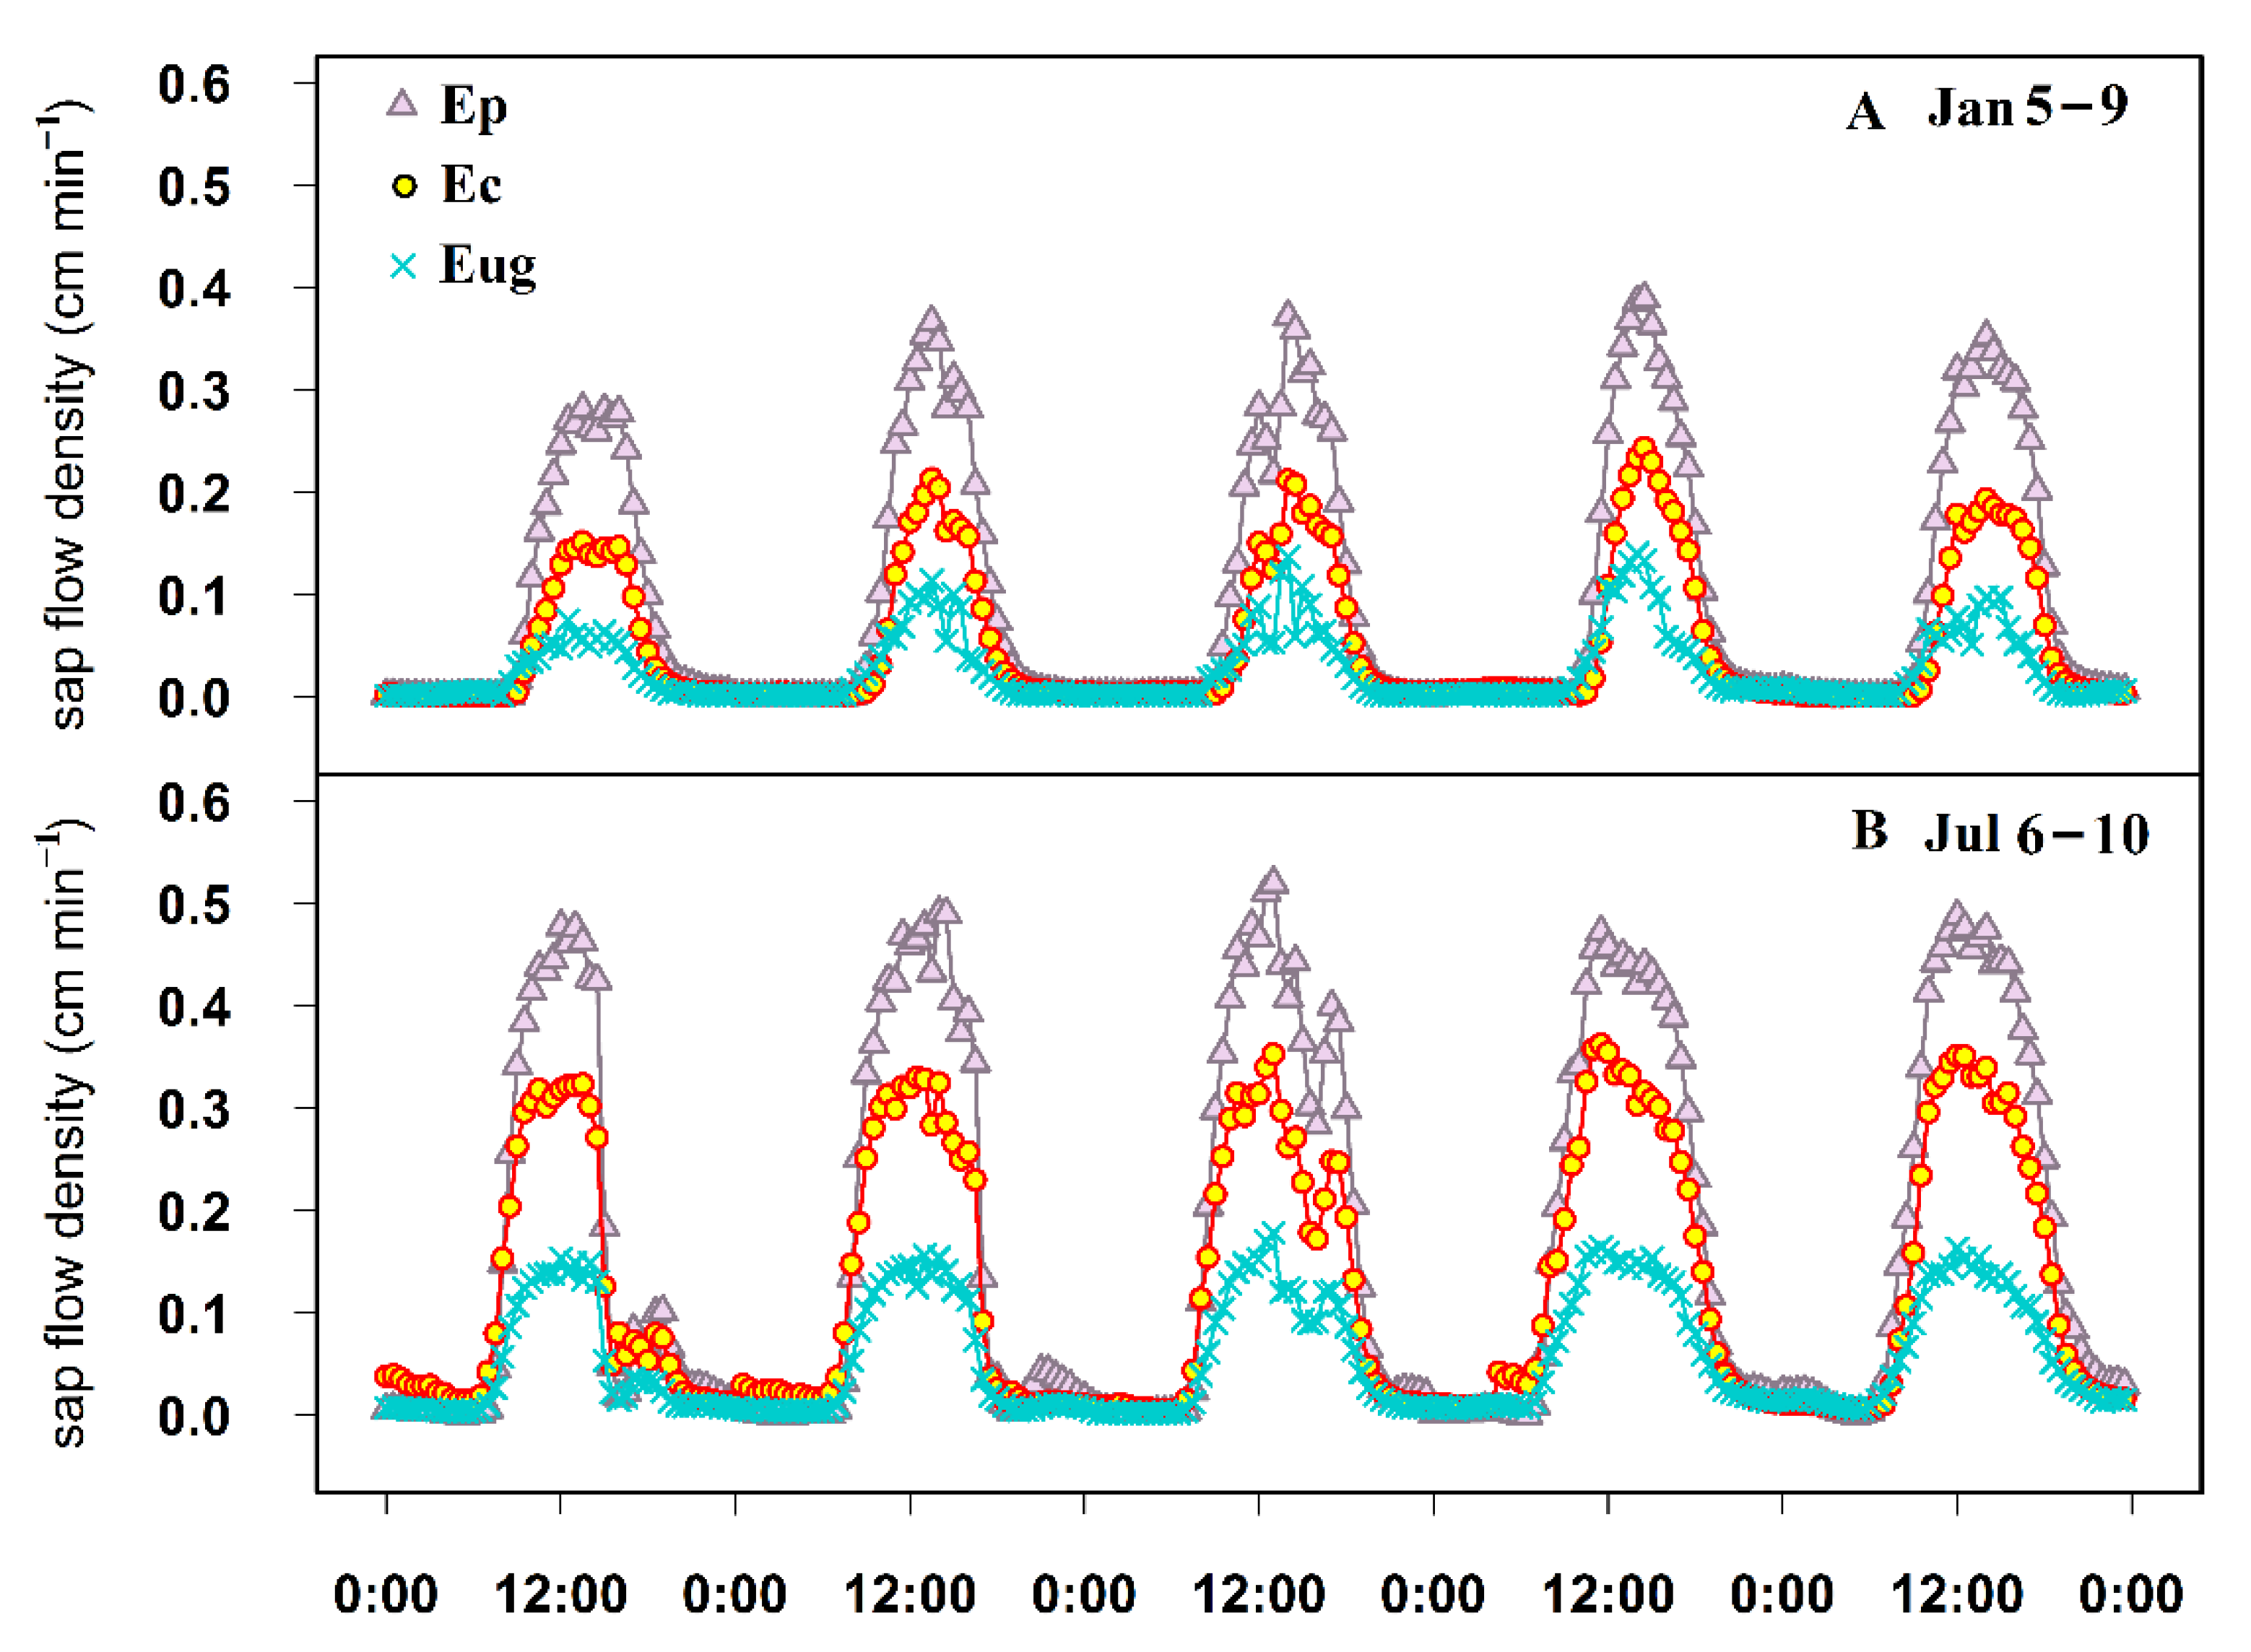
3.2. Characteristics of Sap Flow Density of the Three Eucalyptus Species

There are many similarities in the sap flow density characteristics of the three eucalyptus species. In both dry and wet seasons, all species showed a typical single-peaked curve during sunny days. The times when the sap flow started to increase, reached its peak, and began to decrease remained consistent for the three species (Figure 3). The Jc of the three species followed the same seasonal pattern: undergoing a gradual increase from January to May, with high values maintained in May, June, and July, and then declining from August to December (Figure 4B). The mean Jc was significantly higher in the wet season than in the dry season for all three eucalyptus species. In addition, the CV (coefficient of variation) of Jc for three eucalyptus species was similar throughout the year, at approximately 40%.
However, many differences in sap flow density were evident between the three eucalyptus species. The daily peaks differed considerably on sunny days, with the highest daily peak found for Ep, followed by Ec, and least for Eug (Figure 3). The Jc over the entire year ranged from 0.0027 cm min−1 to 0.1937 cm min−1 for Ep, 0.0118 cm min−1 to 0.1394 cm min−1 for Ec, and 0.0049 cm min−1 to 0.0866 cm min−1 for Eug (Figure 4A). The annual mean Jc of Ec (0.080 cm min−1) was significantly lower than that of Ep (0.11 cm min−1), but significantly greater than that of Eug (0.042 cm min−1) (Figure 4E). The same hierarchical pattern of mean Jc values for the three eucalyptus species was likewise observed in the dry (Figure 4C) and wet seasons (Figure 4D).

3.3. The Water Use Characteristics of the Three Species of Eucalyptus Stands

The total transpiration during the monitoring period was 743.41 mm for Ep, 311.52 mm for Ec, and 493.58 mm for Eug; these, respectively, amounting to 50.8%, 21.3%, and 33.8% of the annual precipitation. Throughout the year, the mean T for Eug reached 1.35 mm day−1, which was significantly greater than Ec (0.85 mm day−1) but significantly less than Ep (2.03 mm day−1). This pattern also applied to the mean monthly transpiration and the mean T for all months, as well as for the dry and wet seasons except for April, August, and October, when no significant differences were found between the mean T of Eug and Ec (Table 2).
The T and monthly cumulative T for the three eucalyptus species’ plantations all followed the same seasonal pattern of gradual increases from January to May, with large values in May, June, and July, before decreasing again from August to December (Table 2). The total transpiration during the wet season (from May to October) was 456.52 mm for Ep, 192.00 mm for Ec, and 298.20 mm for Eug, which collectively accounted for approximately 60% of their total annual transpiration and 37.5%, 15.8%, and 24.5% of simultaneous precipitation, respectively. However, the total T of each species during the dry season accounted for 117.7% (Ep), 49.1% (Ec), and 80.1% (Eug) of the simultaneous precipitation.

3.4. Factors Influencing Transpiration by the Three Eucalyptus Species

To elucidate the relationship between T and meteorological parameters, the effects of Rs, VPD, Ta, RH, and WS on T of the three eucalyptus species were analyzed (Figure 5). This analysis revealed that the T of all species significantly increased as a convex parabolic function of Rs (R2 = 0.862 for Ep, 0.808 for Ec, and 0.764 for Eug, all p < 0.001) (Figure 5A) and VPD (R2 = 0.674 for Ep, R2 = 0.751 for Ec, and 0.639 for Eug, all p < 0.001) (Figure 5B), but significantly increased as a concave parabolic function of Ta (R2 = 0.546 for Ep, 0.392 for Ec, and 0.461 for Eug, all p < 0.001) (Figure 5C). Additionally, the T of each species was significantly related to RH in a convex parabolic function that first increased and then decreased at a threshold value of 70% (R2 = 0.392 for Ep, 0.407 for Ec, and 0.325 for Eug, all p < 0.001) (Figure 5D). The T showed a significant negative linear relationship with WS for each species (R2 = 0.138 for Ep, 0.079 for Ec, and 0.089 for Eug, all p < 0.001) (Figure 5E). Among the five meteorological parameters, Rs best explained the variation in T of each eucalyptus species, which indicates its dominant control over transpiration in eucalyptus plantations in the study area.
The relationships between T and SWC are also presented in Figure 5F, which shows that the T of the three eucalyptus species plantations was highly dispersed for any given SWC due to the strong influence of other factors. However, when the SWC fell below a certain threshold value (19.3% for Ep, 17.5% for Ec, and 18.6% for Eug), the upper boundary lines indicate a significant non-linear increase of T with rising SWC, which can be well characterized by a saturated exponential equation (R2 = 0.963 for Ep, 0.951 for Ec, and 0.970 for Eug, p < 0.001). Once the respective thresholds were exceeded, there was no longer a clear relationship between SWC and T.
The T and LAI data for the three eucalyptus species are plotted in Figure 6. Evidently, for any given LAI, the T of the three plantations showed a high degree of dispersion due to the strong influence of other factors. However, all species showed a clear Gompertz model curve for the upper boundary of T associated with LAI (R2 = 0.941 for Ep, 0.961 for Ec, and 0.948 for Eug, all p < 0.001), which represents the relationship between T and LAI when no other factors are limiting (Figure 6). These curves show that there was an initial non-linear increase in the T of all three species with an increasing LAI that finally stabilized after reaching their respective potential maximum; this suggested an LAI threshold exists for each eucalyptus species, beyond which LAI will no longer act as a limiting factor for their T.

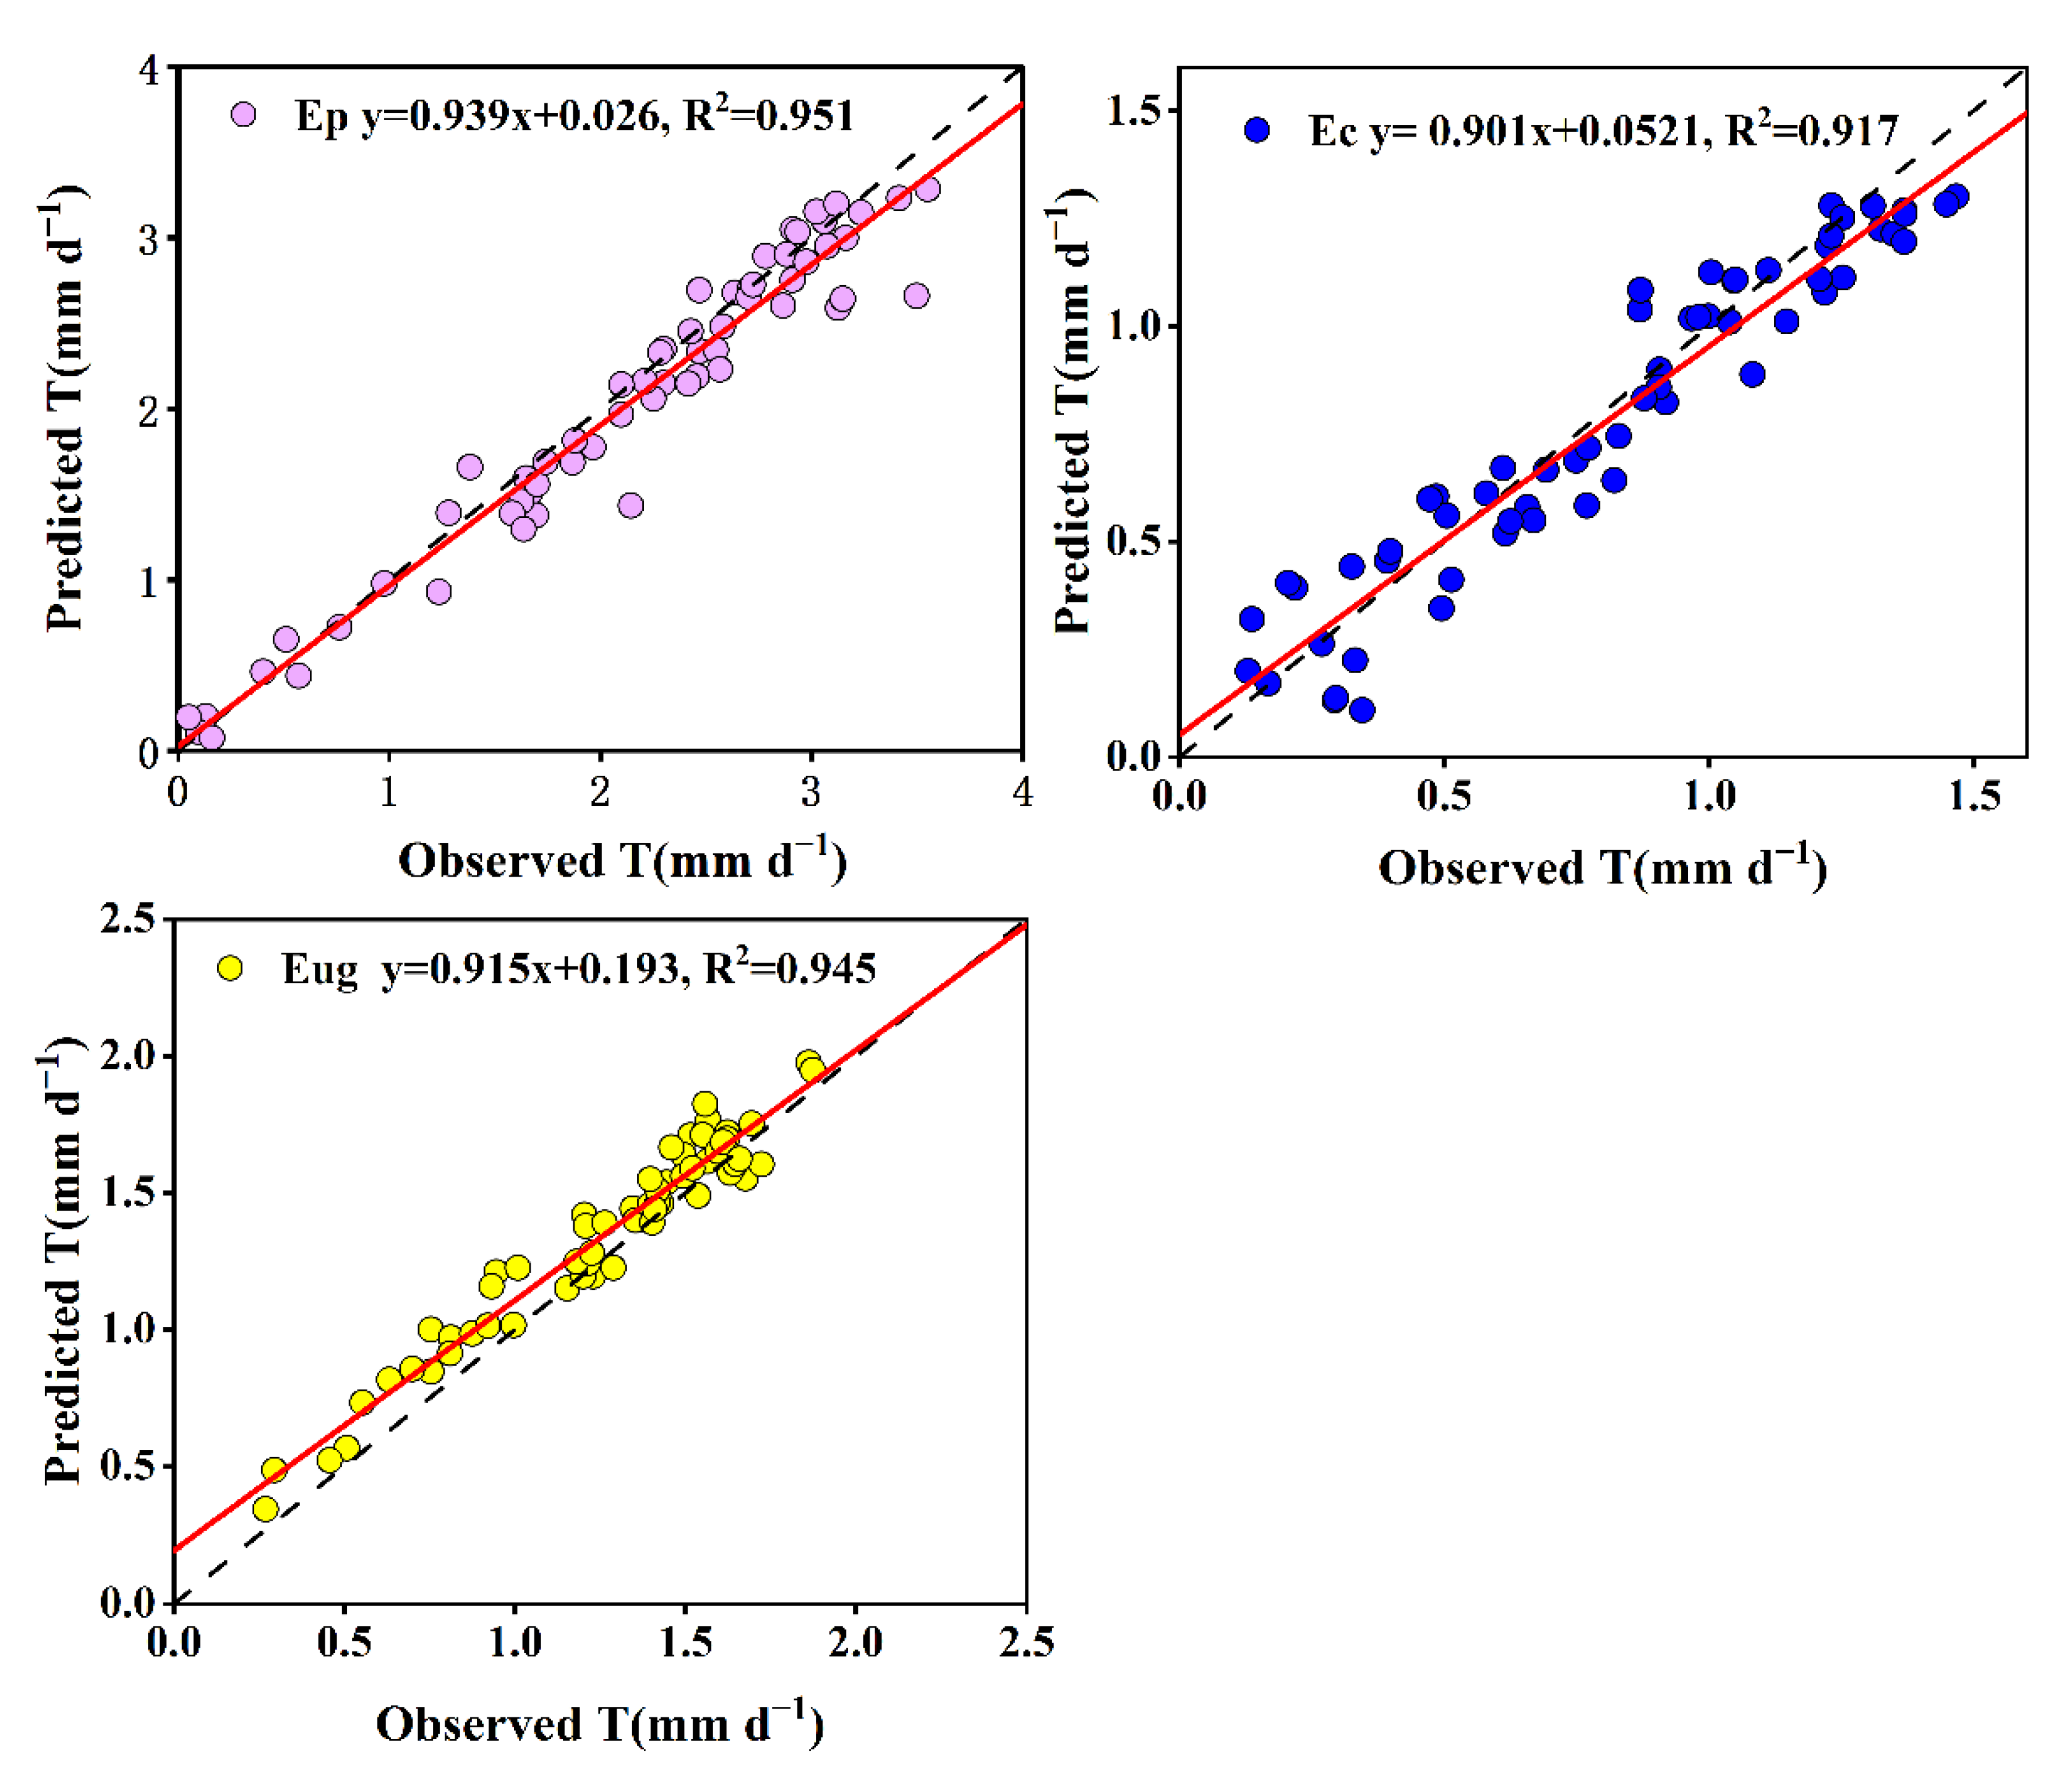
3.5. Model to Estimate the Daily T of Each Eucalyptus Species

Our results showed that, for all three species, their T was influenced by the combination of Rs, VPD, Ta, RH, WS, SWC, and LAI. We established a relationship equation with T for each influence factor separately. Considering the interaction between many influencing factors and to further reveal their combined effect on T of the three stands, a stepwise regression model based on 10 months of data (one month of data from each of the dry and wet seasons was retained for model validation) was used to derive a multivariate relationship between T and f (Rs), f(VPD), f(Ta), f(RH), f(WS), f(SWC), and f(LAI). A final integrated model for predicting T for each eucalyptus species was constructed (Table 3).
The summed T for the omitted two months (set aside for validation) calculated using the predictive model was 82.13 mm for Eug, 124.30 mm for Ep, and 48.04 mm for Ec, which was 106.78%, 95.15%, and 96.50% of their actual measured values, respectively. The Nash and Sutcliffe coefficient was 0.897 for Eug, 0.938 for Ep, and 0.912 for Ec. Further, the slopes of the linear fit between the measured and predicted sets of values are 0.901 for Eug, 0.939 for Ep, and 0.915 for Ec, respectively, with corresponding R2 values of 0.917, 0.951, and 0.945, respectively (Figure 7), indicating excellent agreement between these two sets of values. These results thus provide ample evidence that respective predictive models built for the T of the three eucalyptus species are accurate.

4. Discussion

4.1. Sap Flow Density and Water Use of the Three Eucalyptus Species

The sap flow is a key indicator of a tree’s water use characteristics and the water transport mechanism [39,40]. Previous studies have reported that sap flow density is not only controlled by environmental factors [25,41,42], but is also closely related to the trees’ physiological structure as well as stand characteristics [11,43]. Here, the sap flow density of three eucalyptus species’ plantations showed a similar daily and seasonal variation pattern due to the same environmental conditions (Figure 3 and Figure 4). Nevertheless, pronounced differences in sap flow density among the three eucalyptus species were also evident.
The peak daily sap flow and the mean sap flow density of Ec on all time scales were significantly greater than Eug, but significantly less than Ep (Figure 3 and Figure 4). These differences were mainly caused by differing biological characteristics and stand structure among the three eucalyptus species. Applying a previous empirical formula [36], it was clear that sap flow density is proportional to canopy transpiration and inversely proportional to the area of trunk water transport. Being affected by LAI, the T of Ep was the greatest in this study, followed by Eug, and least for Ec (Table 2). However, Eug possesses the largest sapwood area and DBH, and its trunk harbors the largest water conduction area. These factors, coupled to its maximum height, results in the longest water transport path and the greatest resistance to the upward movement of water due to friction and gravity [44], but vice versa for Ec, resulting in a starkly lower sap flow density for Eug than Ec. Hence, due to the combined effects of LAI, DBH, tree height, and SA, the sap flow density of the eucalyptus species was ranked thus: Ep > Ec > Eug.
In addition, our results uncovered considerable differences in the transpiration characteristics of the three eucalyptus species. The annual transpiration of Ep was 743.41 mm, which was 2.4 and 1.5 times higher than that of Ec (311.52 mm) and Eug (493.58 mm), respectively. These were all within the range of other records for Eucalyptus plantations [3,45,46,47]. The same species pattern was also observed for T accumulation by month and during the dry and rainy seasons. The average daily transpiration on all time scales examined had this pattern of variation: the mean daily transpiration of Eug exceeded that of Ec, but less than that of Ep (Table 2). Although the research consensus to date is that the magnitude of tree transpiration is influenced by a combination of species [44,48,49], stand structural characteristics [12,48,50,51], and environmental factors [12,25,42,52], the differences in transpiration between the three eucalyptus species in this study mainly arose from differences in species and tree stand structural characteristics because their close proximity precluded any effects of meteorological conditions.
Many previous studies have reported positive relationships of tree growth characteristics (e.g., height, DBH, SA and above-ground biomass) and transpiration [11,43,50]. However, the transpiration of the three eucalyptus species in this study was not consistent with their DBH, tree height, or SA, perhaps because the conclusions drawn in previous studies were for the same species; that is, the pattern may not be consistent between species due to differences in their physiological characteristics. Work by Hatton et al. [53] confirmed that leaf water efficiency differed negligibly between various eucalyptus species in four disparate environments: tropical woodlands with distinct wet and dry seasons, forests with a Mediterranean climate, a woodland system with an even distribution of precipitation throughout the year, and a woodland growing on a saline gradient. This finding, combined with the fact that the magnitude of LAI of the three eucalyptus species’ plantations we studied remained consistent with the magnitude of measured transpiration, suggests that LAI may be the determining factor in the production of transpiration differences between the three eucalyptus species plantations.
From the previous analysis, it is clear that the differences in transpiration between eucalyptus species measured under the same climatic and stand conditions in this study are considerable, and such differences are mainly due to the species characteristics and the differences in stand structure under its influence. As such, it is necessary for regional eucalyptus transpiration estimates to take into account differences in transpiration characteristics between species. The annual transpiration of each eucalyptus species also differed significantly from that of other local species such as Cunninghamia lanceolate (Lamb.) Hook. (20 years old, 552.1 mm) [11], Pinus elliottii Engelm × Pinus caribaea Morelet (10 years old, 483.24 mm) [54] and Acacia mangium Willd. (19 years old, 244.5 mm) [55]; indeed, even the annual transpiration of Ep was much greater than theirs. Therefore, planting different tree species will have different effects on the water cycle processes in the planting area. Moreover, in this study, although the annual transpiration of Ep, Ec, and Eug amounted to only 50.8%, 21.3%, and 33.8% of the annual precipitation, respectively, the percentage increased to 117.7% (Ep), 49.1% (Ec), and 80.1% (Eug) in the dry season. This implies that Ep plantations will consume large amounts of soil water or groundwater to meet their evaporative demands during the dry season, which cannot be adequately supplemented by precipitation. This lower input of water than output during the dry season can place a large hydrological burden in the planting area. However, this hydrological burden will be attenuated in the Eug plantation, or even not occur in the Ec plantation. There are some limitations in this paper, including that we only measured the transpiration, not the total evapotranspiration, in plantations of three Eucalyptus species, which would reduce our ability to assess the impact of tree species selection on regional water resources. However, it is still possible to conclude from our results that it is necessary to take into account the differences in transpiration characteristics between species when selecting planting species. Of course, further studies on the total evapotranspiration of the three Eucalyptus species are needed to more completely assess the impact of species selection on regional water resources.

4.2. Factors Influencing Water Use by the Three Eucalyptus Species

Tree transpiration consists of a set of complex physiological responses to environmental change [56]. Therefore, the transpiration of a tree stand is mainly affected by meteorological factors [57,58] and available water [59]. In this study, the T of all three eucalyptus species clearly increased with an increasing Rs or VPD, but leveled off after reaching a certain threshold (Figure 5A,B). The threshold control of T by Rs and VPD has been observed in many studies [57,60,61] because the response of plant stomata to Rs and VPD is often the result of a trade-off between maximizing photosynthesis and minimizing transpiration [52,55]. As Rs and VPD exceed the thresholds, plants will prevent excessive water loss by closing their stomata. In addition, these threshold values can vary with time, environmental conditions, and tree species identity. For example, the thresholds for T corresponding to VPD and Rs in a coniferous forest in the Lesser Himalaya of Central Nepal were 0.4 kPa and 200 W m−2 [57], respectively, whereas in a Robinia pseudocacia L. plantation on the semi-arid Loess Plateau of China, they were 1.5 kPa and 250 W m−2, respectively [62]. Ma et al. [41] found the threshold for sap flow corresponding to VPD in a Robinia pseudocacia L. forest on the Loess Plateau of China to be 1.9 kPa in 2015, but this value decreased to 1.6 kPa in 2016. Here, the calculated thresholds for Rs differed among the three eucalyptus species, being 403 W m−2 for Ep, 321 W m−2 for Ec, and 382 W m−2 for Eug, whose corresponding thresholds for VPD were 1.77 kPa for Ep, 1.73 kPa for Ec, and 2.40 kPa for Eug.
For the three eucalyptus species, their T increased markedly with a rising Ta, a result consistent with findings of O’Brien et al. [63] and Han et al. [25]. We also found that the relationship between T and RH for each species differed from many other studies that reported a significant negative linear relationship between T and RH [11]. We found that below a certain threshold of RH (i.e., 69.7% for Ep and 66.4% for Ec and Eug), the T of the three species increased with an increasing RH, while above the threshold, it decreased instead. This result may be explained by the fact that RH below the threshold value principally occurs essentially during the dry season, when higher RH may represent an increased environmental water supply, which would promote transpiration. Furthermore, the T of the three eucalyptus species also showed a significant linear decrease with an increasing wind speed (Figure 5E), consistent with the findings of Asbjornsen et al. [64], but contrary to those of O’Brien et al. [63] and Han et al. [25]. Still, some studies have argued that WS has little effect upon T. There is no consensus as to how wind speed affects transpiration, although there are reports of stomatal closure in direct response to high wind speeds [65,66,67], as well as reports of wind speed contributing to transpiration in accordance with stomatal and boundary layer theory [68,69,70].
In addition to meteorological factors, soil moisture availability also has a pivotal influence on tree transpiration. Soil water deficits tend to reduce leaf water potential, which reduces stomatal conductance and ultimately limits transpiration by trees [59,71]. Therefore, the more severe the soil water deficit is, the greater the limiting effect on transpiration. Previous studies have found that tree transpiration increased non-linearly with more soil moisture under conditions of soil moisture deficit [12,72,73], as also found in our study. Initially, the T of the three eucalyptus species increased rapidly and almost linearly at first, with increasing soil moisture, and then became progressively flatter until a threshold value was reached (Figure 5F). Once that threshold is exceeded (indicating an adequate soil moisture supply), soil moisture is no longer a limiting factor, at which point there is no clear relationship between SWC and T; this finding was also consistent with that of many studies [12,74]. Additionally, there is considerable variation in plant–soil moisture thresholds, depending on tree species, soil type, and climatic conditions. For example, Ungar et al. [75] obtained a value of 15% for the SWC threshold of an Aleppo pine (Pinus halepensis Mill) stand in Israel. In the semi-arid areas of the Liupan Mountains, the SWC thresholds were 19% and 28% for 28- and 33-year-old pure larch (Larix principis-rupprechtii Mayr) plantations, respectively [12,74]. The soil moisture thresholds for the three Eucalyptus species in our study also differed, at 19.3% for Ep, 18.6% for Eug, and 17.5% for Ec, likely due to their biological characteristics. These thresholds are consistent with the drought-tolerant nature of Ec.
The transpiration of forest stands is also closely related to their LAI, as confirmed by numerous studies [12,20,76,77]. Canopy LAI directly influences the water-conveying capacity of the forest and determines its transpiration potential [12], and therefore, forest transpiration tends to be positively correlated with LAI in the absence of other limiting factors [20]. For example, Forrester et al. [78] found that the transpiration of a Eucalyptus nitens (H. Deane & Maiden) Maiden plantation increased with a higher LAI in the range of 1.0 to 6.0. However, forest transpiration of the forest does not increase indefinitely with an increasing LAI, but rather, there is a threshold beyond which transpiration can no longer increase [12]. For example, Di et al. [79] found a sigmoidal function relationship between transpiration and LAI in Populus tomentosa Carr, and that transpiration no longer increased with increasing LAI after the threshold of 1.6. Similar findings were also found in studies by Wang et al. [12] and Bucci et al. [80]. This is probably due to the fact that when LAI reaches a certain value, the branches and leaves inside and outside the canopy will shade each other, and the radiation received by the total canopy foliage will not increase further. Similar to the results above, the T and LAI of the three eucalyptus species in this study were well described by the Gompertz model curve (Figure 6). This suggests the T of each species was strongly influenced by LAI that had a species-specific threshold value, beyond which LAI would no longer be a factor influencing their transpiration.

4.3. Daily Stand Transpiration (T) Predictive Models for the Three Eucalyptus Species

Although the stand-level transpiration can be measured in several ways, it is not practical to do so in every stand, nor is it plausible to predict future changes in transpiration for a particular stand [81]. To overcome this problem, the development of transpiration predictive models has become essential [82,83]. From the analysis reported here, it is clear that stand transpiration is usually influenced by a combination of the meteorological factors, SWC and LAI, in tandem; hence, a highly accurate model for predicting stand transpiration depends on at least three prevailing factors: soil moisture, canopy structure, and meteorology [12,20,84]. Many studies introduced such models for various tree species, but most only consider one or two of those key factors. For example, Han et al. [25] developed a transpiration model for a Larix principis-rupprechtii Mayr plantation using only meteorological factors and SWC. Similarly, Jiao et al. [83] also developed a transpiration model for a Robinia pseudocacia L. plantation using only PET (potential evapotranspiration) and SWC. Neither of them considered the possible effect of LAI, which led to an inability to accurately predict transpiration when large changes in LAI occurred. Di et al. [79] built empirical models for predicting transpiration using LAI or LAI-coupled soil temperature for Populus tomentosa Carr plantations during periods of water abundance, but did so without taking into account the effect of soil moisture deficit. Thus, their models are no longer be applicable when soil moisture becomes a limiting factor. Many similar simplified models, which do not couple all the major influences (i.e., meteorological factors, SWC, and LAI), cannot be widely applied in the context of global climate change and under conditions where human management disturbances are changing the structure of forest stands.
In this study, the effects of the meteorological factors SWC and LAI on transpiration were fully considered, and models were accordingly developed to predict the transpiration of the three eucalyptus species. These models accurately predicted the daily transpiration of each species, with a predictive power of 91.1%, 87.2%, and 86.3% for Ep, Ec, and Eug, respectively (Table 3). These models could be used to reliably predict the transpiration following changes in canopy structure induced by forest growth and stand management practices, as well as the effects of future global climate change on stand transpiration, being more accurate with a wider range of potential applications than existing models that rely on only one or two of the three predominant factors [12,25]. Nonetheless, there are some limitations to our modeling, as it is based on data from only one test site, and the species-specific models still require optimization and enhancement with data from a wider range of areas and environments, which in turn will increase the reliability of their estimates and applicable areas [20,85]. Therefore, more research is needed to refine and improve the application of our models.

5. Conclusions

In plantations of eucalyptus in southern China, we found that the transpiration of all three species was influenced by a combination of the meteorological factors, SWC and LAI, and that how much T responded to each influencing factor differed among the three species. To understand and predict the variation in transpiration of the three eucalyptus species, we integrated meteorological factors, LAI and SWC to develop species-specific models for predicting their T, which explained 86.3%–91.1% of the highly dispersed variation in their daily transpiration. In addition, when controlled by the same environmental factors, all three eucalyptus species exhibited the same seasonal pattern of variation in sap flow density and transpiration. However, there were also significant differences in sap flow density and transpiration among the three eucalyptus species due to differences in their physiology and stand structural characteristics. We determined that the annual transpiration of Ep (743.41 mm) was 2.4 and 1.5 times higher than that of Ec (311.52 mm) and Eug (493.58 mm), respectively, while the mean annual sap flow density of Ec (0.08 cm min−1) was significantly lower than that of Ep (0.11 cm min−1), but significantly greater than that of Eug (0.042 cm min−1). Furthermore, although the percentage of annual transpiration to precipitation was small for all three eucalyptus species, it increased to 117.7% (Ep), 49.1% (Ec), and 80.1% (Eug) during the dry season, with Ep imposing the highest hydrological burden on the planted area during the dry season, followed by Eug, and Ec the least. The results of this study can assist in the prediction of eucalyptus trees’ transpiration, while the findings also imply that it is necessary to consider interspecific differences when estimating transpiration in Chinese eucalyptus plantations, and that evaluation of the impact of water use on regional water resources is necessary to select the most optimal regional eucalypt plantation species.

Author Contributions

Idea and study design, A.D. and Z.W.; data collection and analysis, Z.W., Y.X., W.Z., S.L. and A.D.; manuscript writing, Z.W. All authors have read and agreed to the published version of the manuscript.

Funding

This research was funded by the Natural Science Foundation of Guangdong Province (2021A1515010560), the Forestry Science and Technology Innovation Project of Guangdong Province (2018KJCX014), the Forestry Ecological Monitoring Network Platform Construction Project (2021CG535), and the Operation Project for Guangdong Zhanjiang Eucalyptus Forest Ecosystem National Positioning Observation and Research Station (2022132113).

Data Availability Statement

Some or all relevant data during the study are available from the corresponding author by request.

Acknowledgments

The authors also appreciate the South China Experiment Nursery for support during the selection of suitable plots for this study.

Conflicts of Interest

We declare that we have no financial and personal relationships with other people or organizations that can inappropriately influence our work, there is no professional or other personal interest of any nature or kind in any product, service and/or company that could be construed as influencing the position presented in, or the review of, the manuscript entitled “Differences in transpiration and water consumption characteristics among species of Eucalyptus on the Leizhou Peninsula, southern China”.

References

  1. National Forestry and Grassland Administration. 2014–2018 China Forest Resources Report; China Forestry Publishing House: Beijing, China, 2019. [Google Scholar]
  2. Morris, J.; Ningnan, Z.; Zengjiang, Y.; Collopy, J.; Daping, X. Water use by fast-growing Eucalyptus urophylla plantations in southern China. Tree Physiol. 2004, 24, 1035–1044. [Google Scholar] [CrossRef] [PubMed]
  3. Ouyang, L.; Zhao, P.; Zhou, G.; Zhu, L.; Huang, Y.; Zhao, X.; Ni, G. Stand-scale transpiration of a Eucalyptus urophylla × Eucalyptus grandis plantation and its potential hydrological implication. Ecohydrology 2018, 11, e1938. [Google Scholar] [CrossRef]
  4. Cabral, O.M.R.; Rocha, H.R.; Gash, J.H.C.; Ligo, M.A.V.; Freitas, H.C.; Tatsch, J.D. The energy and water balance of a Eucalyptus plantation in southeast Brazil. J. Hydrol. 2010, 388, 208–216. [Google Scholar] [CrossRef]
  5. Jackson, R.B.; Jobbágy, E.G.; Avissar, R.; Roy, S.B.; Barrett, D.J.; Cook, C.W.; Farley, K.A.; Maitre, D.C.L.; McCarl, B.A.; Murray, B.C. Trading Water for Carbon with Biological Carbon Sequestrationy. Science 2005, 310, 1944–1947. [Google Scholar] [CrossRef] [PubMed]
  6. Bosch, J.M.; Hewlett, J.D. A review of catchment experiments to determine the effects of vegetation changes on water yield and evapotranspiration. J. Hydrol. 1982, 55, 3–23. [Google Scholar] [CrossRef]
  7. Scott, D.F.; Lesch, W. Streamflow responses to afforestation with Eucalyptus grandis and Pinus patula and to felling in the Mokobulaan experimental catchments, South Africa. J. Hydrol. 1997, 199, 360–377. [Google Scholar] [CrossRef]
  8. Buckley, T.N.; Turnbull, T.L.; Pfautsch, S.; Gharun, M.; Adams, M.A. Differences in water use between mature and post-fire regrowth stands of subalpine Eucalyptus delegatensis R. Baker. For. Ecol. Manag. 2012, 270, 1–10. [Google Scholar] [CrossRef]
  9. Lane, P.N.J.; Morris, J.; Zhang, N.; Zhou, G.; Zhou, G.; Xu, D. Water balance of tropical eucalypt plantations in south-eastern China. Agric. For. Meteorol. 2004, 124, 253–267. [Google Scholar] [CrossRef]
  10. Soares, J.V.; Almeida, A.C. Modeling the water balance and soil water fluxes in a fast growing Eucalyptus plantation in Brazil. J. Hydrol. 2001, 253, 130–147. [Google Scholar] [CrossRef]
  11. Ouyang, S.; Xiao, K.; Zhao, Z.; Xiang, W.; Xu, C.; Lei, P.; Deng, X.; Li, J. Stand transpiration estimates from recalibrated parameters for the granier equation in a Chinese Fir (Cunninghamia lanceolata) plantation in southern China. Forests 2018, 9, 162. [Google Scholar] [CrossRef] [Green Version]
  12. Wang, Y.; Cao, G.; Wang, Y.; Webb, A.A.; Yu, P.; Wang, X. Response of the daily transpiration of a larch plantation to variation in potential evaporation, leaf area index and soil moisture. Sci. Rep. 2019, 9, 4697. [Google Scholar] [CrossRef]
  13. Aranda, I.; Forner, A.; Cuestaa, B.; Valladares, F. Species-specific water use by forest tree species: From the tree to the stand. Agric. Water Manag. 2012, 114, 67–77. [Google Scholar] [CrossRef]
  14. Hu, Y.; Zhao, P.; Huang, Y.; Zhu, L.; Ni, G.; Zhao, X.; Huang, Z. Hydrologic balance, net primary productivity and water use efficiency of the introduced exotic Eucalyptus grandis × Eucalyptus urophylla plantation in south-western China. J. Plant Ecol. 2019, 12, 982–992. [Google Scholar] [CrossRef]
  15. Ouyang, L.; Wu, J.; Zhao, P.; Zhu, L.; Ni, G. Stand age rather than soil moisture gradient mainly regulates the compromise between plant growth and water use of Eucalyptus urophylla in hilly South China. Land Degrad. Dev. 2021, 32, 2423–2436. [Google Scholar] [CrossRef]
  16. Wingfield, M.J.; Brockerhoff, E.G.; Wingfield, D.; Slippers, B. Planted forest health: The need for a global strategy. Science 2015, 349, 832–836. [Google Scholar] [CrossRef] [PubMed]
  17. Ewers, B.E.; Mackay, D.S.; Gower, S.T.; Ahl, D.E.; Burrows, S.N.; Samanta, S.S. Tree species effects on stand transpiration in northern Wisconsin. Water Resour. Res. 2002, 38, 8-1–8-11. [Google Scholar] [CrossRef]
  18. Siddiq, Z.; Zhang, Y.; Zhu, S.; Cao, K. Canopy water status and photosynthesis of tropical trees are associated with trunk sapwood hydraulic properties. Plant Physiol. Biochem. 2019, 139, 724–730. [Google Scholar] [CrossRef]
  19. Siddiq, Z.; Cao, K.-F. Nocturnal transpiration in 18 broadleaf timber species under a tropical seasonal climate. For. Ecol. Manag. 2018, 418, 47–54. [Google Scholar] [CrossRef]
  20. Wang, L.; Liu, Z.; Guo, J.; Wang, Y.; Ma, J.; Yu, S.; Yu, P.; Xu, L. Estimate canopy transpiration in larch plantations via the interactions among reference evapotranspiration, leaf area index, and soil moisture. For. Ecol. Manag. 2021, 481, 118749. [Google Scholar] [CrossRef]
  21. Xu, Z.; Man, X.; Cai, T.; Shang, Y. How Potential Evapotranspiration Regulates the Response of Canopy Transpiration to Soil Moisture and Leaf Area Index of the Boreal Larch Forest in China. Forests 2022, 13, 571. [Google Scholar] [CrossRef]
  22. Adil, B.; Hicham, F.; Ahmed, M.S.K.; Sanae, C.; Allal, S.; Mhamed, M.; Hassan, M. Study of Microclimate and Sapling Citrus Plant Transpiration in Tunnel Greenhouse Under Mediterranean Conditions. Acta Tech. Agric. 2022, 2, 61–66. [Google Scholar] [CrossRef]
  23. Abreu, M.C.; Soares, A.A.V.; de Freitas, C.H.; Martins, F.B. Transpiration and growth responses by Eucalyptus species to progressive soil drying. J. For. Res. 2022, 33, 1529–1543. [Google Scholar] [CrossRef]
  24. Lyu, J.; He, Q.; Chen, Q.; Cheng, R.; Li, G.; Otsuki, K.; Yamanaka, N.; Du, S. Distinct transpiration characteristics of black locust plantations acclimated to semiarid and subhumid sites in the Loess Plateau, China. Agric. Water Manag. 2022, 262, 107402. [Google Scholar] [CrossRef]
  25. Han, C.; Chen, N.; Zhang, C.; Liu, Y.; Khan, S.; Lu, K.; Li, Y.; Dong, X.; Zhao, C. Sap flow and responses to meteorological about the Larix principis-rupprechtii plantation in Gansu Xinlong mountain, northwestern China. For. Ecol. Manag. 2019, 451, 117519. [Google Scholar] [CrossRef]
  26. Tu, J.; Wei, X.; Huang, B.; Fan, H.; Jian, M.; Li, W. Improvement of sap flow estimation by including phenological index and time-lag effect in back-propagation neural network models. Agric. For. Meteorol. 2019, 276, 107608. [Google Scholar] [CrossRef]
  27. Oogathoo, S.; Houle, D.; Duchesne, L.; Kneeshaw, D. Vapour pressure deficit and solar radiation are the major drivers of transpiration of balsam fir and black spruce tree species in humid boreal regions, even during a short-term drought. Agric. For. Meteorol. 2020, 291, 108063. [Google Scholar] [CrossRef]
  28. Urban, J.; Rubtsov, A.V.; Urban, A.V.; Shashkin, A.V.; Vera, E.B. Canopy transpiration of a Larix sibirica and Pinus sylvestris forest in Central Siberia. Agric. For. Meteorol. 2019, 271, 64–72. [Google Scholar] [CrossRef]
  29. Heidi, H.; Michael, H.A.; Susan, C.; Michael, C.; Sjirk, G.; Coert, J.G.; Graham, H.; Brett, P.H.; Wayne, J.; Jan-Hendrik, K.; et al. Eucalyptus camaldulensis in South Africa—Past, present, future. Trans. R. Soc. South Afr. 2020, 75, 1–22. [Google Scholar] [CrossRef]
  30. Yang, G.; Lu, W.; Lin, Y.; Luo, J.; Wang, C.; Meder, R.; Warburton, P.M.; Arnold, R.J. Monitoring water potential and relative water content in eucalyptus camaldulensis using near infrared spectroscopy. J. Trop. For. Sci. 2017, 29, 121–128. [Google Scholar]
  31. Saravanan, T.; Roger, J.A.; Luo, J.; Bala, R.T. Genomic studies reveal substantial dominant effects and improved genomic predictions in an open-pollinated breeding population of Eucalyptus pellita. G3 Genes Genomes Genet. 2020, 10, 3751–3763. [Google Scholar] [CrossRef]
  32. Wirabuana, P.Y.A.P.; Sadono, R.; Juniarso, S. Fertilization Effects on Early Growth, Aboveground Biomass, Carbon Storage, and Leaf Characteristics of Eucalyptus pellita F. Muell. in South Sumatera. J. Man. Hut. Trop. 2019, 25, 154. [Google Scholar] [CrossRef] [Green Version]
  33. Xu, Y.; Du, A.; Wang, Z.; Zhu, W.; Li, C.; Wu, L. Effects of different rotation periods of Eucalyptus plantations on soil physiochemical properties, enzyme activities, microbial biomass and microbial community structure and diversity. For. Ecol. Manag. 2020, 456, 117683. [Google Scholar] [CrossRef]
  34. IUSS Working Group WRB. World reference base for soil resource 2006. In World Soil Resources Reports No. 103, 2nd ed.; FAO: Rome, Italy, 2006. [Google Scholar]
  35. Campbell, G.S.; Norman, J. An Introduction to Environmental Biophysics, 2nd ed.; Springer: New York, NY, USA, 1998. [Google Scholar]
  36. Granier, A. Evaluation of transpiration in a Douglas-fir stand by means of sap flow measurements. Tree Physiol. 1987, 3, 309–320. [Google Scholar] [CrossRef]
  37. Lu, P.; Urban, L.; Zhao, P. Granier’s Thermal Dissipation Probe (TDP) Method for Measuring Sap Flow in Trees: Theory and Practice. Acta Bot. Sin. 2004, 46, 631–646. [Google Scholar] [CrossRef]
  38. Vertessy, R.A.; Benyon, R.G.; O’Sullivan, S.K.; Gribben, P.R. Relationships between stem diameter, sapwood area, leaf area and transpiration in a young mountain ash forest. Tree Physiol. 1995, 15, 559–567. [Google Scholar] [CrossRef] [PubMed]
  39. Nadezhdina, N. Sap flow index as an indicator of plant water status. Tree Physiol. 1999, 19, 885–891. [Google Scholar] [CrossRef]
  40. Peng, X.; Jun, F.; Wang, Q.; Warrington, D. Discrepancy of sap flow in Salix matsudana grown under different soil textures in the water-wind erosion crisscross region on the Loess Plateau. Plant Soil 2015, 390, 383–399. [Google Scholar] [CrossRef]
  41. Ma, C.; Luo, Y.; Shao, M.; Li, X.; Sun, L.; Jia, X. Environmental controls on sap flow in black locust forest in Loess Plateau, China. Sci. Rep. 2017, 7, 13160. [Google Scholar] [CrossRef]
  42. Tie, Q.; Hu, H.; Tian, F.; Guan, H.; Lin, H. Environmental and physiological controls on sap flow in a subhumid mountainous catchment in North China. Agric. For. Meteorol. 2017, 240, 46–57. [Google Scholar] [CrossRef]
  43. Forrester, D.I.; Collopy, J.J.; Morris, J.D. Transpiration along an age series of Eucalyptus globulus plantations in southeastern Australia. For. Ecol. Manag. 2010, 259, 1754–1760. [Google Scholar] [CrossRef]
  44. Cheng, J.; Ou, Y.; Huang, D.; Liu, S.; Li, Y. Sap Flow Characteristics of Four Dominant Tree Species in a Mixed Conifer-broadleaf Forest in Dinghushan. Acta Ecol. Sin. 2015, 35, 4097–4104. [Google Scholar] [CrossRef] [Green Version]
  45. Mitchell, P.J.; Benyon, R.G.; Lane, P.N.J. Responses of evapotranspiration at different topographic positions and catchment water balance following a pronounced drought in a mixed species eucalypt forest, Australia. J. Hydrol. 2012, 440, 62–74. [Google Scholar] [CrossRef]
  46. Macfarlane, C.; Bond, C.; White, D.A.; Grigg, A.H.; Ogden, G.N.; Silberstein, R. Transpiration and hydraulic traits of old and regrowth eucalypt forest in southwestern Australia. For. Ecol. Manag. 2010, 260, 96–105. [Google Scholar] [CrossRef]
  47. Almeida, A.C.; Soares, J.V.; Landsberg, J.J.; Rezende, G.D. Growth and water balance of Eucalyptus grandis hybrid plantations in Brazil during a rotation for pulp production. For. Ecol. Manag. 2007, 251, 10–21. [Google Scholar] [CrossRef]
  48. Hernandez-Santana, V.; Hernandez-Hernandez, A.; Vadeboncoeur, M.A.; Asbjornsen, H. Scaling from single-point sap velocity measurements to stand transpiration in a multispecies deciduous forest: Uncertainty sources, stand structure effect, and future scenarios. Can. J. For. Res. 2015, 45, 1489–1497. [Google Scholar] [CrossRef]
  49. Link, P.; Simonin, K.A.; Maness, H.; Oshun, J.; Dawson, T.; Fung, I. Species differences in the seasonality of evergreen tree transpiration in a Mediterranean climate: Analysis of multiyear, half- hourly sap flow observations. Water Resour. Res. 2014, 50, 1869–1894. [Google Scholar] [CrossRef]
  50. Yan, M.; Zhang, J.; He, Q.; Shi, W.; Otsuki, K.; Yamanaka, N.; Du, S. Sapflow-Based Stand Transpiration in a Semiarid Natural Oak Forest on China’s Loess Plateau. Forests 2016, 7, 227. [Google Scholar] [CrossRef]
  51. Horna, V.; Schuldt, B.; Brix, S.; Leuschner, C. Environment and tree size controlling stem sap flux in a perhumid tropical forest of Central Sulawesi, Indonesia. Ann. For. Sci. 2011, 68, 1027–1038. [Google Scholar] [CrossRef]
  52. Di, N.; Xi, B.; Clothier, B.; Wang, Y.; Li, G.; Jia, L. Diurnal and nocturnal transpiration behaviors and their responses to groundwater-table fluctuations and meteorological factors of Populus tomentosa in the North China Plain. For. Ecol. Manag. 2019, 448, 445–456. [Google Scholar] [CrossRef]
  53. Hatton, T.; Reece, P.; Taylor, P.; McEwan, K. Does leaf water efficiency vary among eucalypts in water-limited environments? Tree Physiol. 1998, 18, 529–536. [Google Scholar] [CrossRef] [PubMed]
  54. Wang, Z.; Xu, Y.; Zhu, W.; Du, A. The transpiration water consumption of two common fast-growing forests in Leizhou Peninsula. Acta Ecol. Sin. 2019, 39, 2147–2155. [Google Scholar] [CrossRef]
  55. Ma, L.; Lu, P.; Zhao, P.; Rao, X.; Cai, X.; Zeng, X. Diurnal, daily, seasonal and annual patterns of sap-flux-scaled transpiration from an Acacia mangium plantation in South China. Ann. For. Sci. 2008, 65, 402. [Google Scholar] [CrossRef]
  56. Tian, Q.; He, Z.; Xiao, S.; Du, J. Growing Season Stem Water Status Assessment of Qinghai Spruce through the Sap Flow and Stem Radial Variations in the Qilian Mountains of China. Forests 2018, 9, 2. [Google Scholar] [CrossRef]
  57. Ghimire, C.P.; Lubczynski, M.W.; Bruijnzeel, L.A.; Chavarro-Rincón, D. Transpiration and canopy conductance of two contrasting forest types in the Lesser Himalaya of Central Nepal. Agric. For. Meteorol. 2014, 197, 76–90. [Google Scholar] [CrossRef]
  58. Wullschleger, S.D.; Wilson, K.B.; Hanson, P.J. Environmental control of whole-plant transpiration, canopy conductance and estimates of the decoupling coefficient for large red maple trees. Agric. For. Meteorol. 2000, 104, 157–168. [Google Scholar] [CrossRef]
  59. White, D.A.; Beadle, C.L.; Worledge, D. Control of transpiration in an irrigated Eucalyptus globulus Labill. plantation. Plant Cell Environ. 2000, 23, 123–134. [Google Scholar] [CrossRef]
  60. Chang, X.; Zhao, W.; Liu, H.; Wei, X.; Liu, B.; He, Z. Qinghai spruce (Picea crassifolia) forest transpiration and canopy conductance in the upper Heihe River Basin of arid northwestern China. Agric. For. Meteorol. 2014, 198, 209–220. [Google Scholar] [CrossRef]
  61. Chen, D.; Wang, Y.; Liu, S.; Wei, X.; Wang, X. Response of relative sap flow to meteorological factors under different soil moisture conditions in rainfed jujube (Ziziphus jujuba Mill.) plantations in semiarid Northwest China. Agri. Water Manag. 2014, 136, 23–33. [Google Scholar] [CrossRef]
  62. Jiao, L.; Lu, N.; Sun, G.; Ward, E.J.; Fu, B. Biophysical controls on canopy transpiration in a black locust (Robinia pseudoacacia) plantation on the semi-arid Loess Plateau, China. Ecohydrology 2016, 9, 1068–1081. [Google Scholar] [CrossRef]
  63. O’Brien, J.J.; Oberbauer, S.F.; Clark, D.B. Whole tree xylem sap flow responses to multiple environmental variables in a wet tropical forest. Plant Cell Environ. 2004, 27, 551–567. [Google Scholar] [CrossRef]
  64. Asbjornsen, H.; Tomer, M.D.; Gomez-Cardenas, M.; Brudvig, L.A.; Greenan, C.M.; Schilling, K. Tree and stand transpiration in a Midwestern bur oak savanna after elm encroachment and restoration thinning. For. Ecol. Manag. 2007, 247, 209–219. [Google Scholar] [CrossRef]
  65. Meinzer, F.C.; Goldstein, G.; Jackson, P.; Holbrook, N.M.; Guti6rrez, M.V.; Cavelier, J. Environmental and physiological regulation of transpiration in tropical forest gap species: The influence of boundary layer and hydraulic properties. Oecologia 1995, 101, 514–522. [Google Scholar] [CrossRef] [PubMed]
  66. Fisher, J.B.; Baldocchi, D.D.; Misson, L.; Dawson, T.E.; Goldstein, A.H. What the towers don’t see at night: Nocturnal sap flow in trees and shrubs at two AmeriFlux sites in California. Tree Physiol. 2007, 27, 597–610. [Google Scholar] [CrossRef] [PubMed]
  67. Zhao, C.; Si, J.; Qi, F.; Yu, T.; Li, P. Effect of wind speed on transpiration rate of Populus euphratica in extreme arid deserts. J. Glaciol. Geocryol. 2015, 37, 1104–1111. [Google Scholar] [CrossRef]
  68. Campbell-Clause, J.M. Stomatal response of grapevines to wind. Aust. J. Exp. Agric. 1998, 38, 77–82. [Google Scholar] [CrossRef]
  69. Gutirrez, M.V.; Meinzer, F.C.; Grantz, D.A. Regulation of transpiration in coffee hedgerows: Covariation of environmental variables and apparent responses of stomata to wind and humidity. Plant Cell Environ. 1994, 17, 1305–1313. [Google Scholar] [CrossRef]
  70. Buckley, T.N.; Turnbull, T.L.; Pfautsch, S.; Adams, M.A. Nocturnal water loss in mature subalpine Eucalyptus delegatensis tall open forests and adjacent E. pauciflora woodlands. Ecol. Evol. 2011, 1, 435–450. [Google Scholar] [CrossRef]
  71. Galmés, J.; Flexas, J.; Savé, R.; Medrano, H. Water relations and stomatal characteristics of Mediterranean plants with different growth forms and leaf habits: Responses to water stress and recovery. Plant Soil 2007, 290, 139–155. [Google Scholar] [CrossRef]
  72. Oren, R.; Pataki, D.E. Transpiration in response to variation in microclimate and soil moisture in southeastern deciduous forests. Oecologia 2001, 127, 549–559. [Google Scholar] [CrossRef] [PubMed]
  73. Bindi, M.; Bellesi, S.; Orlandini, S.; Fibbi, L.; Moriondo, M.; Sinclair, T. Influence of Water Deficit Stress on Leaf Area Development and Transpiration of Sangiovese Grapevines Grown in Pots. Am. J. Enol. Vitic. 2005, 56, 68–72. [Google Scholar] [CrossRef]
  74. Li, Z.; Yu, P.; Wang, Y.; Webb, A.A.; He, C.; Wang, Y.; Yang, L. A model coupling the effects of soil moisture and potential evaporation on the tree transpiration of a semi-arid larch plantation. Ecohydrology 2016, 10, e1764. [Google Scholar] [CrossRef]
  75. Ungar, E.D.; Rotenberg, E.; Raz-Yaseef, N.; Cohen, S.; Yakir, D.; Schiller, G. Transpiration and annual water balance of Aleppo pine in a semiarid region: Implications for forest management. For. Ecol. Manag. 2013, 298, 39–51. [Google Scholar] [CrossRef]
  76. Ayyoub, A.; Er-Raki, S.; Khabba, S.; Merlin, O.; Ezzahar, J.; Rodriguez, J.C.; Bahlaoui, A.; Chehbouni, A. A simple and alternative approach based on reference evapotranspiration and leaf area index for estimating tree transpiration in semi-arid regions. Agric. Water Manag. 2017, 188, 61–68. [Google Scholar] [CrossRef]
  77. Naithani, K.J.; Baldwin, D.C.; Gaines, K.P.; Lin, H.; Eissenstat, D.M. Spatial Distribution of Tree Species Governs the Spatio-Temporal Interaction of Leaf Area Index and Soil Moisture across a Forested Landscape. PLoS ONE 2013, 8, e58704. [Google Scholar] [CrossRef]
  78. Forrester, D.I.; Collopy, J.J.; Beadle, C.L.; Warren, C.R.; Baker, T.G. Effect of thinning, pruning and nitrogen fertiliser application on transpiration, photosynthesis and water-use efficiency in a young Eucalyptus nitens plantation. For. Ecol. Manag. 2012, 266, 286–300. [Google Scholar] [CrossRef]
  79. Di, N.; Wang, Y.; Clothier, B.; Liu, Y.; Jia, L.; Xi, B.; Shi, H. Modeling soil evaporation and the response of the crop coefficient to leaf area index in mature Populus tomentosa plantations growing under different soil water availabilities. Agric. For. Meteorol. 2019, 264, 125–137. [Google Scholar] [CrossRef]
  80. Bucci, S.J.; Scholz, F.G.; Goldstein, G.; Hoffmann, W.A.; Meinzer, F.C.; Franco, A.C.; Giambelluca, T.; Miralles-Wilhelm, F. Controls on stand transpiration and soil water utilization along a tree density gradient in a Neotropical savanna. Agric. For. Meteorol. 2008, 148, 839–849. [Google Scholar] [CrossRef]
  81. Li, L.; Chen, S.; Yang, C.; Meng, F.; Sigrimis, N. Prediction of plant transpiration from environmental parameters and relative leaf area index using the random forest regression algorithm. J. Clean. Prod. 2020, 261, 121136. [Google Scholar] [CrossRef]
  82. Liu, N.; Buckley, T.; He, X.; Zhang, X.; Zhang, C.; Luo, Z.; Wang, H.; Sterling, N.; Guan, H. Improvement of a simplified process-based model for estimating transpiration under water-limited conditions. Hydrol. Process. 2019, 33, 1670–1685. [Google Scholar] [CrossRef]
  83. Jiao, L.; Lu, N.; Fang, W.; Li, Z.; Wang, J.; Jin, Z. Determining the independent impact of soil water on forest transpiration: A case study of a black locust plantation in the Loess Plateau, China. J. Hydrol. 2019, 572, 671–681. [Google Scholar] [CrossRef]
  84. Granier, A.; Loustaub, D.; Bréda, N. A generic model of forest canopy conductance dependent on climate, soil water availability and leaf area index. Ann. For. Sci. 2000, 57, 755–765. [Google Scholar] [CrossRef]
  85. Sawano, S.; Hotta, N.; Tanaka, N.; Tsuboyama, Y.; Suzuki, M. Development of a simple forest evapotranspiration model using a process-oriented model as a reference to parameterize data from a wide range of environmental conditions. Ecol. Modell. 2015, 309, 93–109. [Google Scholar] [CrossRef]
Figure 1. Location of the study area, topography, and mean monthly temperature and precipitation during the monitoring period.
Forests 13 01544 g001
Figure 2. Variation in sapwood area as a function of individual trees’ DBH of three eucalyptus species. Ep, Ec, and Eug represent the eucalyptus species of E. pellita, E. camaldulensis and E. urophylla × E. grandis, respectively. The shaded bands denote the 95% confidence intervals.
Forests 13 01544 g002
Figure 3. Diurnal variation of sap flow density in the three eucalyptus species plantations on sunny days during typical months for the (A) dry and (B) wet season. Ep, Ec, and Eug represent the eucalyptus species of E. pellita, E. camaldulensis, and E. urophylla × E. grandis, respectively.
Forests 13 01544 g003
Figure 4. Panels (A,B) show the (A) variation of JC and the (B) monthly mean for JC in three eucalyptus species’ plantations during the monitoring period. Panels (CE) indicate the mean JC of each species during the (C) dry season, (D) wet season, and (E) throughout the year. Error bars indicate the standard error. Different lowercase letters indicate significant differences (p < 0.05). Ep, Ec, and Eug represent the eucalyptus species of E. pellita, E. camaldulensis, and E. urophylla × E. grandis, respectively.
Forests 13 01544 g004
Figure 5. The relationships between the daily stand transpiration (T, mm day−1) and six environmental factors: (A) solar radiation (Rs, W m−2), (B) vapor pressure deficit (VPD, kPa), (C) air temperature (Ta, °C), (D) air relative humidity (RH, %), (E) wind speed (WS, m s−1), and (F) soil moisture content (SWC, %) during the experimental periods. Ep, Ec, and Eug represent the eucalyptus species of E. pellita, E. camaldulensis, and E. urophylla × E. grandis, respectively.
Forests 13 01544 g005
Figure 6. Response of the daily stand transpiration (T, mm day−1) to the variation in canopy LAI for the three eucalyptus species (the red solid line is the upper boundary line). Ep, Ec, and Eug represent the eucalyptus species of E. pellita, E. camaldulensis, and E. urophylla × E. grandis, respectively.
Forests 13 01544 g006
Figure 7. The predicted T (mm d−1) plotted against the corresponding observed T (mm d−1) for the three eucalyptus species. Note: The dotted line denotes the 1:1 relationship, and the solid line indicates the actual relationship between the predicted and observed values. Ep, Ec, and Eug represent the eucalyptus species of E. pellita, E. camaldulensis, and E. urophylla × E. grandis, respectively.
Forests 13 01544 g007
Table 1. Summary of the stand characteristics of the three experimental plantations of eucalyptus species.
IndexEpEcEug
Age (year)121212
Mean DBH (cm)22.93 ± 1.78 a19.01 ± 1.65 b23.52 ± 1.19 a
Mean height (m)21.67 ± 1.99 b19.77 ± 0.93 b27.1 ± 0.32 a
Stand LAI2.43 ± 0.13 a1.87 ± 0.05 c2.08 ± 0.05 b
Stem density (plants/ha)95010501175
Mean sapwood area (cm2/plant)134.31 ± 18.15 b70.78 ± 7.85 c189.88 ± 12.02 a
Stand sapwood area (m2/ha)12.347.1821.49
Note: Some values in this table are expressed as the mean ± standard error. Ep, Ec, and Eug represent the eucalyptus species of E. pellita, E. camaldulensis, and E. urophylla × E. grandis, respectively. Different lowercase letters indicate significant differences among eucalyptus species (p < 0.05). LAI: leaf area index.
Table 2. Summary of stand-level canopy transpiration values for the three eucalyptus species plantations at different time scales.
SpeciesEpEcEugPrecipitation
(mm)
Time ScaleMonthly Water Use (mm)Daily Mean Water Use (mm/d)Monthly Water Use (mm)Daily Mean Water Use (mm/d)Monthly Water Use (mm)Daily Mean Water Use (mm/d)
Jan47.851.54 ± 0.07 cd/A16.090.52 ± 0.03 d/C35.731.15 ± 0.07 bc/B27.6
Feb48.971.69 ± 0.08 cd/A18.840.65 ± 0.05 d/C30.141.04 ± 0.06 bc/B48.9
Mar49.371.59 ± 0.11 cd/A18.900.61 ± 0.05 d/C32.811.06 ± 0.08 bc/B46.6
Apr45.631.52 ± 0.16 cd/A21.130.70 ± 0.06 cd/B31.411.05 ± 0.10 bc/B112.3
May85.002.74 ± 0.09 a/A33.591.08 ± 0.04 ab/C66.242.14 ± 0.07 a/B58.8
Jun84.762.83 ± 0.11 a/A32.421.08 ± 0.04 ab/C58.181.94 ± 0.09 a/B121.6
Jul91.922.97 ± 0.06 a/A38.551.24 ± 0.03 a/C56.291.82 ± 0.04 a/B121.3
Aug68.082.20 ± 0.18 b/A28.660.92 ± 0.07 bc/B40.571.31 ± 0.10 b/B282.8
Sep66.672.22 ± 0.11 b/A27.850.93 ± 0.05 b/C38.431.28 ± 0.07 b/B373.3
Oct60.091.94 ± 0.12 bc/A30.931.00 ± 0.06 b/B38.491.24 ± 0.08 b/B260.7
Nov55.261.84 ± 0.06 bc/A26.780.89 ± 0.03 bc/C38.231.27 ± 0.05 b/B6.9
Dec39.811.28 ± 0.08 d/A17.780.57 ± 0.04 d/C27.060.87 ± 0.05 c/B1.5
Monthly mean61.95 A——25.96 C——41.13 B——121.86
Annual total743.412.03 ± 0.04 A311.520.85 ± 0.02 C493.581.35 ± 0.03 B1462.3
Dry season total286.891.58 ± 0.04 A119.520.66 ± 0.02 C195.381.07 ± 0.03 B243.8
Wet season total456.522.48 ± 0.05 A192.001.04 ± 0.02 C298.201.62 ± 0.04 B1218.5
Note: Some values in this table are the mean ± standard error. Ep, Ec, and Eug represent the eucalyptus species of E. pellita, E. camaldulensis, and E. urophylla × E. grandis, respectively. Different lowercase letters indicate significant differences between different months for each eucalyptus species (p < 0.05). Different capital letters indicate significant differences among eucalyptus species within the same month or season or year (p < 0.05).
Table 3. The integrated model for predicting daily stand transpiration (T) of three eucalyptus species.
Eucalyptus SpeciesPredictive Model of TR2nSig.
EpT = −1.9 × 10⁻⁵Rs2 + 0.0153Rs + 2.05 × 10⁻³Ta2 − 0.0586Ta − 8.57 × 10⁻⁴RH2 + 0.119 RH + 1.03× 10⁷exp(−SWC/0.9655) + 0.161exp(−exp(−4.35(LAI − 2.044))) − 3.5150.9113050.000
EcT = −9.19 × 10⁻⁶Rs2 + 5.91 × 10⁻³Rs − 0.224VPD2 + 0.78VPD − 6.22 × 10⁻⁴Ta2 + 0.016 Ta + 1.97× 10⁹exp(−SWC/0.6893) + 0.514 exp(−exp(−7.45(LAI − 1.575))) − 0.5680.8723050.000
EugT = −1.01 × 10⁻⁵Rs2 + 7.76 × 10⁻³Rs − 0.202VPD2 + 0.97VPD + 5.85 × 10⁸exp(−SWC/0.7999) + 0.822exp(−exp(−0.858(LAI − 1.561))) − 0.5410.8633050.000
Note: Ep, Ec, and Eug represent the eucalyptus species of E. pellita, E. camaldulensis, and E. urophylla × E. grandis, respectively. T: daily stand transpiration (mm day−1), Rs: solar radiation (W m−2), Ta: air temperature (°C), RH: relative humidity (%), VPD: vapor pressure deficit (kPa), SWC: soil water content (%), LAI: leaf area index, n: data for the multiple linear regression model, Sig.: significance of the data.
Publisher’s Note: MDPI stays neutral with regard to jurisdictional claims in published maps and institutional affiliations.

