Article

Antagonistic Potential of Native Trichoderma spp. against Phytophthora cinnamomi in the Control of Holm Oak Decline in Dehesas Ecosystems

by
Francisco J. Ruiz-Gómez
*,† and
Cristina Miguel-Rojas
*,†
Construction Engineering, University of Córdoba, Ed. Leonardo Da Vinci, Campus of Rabanales, 14071 Córdoba, Spain
*
Authors to whom correspondence should be addressed.
Both authors equally contributed to the work.
Forests 2021, 12(7), 945; https://doi.org/10.3390/f12070945
Submission received: 3 June 2021 / Revised: 14 July 2021 / Accepted: 15 July 2021 / Published: 17 July 2021
(This article belongs to the Special Issue Adaptive Forest Management to Climatic Change)

Abstract

:
Phytophthora root rot caused by the pathogen Phytophthora cinnamomi is one of the main causes of oak mortality in Mediterranean open woodlands, the so-called dehesas. Disease control is challenging; therefore, new alternative measures are needed. This study focused on searching for natural biocontrol agents with the aim of developing integrated pest management (IPM) strategies in dehesas as a part of adaptive forest management (AFM) strategies. Native Trichoderma spp. were selectively isolated from healthy trees growing in damaged areas by P. cinnamomi root rot, using Rose Bengal selective medium. All Trichoderma (n = 95) isolates were evaluated against P. cinnamomi by mycelial growth inhibition (MGI). Forty-three isolates presented an MGI higher than 60%. Twenty-one isolates belonging to the highest categories of MGI were molecularly identified as T. gamsii, T. viridarium, T. hamatum, T. olivascens, T. virens, T. paraviridescens, T. linzhiense, T. hirsutum, T. samuelsii, and T. harzianum. Amongst the identified strains, 10 outstanding Trichoderma isolates were tested for mycoparasitism, showing values on a scale ranging from 3 to 4. As far as we know, this is the first report referring to the antagonistic activity of native Trichoderma spp. over P. cinnamomi strains cohabiting in the same infected dehesas. The analysis of the tree health status and MGI suggest that the presence of Trichoderma spp. might diminish or even avoid the development of P. cinnamomi, protecting trees from the worst effects of P. cinnamomi root rot.

1. Introduction

Soil microbes are key elements regulating ecological functions in natural ecosystems. Soil biodiversity is a relevant ecosystem characteristic, influencing plant diversity, soil component cycles, and pathogen control [1]. The specific composition of the microbial community and its biodiversity are directly related to the phytosanitary status of the plant community [2,3], not only influenced by the presence of soil pathogens but also by beneficial species such as ectomycorrhizae (EcM), arbuscular mycorrhizae (AM), or nitrogen-fixing bacteria. This beneficial community plays a variety of roles, including enhancement of water and nutrient uptake of roots, plant pest or plant pathogen control, and improvement in soil fertility and nutrient availability [4,5]. In other words, the soil microbial community plays a fundamental role in the health and the resilience of forest ecosystems facing biotic and abiotic changes related to global change [6,7].
In recent decades, plant diseases caused by different Phytophthora species have been widely spread across the world, currently being a major challenge for the conservation of several natural ecosystems [8,9,10]. Oaks are threatened worldwide by these pathogens, with examples of Phytophthora-related diseases in very contrasting ecosystems, from hot semi-arid to cold continental ones, and affecting more than 15 different oak species, ranging from temperate species such as Quercus petraea (Matt), Liebl, to xeric ones such as holm oak (Quercus ilex L.) [11]. Holm oak is also one of the most widespread Quercus species in the Northern Hemisphere, being naturally distributed though the Mediterranean basin countries. It is also one of the most threatened oak species by the root rot caused by soil-borne oomycetes [12].
In particular, Mediterranean open woodlands of holm oaks (hereinafter dehesas) are key ecosystems in the southwest Iberian Peninsula, due to their high ecological and socioeconomical relevance [12]. More than 3 million ha of this savannah-like Mediterranean ecosystem are threatened by the oak decline in Spain, causing the loss of mature and young trees coming from natural reproduction or afforestation [13,14]. One of the main causes of the oak mortality in dehesas is the root rot caused by the aggressive pathogen Phytophthora. cinnamomi Rands [15]. This oomycete is considered one of the most devastating and widespread soil-borne pathogens in the world, affecting species of relevance in the agronomic and forestry fields. The introduction of the invasive alien pathogen P. cinnamomi into natural ecosystems has led to destructive effects on the environment and the biodiversity of the fauna and flora [16,17]. Phytophthora is a genus belonging to the class Oomycetes in the phylum Pseudofungi, a group of fungus-like organism characterized by the production of motile zoospores, which are the main infective agent that initiates plant disease [17]. Their control is quite challenging due to the limited availability of efficient chemical inhibitors [17] and, particularly in our case, due to the restrictions of chemical treatments in forest ecosystems. For this reason, the development of sustainable control measures of P. cinnamomi based on the control of soil microbiota diversity and composition would play a key role in the implementation of integrated pest management (IPM) strategies in dehesas. IPM is an illustrative example of adaptive management in the agricultural domain [18], being a pivotal tool for the implementation of adaptive forest management (AFM) facing global change in dehesa ecosystems, due to its agroforestry character, and the need for ecologically friendly solutions facing holm oak decline.
In this regard, Trichoderma is a genus with high potential in biological control and IPM implementation. This genus shows several antagonist and parasitic relationships against many Phytophthora spp. [19,20]. The genus Trichoderma comprises several opportunistic, avirulent plant symbionts, being major colonizers of soils in all types of ecosystems [20]. As a result of their parasitic and antagonistic potential against phytopathogens, some Trichoderma strains are well known as proficient biocontrol agents, being able to decrease the severity of plant diseases, primarily in the soil or on plant roots [19]. To date, much research has confirmed the role of Trichoderma spp. In controlling or even reducing Phytophthora-related diseases [21,22,23,24,25,26].
The antagonistic effect of Trichoderma spp. over Phytophthora spp. development is mostly related to the reduction in their mycelial growth because of different interactions: (i) competition for resources in the soil community; (ii) plant root colonization; (iii) plant growth promotion; and (iv) induction of plant defense responses [20]. Additionally, the genus Trichoderma includes some species such as T. virens, T. reesei, T. atroviride, T. harzianum, and T. brevicompactum with the ability to act as mycoparasites [27,28,29,30]. Moreover, it is known that P. cinnamomi is a poor competitor under saprophytic conditions [31], making the existence of diverse mechanisms of antagonism possible, depending on the diversity and composition of the Trichoderma spp. community, including direct interactions such as interspecific competition, antibiosis, or predation, and indirect ones such as plant health status improvement or niche displacement.
The influence of the soil microbial community composition on the health status of trees has been identified in holm oak decline syndrome. Highly mycorrhized holm oaks growing in soils infested by P. cinnamomi showed a better performance when compared with others with a scarcity or absence of EcM in their roots [32]. In a previous work, we found relationships between the composition of fungal and oomycete communities in the soil, amongst them and with the declining status of holm oaks [33]. Holm oak is a species with high intrapopulation variability levels [34,35], making the presence of different interaction levels with Trichoderma spp. in trees growing in the same location possible, depending on the genetic characteristics of the host.
On the other hand, we must consider that biocontrol strategies based on living organisms are controversial, mostly due to the probability of niche invasion and the displacement of other beneficial species [36]. For this reason, the use of biocontrol organisms in natural ecosystems is not often considered. Therefore, to search for native Trichoderma spp. protecting healthy plants in soils affected by the pathogen would be a good strategy to isolate potential antagonists against P. cinnamomi, and to develop biocontrol strategies compatible with the biological balance of the soil.
Based on our previous research and results, the aim of this work was to (i) screen, isolate, and identify the native Trichoderma spp. taxa, previously detected through metabarcoding techniques, (ii) evaluate, in vitro, their biological activity against P. cinnamomi, and (iii) analyze the relationships between the defoliation of trees and the potential inhibition rates of the isolated Trichoderma spp. against P. cinnamomi. We hypothesize that the native Trichoderma spp. strains isolated under healthy trees growing in areas with P. cinnamomi root rot should present antagonism with this pathogen, protecting trees from their infection effects. The identification of those strains as biocontrol agents might open new research lines, such as identifying the specific interaction mechanisms between Trichoderma spp. and holm oak, or considering the potential of new biocontrol formulations to reduce the dispersal of P. cinnamomi and their environmental damage in dehesa ecosystems.

2. Materials and Methods

2.1. Experimental Design and Sample Collection

The fungal and oomycete communities of the rhizosphere of Quercus ilex trees located in 25 different dehesas were characterized through metabarcoding techniques [33]. To carry out the present work, some of the previously evaluated trees were selected according to the following characteristics: (i) trees growing in a plot with positive isolation of Phytophthora cinnamomi according to the data of the SEDA Network (http://www.juntadeandalucia.es/medioambiente/site/rediam, accessed on 11 January 2021) and to Ruiz-Gómez et al. [33]; (ii) mean holm oak defoliation of plots (sensu Echorn et al. [37]) increasing after 4 years; and (iii) trees with positive detection of Trichoderma sp. OTU#51 DNA on their rhizosphere and low frequency or null identification of P. cinnamomi DNA. Up to 11 trees were found to meet these characteristics in 6 different locations (Table 1).
The status of the tree and the plot regarding the crown defoliation in 2019 was classified as high and low defoliated. A threshold was established at 25% of defoliation, which corresponds to the upper limit of the level 1 class on the qualitative scale of crown condition [37].
In March 2019, a field campaign was carried out to take samples of the soil rhizosphere of the 11 selected trees. For each tree, soil samples were collected following the procedure described in Zamora-Rojas et al. [38], but focusing on the north side, in agreement with the results of Sánchez-Cuesta et al. [14], in order to maximize the probability of finding P. cinnamomi. Samples were stored in a sealed plastic bag and conserved at 4 °C during transportation to the laboratory.

2.2. Trichoderma and Phytophthora Isolation

Trichoderma spp. were isolated from the soil rhizosphere samples taken under trees selected in Table 1. Approximately 2 kg of soil samples was carefully transferred into plastic bags and stored with ice until being transported to the laboratory. Samples were processed within 24 h as follows: firstly, samples were homogenized and spread on a tray to remove the plant material; then, samples were air dried for 24 h, sifted with 2 mm mesh sieves, and stored at 4 °C until needed. Serial dilutions of soil samples were performed to isolate Trichoderma spp. as previously described by Hirte [39] and Vargas et al. [40], with minor modifications: the concentration of soil samples was 6 g/100 mL, dilution factors were 10−2 and 10−3, and aliquots added 500 μL. The soil suspension aliquots were spread onto Trichoderma-selective medium (TSM) [41] containing only chloramphenicol, streptomycin sulphate, and quintozene as antimicrobial components. After two days of incubation in darkness, the species of the genus Trichoderma were selected based on colony morphology and microscopic observations. Pure cultures were obtained after subculturing on Potato Dextrose Agar plates (PDA, Difco Laboratories Inc., Detroit, MI, USA) amended with chloramphenicol (250 mg/L).
Phytophthora spp. and Pythium spp. were isolated from soil samples through soil baiting and PARPBH selective culture media [42,43]. Colonies were grown in Carrot Agar (CA) and Potato Dextrose Agar (PDA, Difco Laboratories Inc.). Classification of the isolates at the genus level was carried out on the basis of microscopic identification of some of their morphological characteristics.

2.3. Mycelial Growth Inhibition

Trichoderma spp. native isolates were evaluated in vitro for their antagonistic activity against the P. cinnamomi P90 isolate (mating type A2, ISO 9001/17025; NBT Laboratories New Biotechnics, Seville, Spain) and a native strain isolated from the HU1027 #18 plot using the dual culture test following Rahman et al. [44]. Briefly, mycelial disks of 5 mm diameter from the edge of actively growing colonies of each antagonist and pathogen were placed at opposite sites on a 9 cm diameter PDA plate (2 cm from the border). The pathogen alone on the plate was used as control. A complete randomized experimental design was used with four Petri dishes for each antagonist. Plates were incubated in the dark at 21 °C for one week. After incubation, the radii of Phytophthora colonies facing the antagonists were measured and used for calculation of the inhibition rate [45]. The percentage of the mycelial growth inhibition (MGI) rate was calculated by using Equation (1):
MGI = (C−T)/C × 100
where MGI is the mycelial growth inhibition rate (%), C is the growth radius of the pathogen when alone, and T is the growth radius of the pathogen when co-cultured with antagonists [45].
The antagonistic levels were classified as follows: low, MGI ≤ 50%; medium, 50% < MGI ≤ 60%; high, 60% < MGI ≤ 75%; very high, MGI > 75%. The first assay included all Trichoderma strains, which were tested against the P. cinnamomi P90 isolate. As a result of this assay, outstanding strains, based on antagonistic rates (MGI high or very high), were selected, and in a second assay, their antagonism behavior was confirmed when confronted with the P. cinnamomi native isolate in the HU1027 plot. Experiments were performed three times.

2.4. Mycoparasitism

Mycoparasitism was evaluated on the same dual culture plates used to evaluate MGI, as overgrowth and sporulation of the Trichoderma strains on P. cinnamomi colonies. Their antagonistic activities were classified into four classes based on a visual scale (0: no invasion of the pathogen colony, 1: invasion of 1/4 of the pathogen colony, 2: invasion of 1/2 of the pathogen colony, 3: total invasion of the pathogen colony, 4: total invasion and sporulation) [46]. Microscopic preparations were produced from the interaction zone between the antagonist fungus and the pathogen isolate at early stages of dual culture growth to search for coiling and short loops around the pathogen’s hyphae. Observations were performed under an optical microscope (40X objective, Nikon, Eclipse 50i) connected to a camera (Nikon DS-Fi1).

2.5. Molecular Identification of Trichoderma and Phytophthora Strains

Due to the high number of different Trichoderma spp. morphotypes isolated from the samples, only strains presenting an MGI above 60% were subjected to molecular identification. This identification was based on the amplification and sequencing of fragments of two protein-coding genes: RNA polymerase II subunit (rpb2), and translation elongation factor 1α (EF-1α, tef1). Phytophthora identification was performed amplifying the nuclear ribosomal internal transcribed spacer (ITS) regions 1 and 2. Mycelium for DNA extraction was grown on PDA plates. Genomic DNA was extracted using the Plant DNeasy Mini kit (Qiagen, Germany) according to the manufacturer’s instructions. A 1.30 kb fragment of the tef1 gene of Trichoderma strains was amplified using the primer pairs EF1728F (5′-CATCGAGAAGTTCGAGAAGG-3′) [47] and TEF1LLEREV (5′-AACTTGCAGGCAATGTGG-3′) [48]. This fragment includes the fourth and the fifth intron and a part of the last large exon. A 1.24 fragment of the rpb2 gene was amplified using the primer pairs fRPB2-5f (5′-GA(T/C)GA(T/C)(A/C)G(A/T)GATCA(T/C)TT(T/C)GG-3′) and fRPB2-7cr (5′-CCCAT(A/G)GCTTG(T/C)TT(A/G)CCCAT-3′) [49]. A 330 bp fragment of the ITS region of oomycete strains (Phytophthora and Pythyum) was amplified using the primer pairs ITS6 (5′-GAAGGTGAAGTCGTAACAAGG-3′) and ITS7 (5′-AGCGTTCTTCATCGATGTGC-3′) [50]. PCR products were purified using the FavorPrepTM purification kit (FAVORGEN, Taiwan, China). DNA was Sanger sequenced at Stab Vida company (Caparica, Portugal) with the same forward primers as in PCR, or with the internal primers TEF1 and TEF2 for the tef1 gene [51]. Sequences were subjected to BLAST analysis at NCBI (https://blast.ncbi.nlm.nih.gov/Blast.cgi, accessed on 22 December 2020). Phytophthora sequences were also submitted to the Phytophthora database (http://www.phytophthoradb.org/, accessed on 18 December 2020).

2.6. Tree Defoliation Data Collection

Crown defoliation values (sensu Eichorn et al. [37]) for all the trees of the selected plots were obtained from the public dataset available at the repository of the SEDA Network (ICP Forest Level I Monitoring Network, http://www.juntadeandalucia.es/medioambiente/site/rediam, accessed on 11 January 2021). Defoliation data of the period 2015–2019 were filtered for all the trees of selected plots, and the differences in the evolution of defoliation among selected trees and the rest of the trees of the plots (plot average) were evaluated. The increment in defoliation (ΔDef) was calculated by subtracting the defoliation of 2015 from the defoliation of 2019.

2.7. Statistical Analysis

The normality and homoscedasticity of defoliation values were checked, and two-way ANOVA was carried out considering plot and class as factors, where class indicates if the tree belongs to the selected ones or not.
The mycelial growth inhibition (MGI) rate was arcsin transformed prior to statistical analysis, avoiding normality and homoscedasticity problems derived from percentile-type data [52]. Significant differences were compared by ANOVA followed by a pairwise t-test with Bonferroni’s correction, or through a t-test when the independent variable was bimodal. The null hypothesis was always rejected when significance was lower than 5% (p < 0.05).
All the data processing steps and statistical analyses were carried out in the environment R version 4.0.2 [53] running on RStudio 1.1 [54]. Two-way ANOVA was carried out with the help of the package “agricolae” [55]. Other packages used were “nortest” “dplyr”, “car”, “dunn.test”, “rstatix”, and “ggplot2” (https://CRAN.R-project.org, accessed on 12 March 2021).

3. Results

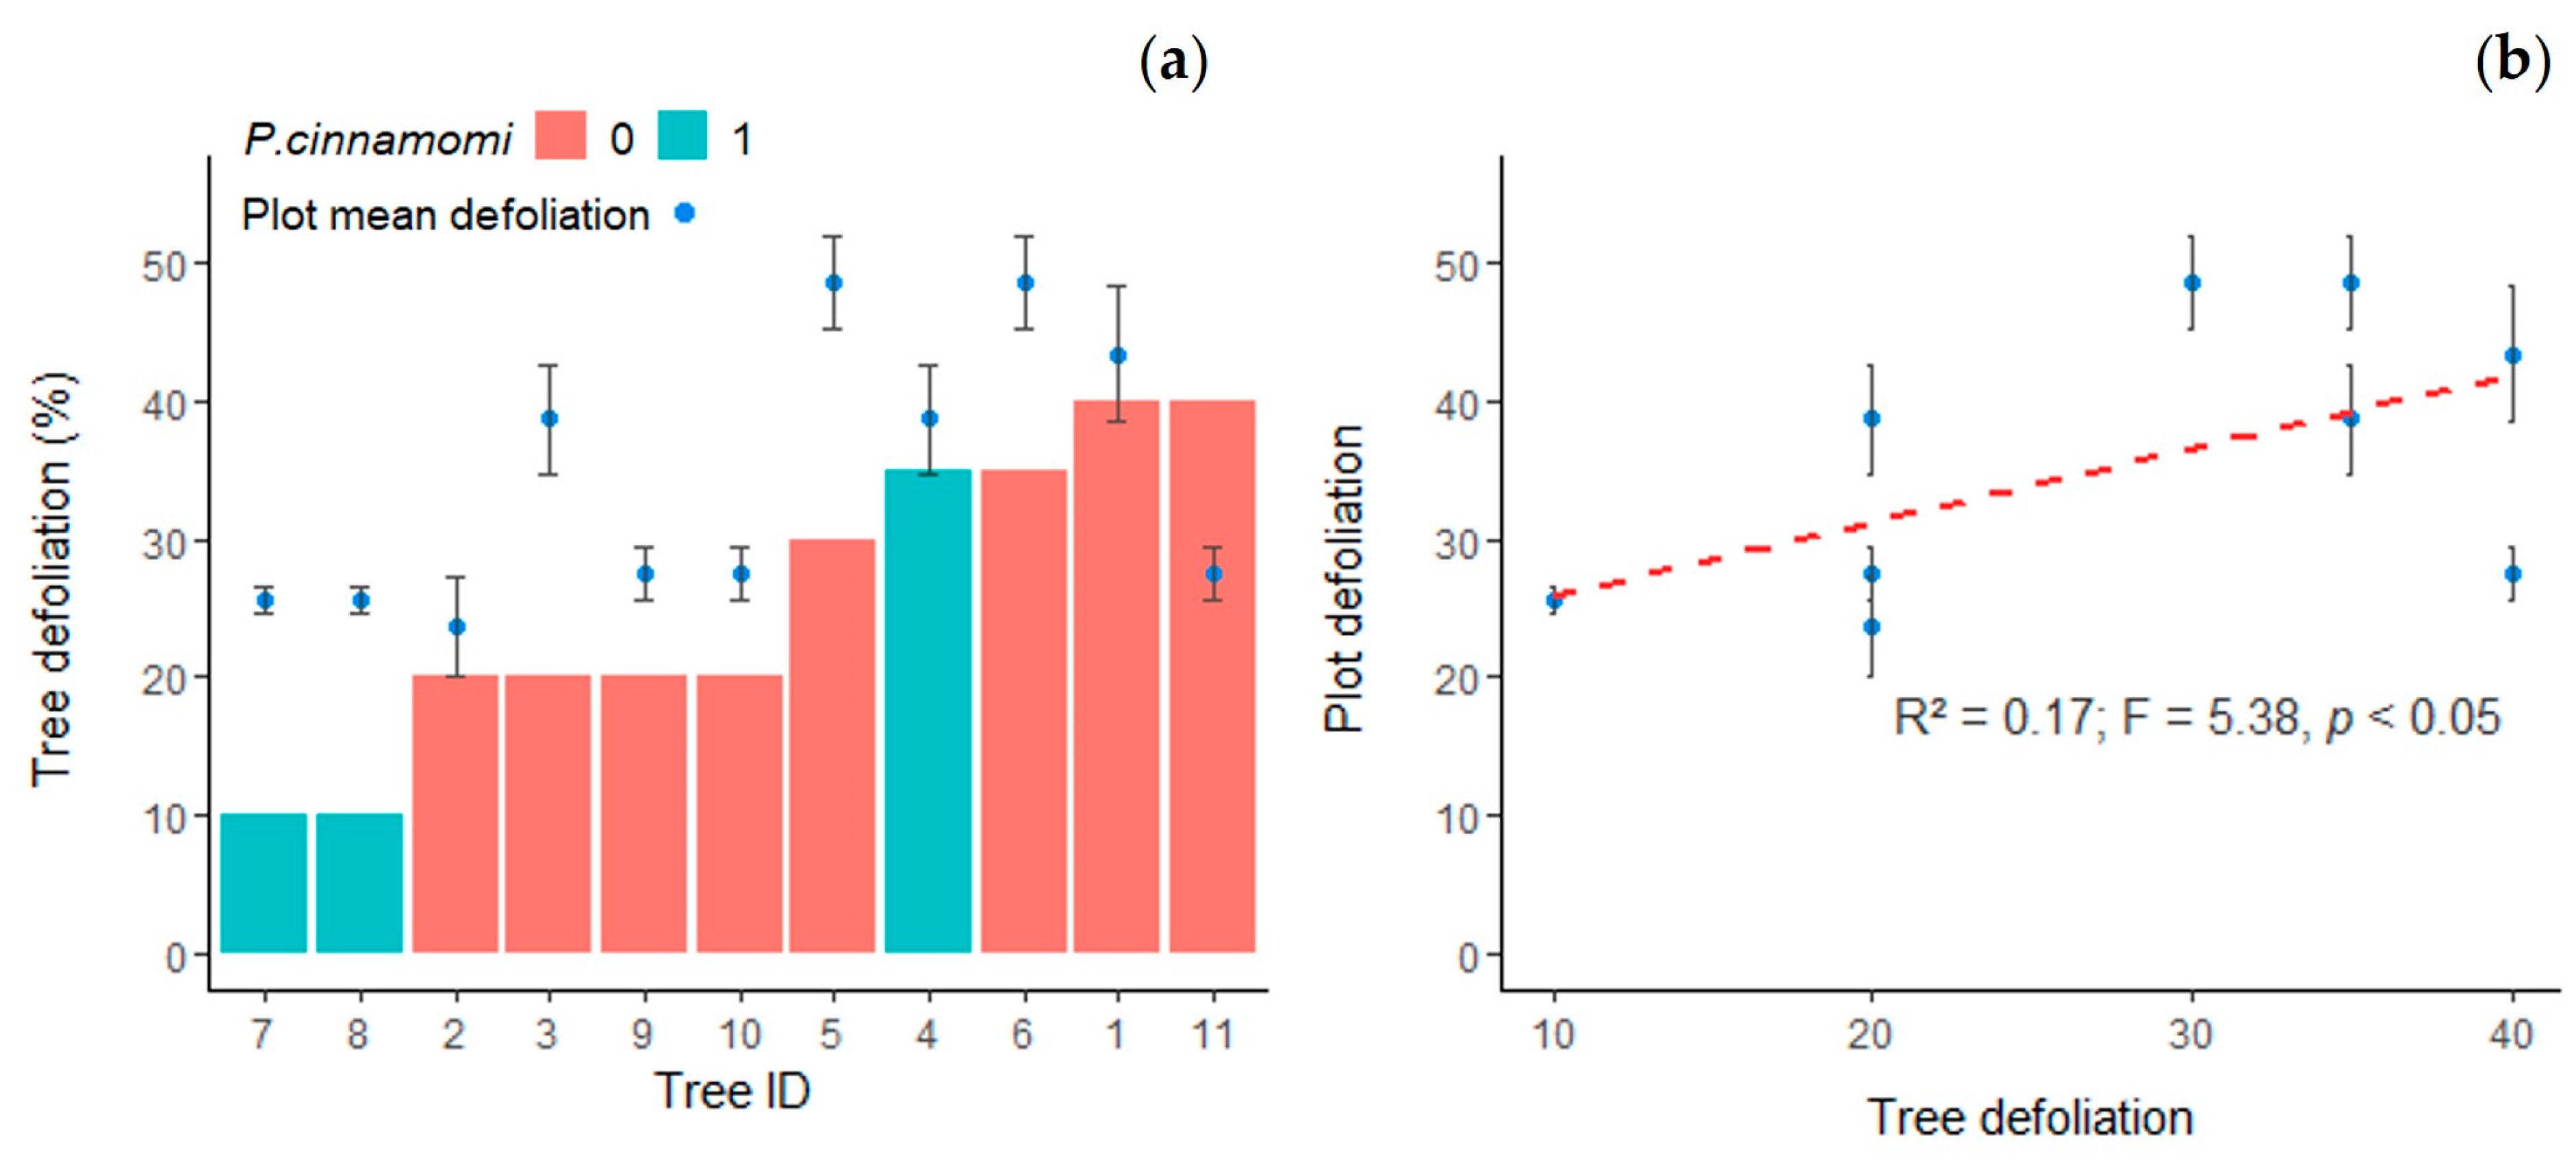
3.1. Health Status of Selected Trees

The selected trees presented lower defoliation values than the plot average in 2019, except for tree 11. The defoliation level of the selected trees was positively correlated with plot defoliation (Adj-R2 = 0.27; p < 0.05) (Figure 1), but the location of the trees did not interact with the selection (class × plot: F = 1.09, p = 0.451), and ΔDef did not show significant differences for this factor (F = 3.19, p = 0.114). The evolution of the crown status after 4 years was marginally different when comparing the selected trees with the rest of the trees in the plots (F = 4.5; p < 0.1). The mean ΔDef was 8.05% from 2015 to 2019, whereas the crown transparency of the selected trees slightly decreased (mean ΔDef = −0.9%) in the same period.
Phytophthora cinnamomi was isolated from 3 of the 11 selected trees (Table 2), but the defoliation of the selected trees did not differ due to the presence of P. cinnamomi (F = 2.44; p = 0.152).

3.2. Isolation of Trichoderma spp. and Oomycete Strains

A total of 95 isolates of Trichoderma spp. were obtained from the soil samples collected in the holm oak rhizosphere. The number of Trichoderma isolated varied according to their origin. The greatest numbers of fungal isolates were obtained from the plots HU1027 and SE1050 (Table S1, Supplementary Material).
Classic isolation techniques matched with the metabarcoding results, even considering that samples were taken after 3 years since the molecular analysis (Table 2). Trichoderma spp. were found in all the soil rhizosphere samples, being more abundant in trees 3 and 4, corresponding to HU1027 (data not shown). These trees presented the highest frequency of Trichoderma spp. OTU#51 in the metabarcoding analysis carried out with the samples collected in 2015 [33]. Moreover, P. cinnamomi was only isolated from trees 3, 4, and 7. Different species of oomycetes such as Phytophthora gonapodyides, Phytopythium vexans, or Pythium mamillatum were also isolated and identified from the soil rhizosphere samples of the rest of the trees (Supplementary Material, Table S2), but P. cinnamomi was not isolated from those samples. On the other hand, it is worth highlighting that it was not possible to isolate P. cinnamomi from the samples coming from tree 8, corresponding to the SE1048 plot.

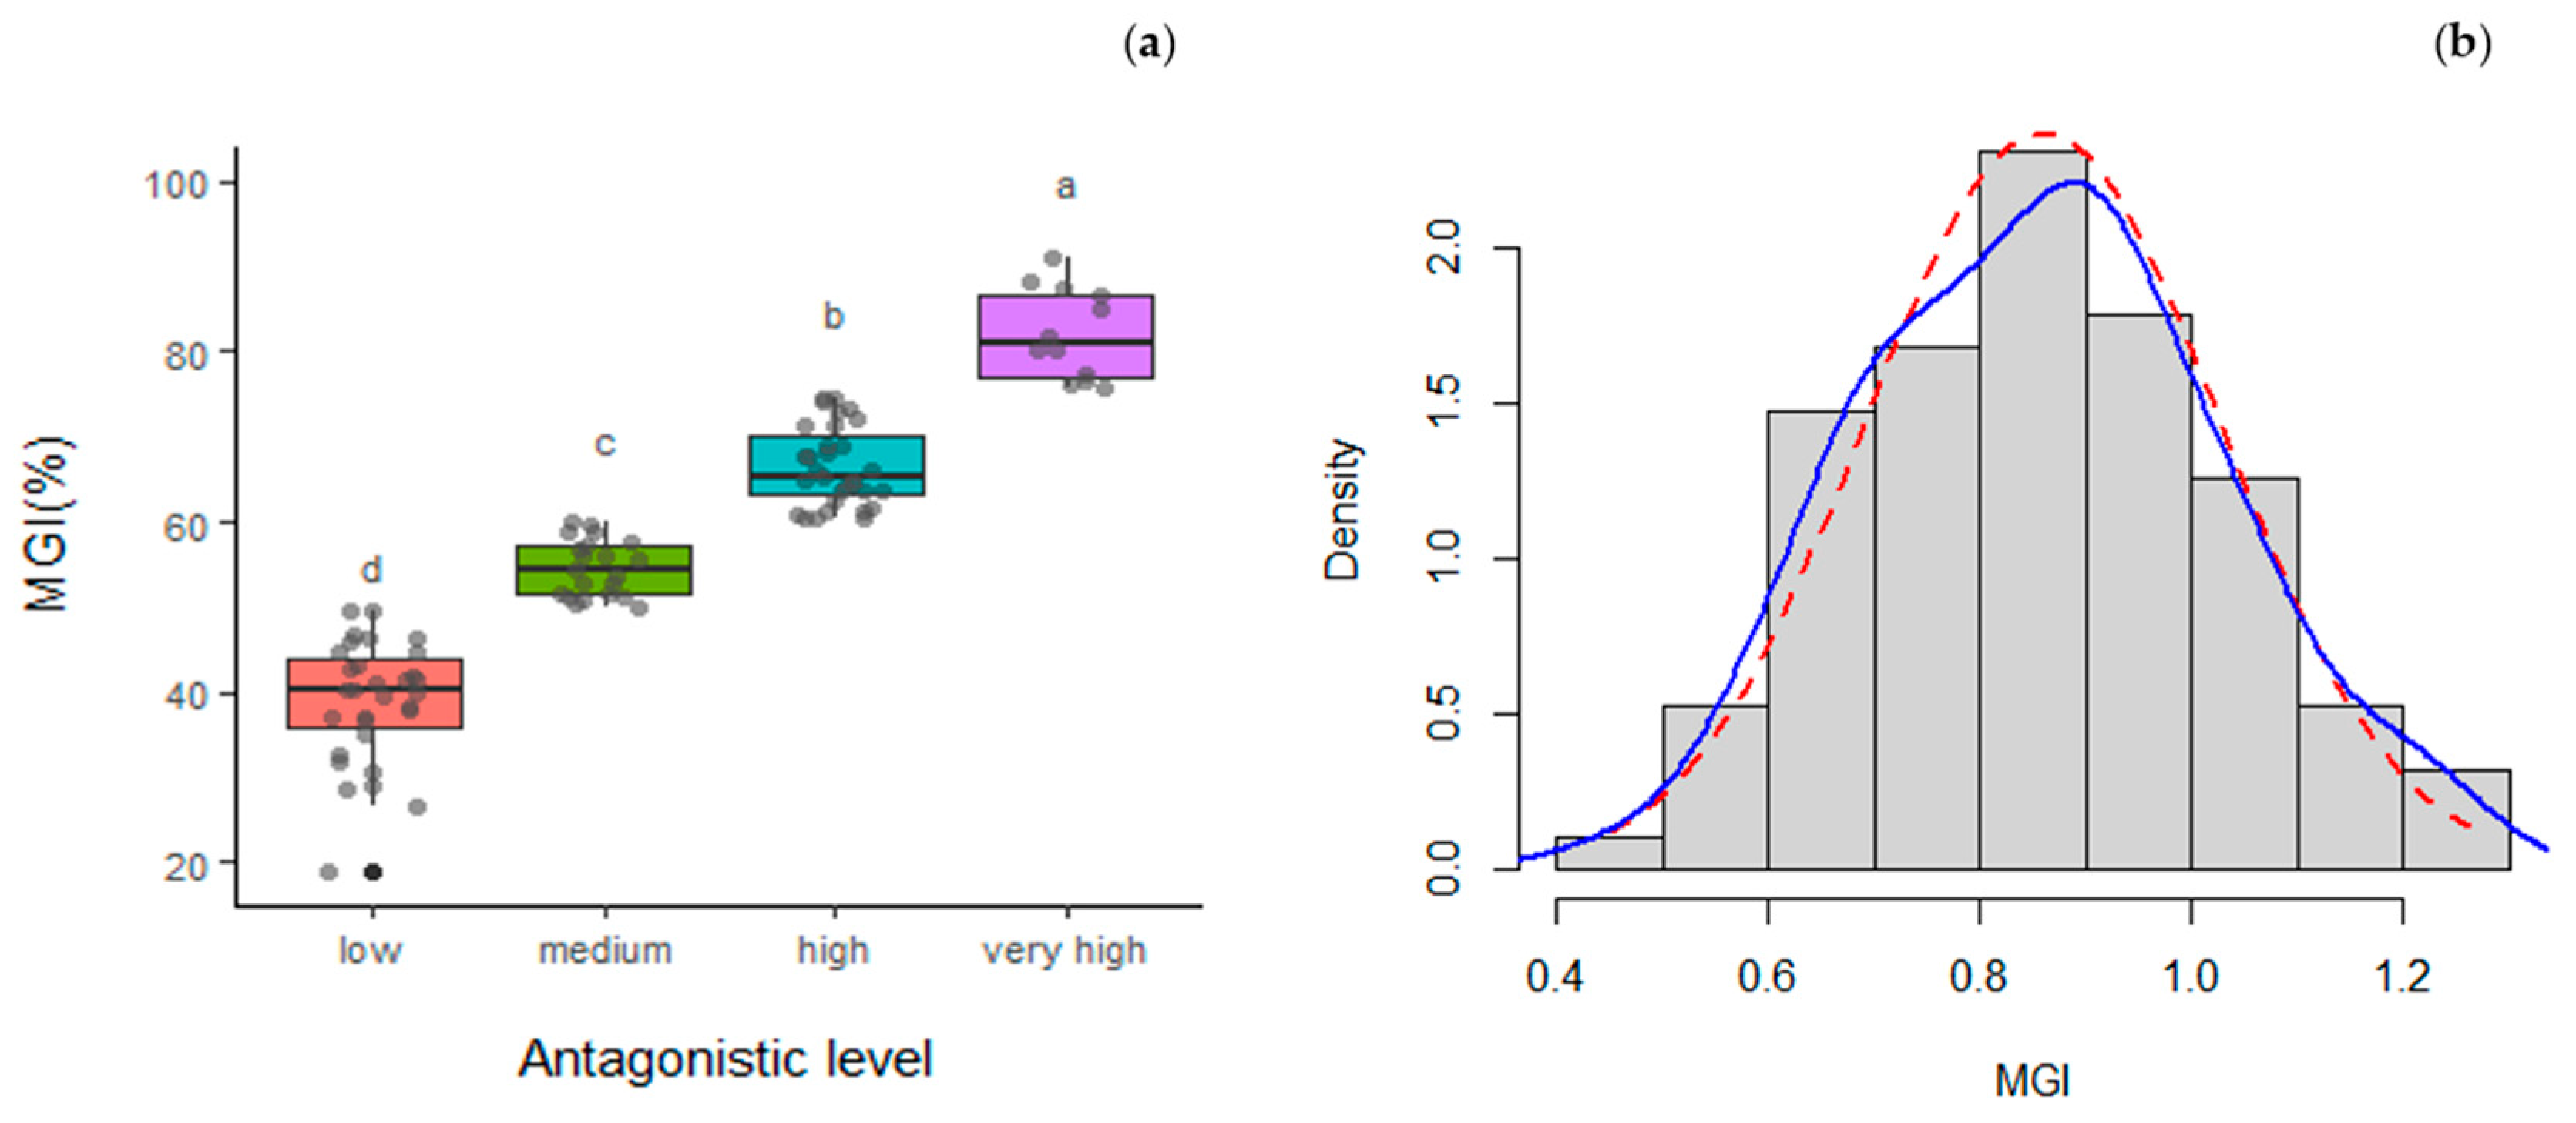
3.3. Mycelial Growth Inhibition

The 95 isolates of Trichoderma were evaluated against P. cinnamomi P90 using the dual culture technique. Almost half of the isolates, 43, presented high or very high antagonistic activity, while 51 showed medium or low levels of mycelial growth inhibition (Figure 2).
Moreover, we observed the colony morphology of P. cinnamomi when growing alone or in the presence of antagonists, finding that the mycelia of P. cinnamomi in those combinations were relatively flat compared to the individual growth of the pathogen, where the mycelia were much denser (Figure S1, Supplementary Material).
The mean MGI value of the Trichoderma spp. strains tested from each tree varied significantly accordingly to tree defoliation (F = 5.97, p < 0.05) and the presence of P. cinnamomi in the rhizosphere (F = 6.22, p < 0.05). Trees highly defoliated presented, on average, strains of Trichoderma spp. with a higher MGI; meanwhile, trees in which P. cinnamomi was detected presented the lowest values (Figure 3). When the influence of both factors on MGI was evaluated jointly (two-way ANOVA), defoliation and the presence of P. cinnamomi did not present an interaction (F = 3.41, p = 0.82) (Figure 3), and the defoliation status only showed marginal significance over MGI (F = 3.05, p = 0.08). However, significant differences were found in the MGI of strains isolated under trees with P. cinnamomi (F = 6.30, p < 0.05), with lower values of MGI for strains isolated in the rhizosphere of trees with the presence of the pathogen.

3.4. Molecular Identification of Trichoderma spp. and the Phytophthora Pathogen
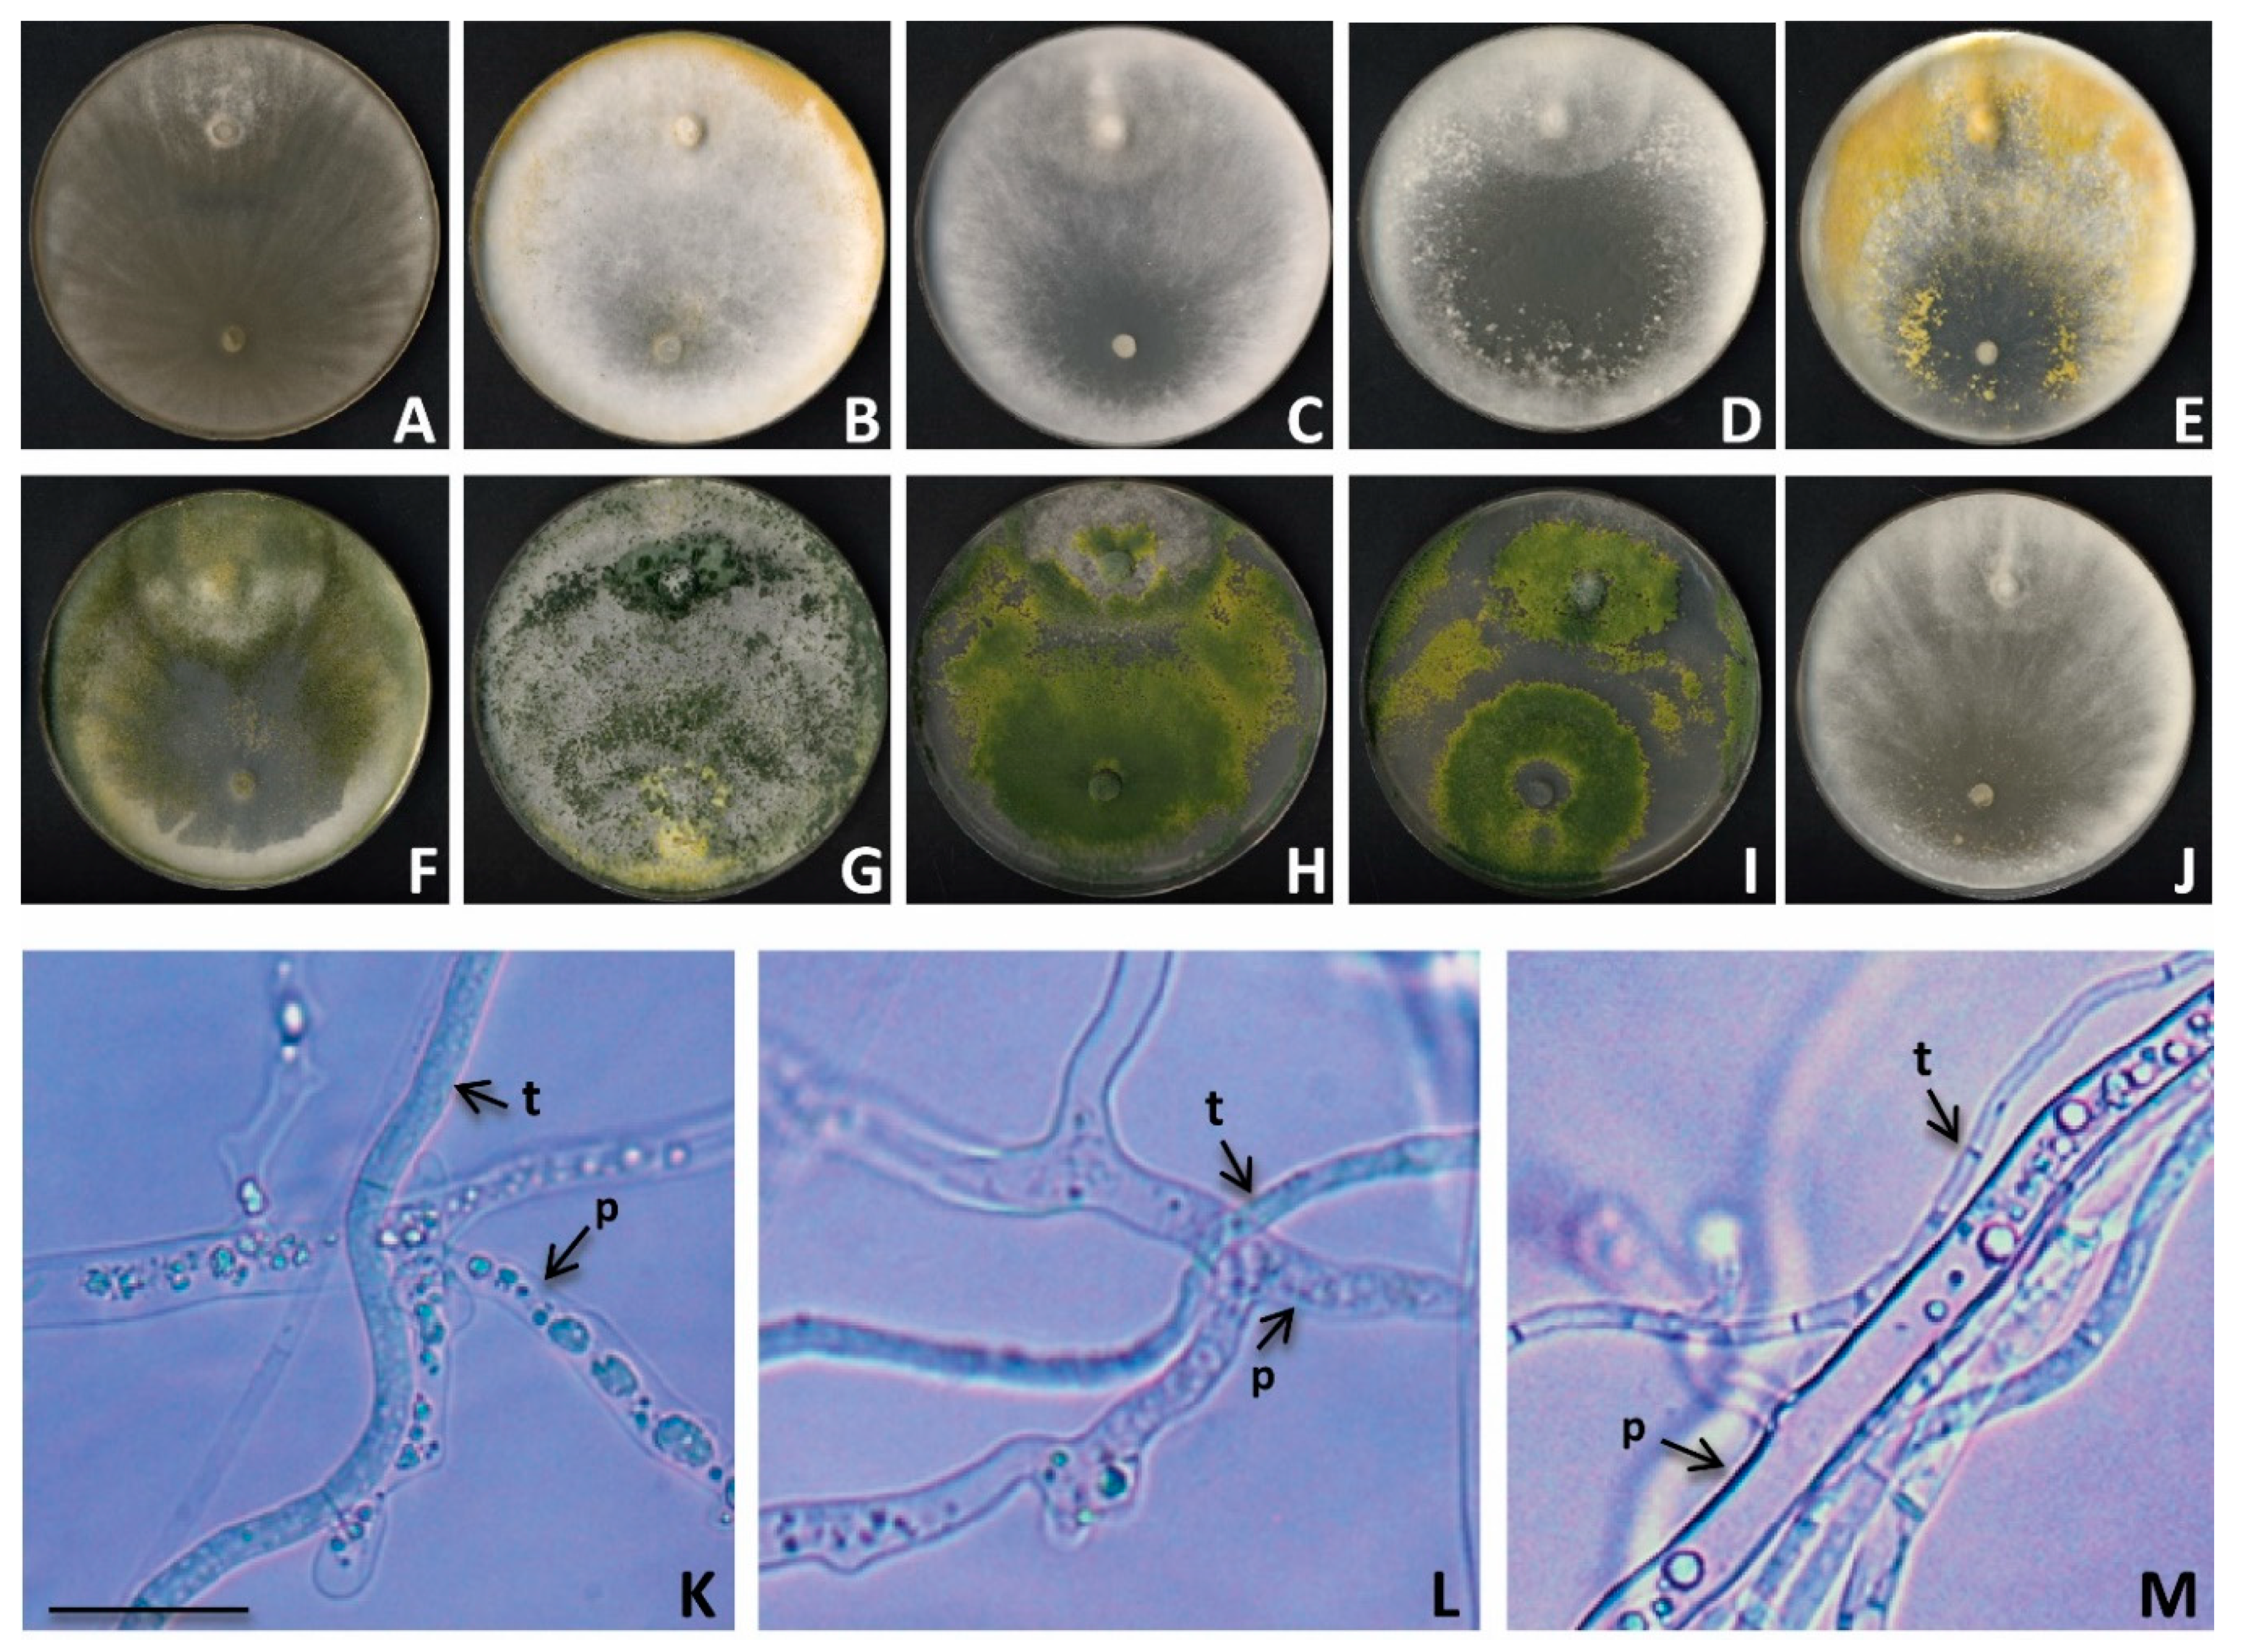
Out of the 95 morphotypes evaluated, 11 Trichoderma isolates with a very high percentage of MGI (>75%), and 10 Trichoderma isolates with a high percentage of MGI (60% < MGI < 75%) were identified by sequencing the Tef 1-α and the Rpb2 genes. Nine species were identified as Trichoderma gamsii (nine strains), Trichoderma viridarium (one), Trichoderma hamatum (three), Trichoderma olivascens (two), Trichoderma virens (one), Trichoderma paraviridescens (one), Trichoderma linzhiense (one), Trichoderma hirsutum (one), Trichoderma samuelsii (one), and T. harzianum (one) (Table 3). It was interesting to note that 9 out of 20 isolates belonged to T. gamsii and were present in all plot codes apart from CO1023 and CO1101. The Phytophthora isolates were molecularly identified by sequencing the ITS rDNA region (Table S2, Supplementary Material). The results from the baiting technique show positives from the HU1027 plot (tree 4), identified as P. cinnamomi, with a 100% identity. In addition, another different oomycete species were identified from trees 2, 7, and 8 (Supplementary Material, Table S2). The sequence data from all Trichoderma and Phytophthora isolates have been deposited in the NCBI database. Accessions numbers are provided in Table 3 and Table S2.

3.5. Mycoparasitism

We investigated whether the ten outstanding Trichoderma isolates that showed a very high MGI (>75%) would show any sign of mycoparasitism such as overgrowth and sporulation on the pathogen’s colonies, or coiling around the hyphae of the pathogen. From the analysis of the confrontation plates after 14 days, eight Trichoderma isolates presented the highest grade (4) of the mycoparasitism scale, which means that the Trichoderma fungus was able to overgrow the pathogen colony and sporulate on it, while two isolates presented mycoparasitism grade 3 (Table 4, Figure 4).
Representative Trichoderma isolates belonging to the fourth class of the mycoparasitism scale were selected to perform microscopic observations on intermingling regions. In all cases, adherent growth and hyphal coiling by Trichoderma were observed. Furthermore, abundant vacuolation of the cytoplasm was detected in the Phytophthora hyphae, being a sign of cellular death (Figure 4).

4. Discussion

There are many works in the literature reporting positive responses of crops to fungal bioinoculants under stress conditions, or in an inoculum-limited environment, but there is a lack of contrasting studies in systems with a well-established soil microbial biodiversity [36]. On the other hand, inocula coming from the ecosystem of reference have been demonstrated to be more effective than commercial inocula as bioamendments for forest restoration practices, indicating some adaptation to the environment of the native strains [24,36]. Moreover, the risk of a bioinoculant introducing species that become invasive should be considered. The use of metabarcoding techniques to characterize the composition and structure of the soil microbial community can be advantageous before considering the use of bioinoculants. This might help to determine the reference soil ecosystem and then develop tailor-made treatments for each specific situation. According to our understanding, and the information obtained from the reviewed literature, this is the first work characterizing the antagonistic activity between native Trichoderma spp. and P. cinnamomi strains, isolated from holm oak trees presenting symptoms of tolerance/resistance to the disease caused by this aggressive pathogen in infected dehesas.

4.1. Molecular Characterization

The genus Trichoderma has always been characterized for its complexity in gaining an accurate identification of its species, even for experts, primarily because of the homoplasy of the morphological characters used. Therefore, molecular data have been used lately to characterize and identify Trichoderma species [29,51,56]. Identification of species of Trichoderma based on a single gene is not sufficient [57,58]. In the current study, we used tef1 and rpb2 single-copy genes as alternative to the ITS region because they are more variable and could more precisely reflect species differences within and among groups of closely related species [59,60,61,62].

4.2. Trichoderma spp. Inhibiting P. cinnamomi

In this study, Trichoderma species from the soil rhizosphere of holm oak trees were screened and evaluated against P. cinnamomi, with the goal of identifying potential biocontrol native agents to be used in the same ecosystem where they were obtained. All isolates of the in vitro assays showed mycelial growth inhibition (MGI) over P. cinnamomi. However, the differences found in MGI rates could indicate that, among these isolates, there are different mechanisms involved in the antagonistic activity against the pathogen. Among the several Trichoderma spp. isolated in the soil rhizosphere of the selected trees and presenting high or very high MGI rates, we found some species already described as antagonistic organisms of P. cinnamomi, or other pathogenic Phytophthora spp., such as T. harzianum [24], T. hamatum [21,22], or T. virens [63]. However, others have not yet been described as potential biocontrol agents and presented very high rates of MGI including T. viridarium, T. gamsii, T. olivascens, T. linzhiense, or T. hirsutum. Trichoderma olivascens and T. viridarium are considered as part of the T. viridescens complex. Several strains of this complex showed antagonistic activity against Phytophthora megasperma and Phytophthora capsici [64], and other fungal pathogens such as Sclerotinia spp. molds in agricultural crops [65]. Trichoderma linzhiense and T. hirsutum are species relative to the Harzianum clade, in which several cosmopolitan and ubiquitous species with anti-fungal and anti-oomycete activity can be found [66]. These species have not yet been tested for biological control purposes.
Trichoderma spp. develop their biological activity through direct and indirect mechanisms including competition, modification of the environmental conditions, stimulation of plant defenses, antibiosis, and mycoparasitism [67,68]. As a matter of fact, mycoparasitism is one of the properties particularly common in the genus Trichoderma. This attribute has special relevance when the prey is a fungal pathogen, providing a strategy for biological control. However, the physiology, biochemistry, or genetics implications behind this process have mostly been investigated in only a few species such as T. harzianum sensu lato, T. atroviride, T. virens, T. asperellum, T. gamsii, and Trichoderma asperelloides [27,69,70] because of their application as agents of biological control in agriculture. This study presented the ability of native Trichoderma strains to mycoparasitize P. cinnamomi. The 10 Trichoderma isolates that presented a very high MGI affected mycelial growth and sporulated all over the pathogen colony. By microscopic examination of the interaction zone, we demonstrated that T. gamsii, T. viridarium, T. olivascens, T. hamatum, T. hirsutum, and T. linzhiense parasitized the mycelium of P. cinnamomi though adherent growth, hyphal coiling, and vacuolization of the Phytophthora hyphae. T. gamsii is included in several commercial Trichoderma biocompounds, being a proven antagonist against several oomycetes such as Pythium irregulare [71], P. capsici [72], and Phytophthora parasitica [73]. Nonetheless, this work represents the first evidence of the antagonistic activity (mycoparasitism) of T. harzianum, T. viridarium, T. gamsii, T. olivascens, T. linzhiense, and T. hirsutum over P. cinnamomi.
The main hypothesis of this work stemmed from the relationship found between the abundance of environmental DNA (eDNA) from Trichoderma spp. and the scarcity or the lack of P. cinnamomi eDNA abundance in a molecular metabarcoding assessment of environmental samples [33]. Although, in this previous work, we identified a specific OTU as a putative Trichoderma sp. with antagonistic effects over Phytophthora spp., it was impossible to differentiate the OTU at species level through BLAST. The 300bp short sequence of ITS1 yielded by the primers ITS1F/2 did not show differences between several Trichoderma spp., including some species isolated in this work, such as T. hamatum, T. paraviridescens, and T. viride. The isolation of those species on the rhizosphere of the same trees leads us to consider that OTU#51 identified in Ruiz-Gomez et al. [33] could correspond to the consensus sequence of a Trichoderma spp. community instead of a single species.

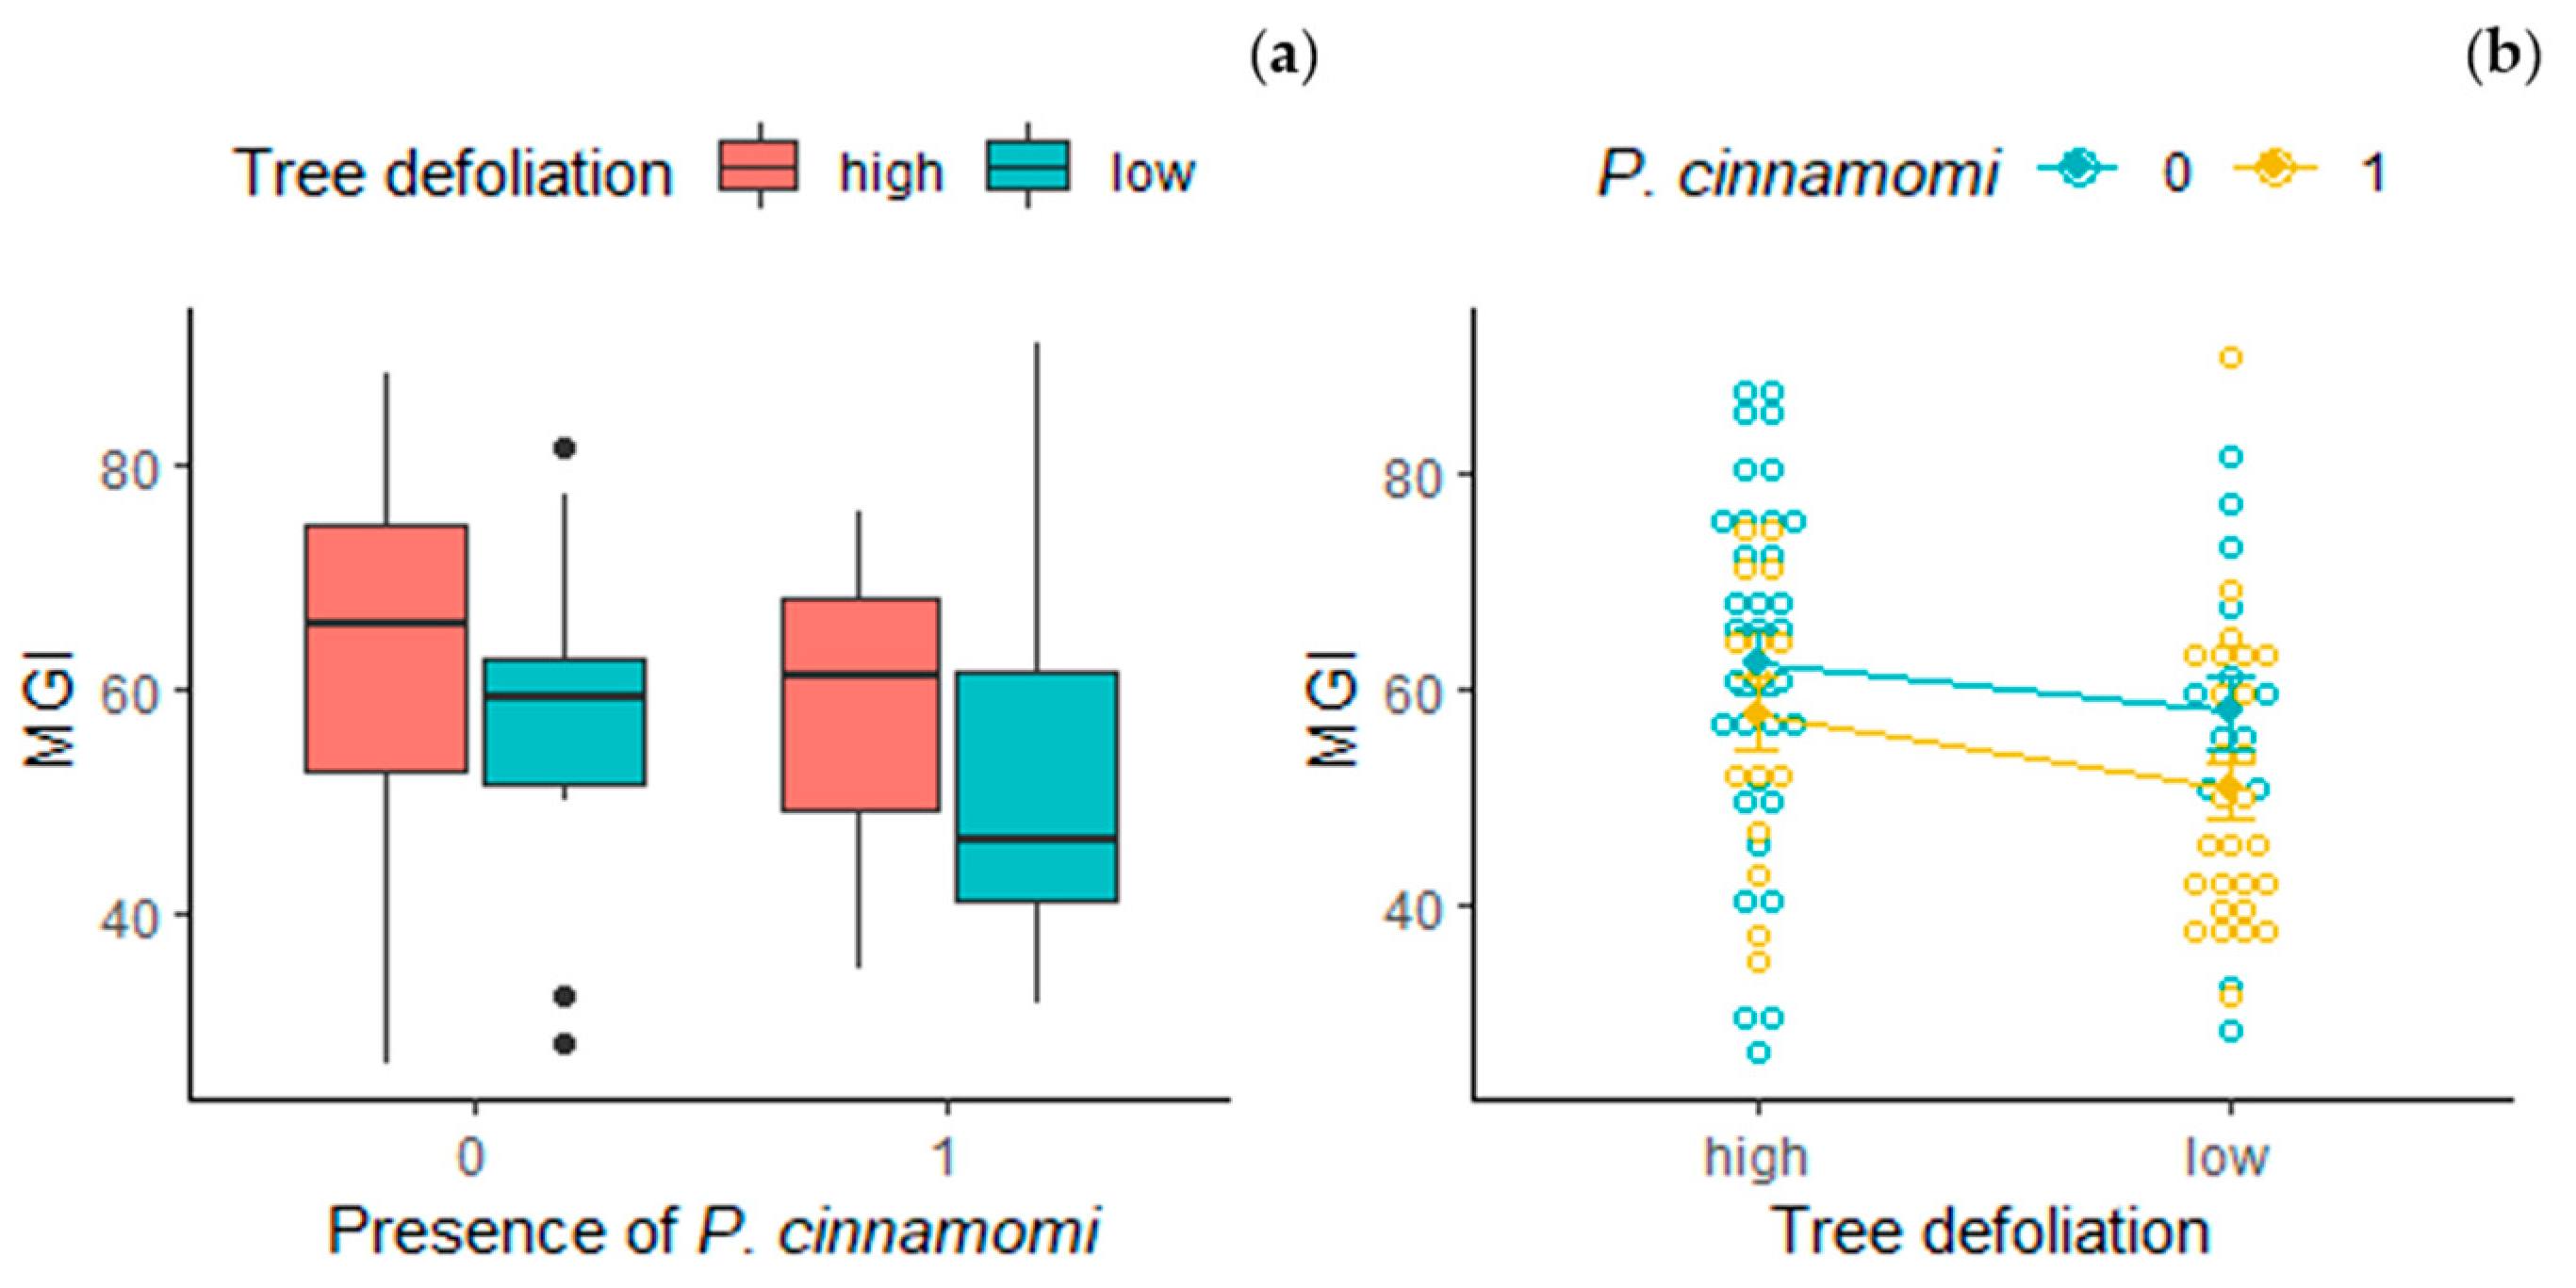
4.3. Tree Health Status and Soil Microbial Community

Defoliation is a controversial symptom when addressing decline in forest ecosystems. This symptom is often influenced by many biotic and abiotic factors, including root rot. Agreeing with our results, previous works analyzing defoliation and holm oak decline at different scales showed the lack of relationships between the presence of P. cinnamomi in soils and the defoliation levels of trees [12,74,75]. Our results show a higher average of MGI in Trichoderma isolates from trees with high defoliation. This could seem contradictory to our hypothesis as we expected that the presence of Trichoderma spp. should improve the phytosanitary status of the trees and, therefore, lead to lower crown defoliation. Nevertheless, it should be considered that selected trees were growing in affected plots, with positive isolation of P. cinnamomi, and their defoliation level should be compared with the mean plot defoliation. The defoliation of the selected trees was lower than the mean defoliation ratio of the plots, presenting a significantly different time trend (ΔDef) between selected trees and the rest in each plot. When the interaction between the presence of P. cinnamomi on the tree rhizosphere and the mean defoliation of the tree was assessed (Figure 3), statistical analysis showed that also the Trichoderma strains isolated in trees with positive isolation of P. cinnamomi presented, on average, a lower MGI, and that the interaction with tree defoliation was only marginal. At this point, it is worth remarking that although the presence of P. cinnamomi was previously confirmed in all six plots, we were unable to isolate this pathogen from the samples coming from the six trees presenting Trichoderma spp. with a very high MGI (higher than 75%).
Further research is necessary to clarify different aspects of the Trichoderma spp.–holm oak interaction, including the effect of Trichoderma spp. on tree defoliation, considering different defoliation degrees in the same location and control plots, but our results support the hypothesis that some Trichoderma spp. presenting a high degree of inhibition over P. cinnamomi might be associated with the suppression of the pathogen on the roots, therefore improving the health status of the trees.

5. Conclusions

In the present study, we isolated and identified a collection of highly antagonistic Trichoderma spp. obtained from the reference ecosystem, under trees showing resistance/tolerance to the pathogen effects. Additionally, these results confirm previous assessments of the soil microbiome through metabarcoding, validating this technique as a tool for environmental microbial communities’ characterization at the regional scale.
To the best of our knowledge, the evidence shown by this work, together with the work of Ruiz-Gomez et al. [33], allows us to suggest that the presence of one or several Trichoderma spp. identified in the holm oak rhizosphere might slow down or even prevent the development of P. cinnamomi, improving the health status of the trees when compared with other trees growing in the same location. Despite the progress made in this work, there are still some questions to be solved, starting with the reason for why Trichoderma spp. only protect certain trees, and not others growing close by. Therefore, further research should be focused on the origin of the interaction between the identified Trichoderma taxa and holm oak. This question aims to establish the existence of a genetic interaction for the plant–microorganism relationship.
In conclusion, our study represents an important new step in the research of tailor-made bioinoculant developments which might be more effective on and respectful to the environment, avoiding the introduction of alien species which could become invasive, displacing native ones.

Supplementary Materials

The following are available online at https://www.mdpi.com/article/10.3390/f12070945/s1, Figure S1: (A) Colony morphology of P. cinnamomi growing alone or (B) in the presence of Trichoderma spp., Table S1: Percentage of mycelial growth inhibition of the total isolated Trichoderma spp. against P. cinnamomi P90, Table S2: Identification of oomycete species isolated from the soil.

Author Contributions

F.J.R.-G. and C.M.-R. equally contributed to all the different stages of this work, including conceptualization, methodology, data analysis, writing—original draft preparation, and writing—review and editing. Both authors have read and agreed to the published version of the manuscript.

Funding

This research was partially funded by the Spanish Ministry of Science, Innovation and Universities through the project ENCINOMICS-2 (PID2019-10908RB-100), and by the Spanish Ministry of Economic Affairs and Digital Transformation, through the project ESPECTRAMED (CGL2017-86161-R). FJR-G was supported by a postdoctoral fellowship of the Junta de Andalucía (Sevilla, Spain), and the European Social Fund 2014–2020 Program (DOC_0055).

Data Availability Statement

The data presented in this study are available in Supplementary Tables S1 and S2 or are publicly available datasets. These publicly available datasets refer to the SEDA Network plots and can be found here: http://www.juntadeandalucia.es/medioambiente/site/rediam (accessed on 11 January 2021).

Acknowledgments

The authors want to acknowledge Angel Carrasco Gotarredona, José Manuel Ruiz Navarro, and Sixto Rodríguez Reviriego (“Agencia de Medio Ambiente y Agua”, “Consejería de Agricultura, Ganadería, Pesca y Desarrollo Sostenible, Junta de Andalucía”, Spain) for their continuous support in our field campaigns on the SEDA Network. We also thank the support of the ERSAF research group, particularly Roberto, J. Cabrera Puerto, for their support during the field campaign. Special thanks to Rafael, M., Navarro-Cerrillo, and Alejandro Pérez-de-Luque, for their preliminary review of the draft.

Conflicts of Interest

The authors declare no conflict of interest.

References

  1. Delgado-Baquerizo, M.; Reich, P.B.; Trivedi, C.; Eldridge, D.J.; Abades, S.; Alfaro, F.D.; Bastida, F.; Berhe, A.A.; Cutler, N.A.; Gallardo, A.; et al. Multiple elements of soil biodiversity drive ecosystem functions across biomes. Nat. Ecol. Evol. 2020, 4, 210–220. [Google Scholar] [CrossRef] [PubMed]
  2. Deiner, K.; Bik, H.M.; Mächler, E.; Seymour, M.; Lacoursière-Roussel, A.; Altermatt, F.; Creer, S.; Bista, I.; Lodge, D.M.; De Vere, N.; et al. Environmental DNA metabarcoding: Transforming how we survey animal and plant communities. Mol. Ecol. 2017, 26, 5872–5895. [Google Scholar] [CrossRef]
  3. Tedersoo, L.; Bahram, M.; Zobel, M. How mycorrhizal associations drive plant population and community biology. Science 2020, 367, eaba1223. [Google Scholar] [CrossRef] [PubMed]
  4. Pérez-De-Luque, A.; Tille, S.; Johnson, I.; Pascual-Pardo, D.; Ton, J.; Cameron, D.D. The interactive effects of arbuscular mycorrhiza and plant growth-promoting rhizobacteria synergistically enhance host plant defences against pathogens. Sci. Rep. 2017, 7, 16409. [Google Scholar] [CrossRef]
  5. Tamayo-Vélez, Á.; Osorio, N.W. Soil fertility improvement by litter decomposition and inoculation with the fungus Mortierella sp. in avocado plantations of Colombia. Commun. Soil Sci. Plant Anal. 2018, 49, 139–147. [Google Scholar] [CrossRef]
  6. Turbé, A.; de Toni, A.; Benito, P.; Lavelle, P.; Lavelle, P.; Ruiz Camacho, N.; van der Putten, W.H.; Labouze, E.; Mudgal, S. Soil Biodiversity: Functions, Threats and Tools for Policy Makers; European Commission DG ENV. Bioemco: Paris, France, 2010; p. 251. [Google Scholar]
  7. Wall, D.H.; Nielsen, U.N.; Six, J. Soil biodiversity and human health. Nature 2015, 528, 69–76. [Google Scholar] [CrossRef] [PubMed]
  8. Belhaj, R.; McComb, J.; Burgess, T.I.; Hardy, G.E.S.J. Pathogenicity of 21 newly described Phytophthora species against seven Western Australian native plant species. Plant Pathol. 2018, 67, 1140–1149. [Google Scholar] [CrossRef]
  9. Jung, T.; Pérez-Sierra, A.; Durán, A.; Jung, M.H.; Balci, Y.; Scanu, B. Canker and decline diseases caused by soil- and airborne Phytophthora species in forests and woodlands. Pers. Mol. Phylogeny Evol. Fungi 2018, 40, 182–220. [Google Scholar] [CrossRef] [Green Version]
  10. Trumbore, S.E.; Brando, P.M.; Hartmann, H. Forest health and global change. Science 2015, 349, 814–818. [Google Scholar] [CrossRef] [Green Version]
  11. Rodríguez-Calcerrada, J.; Sancho-Knapik, D.; Martin-StPaul, N.K.; Limousin, J.-M.; McDowell, N.G.; Gil-Pelegrín, E. Drought-Induced Oak Decline—Factors Involved, Physiological Dysfunctions, and Potential Attenuation by Forestry Practices. In Oaks Physiological Ecology. Exploring the Functional Diversity of Genus Quercus L.; Gil-Pelegrín, E., Peguero-Pina, J.J., Sancho-Knapik, D., Eds.; Tree Physiology; Springer International Publishing: Cham, Switzerland, 2017; pp. 419–451. ISBN 978-3-319-69099-5. [Google Scholar]
  12. Ruiz-Gómez, F.J.; Pérez-De-Luque, A.; Navarro-Cerrillo, R.M. The involvement of Phytophthora root rot and drought stress in holm oak decline: From ecophysiology to microbiome influence. Curr. For. Rep. 2019, 5, 251–266. [Google Scholar] [CrossRef]
  13. Carrasco Gotarredona, Á.; Fernández Cancio, Á.; Trapero Casas, A.; López Pantoja, G.; Sánchez Osorio, I.; Ruiz Navarro, J.M.; Jiménez Molina, J.J.; Domínguez Nevado, L.; Romero Martín, M.Á.; Carbonero Muñoz, M.D.; et al. Procesos de Decaimiento Forestal (la Seca): Situación del Conocimiento, 1st ed.; Consejería de Medio Ambiente: Córdoba, Spain, 2009; ISBN 978-84-92807-29-1. [Google Scholar]
  14. Sánchez-Cuesta, R.; Navarro-Cerrillo, R.M.; Quero, J.L.; Ruiz-Gómez, F.J. Small-scale abiotic factors influencing the spatial distribution of Phytophthora cinnamomi under declining Quercus ilex trees. Forests 2020, 11, 375. [Google Scholar] [CrossRef] [Green Version]
  15. Ruiz-Gómez, F.J.; Navarro-Cerrillo, R.M.; Sánchez-Cuesta, R.; Pérez-De-Luque, A. Histopathology of infection and colonization of Quercus ilex fine roots by Phytophthora cinnamomi. Plant Pathol. 2015, 64, 605–616. [Google Scholar] [CrossRef]
  16. Burgess, T.I.; Scott, J.; McDougall, K.L.; Stukely, M.J.C.; Crane, C.; Dunstan, W.A.; Brigg, F.; Andjic, V.; White, D.; Rudman, T.; et al. Current and projected global distribution of Phytophthora cinnamomi, one of the world’s worst plant pathogens. Glob. Chang. Biol. 2016, 23, 1661–1674. [Google Scholar] [CrossRef] [Green Version]
  17. Hardham, A.R.; Blackman, L.M. Phytophthora cinnamomi. Mol. Plant Pathol. 2018, 19, 260–285. [Google Scholar] [CrossRef] [Green Version]
  18. Jiggins, J.; Roling, N. Adaptive management: Potential and limitations for ecological governance. Int. J. Agric. Resour. Gov. Ecol. 2000, 1, 28. [Google Scholar] [CrossRef]
  19. Sharma, A.; Sharma, P. Trichoderma: Host Pathogen Interactions and Applications, 1st ed.; Rhizosphere Biology; Springer: Singapore, 2020; p. 319. ISBN 9789811533204. [Google Scholar]
  20. Vinale, F.; Sivasithamparam, K.; Ghisalberti, E.L.; Marra, R.; Woo, S.L.; Lorito, M. Trichoderma–plant–pathogen interactions. Soil Biol. Biochem. 2008, 40, 1–10. [Google Scholar] [CrossRef]
  21. Aleandri, M.P.; Chilosi, G.; Bruni, N.; Tomassini, A.; Vettraino, A.M.; Vannini, A. Use of nursery potting mixes amended with local Trichoderma strains with multiple complementary mechanisms to control soil-borne diseases. Crop. Prot. 2015, 67, 269–278. [Google Scholar] [CrossRef]
  22. Chemeltorit, P.P.; Mutaqin, K.; Widodo, W. Combining Trichoderma hamatum THSW13 and Pseudomonas aeruginosa BJ10–86: A synergistic chili pepper seed treatment for Phytophthora capsici infested soil. Eur. J. Plant Pathol. 2016, 147, 157–166. [Google Scholar] [CrossRef]
  23. García-Núñez, H.G.; Martínez-Campos, Á.R.; Hermosa-Prieto, M.R.; Monte-Vázquez, E.; Aguilar-Ortigoza, C.J.; González-Esquivel, C.E. Caracterización morfológica y molecular de cepas nativas de Trichoderma y su potencial de biocontrol sobre Phytophthora infestans. Mex. J. Phytopathol. 2017, 35, 58–79. [Google Scholar] [CrossRef] [Green Version]
  24. Promwee, A.; Yenjit, P.; Issarakraisila, M.; Intana, W.; Chamswarng, C. Efficacy of indigenous Trichoderma harzianum in controlling Phytophthora leaf fall (Phytophthora palmivora) in Thai rubber trees. J. Plant Dis. Prot. 2017, 124, 41–50. [Google Scholar] [CrossRef]
  25. Widmer, T.L.; Johnson-Brousseau, S.; Kosta, K.; Ghosh, S.; Schweigkofler, W.; Sharma, S.; Suslow, K. Remediation of Phytophthora ramorum-infested soil with Trichoderma asperellum isolate 04-22 under ornamental nursery conditions. Biol. Control. 2018, 118, 67–73. [Google Scholar] [CrossRef]
  26. Ros, M.; Raut, I.; Santisima-Trinidad, A.B.; Pascual, J.A. Relationship of microbial communities and suppressiveness of Trichoderma fortified composts for pepper seedlings infected by Phytophthora nicotianae. PLoS ONE 2017, 12, e0174069. [Google Scholar] [CrossRef] [PubMed] [Green Version]
  27. Atanasova, L.; Le Crom, S.; Gruber, S.; Coulpier, F.; Seidl-Seiboth, V.; Kubicek, C.P.; Druzhinina, I.S. Comparative transcriptomics reveals different strategies of Trichoderma mycoparasitism. BMC Genom. 2013, 14, 121. [Google Scholar] [CrossRef] [PubMed] [Green Version]
  28. Reithner, B.; Ibarra-Laclette, E.; Mach, R.; Herrera-Estrella, A. Identification of mycoparasitism-related genes in Trichoderma atroviride. Appl. Environ. Microbiol. 2011, 77, 4361–4370. [Google Scholar] [CrossRef] [PubMed] [Green Version]
  29. Sanchez, A.D.; Ousset, M.J.; Sosa, M.C. Biological control of Phytophthora collar rot of pear using regional Trichoderma strains with multiple mechanisms. Biol. Control. 2019, 135, 124–134. [Google Scholar] [CrossRef]
  30. Zeilinger, S.; Omann, M. Trichoderma biocontrol: Signal transduction pathways involved in host sensing and mycoparasitism. Gene Regul. Syst. Biol. 2007, 1, 227–234. [Google Scholar] [CrossRef] [Green Version]
  31. Dunstan, W.A.; Rudman, T.; Shearer, B.L.; Moore, N.A.; Paap, T.; Calver, M.C.; Dell, B.; Hardy, G.E.S.J. Containment and spot eradication of a highly destructive, invasive plant pathogen (Phytophthora cinnamomi) in natural ecosystems. Biol. Invasions 2009, 12, 913–925. [Google Scholar] [CrossRef]
  32. Corcobado, T.; Vivas, M.; Moreno, G.; Solla, A. Ectomycorrhizal symbiosis in declining and non-declining Quercus ilex trees infected with or free of Phytophthora cinnamomi. For. Ecol. Manag. 2014, 324, 72–80. [Google Scholar] [CrossRef]
  33. Ruiz-Gómez, F.J.; Navarro-Cerrillo, R.M.; Pérez-De-Luque, A.; Oβwald, W.; Vannini, A.; Morales-Rodríguez, C. Assessment of functional and structural changes of soil fungal and oomycete communities in holm oak declined dehesas through metabarcoding analysis. Sci. Rep. 2019, 9, 5315. [Google Scholar] [CrossRef] [Green Version]
  34. Marti, A.F.I.; Romero-Rodríguez, C.; Navarro-Cerrillo, R.M.; Abril, N.; Jorrín-Novo, J.V.; Dodd, R.S. Population genetic diversity of Quercus ilex subsp. ballota (Desf.) Samp. reveals divergence in recent and evolutionary migration rates in the Spanish dehesas. Forests 2018, 9, 337. [Google Scholar] [CrossRef] [Green Version]
  35. Valero Galván, J.; Jorrin Novo, J.J.; Cabrera, A.G.; Ariza, D.; García-Olmo, J.; Navarro-Cerrillo, R.M. Population variability based on the morphometry and chemical composition of the acorn in Holm oak (Quercus ilex subsp. ballota [Desf.] Samp.). Eur. J. For. Res. 2011, 131, 893–904. [Google Scholar] [CrossRef]
  36. Hart, M.M.; Antunes, P.M.; Chaudhary, V.B.; Abbott, L.K. Fungal inoculants in the field: Is the reward greater than the risk? Funct. Ecol. 2018, 32, 126–135. [Google Scholar] [CrossRef] [Green Version]
  37. Eichhorn, J.; Roskams, P.; Potočić, N.; Timmermann, V.; Ferretti, M.; Mues, V.; Szepesi, A.; Durrant, D.; Seletković, I.; Schroeck, H.-W.; et al. Part IV: Visual assessment of crown condition and damaging agents. In UNECE ICP Forests Programme Co-ordinating Centre. Manual on Methods and Criteria for Harmonized Sampling, Assessment, Monitoring and Analysis of the Effects of Air Pollution on Forests; Thünen Institute of Forest Ecosystems: Eberswalde, Germany, 2017; p. 54. ISBN 978-3-86576-162-0. [Google Scholar]
  38. Zamora Rojas, E.; Andicoberry de los Reyes, S.; Sánchez Clemente, M.E. Anexo A.1. IV El decaimiento y la podredumbre radical en las dehesas andaluzas. In Ecosistemas de Dehesa: Desarrollo de Políticas y Herramientas para la Gestión y Conservación de la Biodiversidad (Life Biodehesa Project); Consejería de Medio Ambiente y Ordenación del Territorio: Sevilla, Spain, 2014. [Google Scholar]
  39. Hirte, W.F. The use of dilution plate method for the determination of soil microflora. 2. The qualitative demonstration of bacteria and actinomycetes. Zent. Bakteriol. Parasitenkd. Infekt. Hyg. 1969, 123, 167–178. [Google Scholar]
  40. Gil, S.V.; Pastor, S.; March, G. Quantitative isolation of biocontrol agents Trichoderma spp., Gliocladium spp. and actinomycetes from soil with culture media. Microbiol. Res. 2009, 164, 196–205. [Google Scholar] [CrossRef]
  41. Williams, J.; Clarkson, J.M.; Mills, P.R.; Cooper, R.M. A selective medium for quantitative reisolation of Trichoderma harzianum from Agaricus bisporus compost. Appl. Environ. Microbiol. 2003, 69, 4190–4191. [Google Scholar] [CrossRef] [Green Version]
  42. Erwin, D.C.; Ribeiro, O.K. Phytophthora Diseases Worldwide; APS Press: Washington, DC, USA, 1996; p. 592. ISBN 978-0-89054-212-5. [Google Scholar]
  43. Jeffers, S.N.; Martin, S.B. Comparison of two media selective for Phytophthora and Pythium species. Plant Dis. 1986, 70, 1038–1043. [Google Scholar] [CrossRef]
  44. Rahman, M.A.; Begum, M.F.; Alam, M.F. Screening of Trichoderma isolates as a biological control agent against Ceratocystis paradoxa causing pineapple disease of sugarcane. Mycobiology 2009, 37, 277–285. [Google Scholar] [CrossRef] [Green Version]
  45. Li, Y.; Sun, R.; Yu, J.; Saravanakumar, K.; Chen, J. Antagonistic and biocontrol potential of Trichoderma asperellum ZJSX5003 against the maize stalk rot pathogen Fusarium graminearum. Indian J. Microbiol. 2016, 56, 318–327. [Google Scholar] [CrossRef] [PubMed] [Green Version]
  46. Elías, R.; Arcos, O.; Arbeláez, G. Estudio del antagonismo de algunas especies de Trichoderma aisladas de suelos colombianos en el control de Fusarium oxysporum y Rhizoctonia solani. Agron. Colomb. 1993, 10, 52–61. [Google Scholar]
  47. Carbone, I.; Kohn, L.M. A Method for designing primer sets for speciation studies in filamentous ascomycetes. Mycologia 1999, 91, 553. [Google Scholar] [CrossRef]
  48. Jaklitsch, W.M.; Komon, M.; Kubicek, C.P.; Druzhinina, I.S. Hypocrea voglmayrii sp. nov. from the Austrian Alps represents a new phylogenetic clade in Hypocrea/Trichoderma. Mycologia 2005, 97, 1365–1378. [Google Scholar] [CrossRef] [PubMed]
  49. Liu, Y.J.; Whelen, S.; Hall, B.D. Phylogenetic relationships among ascomycetes: Evidence from an RNA polymerse II subunit. Mol. Biol. Evol. 1999, 16, 1799–1808. [Google Scholar] [CrossRef] [PubMed]
  50. Cooke, D.; Drenth, A.; Duncan, J.; Wagels, G.; Brasier, C. A Molecular Phylogeny of Phytophthora and related oomycetes. Fungal Genet. Biol. 2000, 30, 17–32. [Google Scholar] [CrossRef] [PubMed]
  51. Jaklitsch, W.M. European species of Hypocrea Part I. The green-spored species. Stud. Mycol. 2009, 63, 1–91. [Google Scholar] [CrossRef] [PubMed] [Green Version]
  52. Milton, J.S.; Tsokos, J.O. Statistical Methods in the Biological and Health Sciences, 3rd ed.; McGraw-Hill: New York, NY, USA, 1983; p. 600. ISBN 978-0-07-042359-6. [Google Scholar]
  53. R Core Team. R: A Language and Environment for Statistical Computing; R Foundation for Statistical Computing: Vienna, Austria, 2020. [Google Scholar]
  54. R Studio Team. R Studio: Integrated Development for R; R Studio, PBC: Boston, MA, USA, 2020. [Google Scholar]
  55. De Mendiburu, F. Agricolae: Statistical Procedures for Agricultural Research; R Package Version 1.3-3. Available online: https://CRAN.R-project.org/package=agricolae (accessed on 11 January 2021).
  56. Jaklitsch, W.; Voglmayr, H. Biodiversity of Trichoderma (Hypocreaceae) in Southern Europe and Macaronesia. Stud. Mycol. 2015, 80, 1–87. [Google Scholar] [CrossRef] [Green Version]
  57. Bissett, J.; Szakacs, G.; Nolan, C.A.; Druzhinina, I.; Gradinger, C.; Kubicek, C.P. New species of Trichoderma from Asia. Can. J. Bot. 2003, 81, 570–586. [Google Scholar] [CrossRef]
  58. Chaverri, P.; Candoussau, F.; Samuels, G.J. Hypocrea phyllostachydis and its Trichoderma anamorph, a new bambusicolous species from France. Mycol. Prog. 2004, 3, 29–36. [Google Scholar] [CrossRef]
  59. Chaverri, P.; Branco-Rocha, F.; Jaklitsch, W.M.; Gazis, R.; Degenkolb, T.; Samuels, G.J. Systematics of the Trichoderma harzianum species complex and the re-identification of commercial biocontrol strains. Mycologia 2015, 107, 558–590. [Google Scholar] [CrossRef] [Green Version]
  60. Devi, P.; Prabhakaran, N.; Kamil, D.; Pandey, P.; Borah, J.L. Characterization of Indian native isolates of Trichoderma spp. and assessment of their bio-control efficiency against plant pathogens. Afr. J. Biotechnol. 2012, 11, 15150–15160. [Google Scholar] [CrossRef]
  61. Gerin, D.; Pollastro, S.; Raguseo, C.; Angelini, R.M.D.M.; Faretra, F. A ready-to-use single- and duplex-TaqMan-qPCR assay to detect and quantify the biocontrol agents Trichoderma asperellum and Trichoderma gamsii. Front. Microbiol. 2018, 9, 2073. [Google Scholar] [CrossRef]
  62. Samuels, G.J. Trichoderma: Systematics, the sexual state, and ecology. Phytopathology 2006, 96, 195–206. [Google Scholar] [CrossRef] [PubMed] [Green Version]
  63. Bae, S.-J.; Mohanta, T.K.; Chung, J.Y.; Ryu, M.; Park, G.; Shim, S.; Hong, S.-B.; Seo, H.; Bae, D.-W.; Bae, I.; et al. Trichoderma metabolites as biological control agents against Phytophthora pathogens. Biol. Control. 2016, 92, 128–138. [Google Scholar] [CrossRef]
  64. Cuervo-Parra, J.A.; Sánchez López, V.; Romero-Cortes, T.; Ramírez-Lepe, M. Hypocrea/Trichoderma viridescens ITV43 with potential for biocontrol of Moniliophthora roreri Cif Par, Phytophthora megasperma and Phytophthora capsici. Afr. J. Microbiol. Res. 2014, 8, 1704–1712. [Google Scholar] [CrossRef] [Green Version]
  65. Ojaghian, S.; Wang, L.; Zhang, L. Expression of lytic enzyme genes involved in antagonistic activity of Trichoderma viridescens during interaction with Sclerotinia sclerotiorum. Eur. J. Plant Pathol. 2020, 157, 223–226. [Google Scholar] [CrossRef]
  66. Gu, X.; Wang, R.; Sun, Q.; Wu, B.; Sun, J.-Z. Four new species of Trichoderma in the Harzianum clade from northern China. MycoKeys 2020, 73, 109–132. [Google Scholar] [CrossRef] [PubMed]
  67. Benítez, T.; Rincón, A.M.; Limón, M.C.; Codón, A.C. Biocontrol mechanisms of Trichoderma strains. Int. Microbiol. 2004, 7, 249–260. [Google Scholar]
  68. Howell, C.R. Mechanisms employed by Trichoderma species in the biological control of plant diseases: The history and evolution of current concepts. Plant Dis. 2003, 87, 4–10. [Google Scholar] [CrossRef] [Green Version]
  69. Chen, J.-L.; Sun, S.-Z.; Miao, C.-P.; Wu, K.; Chen, Y.-W.; Xu, L.-H.; Guan, H.-L.; Zhao, L.-X. Endophytic Trichoderma gamsii YIM PH30019: A promising biocontrol agent with hyperosmolar, mycoparasitism, and antagonistic activities of induced volatile organic compounds on root-rot pathogenic fungi of Panax notoginseng. J. Ginseng Res. 2016, 40, 315–324. [Google Scholar] [CrossRef] [PubMed] [Green Version]
  70. Kubicek, C.P.; Herrera-Estrella, A.; Seidl-Seiboth, V.; Martinez, D.A.; Druzhinina, I.S.; Thon, M.; Zeilinger, S.; Casas-Flores, S.; Horwitz, B.A.; Mukherjee, P.K.; et al. Comparative genome sequence analysis underscores mycoparasitism as the ancestral life style of Trichoderma. Genome Biol. 2011, 12, R40. [Google Scholar] [CrossRef] [PubMed] [Green Version]
  71. Zhang, X.; Harvey, P.R.; Stummer, B.E.; Warren, R.A.; Zhang, G.; Guo, K.; Li, J.; Yang, H. Antibiosis functions during interactions of Trichoderma afroharzianum and Trichoderma gamsii with plant pathogenic Rhizoctonia and Pythium. Funct. Integr. Genom. 2015, 15, 599–610. [Google Scholar] [CrossRef]
  72. Cucu, M.A.; Gilardi, G.; Pugliese, M.; Ferrocino, I.; Gullino, M.L. Effects of biocontrol agents and compost against the Phytophthora capsici of zucchini and their impact on the rhizosphere microbiota. Appl. Soil Ecol. 2020, 154, 103659. [Google Scholar] [CrossRef]
  73. Osorio-Hernández, E.; Hernández-Morales, J.; Conde-Martínez, V.; Michel-Aceves, A.C.; Lopez-Santillan, J.A.; Torres-Castillo, J.A. In vitro activities of Trichoderma species against Phytophthora parasitica and Fusarium oxysporum. Afr. J. Microbiol. Res. 2016, 10, 521–527. [Google Scholar] [CrossRef] [Green Version]
  74. Navarro-Cerrillo, R.M.; Varo-Martínez, M.Á.; Acosta-Muñoz, C.; Rodriguez, G.P.; Sánchez-Cuesta, R.; Ruiz-Gómez, F.J. Integration of WorldView-2 and airborne laser scanning data to classify defoliation levels in Quercus ilex L. dehesas affected by root rot mortality: Management implications. For. Ecol. Manag. 2019, 451, 117564. [Google Scholar] [CrossRef]
  75. Sánchez-Cuesta, R.; Ruiz-Gómez, F.J.; Duque-Lazo, J.; González-Moreno, P.; Navarro-Cerrillo, R.M. The environmental drivers influencing spatio-temporal dynamics of oak defoliation and mortality in dehesas of Southern Spain. For. Ecol. Manag. 2021, 485, 118946. [Google Scholar] [CrossRef]
Figure 1. Analysis of tree defoliation status: (a) Defoliation of selected trees (bar chart) and average defoliation of the plots in 2019 (blue points). Trees are sorted from low to high defoliation. Colors correspond to positive (1) or negative (0) isolation of P. cinnamomi in the rhizosphere of the tree. Error bars represent the SE of the average plot defoliation. (b) Scatterplot of defoliation of selected trees vs. average plot defoliation, including linear regression representation and statistics of the regression model. Error bars represent the SE of the average plot defoliation.
Forests 12 00945 g001
Figure 2. Descriptive analysis of MGI for the 95 Trichoderma spp. isolates tested against P. cinnamomi P90 strain: (a) boxplot considering the antagonistic level of the strains against P. cinnamomi following Li et al. [45]; (b) histogram with normal curve (dashed red) and density curve (blue) of MGI arcsin-transformed values.
Forests 12 00945 g002
Figure 3. Interaction analysis between presence of P. cinnamomi and tree defoliation over MGI: (a) boxplot of MGI depending on tree defoliation and presence of P. cinnamomi; (b) interaction graph for presence of P. cinnamomi and tree defoliation (adjusted means models graph) including violin scatter with data of the MGI of the 95 Trichoderma spp. strains isolated.
Forests 12 00945 g003
Figure 4. Mycoparasitism of Trichoderma strains against P. cinnamomi in dual cultures. (AJ) Physical interactions after 14 days on PDA between P. cinnamomi (up) native strain and Trichoderma spp. (down) (AC,E,J: T. gamsii, D: T. viridarium, F: T. olivascens, G: T. hamatum, H: T. linzhiense, I: T. hirsutum). (KM) Micrographs of the interaction zone. (K,L) = hyphal coiling and vacuolated hyphae. (M) = adhered hyphae growth. p, P. cinnamomi. t, Trichoderma. Scale = 250 µm.
Forests 12 00945 g004
Table 1. Characteristics of the selected trees and the plots from which they belong. Defoliation values of plots (%) are expressed as the average of the crown transparency of the 24 trees belonging to each plot, and plot characteristics (height—H, and diameter at breast height—DBH) are represented as the mean value of 24 trees ± SE. All the values, including tree defoliation, and H and DBH values, were extracted from the SEDA Network database (http://www.juntadeandalucia.es/medioambiente/site/rediam, accessed on 11 January 2021).
-Average Plot
Defoliation (%)
Average Plot
Characteristics
-Tree
Defoliation (%)
Tree
Characteristics
Plot Code20152019H (m)DBH (cm)Tree Id20152019H (m)DBH (cm)
CO102333.543.46.56 ± 0.1934.17 ± 2.03150404.8024.00
CO110120.123.76.87 ± 0.2538.67 ± 2.17225207.0029.00
HU102725.038.79.29 ± 0.4538.76 ± 2.233152012.0053.00
----430358.5028.00
HU102837.148.75.05 ± 0.2124.00 ± 1.91510305.0032.00
----620305.6028.00
SE104821.925.66.66 ± 0.2438.03 ± 1.49740108.7049.90
----820107.0039.00
SE105021.727.59.43 ± 0.4239.77 ± 2.349202011.5042.70
----10252010.5039.00
----11304010.5046.10
Table 2. Comparison between previous metabarcoding results [33] and classic isolation from soil samples. OTU: operational taxonomic unit resulting from the consensus sequence clustering of the metabarcoding analysis of soil DNA for fungal and oomycete communities. Numbers represent the frequency of the OTUs appearing in the rarefied abundance matrix. The symbol # indicates that frequencies refer to a single OTU (OTU#51: Trichoderma sp., OTU#4: P. cinnamomi).
Trichoderma spp.Phytophthora spp.P. cinnamomi
PlotTreeOTU#51IsolationOTUsIsolationOTU#4Isolation
CO10231165121-
CO110124623626-
HU102731639223-
4219936910
HU1028551843-
6512195-
SE104875263451755
811229181167
SE1050988670-
1091220-
1180621-
Table 3. Trichoderma species found in the 11 selected trees, identified through amplification of the translation elongation factor 1 alpha gene (tef1α) and the RNA polymerase II subunit (rpb2) gene.
IsolateTEF1αRPB2CladeGene Bank Accession Numbers
TEF1 αRPB2
T8 #1.1T. gamsiiT. gamsiiVirideMZ552289MZ552272
T8 #11.1T. viridariumT. viridariumVirideMZ552291MZ552274
T8 #10.1T. hamatumT. hamatumHamatumMZ552290MZ552273
T9 #2.5T. olivascensT. olivascensViridescensMZ552292MZ552275
T9 #5.5T. gamsiiT. gamsiiVirideMZ552293MZ552276
T10 #1.6T. virensT. virensGreenMZ552294MZ552277
T9 #8.5T. olivascens-ViridescensMZ552306-
T10 #8.6T. gamsiiT. gamsiiVirideMZ552295MZ552278
T10 #11.6T. paraviridescensT. paraviridescensViridescensMZ552296MZ552279
T10 #13T. hamatum-HamatumMZ552307-
T11 #2.1T. linzhiense-HarzianumMZ552308-
T11 #6.1T. hamatumT. hamatumHamatumMZ552297MZ552280
T11 #9.1T. hirsutumT. hirsutumHarzianumMZ552298MZ552281
T11 #11.1T. gamsiiT. gamsiiVirideMZ552300MZ552283
T3 #16.2T. harzianum-HarzianumMZ552309-
T3 #18.2T. gamsiiT. gamsiiVirideMZ552301MZ552284
T5 #2.3T. gamsiiT. gamsiiVirideMZ552302MZ552285
T5 #4.3T. gamsiiT. gamsiiVirideMZ552303MZ552286
T11 #10.1T. gamsiiT. gamsiiVirideMZ552299MZ552282
T5 #7.3T. gamsiiT. gamsiiVirideMZ552304MZ552287
T2 #15T. samuelsiiT. samuelsii-MZ552305MZ552288
Table 4. Percentage of inhibition and mycoparasitism scale of the selected Trichoderma strains against the native P. cinnamomi. 1 Mycoparasitism scale: colonisation scale of the antagonist on the pathogen colony [46].
IsolateStrainMGI (%)Mycoparasitism Scale 1
T8 #11.1T. viridarium90.894
T5 #2.3T. gamsii88.363
T11 #10.1T. gamsii86.674
T5 #4.3T. gamsii85.094
T9 #8.5T. olivascens81.864
T5 #7.3T. gamsii80.363
T10 #13.6T. hamatum80.354
T9 #5.5T. gamsii77.334
T11 #2.1T. linzhiense76.534
T11 #9.1T. hirsutum75.904
Publisher’s Note: MDPI stays neutral with regard to jurisdictional claims in published maps and institutional affiliations.

