1. Introduction
Forest connectivity is critical for the long-term persistence and range shifts of forest-dependent species [
1,
2,
3]. In the face of contemporary climate change, the climate connectivity of forested areas is one of the most important factors that determine species’ ability to track suitable climate niches [
4,
5,
6,
7,
8,
9,
10]. Climate connectivity is defined as the degree to which a landscape allows species to shift their ranges to suitable habitats that are the same or cooler than their current habitats as the climate warms [
11,
12,
13]. Improving climate connectivity is both a necessary action and a viable solution to reduce the likelihood of local extinctions and biodiversity loss [
14,
15]. This is particularly urgent considering the rapid rate of climate change, which is expected to cause large shifts in the distributions of species in European forests.
Recent climate change has driven large shifts in the geographical ranges of species across Europe, especially for those inhabiting forested areas. However, such range shifts cannot guarantee their survival if the forests are not connected enough for species to track rapid climate change. In the Southern Scandes of Sweden, for example, tree lines were found to have shifted northward due to climate warming in the 20th century [
16]. Northward shifts have also been documented in the distributions of European birds and butterflies, which have moved 37 and 114 km, respectively, over two decades (1990–2008), lagging behind climate change by 212 and 135 km, respectively [
17]. In the Cantabrian Mountains (Spain), brown bear populations in temperate forested habitats are expected to decline considerably in the next 50 years, due to the potential impact of climate change on the distributions of their main food resources and shelter [
18]. Another study by Araujo et al. [
19] suggested that, by the end of this century, more than half of the assessed plant and terrestrial vertebrate species will lose suitable climatic conditions in European protected areas. Given these circumstances, habitat-based conservation strategies are unable to support the long-term persistence of species in European forests under climate change [
20,
21,
22]. It is therefore important to assess the climate connectivity of forested habitats for more effective conservation and management of biodiversity across Europe.
Recently, many methods have been proposed to assess climate connectivity at regional and continental scales. Some connectivity efforts have quantified climate connectivity as the paths or speed (also called climate velocity) at which species would need to shift their ranges to maintain climate conditions similar to those they experience today [
23,
24]. These climate connectivity methods require an identification of the closest future climate analogues based on geographical distances. For example, Dobrowski and Parks [
25] and Parks et al. [
14] quantified the climate velocity across North America along climate trajectories. Littlefield et al. [
4] and Carroll et al. [
26] delineated potential dispersal paths between current and future climate analogues across North America and identified climate connectivity areas where species range shifts are more likely to happen.
Some other studies have evaluated climate connectivity based on an identification of the coolest destination patch that can be reached from an origin patch by traversing a gradient of hotter to cooler adjacent patches. In these studies, climate connectivity was calculated as the temperature difference between the origin patch and its coolest destination. For instance, McGuire et al. [
11] created climate-gradient corridors of natural lands along temperature gradients across the United States and assessed to what extent habitat fragmentation could limit species range shifts. More recently, Senior et al. [
27] used a similar method to quantify the climate connectivity of tropical forests and changes in climate connectivity between 2000 and 2012. These studies offered a simple and rapid way to assess climate connectivity at global and regional scales.
Despite recent efforts on the assessment of climate connectivity, most of them were conducted in North America. To our knowledge, no attempt has been made in Europe. Therefore, this study conducted a European-wide study to calculate the climate connectivity of forest areas, using the method of Senior et al. [
27]. Here, climate connectivity was calculated as the temperature difference between each forest patch and the coolest patch that can be reached through temperature gradients. Our focus was on the structural connectivity (physical connections) of European forests for climate-driven migrations rather than on the composition of forest cover and the variable species-specific response to it. We also quantified the potential (frequency) of each forest patch to serve as a stepping stone for species range shifts and evaluated whether forests within the current network of protected areas are able to support range shifts. Our results identified forest areas of high importance for climate-driven range shifts and thus could provide information for climate-smart management of European forests.
2. Materials and Methods
Our study was conducted in three steps: (1) identify climate-partitioned forest patches, (2) evaluate climate connectivity, and (3) identify stepping stones. The three steps were accomplished through a combination of Python scripts and ArcMap.
2.1. Identify Forest Patches
The study area covered 43 European countries for which forest-cover data were obtained from Corine land-cover datasets for the year 2018 (
https://land.copernicus.eu/pan-european/corine-land-cover/clc2018, accessed on 22 May 2021). Three forest types were taken into account: broad-leaved forests, coniferous forests, and mixed forests. We classified the raster data of land cover to either forested or non-forested cells and resampled the forest-cover map to a resolution of 1 km. As our study considered climate change the main driver of species range shifts, the forested cells were partitioned into forest patches based on their temperatures. Climate data were obtained from the WorldClim Version 2 database [
28] (
https://www.worldclim.org, accessed on 22 May 2021). We used the annual mean temperature data at a spatial resolution of 30 seconds for the years 1970–2000 as current temperature data. We then projected the temperature data in our study area to the projection of the land-cover data—the Lambert azimuthal equal-area (ETRS_1989_LAEA) projection—and resampled them to a resolution of 1 km, using bilinear interpolation.
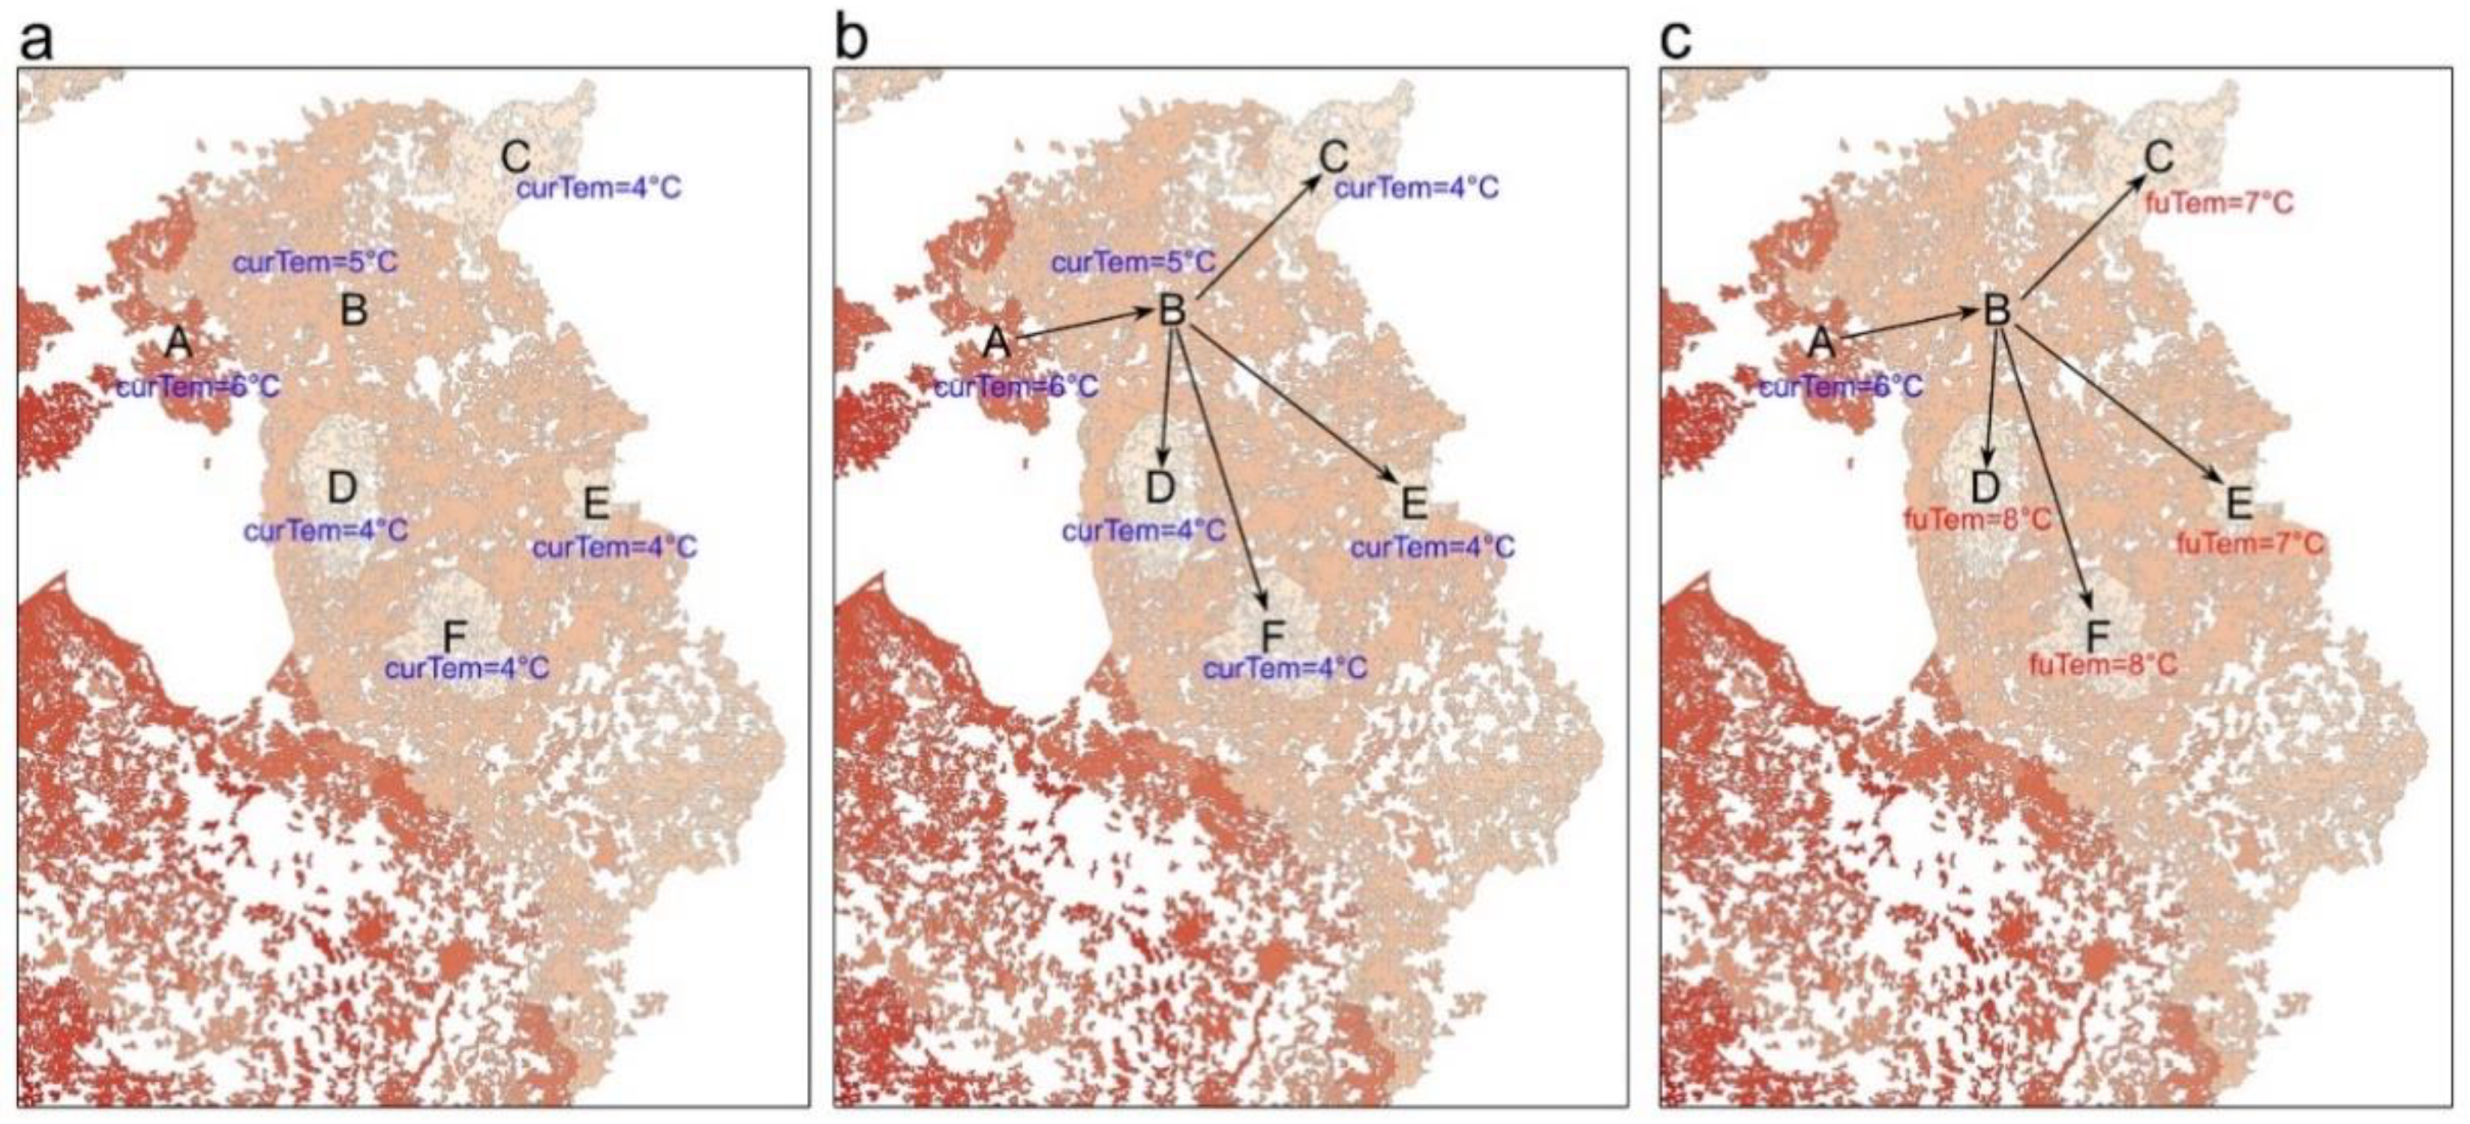
By overlapping the current temperature map and the forest-cover map, the forested cells were assigned to their current temperature values, which were then reclassified to 1 °C increments over a full range of −3 to 20 °C. The resulting raster data were converted into polygons to aggregate neighbouring forested cells in the same temperature increment into forest patches (
Figure 1a). To facilitate the following computation of inter-patch distances, we removed patches smaller than 10 km
2. These patches may be too small to allow sufficient population sizes for long-term persistence and range shifts [
1]. The same patch-size threshold has been used in previous analyses on climate connectivity at regional and continental scales [
11,
12,
27].
After that, each patch was also assigned a mean future temperature value for the years 2081–2100. Future temperature data were derived from the average of climate projections of eight CMIP6 Global Climate Models obtained from the WorldClim Version 2 database (namely BCC-CSM2-MR, CNRM-CM6-1, CNRM-ESM2-1, CanESM5, IPSL-CM6A-LR, MIROC-ES2L, MIROC6, and MRI-ESM2-0) at a spatial resolution of 2.5 min. Our study considered two emission scenarios, Shared Socio-Economic Pathways (SSPs): 245 and 585, which represent the moderate and the most severe (‘business as usual’) scenarios, respectively, to exhibit a likely range of future climate warming.
2.2. Evaluate Climate Connectivity
The distributions of terrestrial species have been found to be related to latitudinal shifts in isotherms [
29]. Therefore, our method assumed that species trace suitable climate conditions through directional paths traversing gradients of hotter to cooler patches. Patches within 2 km of each other are assumed to be connected enough for species to move across non-forest areas [
11,
27]. This assumption allows for an assessment of the structural connectivity between forested areas for terrestrial species to reach future habitats. In this way, the dispersal abilities of species are not considered in the study, in contrast to those studies that focus on functional connectivity [
4,
12]. Here, we used an ArcGIS extension, Conefor Input tool, to calculate the pairwise (Euclidean) distances between edges of forest patches within a distance threshold of 2 km.
Based on the current temperatures of forest patches, we identified directional paths between patches from hotter to cooler (
Figure 1b), using the Python NetworkX package. We then built a directed graph with all the directional paths and used Dijkstra’s method to compute the shortest directional paths between all patches in the graph. After that, we identified the coolest destination in the future that can be reached from each patch as a designated destination for the origin patch (
Figure 1c). For patches that are not connected to cooler neighbours, their destinations were assigned as themselves.
According to the definition of climate connectivity, our study aimed to measure the extent to which European forest cover allows species to reach suitable habitats that are the same or cooler in the future than the temperatures they currently experience. To this end, climate connectivity can be measured as the maximum temperature difference between each patch and its destinations along temperature gradients. More specifically, the climate connectivity of each forest patch was calculated as its current temperature minus the future temperature of its coolest reachable patch. Higher values indicate better climate connectivity. Zero or positive values of climate connectivity suggest a success to achieve enough connectivity for climate-driven range shifts, while patches with negative values indicate a failure at achieving climate connectivity.
2.3. Identify Stepping Stones
To identify forest areas of importance for climate connectivity, we further evaluated the potential of each forest patch to serve as a stepping stone for species range shifts along temperature gradients. This was achieved by calculating the frequency that each patch could function as a node in the shortest directional path from any patch to its coolest destination patch, using the Python NetworkX package (
Figure 1c). The origin and destination patches in each directional path are included in the calculation of stepping stones.
Finally, to evaluate whether current protected areas in Europe are able to support climate migrations, we overlapped the results of stepping stones and climate connectivity with the map of Natura 2000 (
https://www.eea.europa.eu/data-and-maps/data/natura-11, accessed on 1 June 2021), which is a network of protected areas for Europe’s most valuable and threatened species and habitats.
3. Results
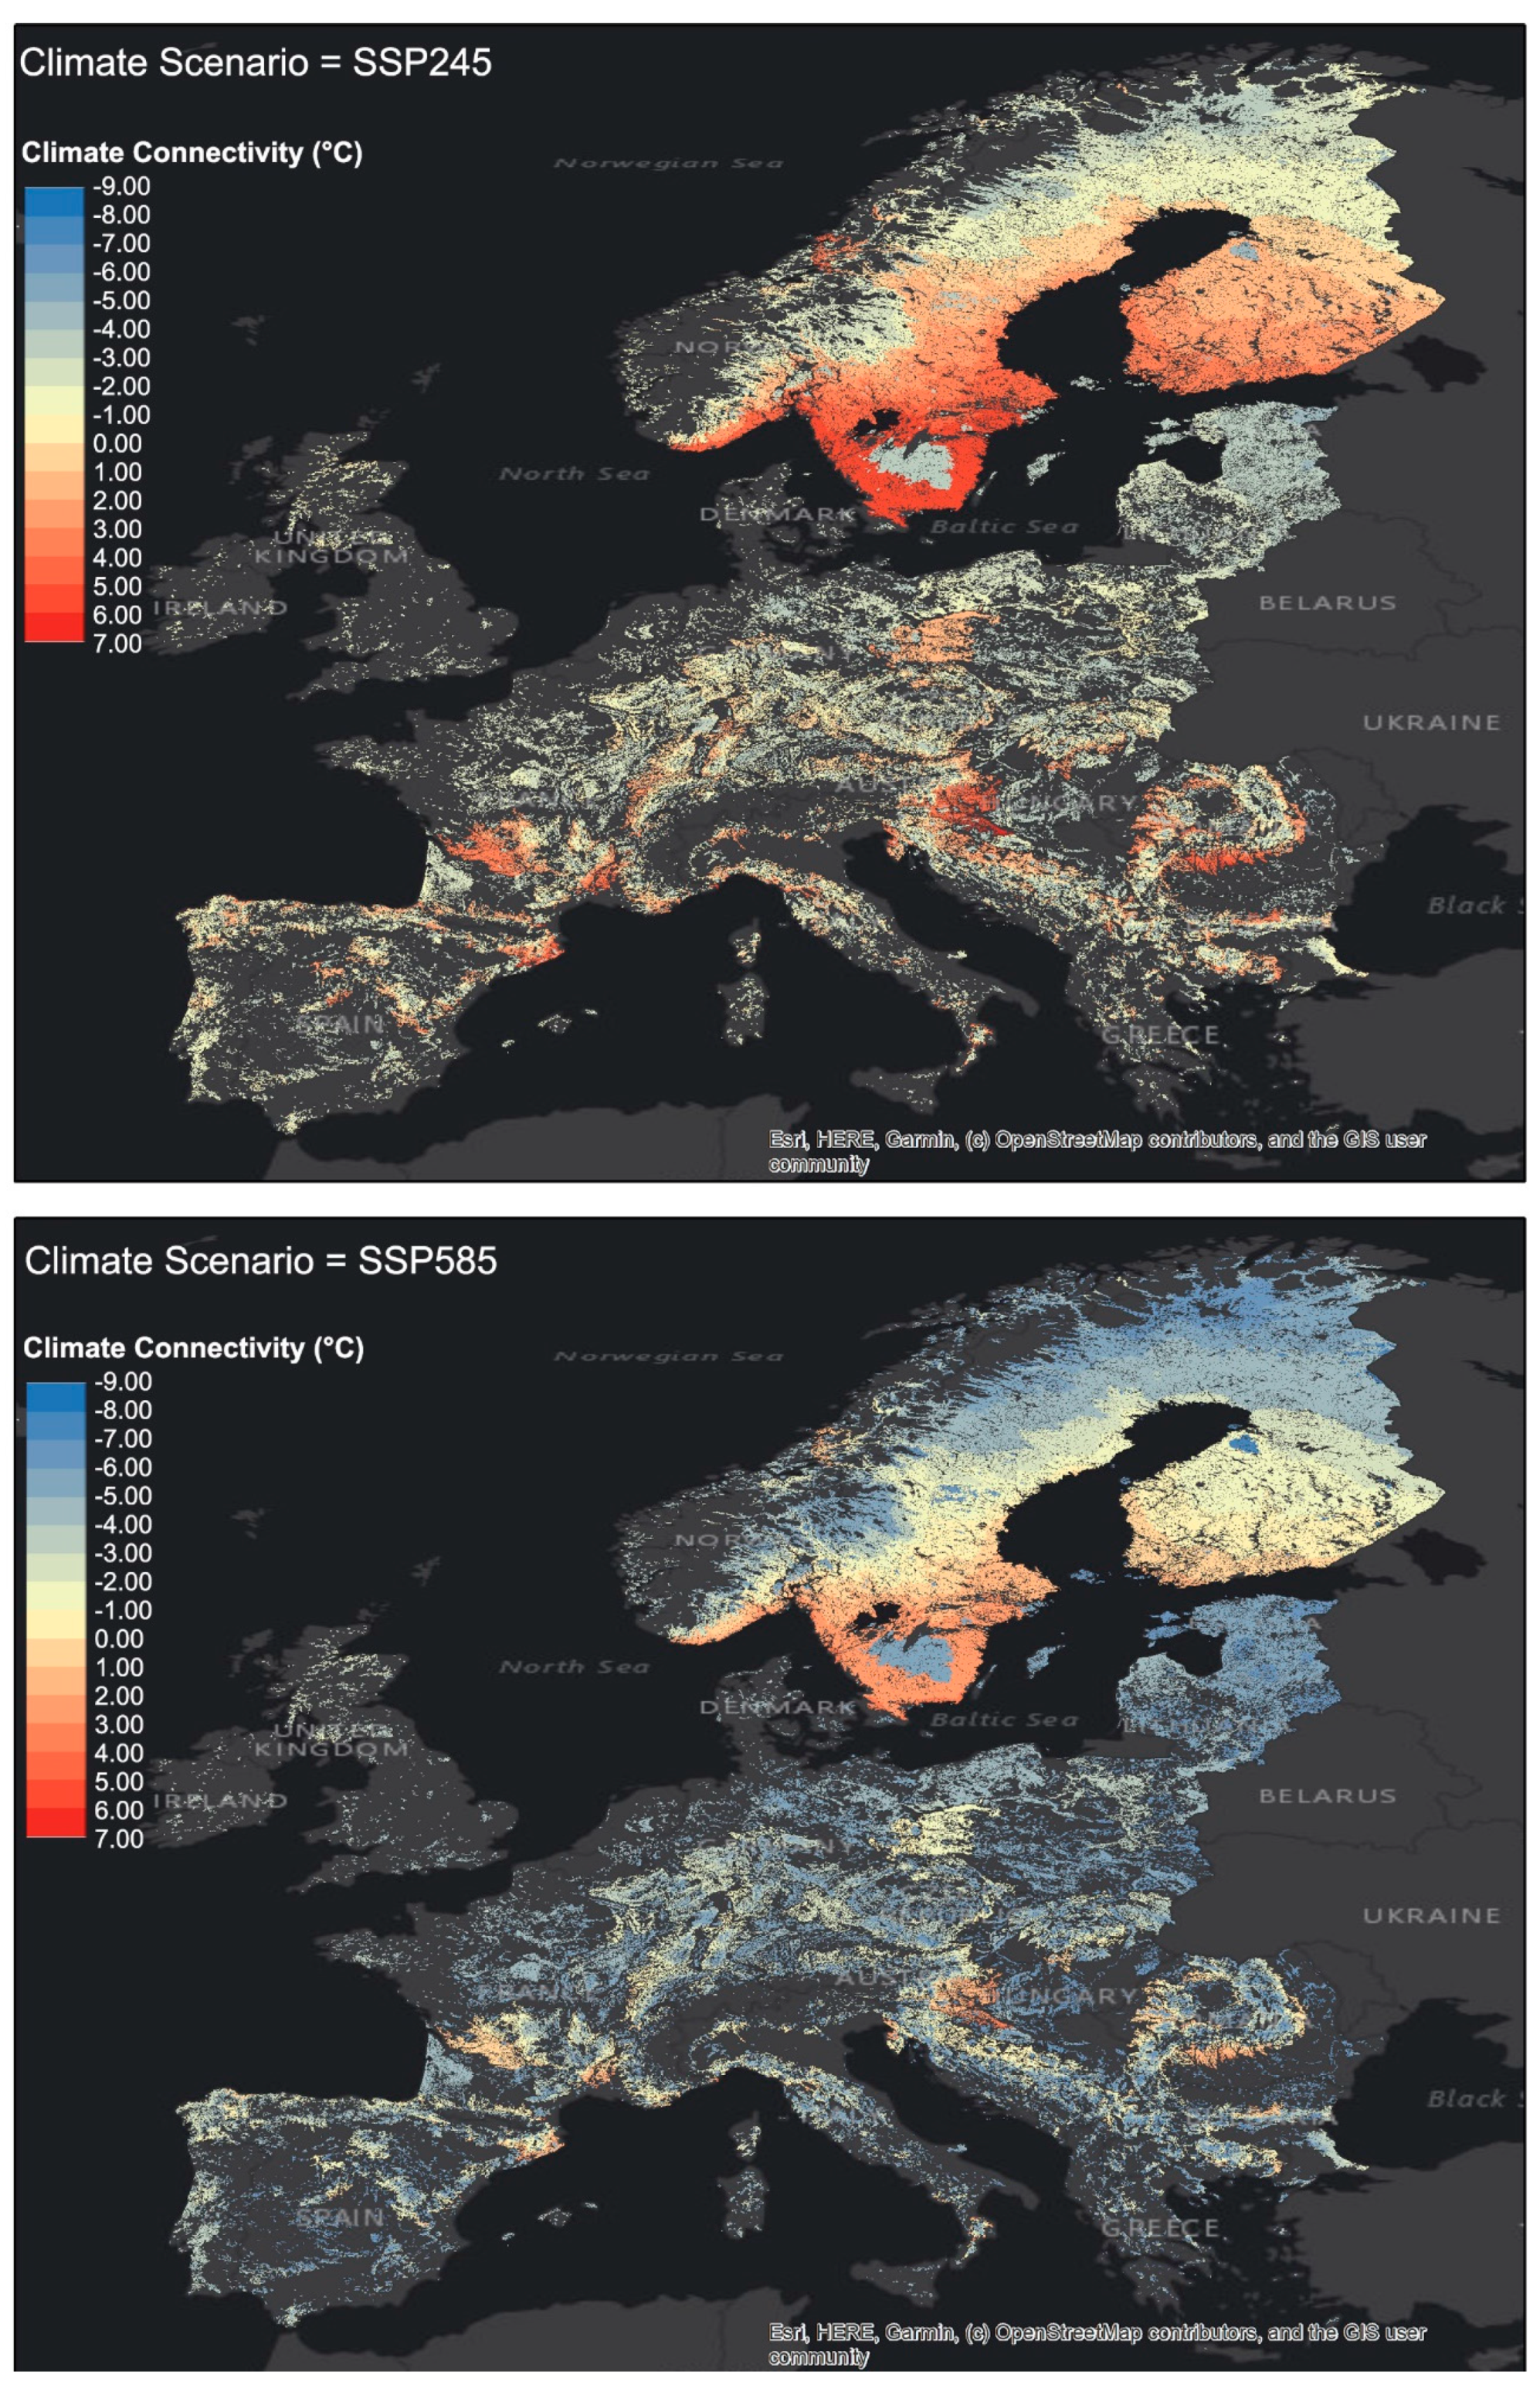
As shown in the resulting maps of climate connectivity (
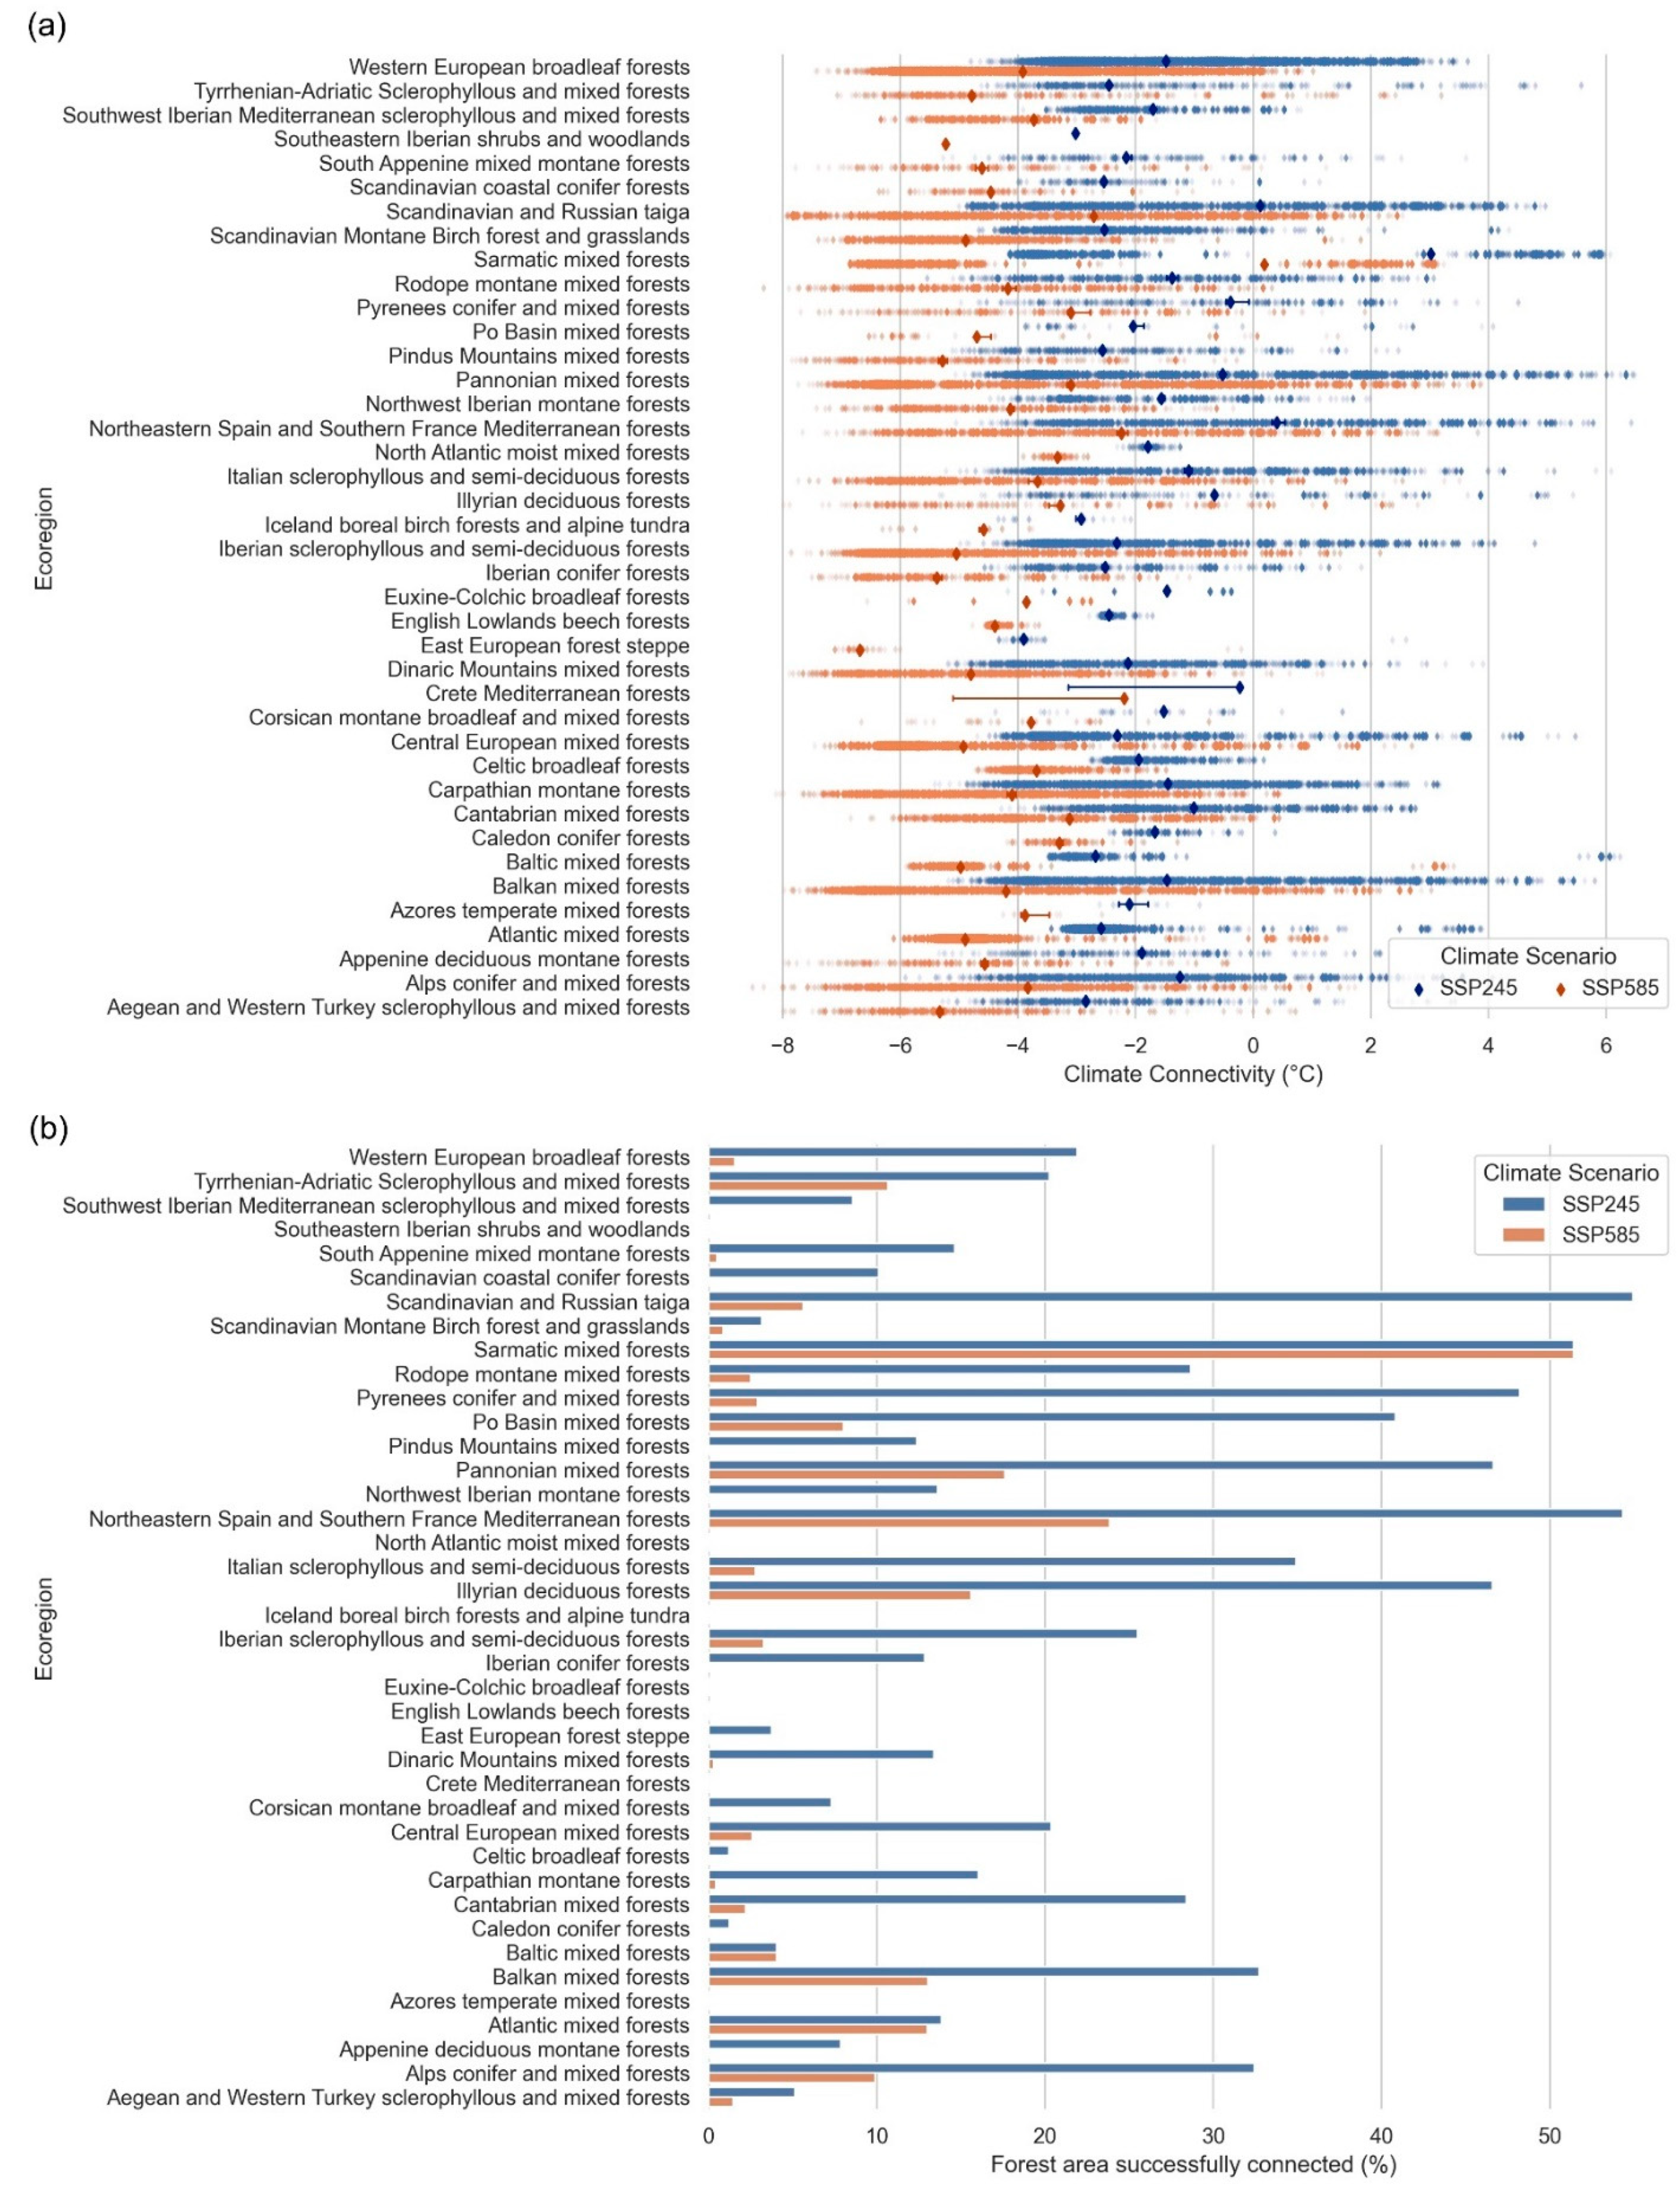
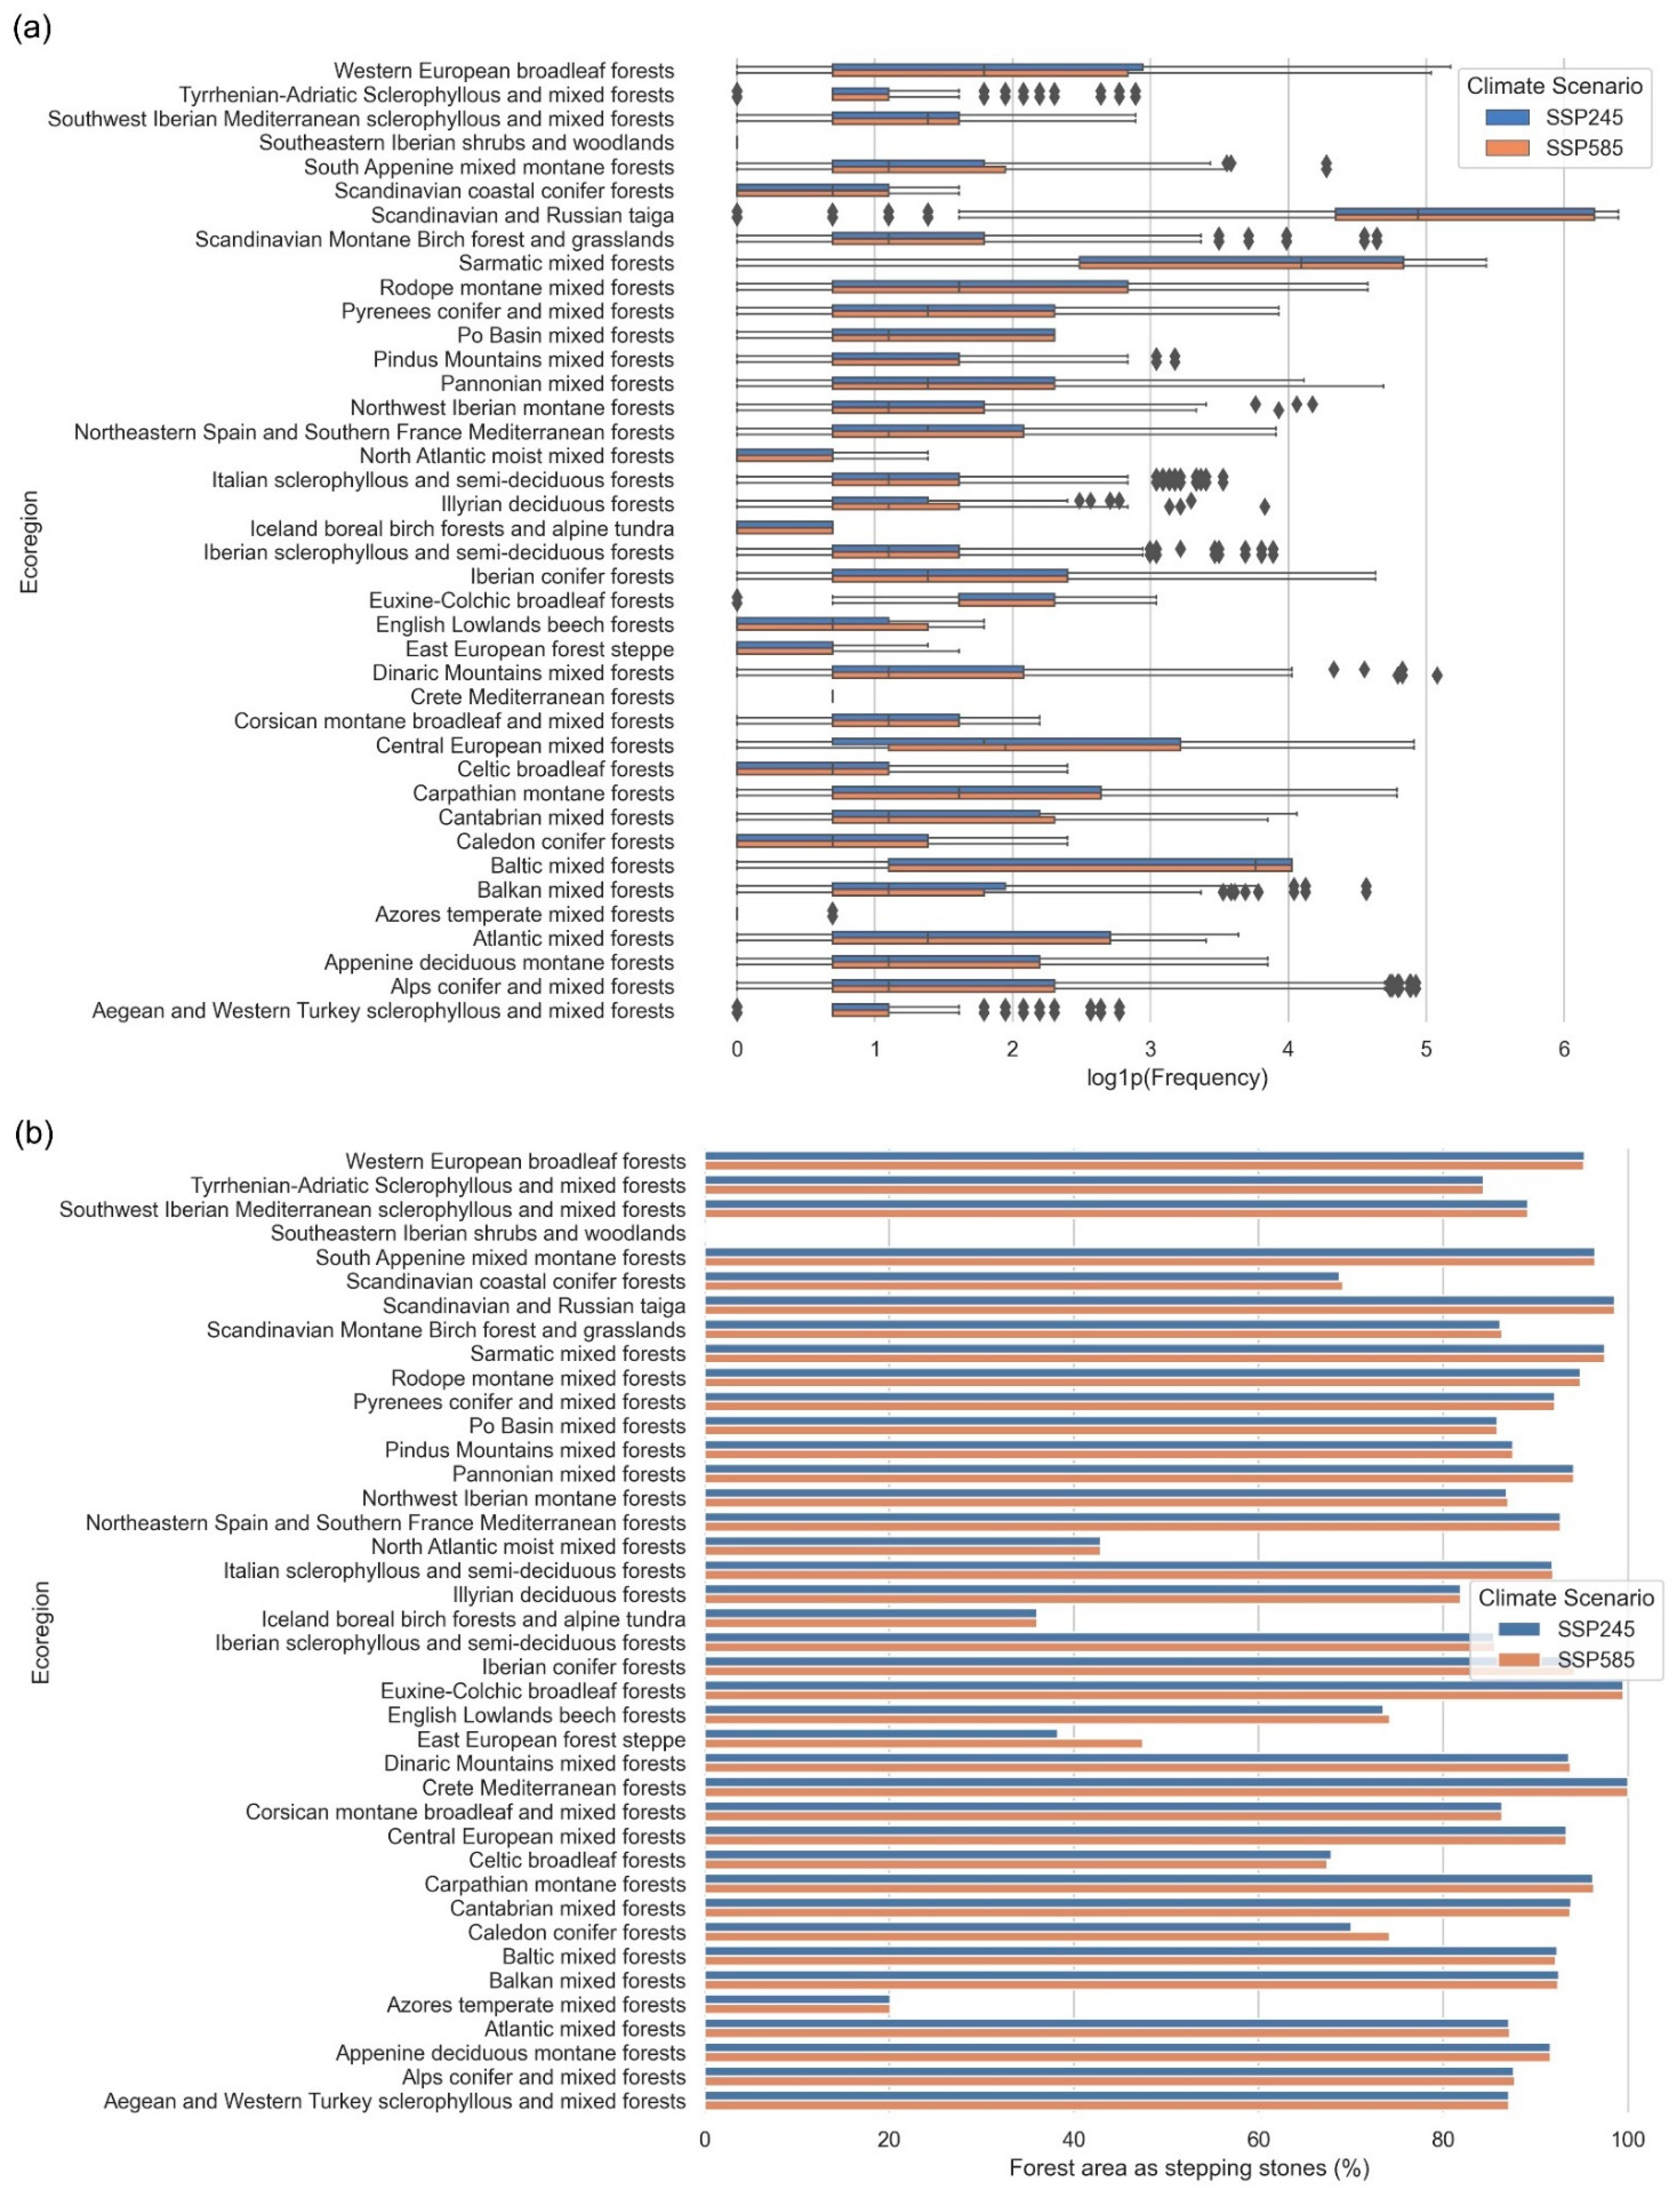
Figure 2), forest cover is unequally distributed over Europe and shows significantly different climate connectivity across different regions. On average, species that shift their distributions through current forest cover would still experience a warming of 0.73 °C (ranging from −5.91 to 6.49 °C) under the moderate emission scenario (SSP245) or 3.35 °C (ranging from −8.51 to 3.89 °C) under the most severe scenario (SSP585). These estimates vary largely over the 40 forest-dominated ecoregions in Europe (
Figure 3a). The ecoregion ‘Sarmatic mixed forests’ exhibits the highest climate connectivity (median value), which is positive under both climate scenarios. This is followed by ‘Northeastern Spain and Southern France Mediterranean forests’ and ‘Scandinavian and Russian taiga’, showing positive values under SSP245 but negative values under SSP585. All the other ecoregions show negative (median) values of climate connectivity under both climate scenarios. This means that species now living in these areas are facing a situation where the likelihood of tracking their climate niches is very low as the climate warms. Particularly, forests in the East European forest-steppe ecoregion are the least well connected, with median climate connectivity much lower than the others. Source data of the results are provided as a Source Data file.
Overall, about 36% of the total forested area in Europe has achieved successful climate connectivity for inhabiting species to track climate change under the moderate emission scenario (SSP245). This is much lower under the highest emission scenario (SSP585), which is only 12%. The percentage of successfully connected forests also varies by ecoregions but exhibits a slightly different pattern than for climate connectivity values (
Figure 3b). If the climate warms under the moderate scenario, more than half of the forested areas in the ecoregions ‘Scandinavian and Russian taiga’, ‘Northeastern Spain and Southern France Mediterranean forests’, and ‘Sarmatic mixed forests’ are connected enough to allow for successful range shifts to track climate change, followed by ‘Pyrenees conifer and mixed forests’, ’Pannonian mixed forests’, ‘Illyrian deciduous forests’, and ‘Po Basin mixed forests’. An increase in greenhouse gas emissions is expected to significantly reduce the percentage of successfully connected forests in some ecoregions. If the climate warms under SSP585, only 6% and 24% of the total forested area in ‘Scandinavian and Russian taiga’ and ‘Northeastern Spain and Southern France Mediterranean forests’, respectively, will be successfully connected, compared to 55% and 54%, respectively, under SSP245. In particular, ‘Sarmatic mixed forests’ is the only ecoregion with more than 50% of its forested areas successfully connected under both climate scenarios, while most of the forested areas in ‘Southeastern Iberian shrubs and woodlands’, ‘North Atlantic moist mixed forests’, ‘Iceland boreal birch forests and alpine tundra’, ‘Euxine-Colchic broadleaf forests’, ‘English Lowlands beech forests’, ‘Crete Mediterranean forests’, and ‘Azores temperate mixed forests’ fail to achieve enough connectivity for climate-driven migrations under either the moderate or the highest scenario.
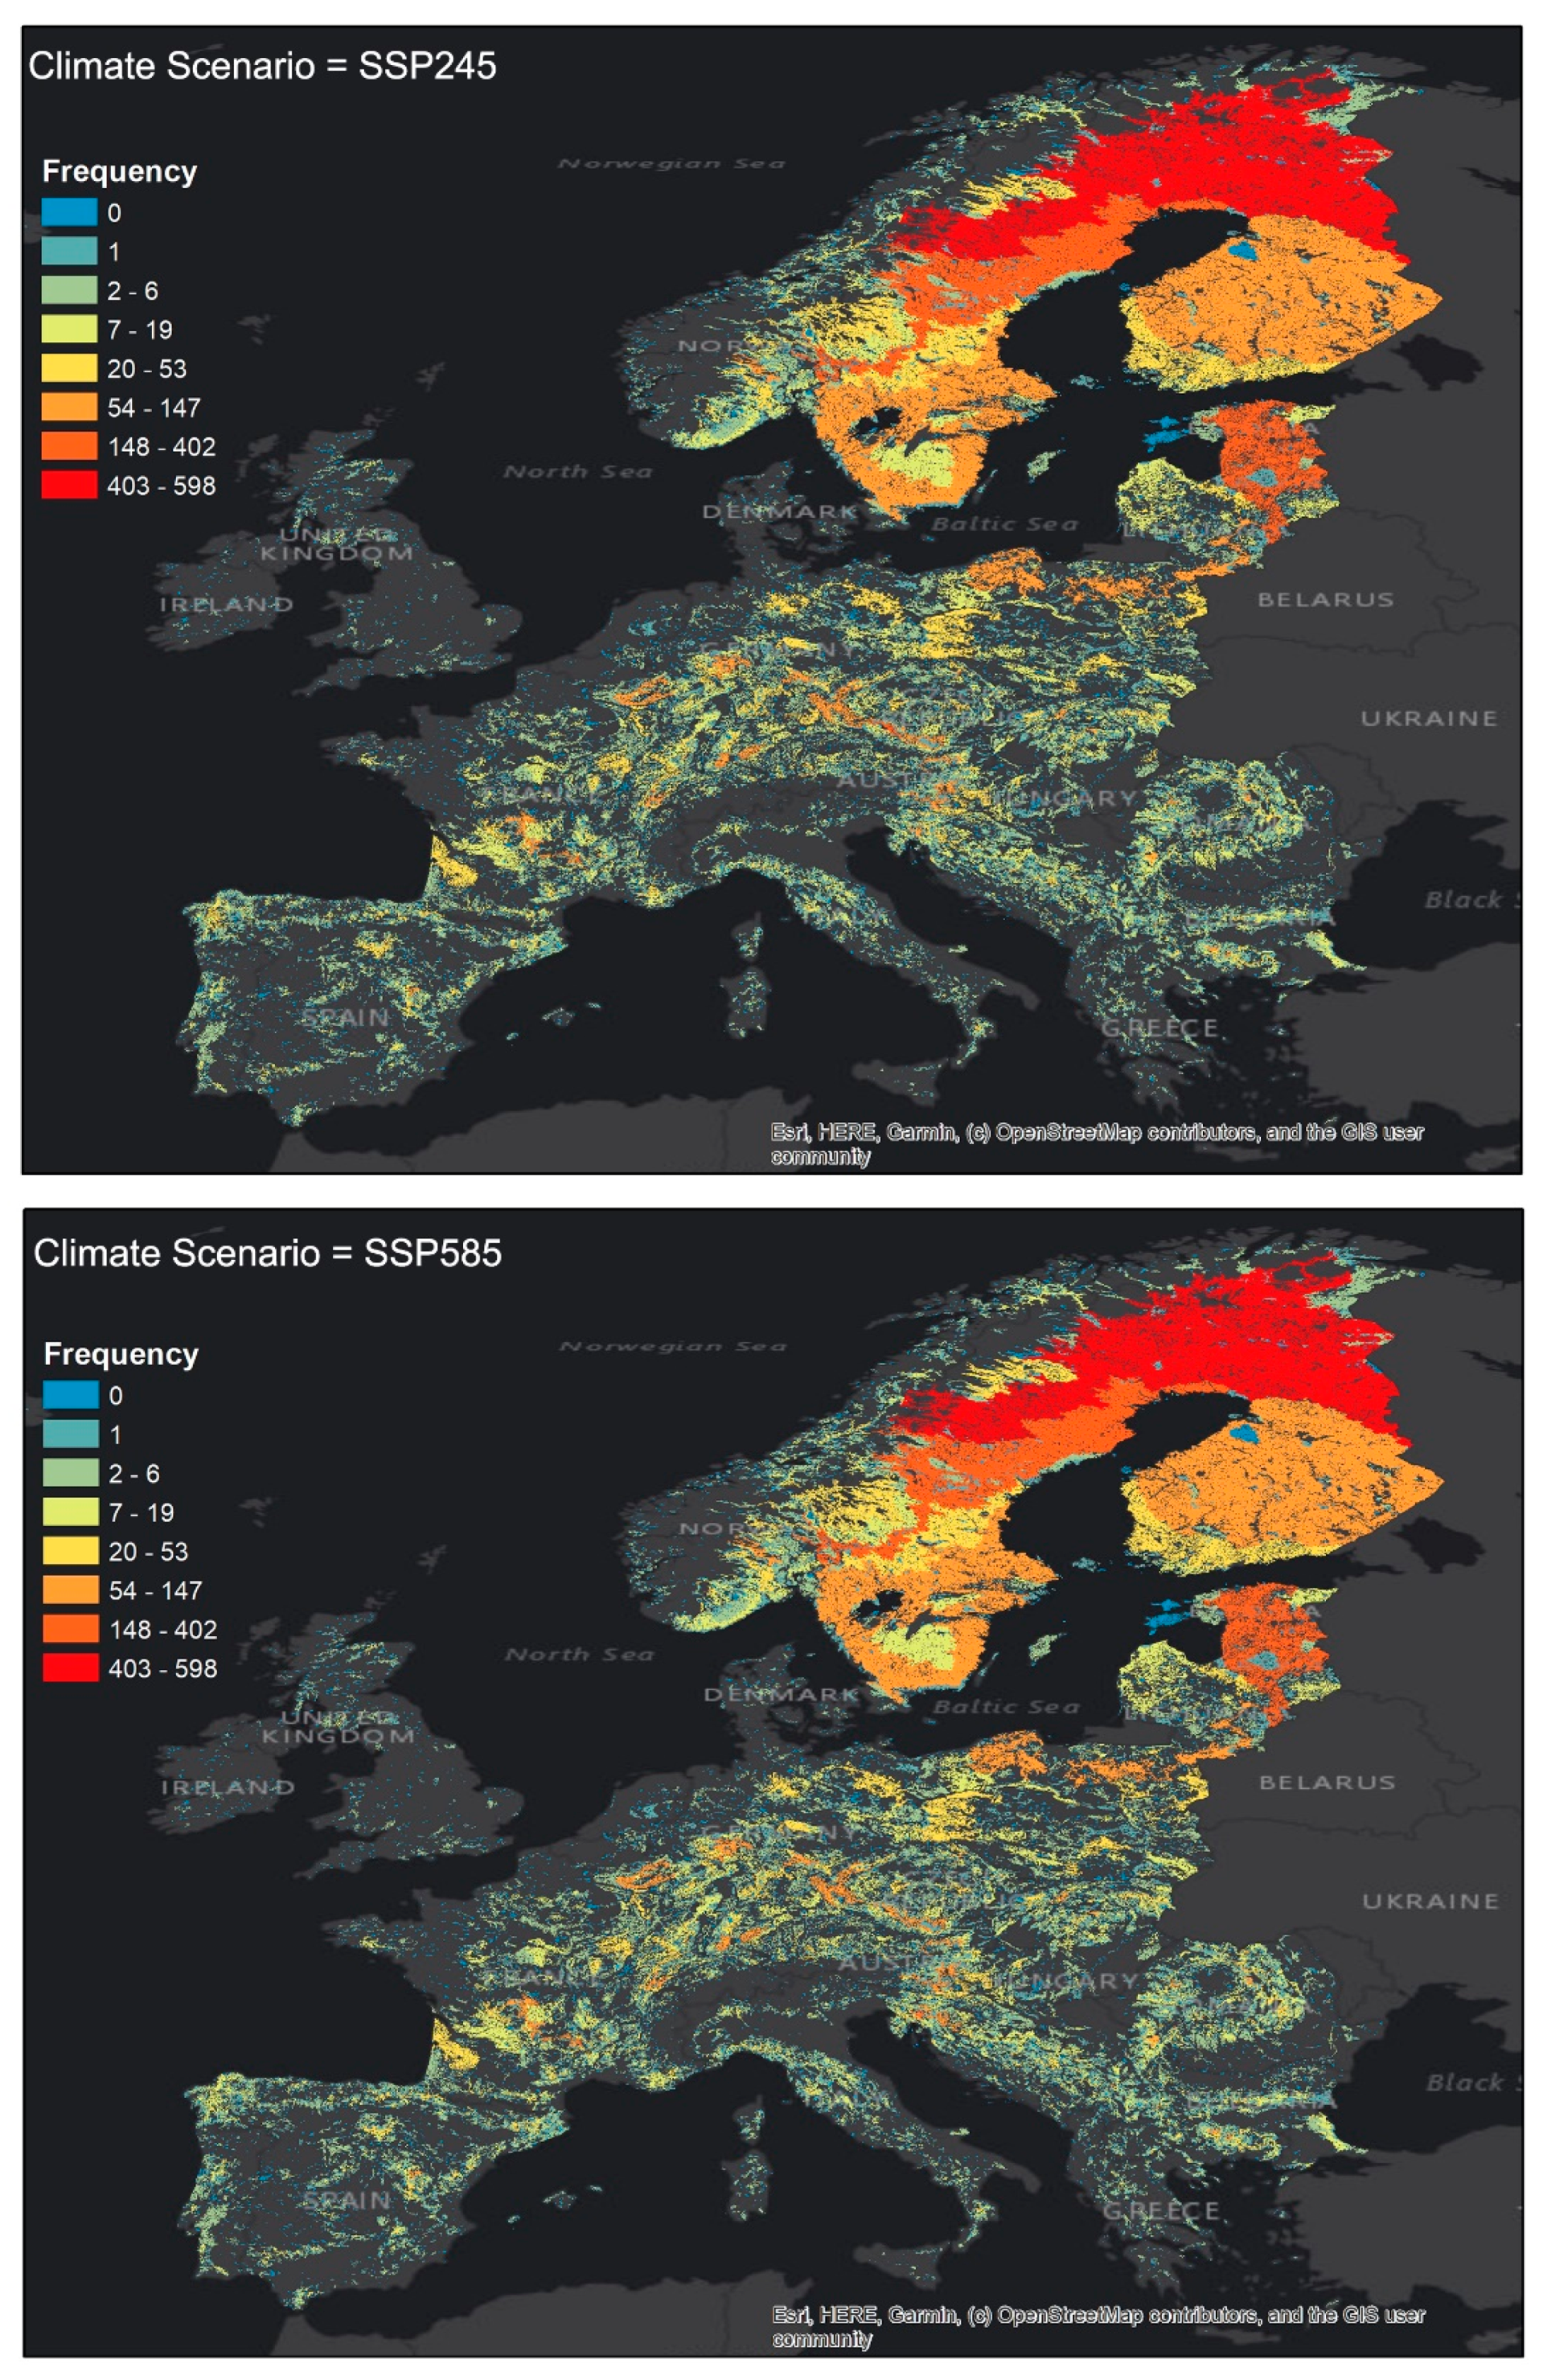
Our results of stepping stones showed that about 94% of the European forested area is expected to experience species range shifts. The results under both climate scenarios appeared similar spatial patterns (
Figure 4). Forested areas with high frequency (median values) to serve as stepping stones were concentrated in the ecoregions in Northern Europe, such as ‘Scandinavian and Russian taiga’, ’Sarmatic mixed forests’, and ‘Baltic mixed forests’ (
Figure 5a). These areas are more likely to facilitate climate-driven range shifts than the others and thus are of high importance for sustaining climate connectivity. In most of the forest-dominated ecoregions, more than 60% of the total forested area could serve as a stepping stone for movements between patches and their coolest destinations, except ‘Southeastern Iberian shrubs and woodlands’, ‘Azores temperate mixed forests’, ‘East European forest-steppe’, ‘Iceland boreal birch forests and alpine tundra’, and ‘North Atlantic moist mixed forests’ (
Figure 5b). Under both climate scenarios, ‘Crete Mediterranean forests’ and ‘Euxine-Colchic broadleaf forests’ are ecoregions that have the highest proportion (~100%) of stepping-stone forests. In contrast, only 20% of the forested areas in ‘Azores temperate mixed forests’ are expected to support species range shifts and no forests in ‘Southeastern Iberian shrubs and woodlands’ could serve as stepping stones. Source data of the results are provided as a Source Data file.
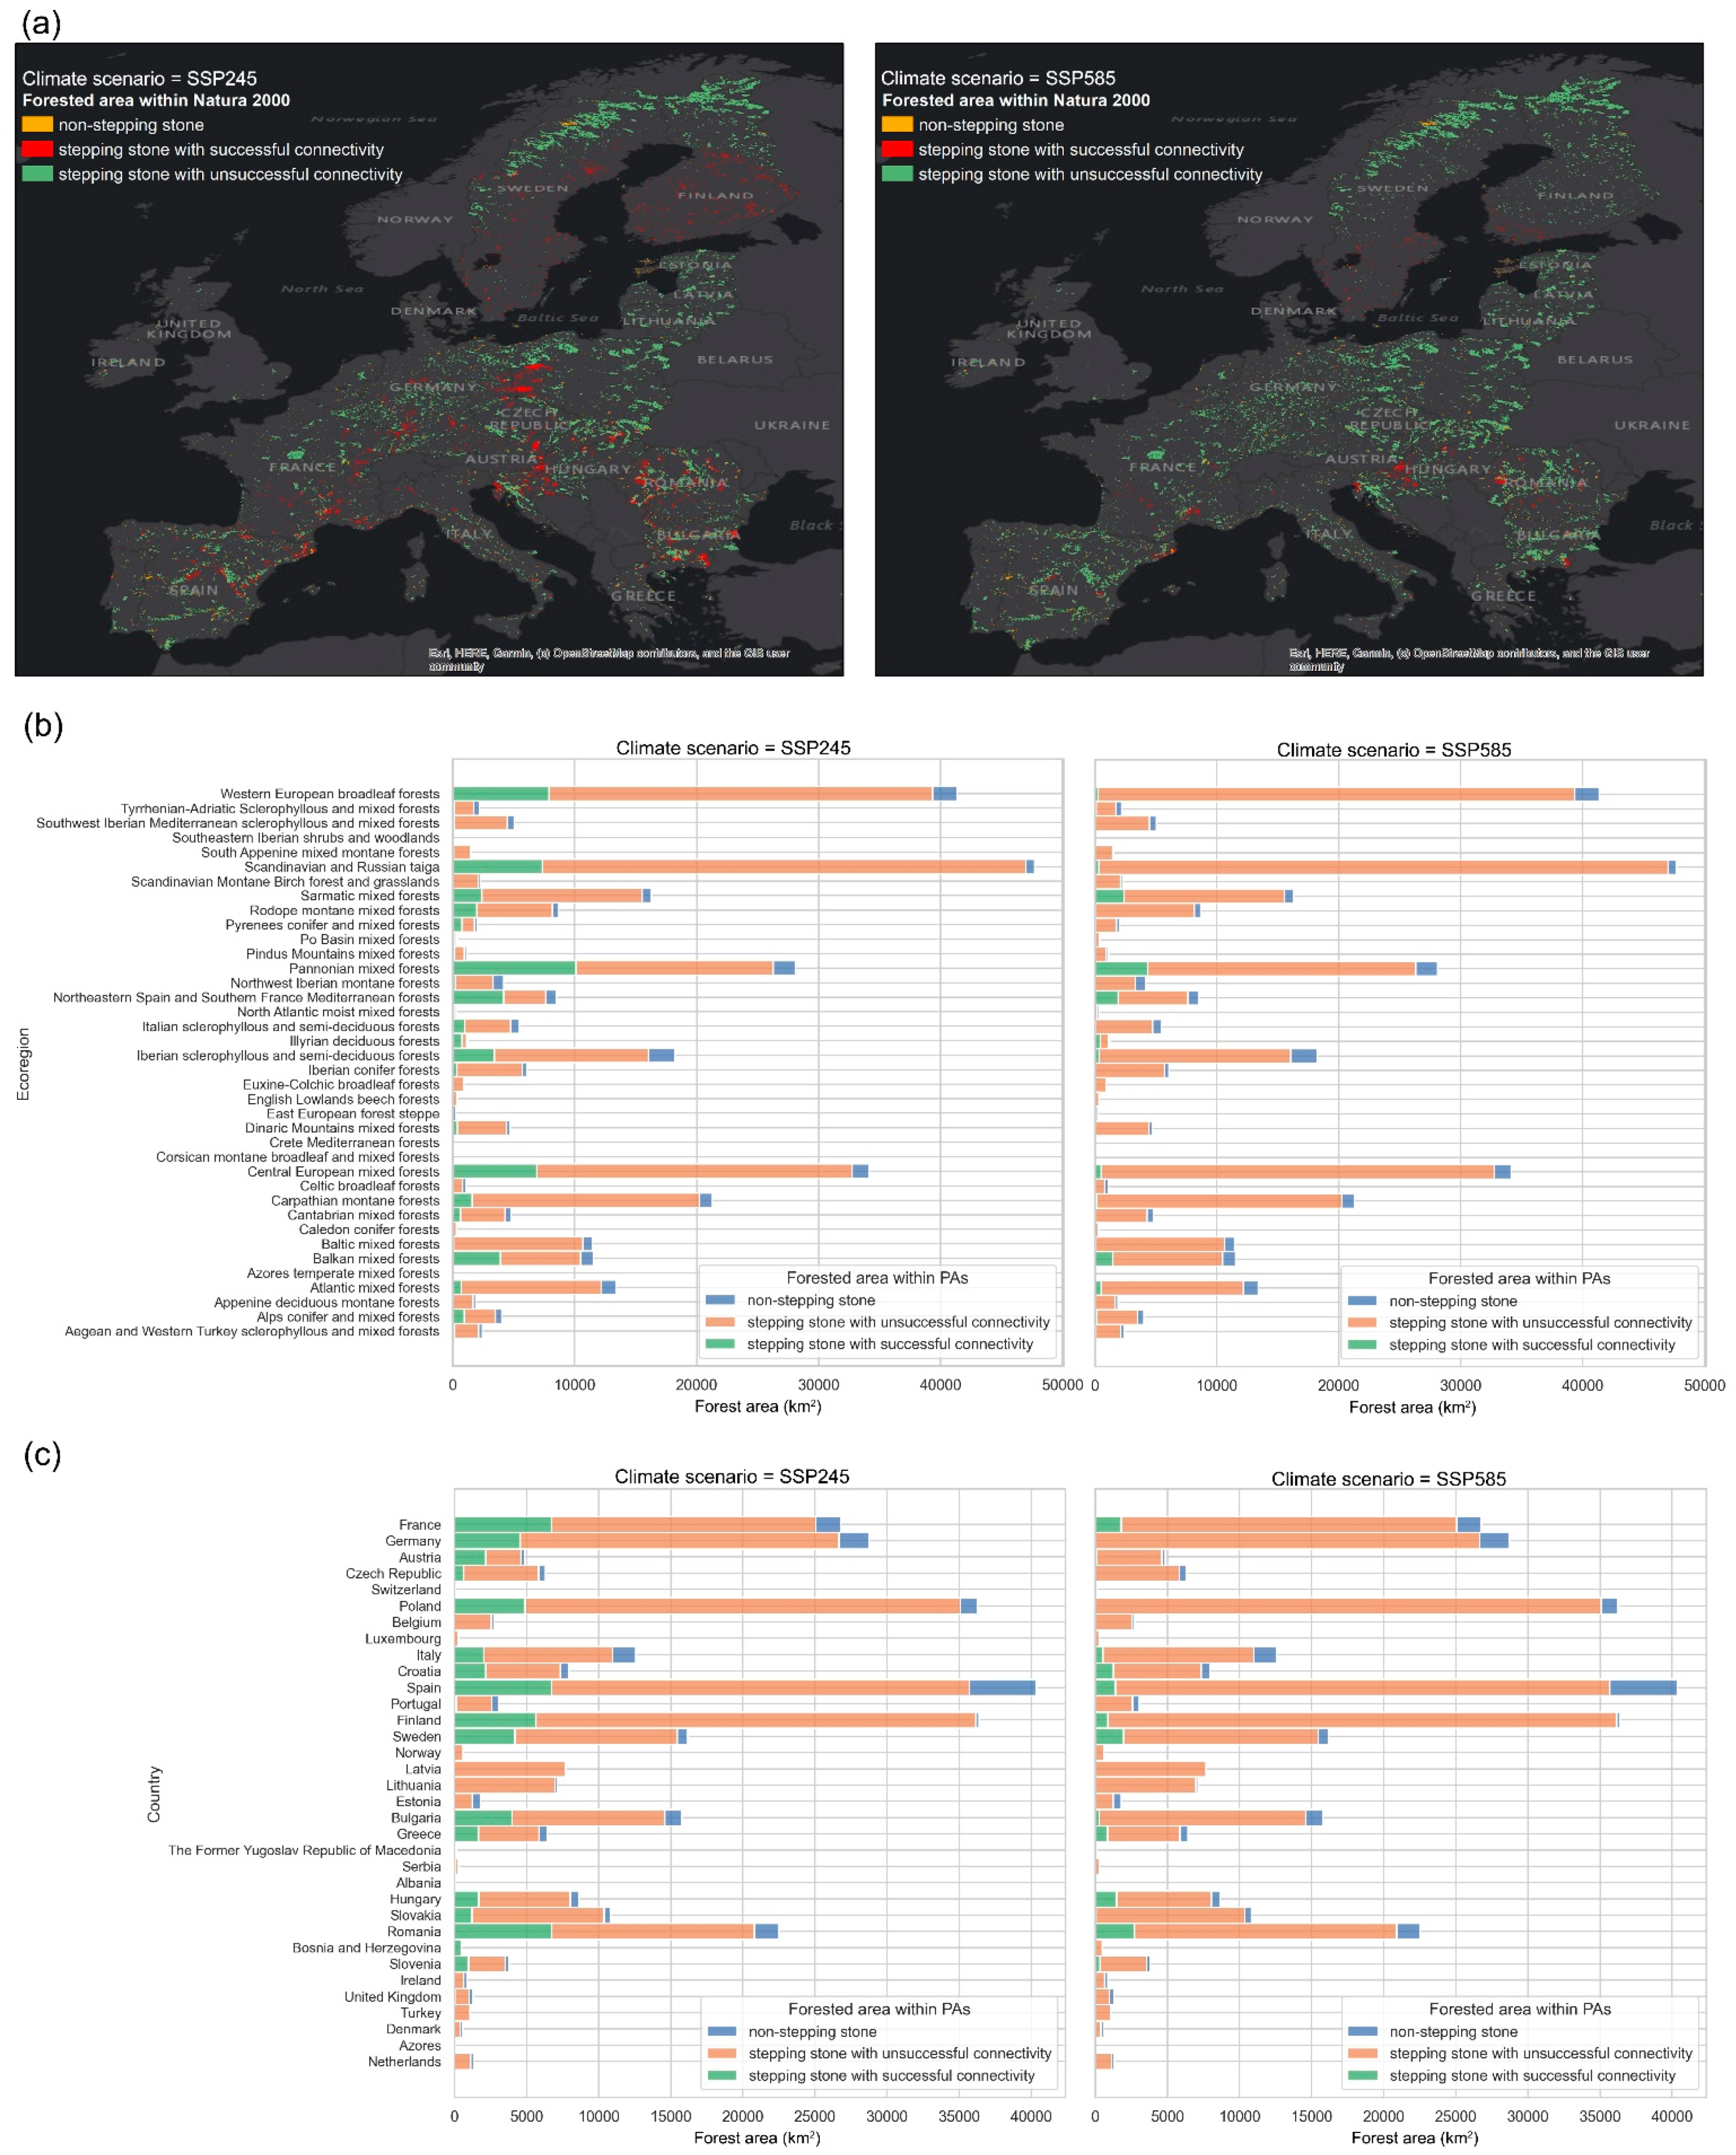
By overlapping the results of stepping stones and the network of protected areas in Europe, Natura 2000, we found that about 17% of the stepping-stone forests are located in European protected areas, accounting for 93% of the total forested area within Natura 2000 (
Figure 6). For the stepping-stone forests within Natura 2000 that are expected to experience species range shifts, 19% and 5% of them have achieved successful climate connectivity for species to track climate change under scenarios SSP245 and SSP585, respectively. If the climate warms under the moderate scenario, most of the forested areas with sufficient climate connectivity are concentrated in Spain, Romania, France, Finland, Germany, Poland, Sweden, and Bulgaria, including ‘Pannonian mixed forests’, ‘Scandinavian and Russian taiga’, ‘Western European broadleaf forests’, and ‘Central European mixed forests’. Under the highest emission scenario, however, the range of protected forests with enough climate connectivity is expected to be shrunk to the mixed forests in Mediterranean and Pannonian regions and Sarmatic mixed forests, mainly located in northeastern Spain, southern France, southern Sweden, Romania, Hungary, and Croatia.
4. Discussions
This study conducted a European-wide assessment of the climate connectivity of forested areas and highlighted those forests that may be important for species range shifts under climate change. We used the method of Senior et al. [
27], where climate connectivity was measured by calculating the temperature difference between each forest patch and the coolest patch that can be reached through temperature gradients. In addition, we identified the stepping stones between patches and their destinations and calculated the frequency that each patch could serve as a stepping stone for climate-driven migrations, using graph analysis.
We found that, on average, European forests are not sufficiently connected along temperature gradients to enable species to avoid climate change by range shifts: species that shift their distributions across current forest cover would still experience an average warming of 0.73 °C under the moderate emission scenario; forests with successful climate connectivity only account for 36% of the total forested area in Europe. The situation is likely to worsen considerably as the climate warms more quickly: 3.35 °C and 12% under the most severe emission scenario. Across the 40 forest-dominated ecoregions in Europe, ‘Sarmatic mixed forests’ is the most successful ecoregion with, on average, the highest climate connectivity and more than 50% of the forest area successfully connected under both scenarios, while ‘East European forest-steppe’ is the least well connected. Nevertheless, about 94% of the total forested area is expected to experience species range shifts by serving as stepping stones. Forested areas in Northern Europe, such as ‘Scandinavian and Russian taiga’, ’Sarmatic mixed forests’, and ‘Baltic mixed forests’, have a relatively higher frequency to serve as stepping stones and thus a high potential to build corridors for species range shifts.
Our estimate of climate connectivity could provide information for climate-smart management of European forests and help guide conservation strategies and prioritisation where climate change has not been explicitly considered. It allows foresters and ecologists to determine the most effective areas for maintaining and increasing climate connectivity. For example, where climate connectivity is high, conservation efforts should focus on monitoring the abundance and distribution of indigenous species. These areas might face a loss of biodiversity due to the emigration of species with high mobility. In ecoregions with low climate connectivity, more efforts should be made to create new stepping stones to facilitate species range shifts. This can be achieved through large-scale afforestation actions [
30]. Forested areas with high potential to serve as stepping stones are of high importance for climate-driven range shifts and thus need to be protected from human activities.
Moreover, this study provides spatially explicit evaluations of the effectiveness of current protected areas in Europe (Natura 2000) under climate change. Our results reveal that, in the face of rapid climate warming, conventional habitat-based conservation strategies, which rely on fixed protected areas, may not be able to ensure the long-term persistence and range shifts of forest-dependent species. In order to improve their climate connectivity, we need to identify the future climate analogues of protected forests and build connections between them along climate gradients. More active forest management strategies with human interventions, such as assisted migration [
31], may be needed in extreme cases to avoid the extinction of valuable and threatened species.


