
Effects of Elevated CO2 and Nitrogen Loading on the Defensive Traits of Three Successional Deciduous Broad-Leaved Tree Seedlings

 , and
, and
Abstract
:1. Introduction
2. Materials and Methods
2.1. Plant Materials
2.2. Treatments
2.3. Measurements
2.4. LMA Measurement
2.5. N Content, C Content, and C/N Ratio
2.6. Quantitative Analysis of Defense Chemicals
2.7. Microscopy
2.8. Statistical Analyses
3. Results
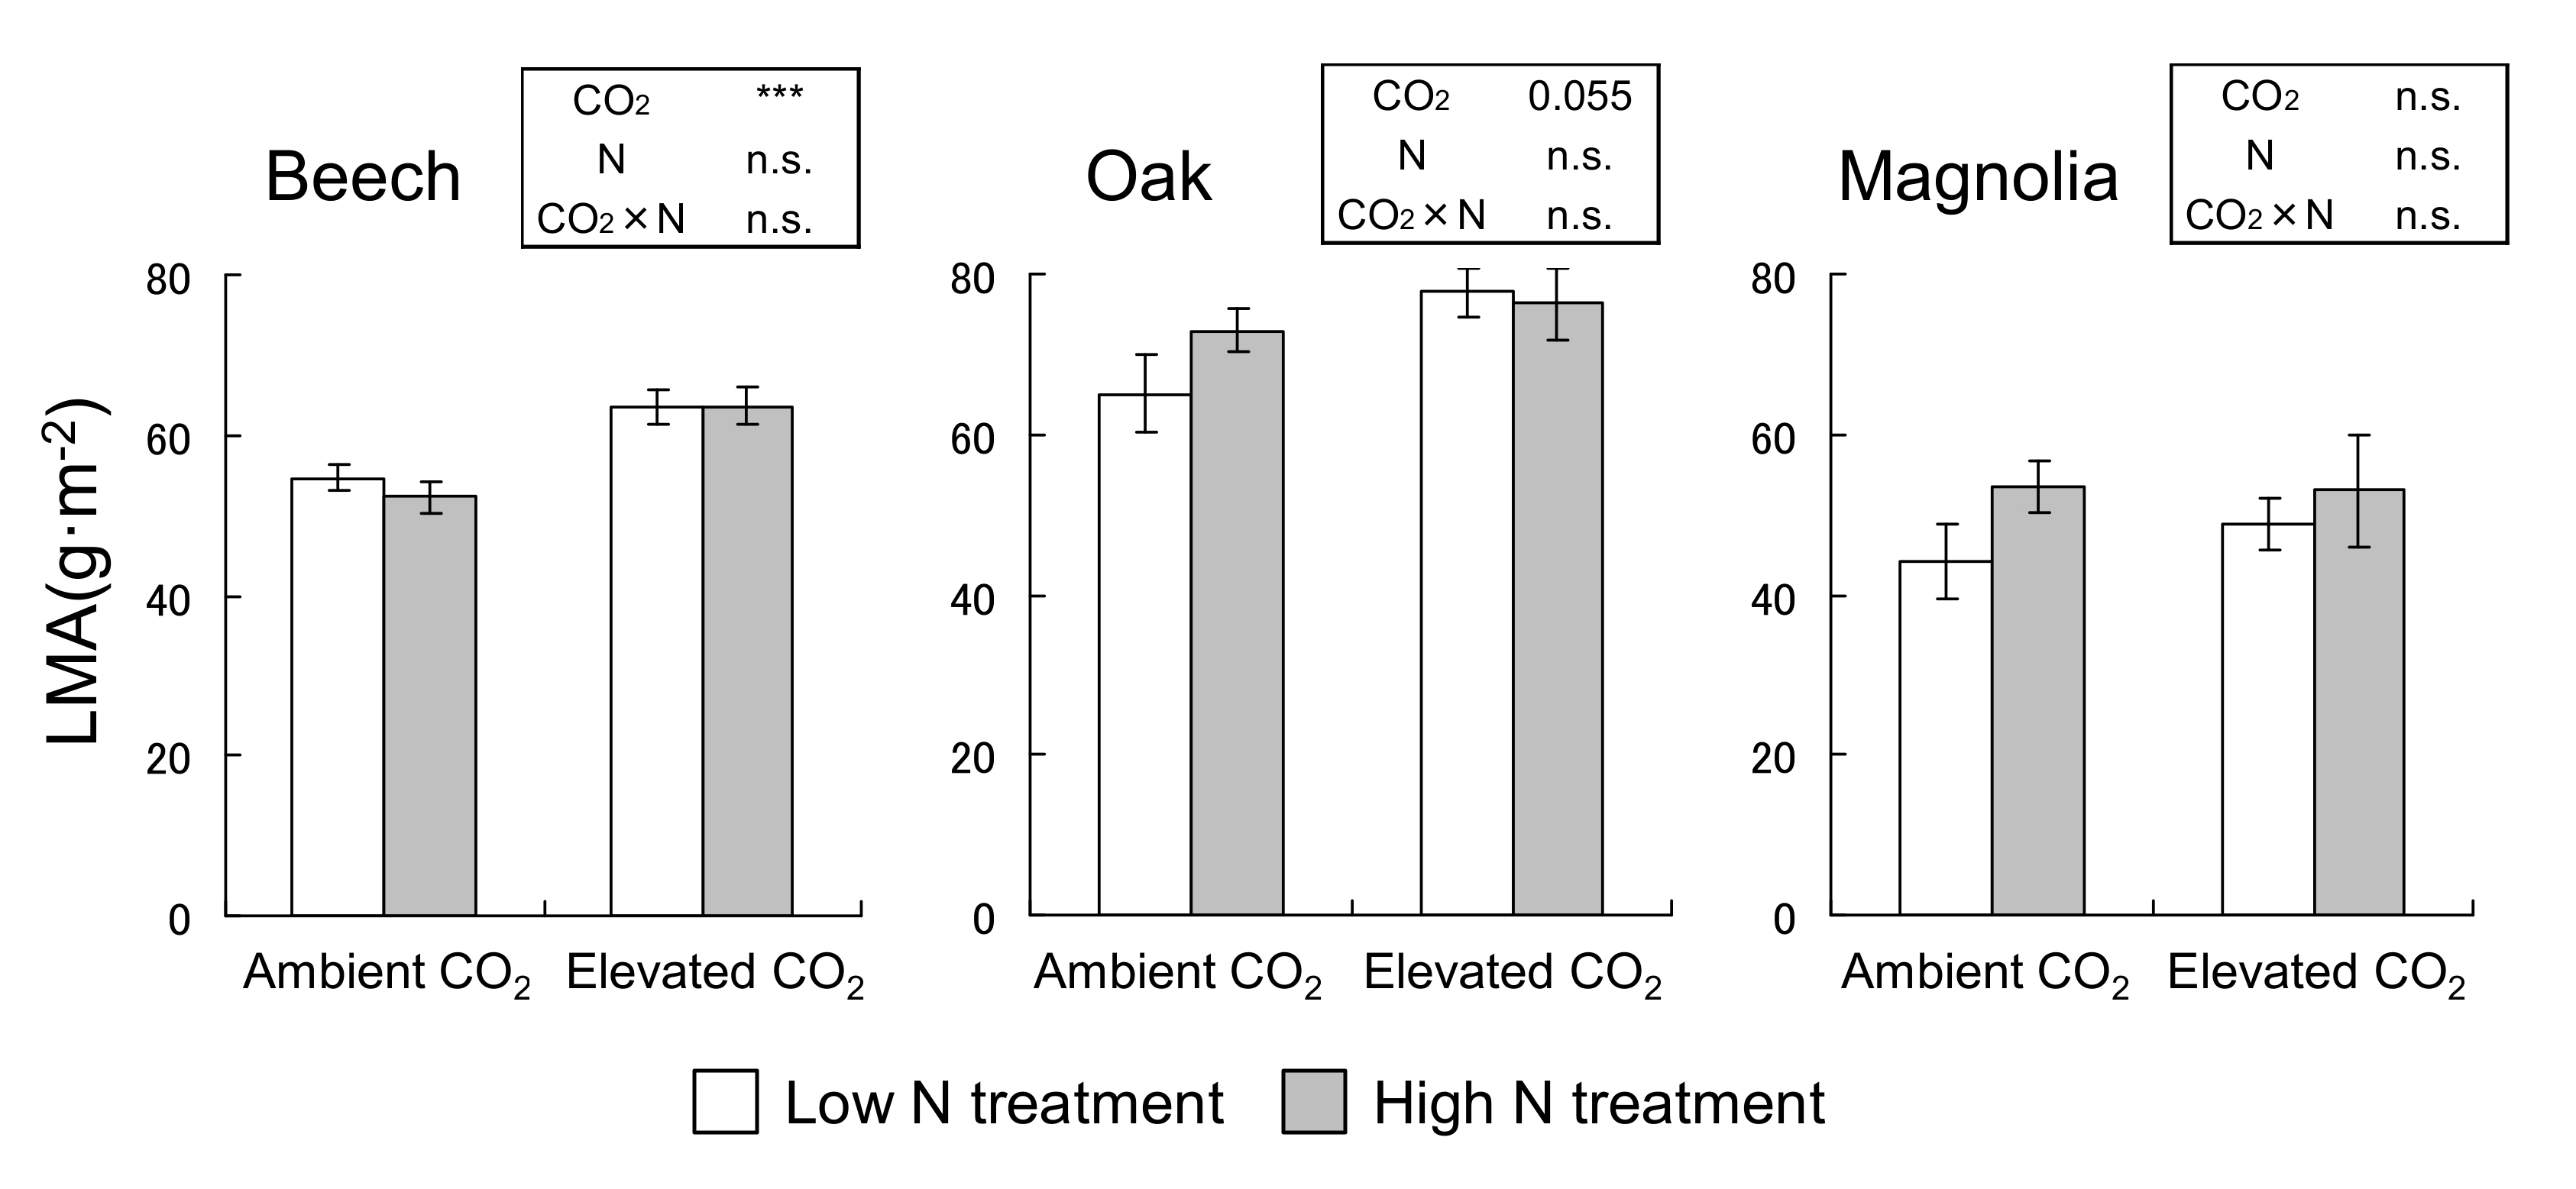
3.1. LMA
3.2. N Content, C Content, and C/N Ratio
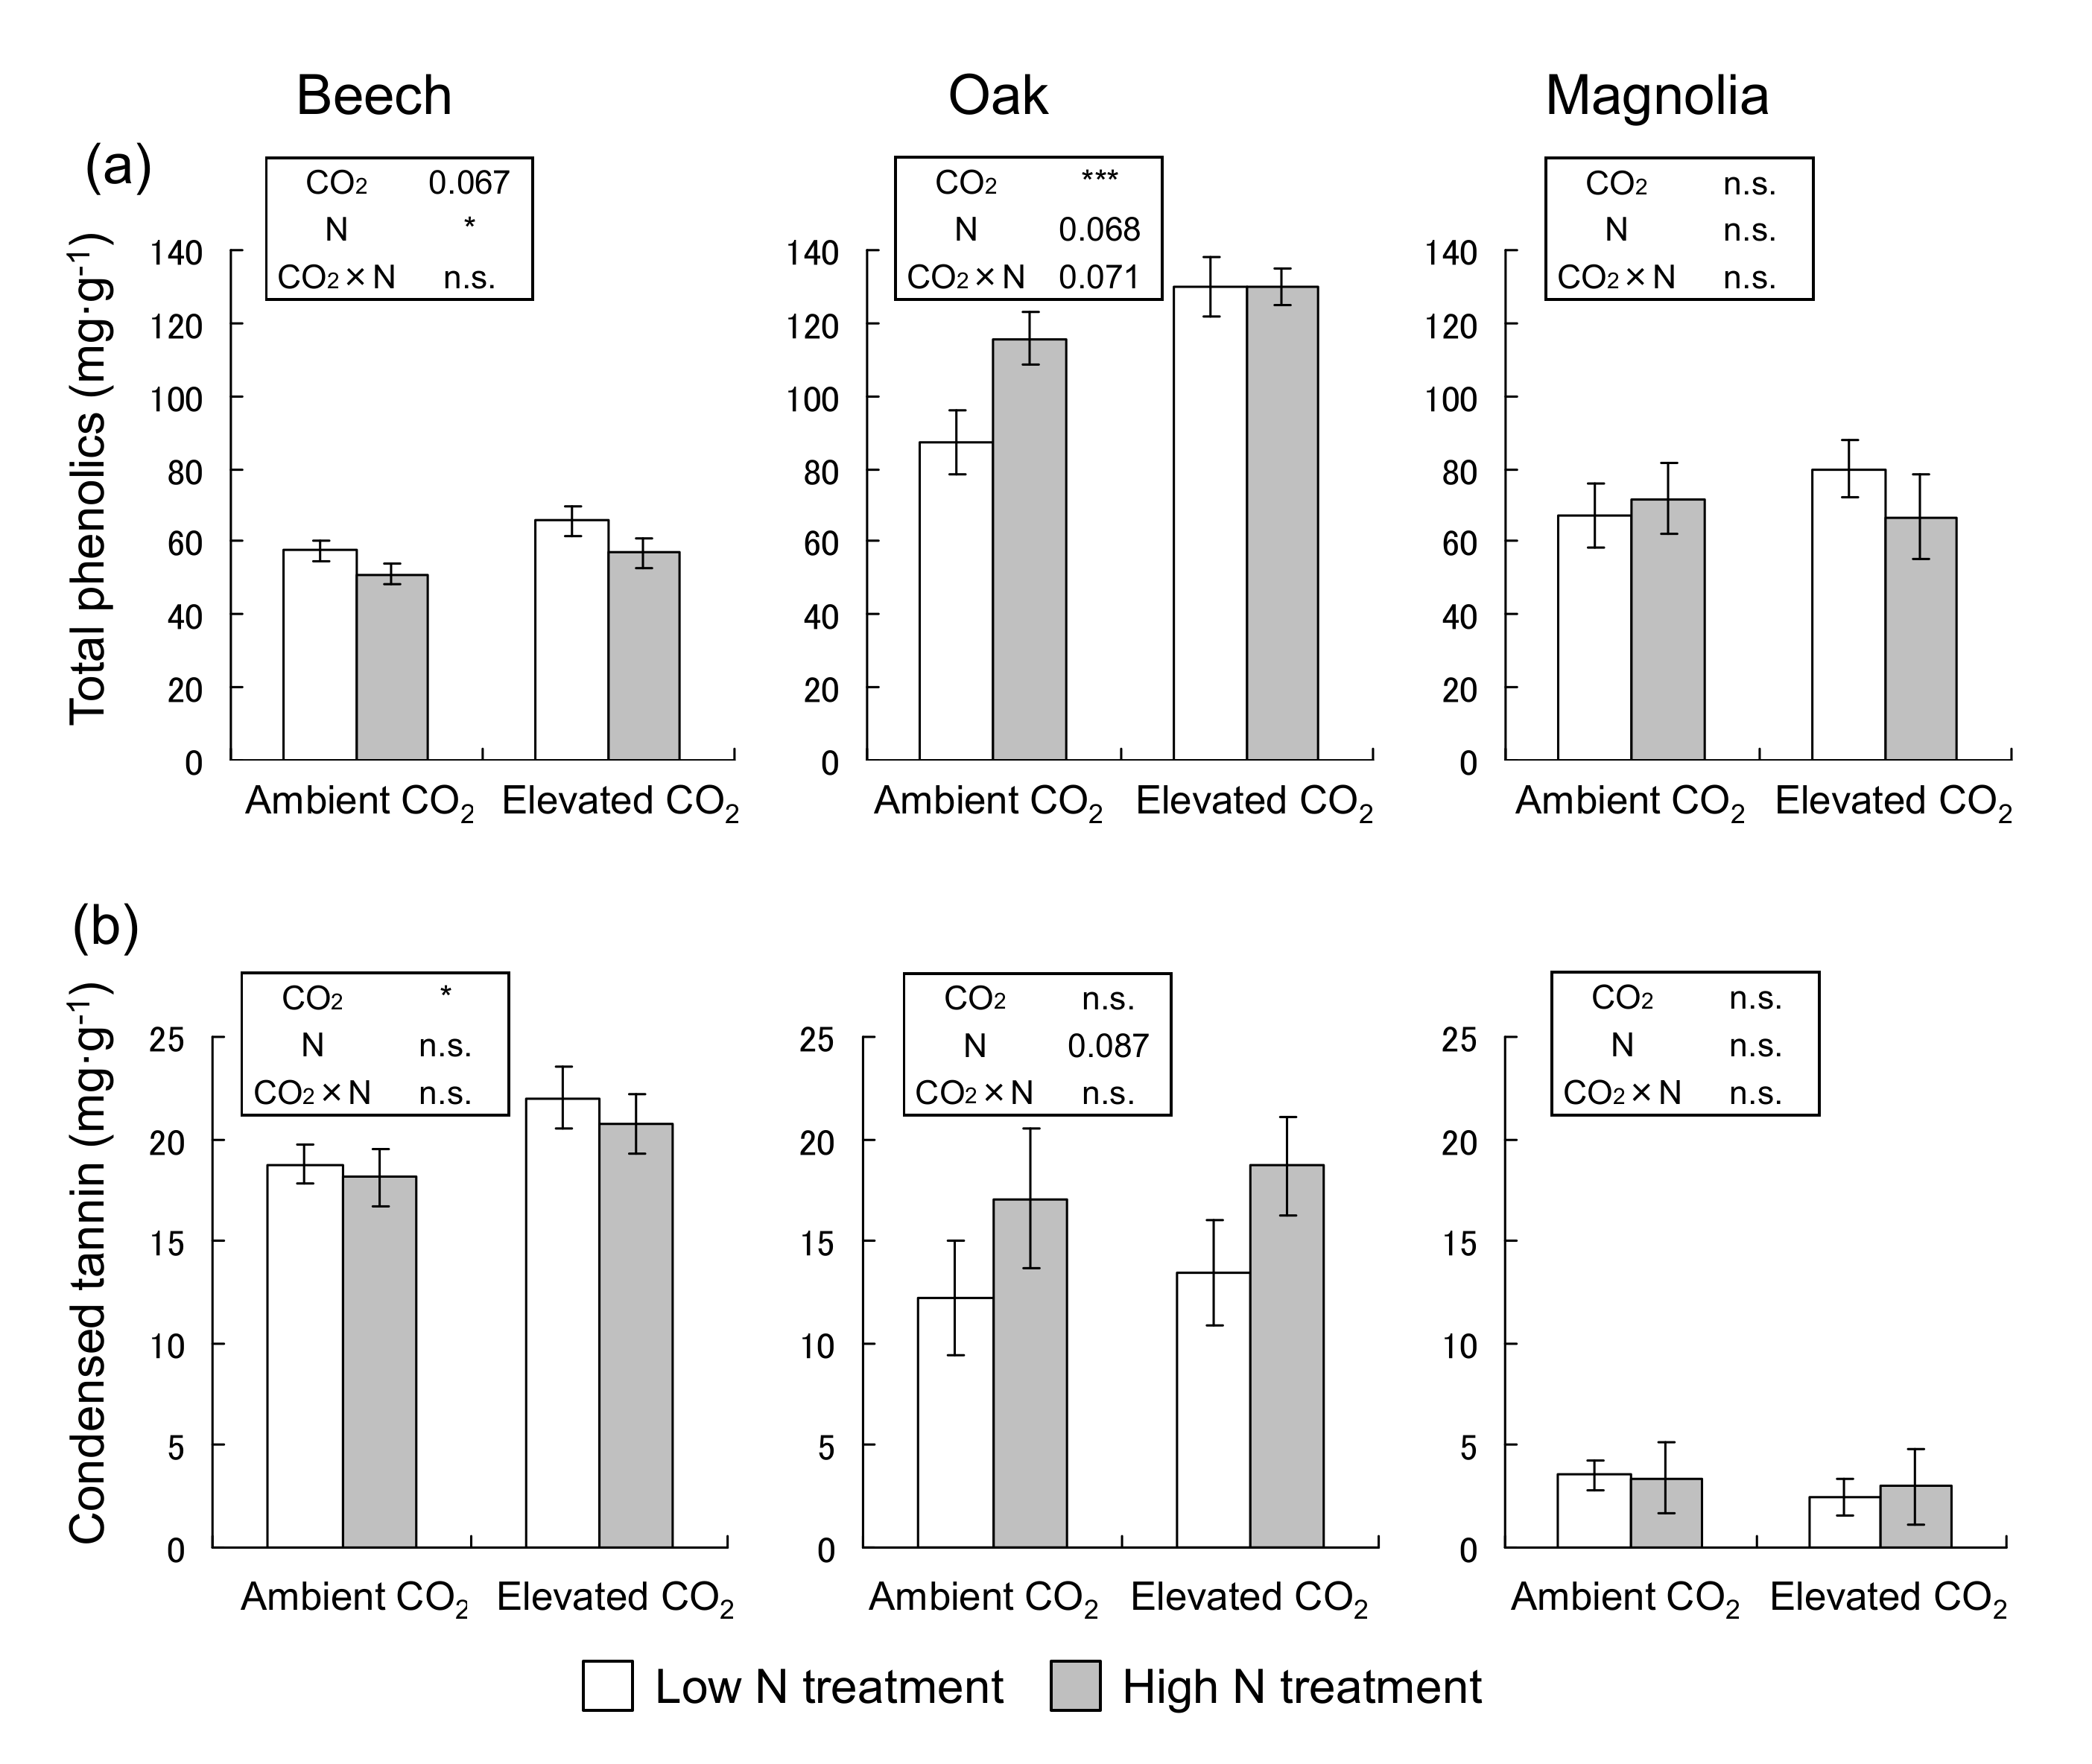
3.3. Concentrations of Total Phenolics and Condensed Tannin
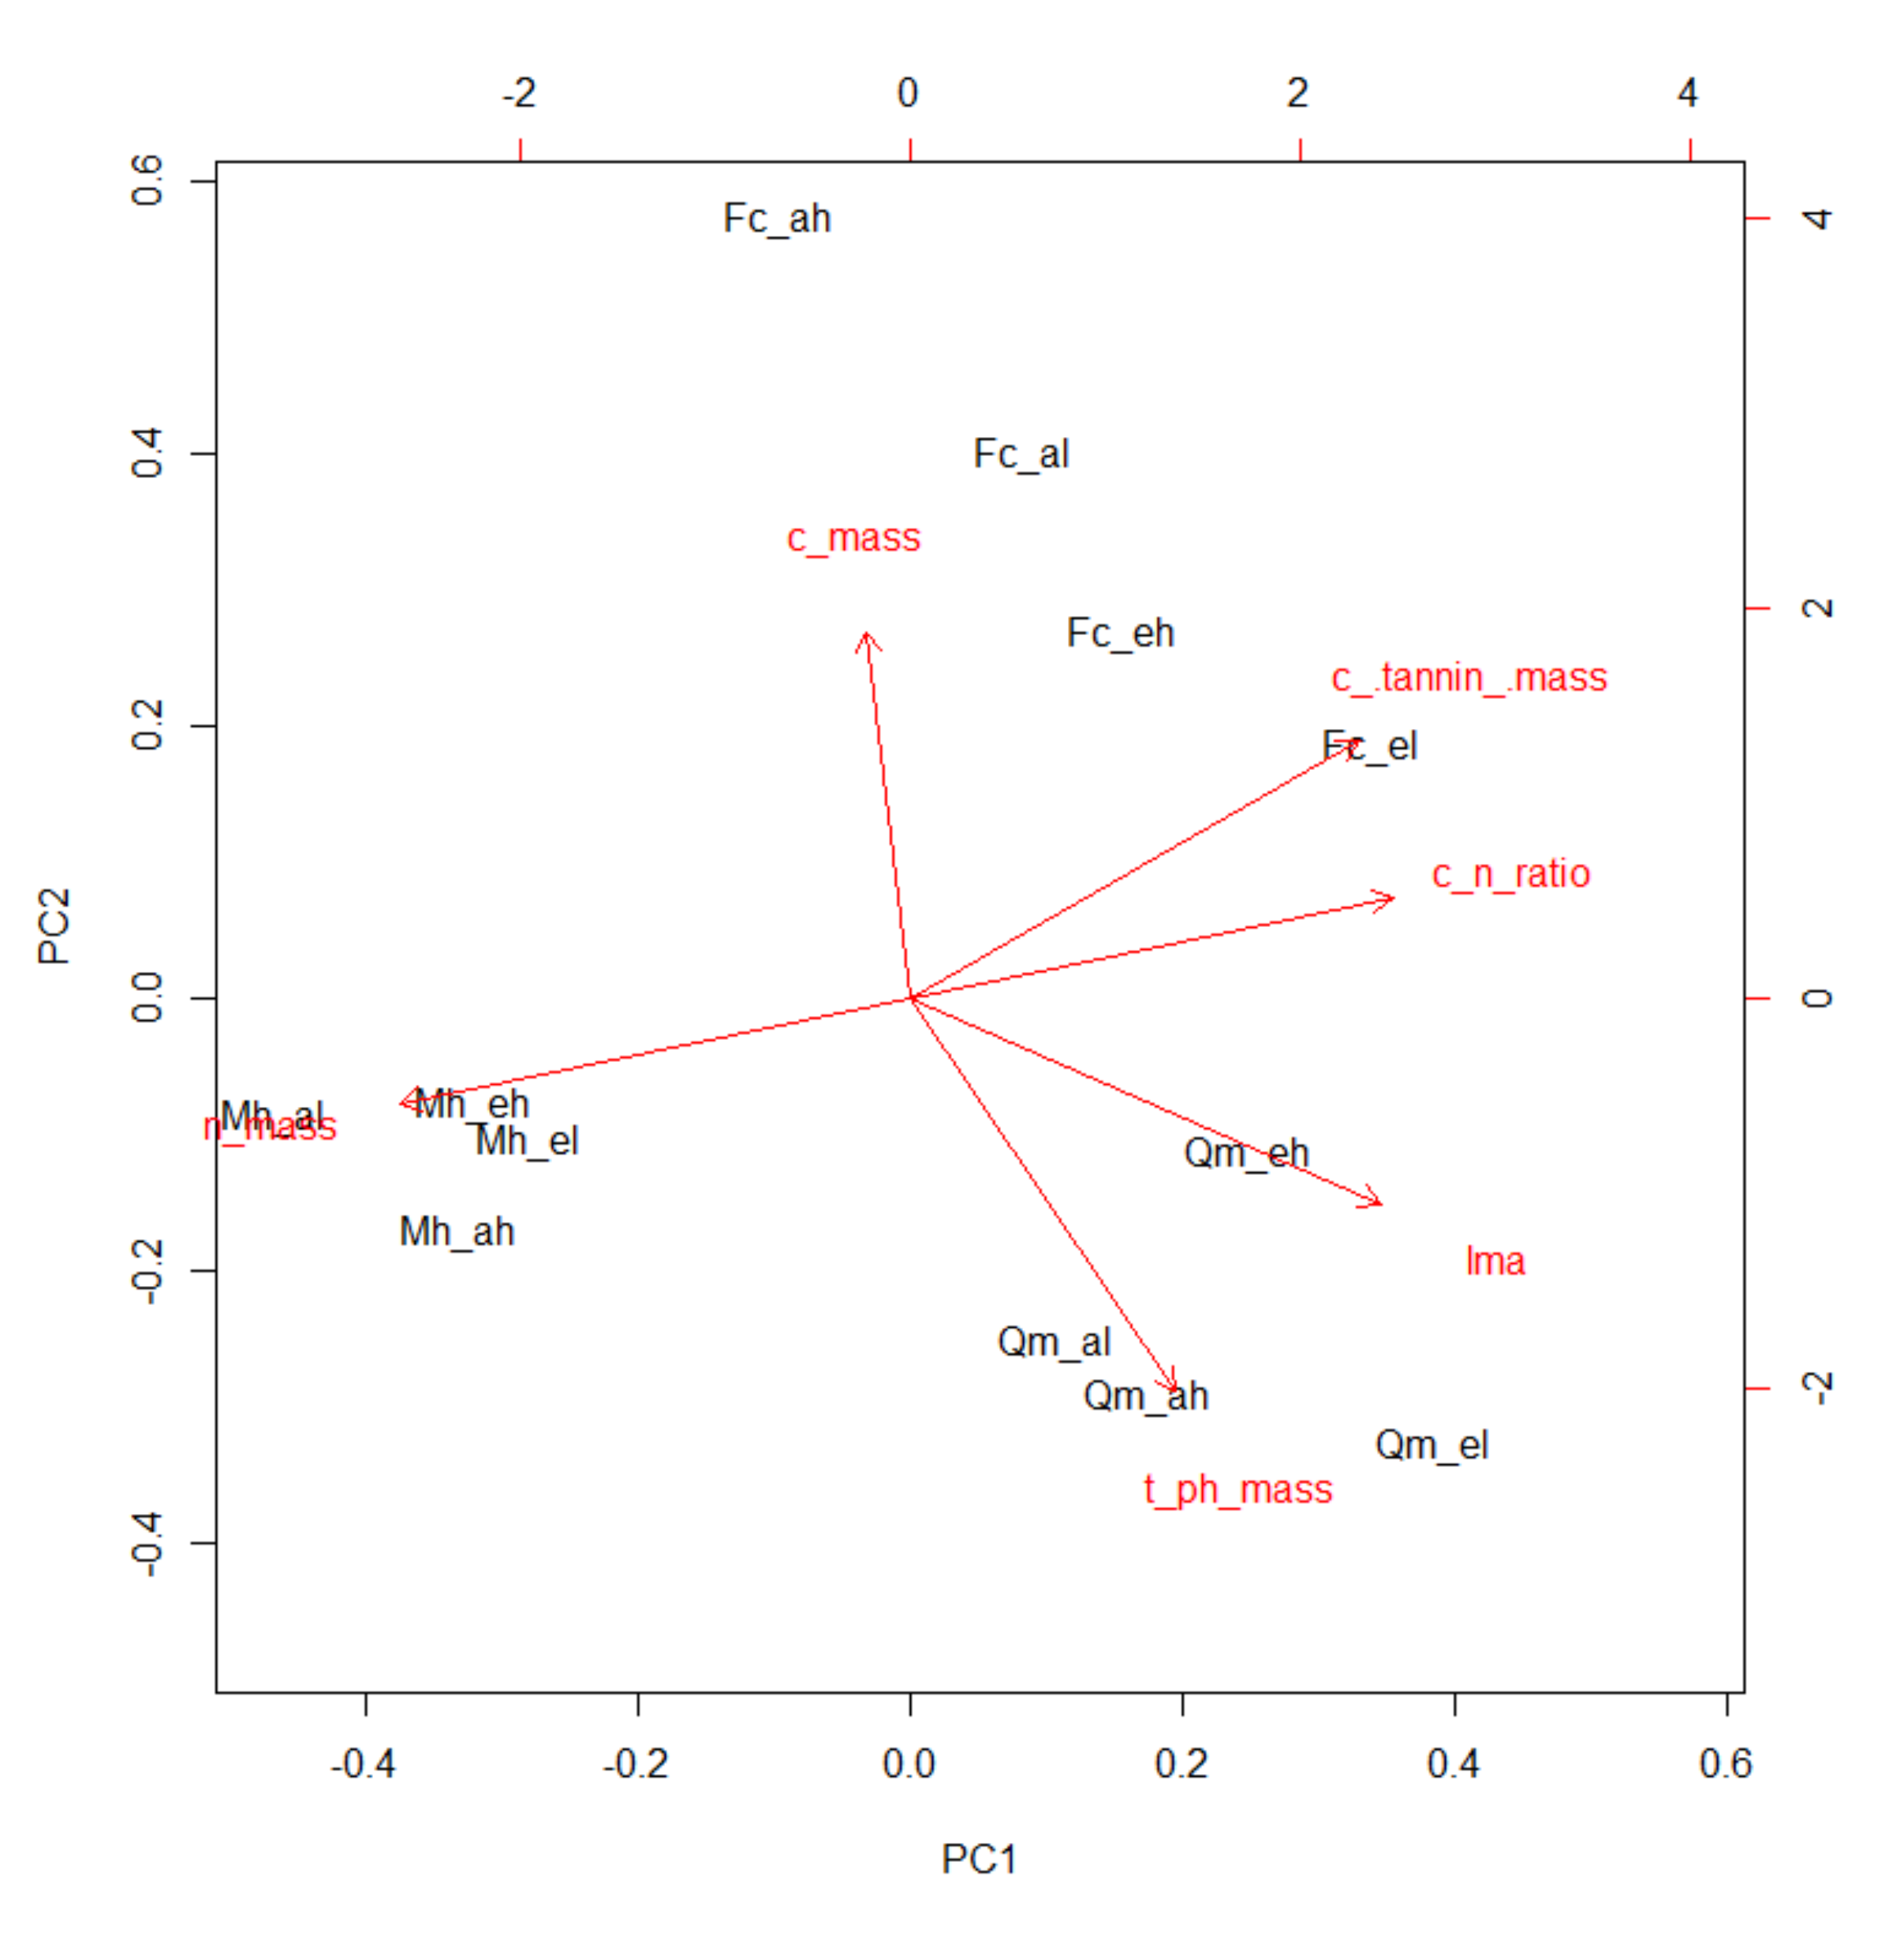
3.4. Principal Component Analysis
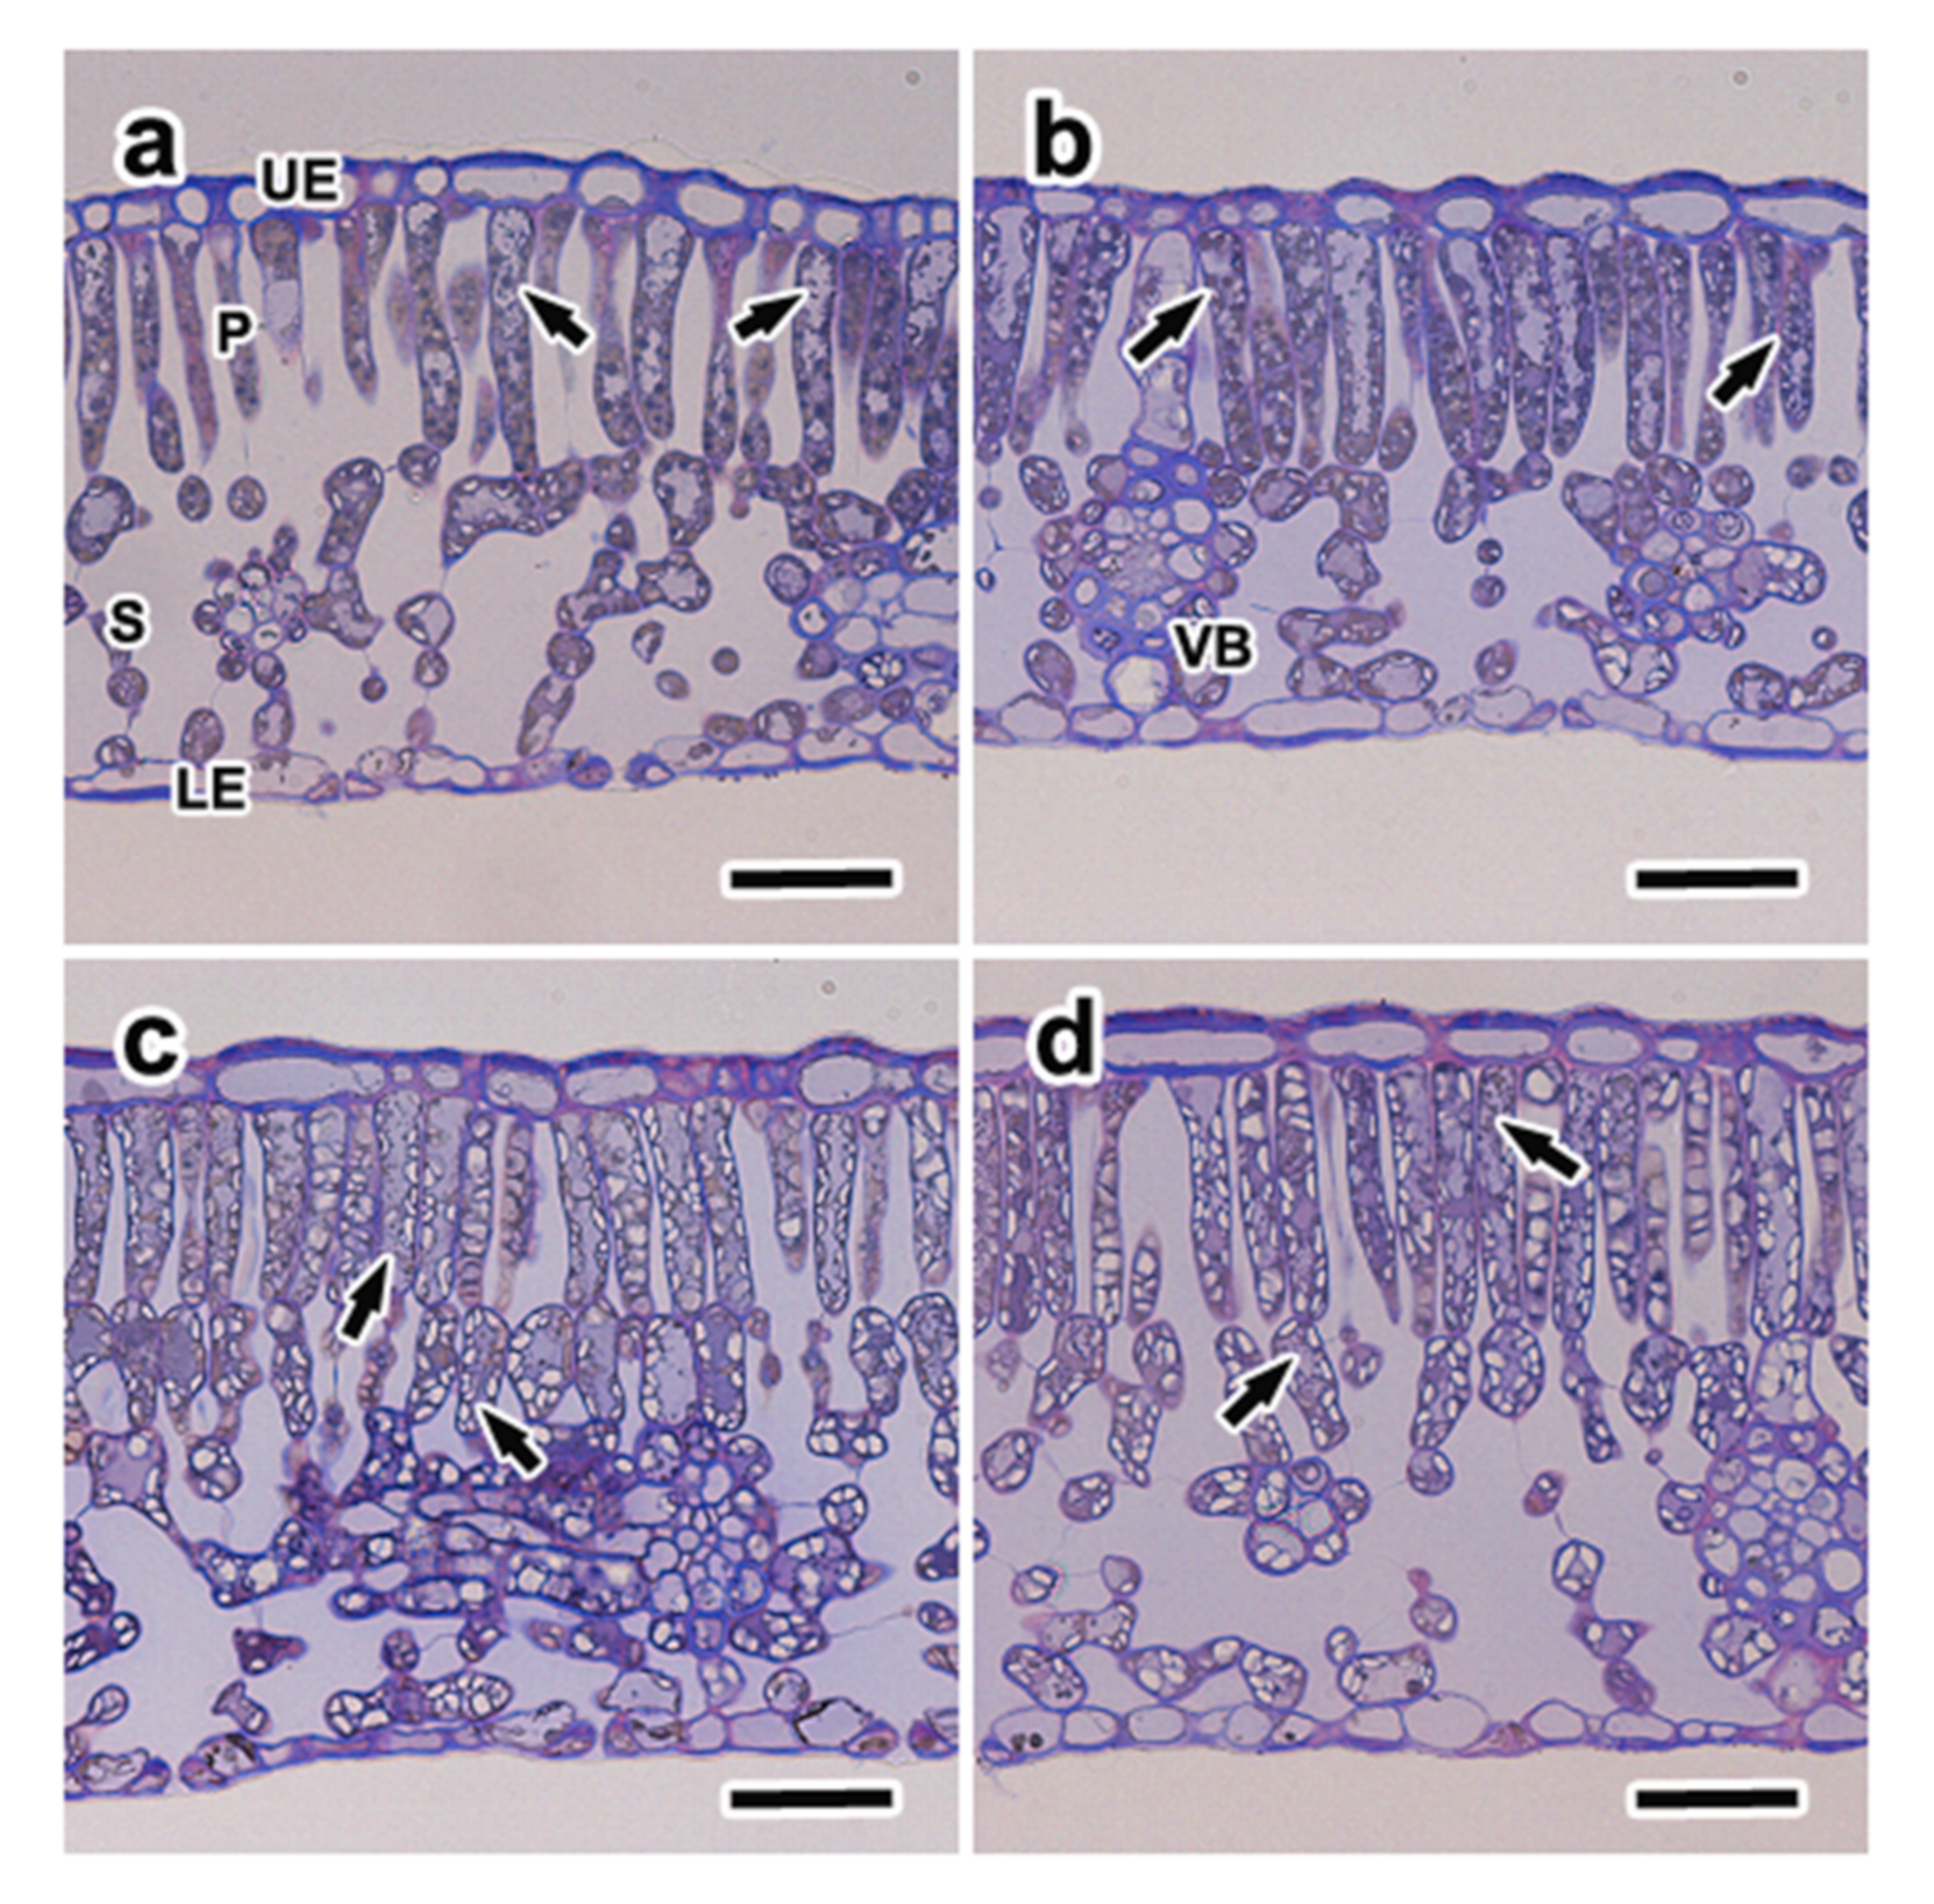
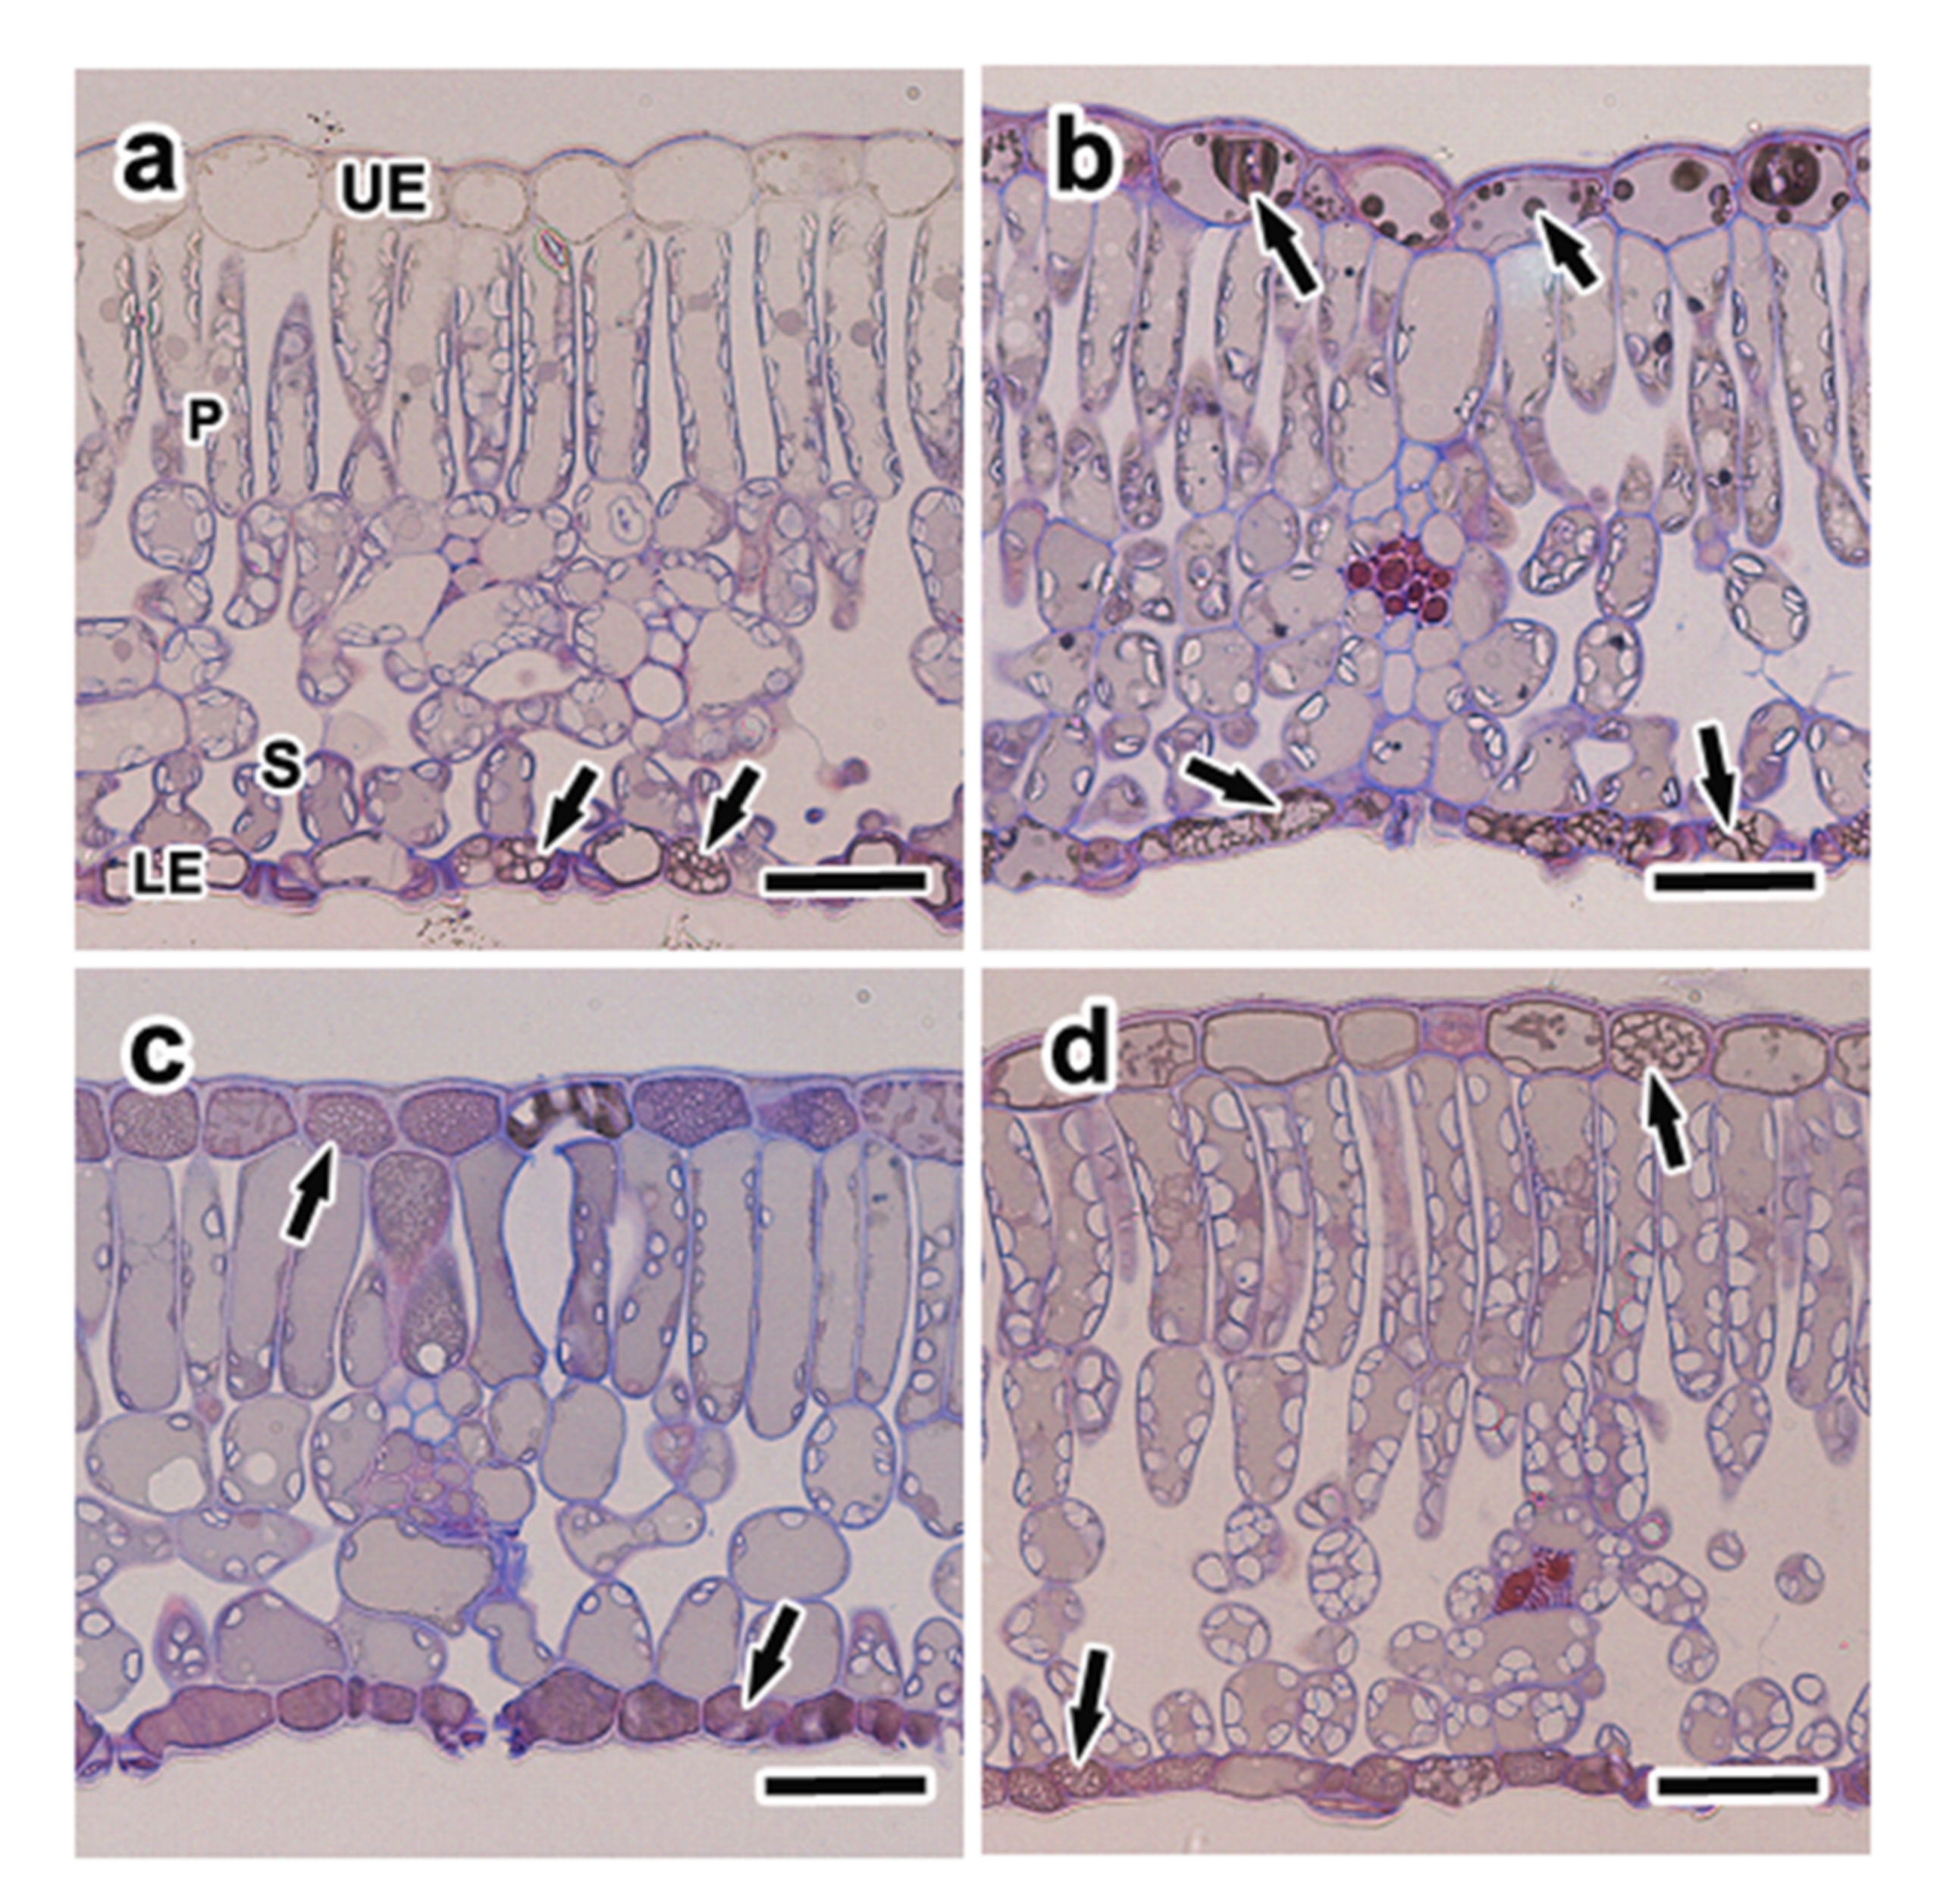
3.5. Anatomical Characteristics and Distribution of Phenolic Compounds
4. Discussion
4.1. Effects of Elevated CO2 and Nitrogen Loading on Defensive Traits
4.2. Distribution of Phenolic Compounds under Elevated CO2 and High N Treatment
5. Conclusions
Author Contributions
Funding
Acknowledgments
Conflicts of Interest
References
- Agathokleous, E.; Calabrese, E.J. A global environmental health perspective and optimisation of stress. Sci. Total Environ. 2020, 704, 135263. [Google Scholar] [CrossRef]
- Masui, N.; Mochizuki, T.; Tani, A.; Matsuura, H.; Agathokleous, E.; Watanabe, T.; Koike, T. Does ozone alter the attractiveness of Japanese white birch leaves to the leaf beetle Agelastica coerulea via changes in biogenic volatile organic compounds (BVOCs): An examination with the Y-Tube test. Forests 2020, 11, 58. [Google Scholar] [CrossRef] [Green Version]
- Körner, C. An introduction to the functional diversity of temperate forest trees. In Forest Diversity and Function: Temperate and Boreal Systems; Scherer-Lorenzen, M., Körner, C., Schulze, E.-D., Eds.; Ecological Studies; Springer: Berlin/Heidelberg, Germany, 2005; pp. 13–37. ISBN 978-3-540-26599-3. [Google Scholar]
- Bryant, J.P.; Chapin, F.S.; Klein, D.R. Carbon/nutrient balance of boreal plants in relation to vertebrate herbivory. Oikos 1983, 40, 357–368. [Google Scholar] [CrossRef] [Green Version]
- Koike, T.; Tobita, H.; Shibata, T.; Matsuki, S.; Konno, K.; Kitao, M.; Yamashita, N.; Maruyama, Y. Defense characteristics of seral deciduous broad-leaved tree seedlings grown under differing levels of CO2 and nitrogen. Popul. Ecol. 2006, 23–29. [Google Scholar] [CrossRef] [Green Version]
- Schoonhoven, L.M.; Jermy, T.; van Loon, J.J.A. Insect-Plant Biology: From Physiology to Evolution; Chapman and Hall: London, UK; Taylor & Francis: Boca Raton, FL, USA, 1998; ISBN 978-0-412-80480-9. [Google Scholar]
- Lincoln, D.E. The influence of plant carbon dioxide and nutrient supply on susceptibility to insect herbivores. Vegetatio 1993, 104, 273–280. [Google Scholar] [CrossRef]
- Gebauer, R.L.E.; Strain, B.R.; Reynolds, J.F. The effect of elevated CO2 and N availability on tissue concentrations and whole plant pools of carbon-based secondary compounds in loblolly pine (Pinus taeda). Oecologia 1997, 113, 29–36. [Google Scholar] [CrossRef] [PubMed]
- Williams, R.S.; Norby, R.J.; Lincoln, D.E. Effects of elevated CO2 and temperature-grown red and sugar maple on gypsy moth performance. Glob. Change Biol. 2000, 6, 685–695. [Google Scholar] [CrossRef]
- Knepp, R.G.; Hamilton, J.G.; Mohan, J.E.; Zangerl, A.R.; Berenbaum, M.R.; DeLucia, E.H. Elevated CO2 reduces leaf damage by insect herbivores in a forest community. New Phytol. 2005, 167, 207–218. [Google Scholar] [CrossRef]
- Robinson, E.A.; Ryan, G.D.; Newman, J.A. A meta-analytical review of the effects of elevated CO2 on plant–arthropod interactions highlights the importance of interacting environmental and biological variables. New Phytol. 2012, 194, 321–336. [Google Scholar] [CrossRef] [Green Version]
- Stiling, P.; Cornelissen, T. How does elevated carbon dioxide (CO2) affect plant–herbivore interactions? A field experiment and meta-analysis of CO2-mediated changes on plant chemistry and herbivore performance. Glob. Change Biol. 2007, 13, 1823–1842. [Google Scholar] [CrossRef]
- Lindroth, R.L. Impacts of elevated atmospheric CO2 and O3 on forests: Phytochemistry, trophic interactions, and ecosystem dynamics. J. Chem. Ecol. 2010, 36, 2–21. [Google Scholar] [CrossRef]
- Koike, T.; Watanabe, M.; Watanabe, Y.; Agathokleous, E.; Eguchi, N.; Takagi, K.; Satoh, F.; Kitaoka, S.; Funada, R. Ecophysiology of deciduous trees native to northeast Asia grown under FACE (Free Air CO2 Enrichment). J. Agric. Meteorol. 2015, 71, 174–184. [Google Scholar] [CrossRef]
- Throop, H.L.; Lerdau, M.T. Effects of nitrogen deposition on insect herbivory: Implications for community and ecosystem processes. Ecosystems 2004, 7, 109–133. [Google Scholar] [CrossRef]
- Hwang, S.-Y.; Liu, C.-H.; Shen, T.-C. Effects of plant nutrient availability and host plant species on the performance of two Pieris butterflies (Lepidoptera: Pieridae). Biochem. Syst. Ecol. 2008, 36, 505–513. [Google Scholar] [CrossRef]
- Sugai, T.; Okamoto, S.; Agathokleous, E.; Masui, N.; Satoh, F.; Koike, T. Leaf defense capacity of Japanese elm (Ulmus davidiana var. japonica) seedlings subjected to a nitrogen loading and insect herbivore dynamics in a Free Air Ozone-Enriched environment. Environ. Sci. Pollut. Res. 2020, 27, 3350–3360. [Google Scholar] [CrossRef] [PubMed]
- Lavola, A.; Julkunen-Tiitto, R. The effect of elevated carbon dioxide and fertilization on primary and secondary metabolites in birch, Betula pendula (Roth). Oecologia 1994, 99, 315–321. [Google Scholar] [CrossRef]
- Kinney, K.K.; Lindroth, R.L.; Jung, S.M.; Nordheim, E.V. Effects of CO2 and NO3—Availability on deciduous trees: Phytochemistry and insect performance. Ecology 1997, 78, 215–230. [Google Scholar] [CrossRef]
- Chapin, F.S.; Schulze, E.; Mooney, H.A. The ecology and economics of storage in plants. Annu. Rev. Ecol. Syst. 1990, 21, 423–447. [Google Scholar] [CrossRef]
- Kamata, N. Population dynamics of the beech caterpillar, Syntypistis punctatella, and biotic and abiotic factors. Popul. Ecol. 2000, 42, 267–278. [Google Scholar] [CrossRef]
- War, A.R.; Paulraj, M.G.; Ahmad, T.; Buhroo, A.A.; Hussain, B.; Ignacimuthu, S.; Sharma, H.C. Mechanisms of plant defense against insect herbivores. Plant Signal. Behav. 2012, 7, 1306–1320. [Google Scholar] [CrossRef] [Green Version]
- Hagen, R.H.; Chabot, J.F. Leaf anatomy of maples (Acer) and host use by Lepidoptera larvae. Oikos 1986, 47, 335–345. [Google Scholar] [CrossRef]
- Choong, M.F. What makes a leaf tough and how this affects the pattern of Castanopsis fissa leaf consumption by caterpillars. Funct. Ecol. 1996, 10, 668–674. [Google Scholar] [CrossRef]
- Kimmerer, T.W.; Potter, D.A. Nutritional quality of specific leaf tissues and selective feeding by a specialist leafminer. Oecologia 1987, 71, 548–551. [Google Scholar] [CrossRef]
- Koike, T. Leaf structure and photosynthetic performance as related to the forest succession of deciduous broad-leaved trees. Plant Species Biol. 1988, 3, 77–87. [Google Scholar] [CrossRef]
- Matsuki, S. Study on the Species Characteristics in Defense Against Herbivores in Betulaceae. Ph.D. Thesis, Hokkaido University, Sapporo, Japan, 2003. [Google Scholar]
- Watanabe, M.; Kitaoka, S.; Eguchi, N.; Watanabe, Y.; Satomura, T.; Takagi, K.; Satoh, F.; Koike, T. Photosynthetic traits of Siebold’s beech seedlings in changing light conditions by removal of shading trees under elevated CO2. Plant Biol. 2016, 18 (Suppl. 1), 56–62. [Google Scholar] [CrossRef]
- Julkunen-Tiitto, R. Phenolic constituents in the leaves of northern willows: Methods for the analysis of certain phenolics. J. Agric. Food Chem. 1985, 33, 213–217. [Google Scholar] [CrossRef]
- Bate-Smith, E.C. Astringent tannins of Acer Species. Phytochemistry 1977, 16, 1421–1426. [Google Scholar] [CrossRef]
- Watanabe, Y.; Sano, Y.; Asada, T.; Funada, R. Histochemical study of the chemical composition of vestured pits in two species of Eucalyptus. IAWA J. 2006, 27, 33–43. [Google Scholar] [CrossRef]
- Bussotti, F.; Gravano, E.; Grossoni, P.; Tani, C. Occurrence of tannins in leaves of beech trees (Fagus sylvatica) along an ecological gradient, detected by histochemical and ultrastructural analyses. New Phytol. 1998, 138, 469–479. [Google Scholar] [CrossRef]
- R Core Team. R: A Language and Environment for Statistical Computing; R Foundation for Statistical Computing: Vienna, Austria, 2019. [Google Scholar]
- Hamilton, J.G.; Zangerl, A.R.; DeLucia, E.H.; Berenbaum, M.R. The carbon–nutrient balance hypothesis: Its rise and fall. Ecol. Lett. 2001, 4, 86–95. [Google Scholar] [CrossRef] [Green Version]
- Taub, D.R.; Wang, X. Why are nitrogen concentrations in plant tissues lower under elevated CO2? A critical examination of the hypotheses. J. Integr. Plant Biol. 2008, 50, 1365–1374. [Google Scholar] [CrossRef]
- Kitaoka, S.; Watanabe, Y.; Koike, T. The effects of cleared larch canopy and nitrogen supply on gas exchange and leaf traits in deciduous broad-leaved tree seedlings. Tree Physiol. 2009, 29, 1503–1511. [Google Scholar] [CrossRef] [PubMed] [Green Version]
- Kotani, A.; Kojima, S.; Hakamata, H.; Jin, D.; Kusu, F. Determination of honokiol and magnolol by micro HPLC with electrochemical detection and its application to the distribution analysis in branches and leaves of Magnolia obovata. Chem. Pharm. Bull. 2005, 53, 319–322. [Google Scholar] [CrossRef] [PubMed] [Green Version]
- Lindroth, R.L.; Kinney, K.K.; Platz, C.L. Responses of deciduous trees to elevated atmospheric CO2: Productivity, phytochemistry, and insect performance. Ecology 1993, 74, 763–777. [Google Scholar] [CrossRef]
- Zangerl, A.R.; Bazzaz, F.A. Theory and pattern in plant defense allocation. In Plant Resistance to Herbivores and Pathogens: Ecology, Evolution, and Genetics; Fritz, R.S., Simms, E.L., Eds.; The University of Chicago Press: Chicago, IL, USA, 1992; pp. 363–391. ISBN 0-226-26554-4. [Google Scholar]
- Pritchard, S.G.; Rogers, H.H.; Prior, S.A.; Peterson, C.M. Elevated CO2 and plant structure: A review. Glob. Change Biol. 1999, 5, 807–837. [Google Scholar] [CrossRef] [Green Version]
- Miyazawa, S.-I.; Warren, C.R.; Turpin, D.H.; Livingston, N.J. Determination of the site of CO2 sensing in poplar: Is the area-based N content and anatomy of new leaves determined by their immediate CO2 environment or by the CO2 environment of mature leaves? J. Exp. Bot. 2011, 62, 2787–2796. [Google Scholar] [CrossRef]
- Sumbele, S.A.; Fotelli, M.N.; Nikolopoulos, D.; Tooulakou, G.; Liakoura, V.; Liakopoulos, G.; Bresta, P.; Dotsika, E.; Adams, M.A.; Karabourniotis, G. Photosynthetic capacity is negatively correlated with the concentration of leaf phenolic compounds across a range of different species. AoB Plants 2012, pls025. [Google Scholar] [CrossRef] [Green Version]
- Karabourniotis, G.; Horner, H.T.; Panagiota Bresta1, P.; Nikolopoulos, D.; Liakopoulos, G. New insights into the functions of carbon-calcium inclusions in plants. New Phytol. 2020, 228, 845–854. [Google Scholar] [CrossRef]
- Karabourniotis, G.; Liakopoulos, G.; Nikolopoulos, D.; Bresta, P. Protective and defensive roles of non-glandular trichomes against multiple stresses: Structure–function coordination. J. For. Res. 2019, 31, 1–12. [Google Scholar] [CrossRef] [Green Version]


| Treatments | ||||||||
|---|---|---|---|---|---|---|---|---|
| 360 ppm | 720 ppm | Two-Way ANOVA | ||||||
| Species | Defense Chemicals | Low N | High N | Low N | High N | CO2 | N | CO2 × N |
| Beech | Total phenolics (g m−2) | 3.15 (±0.17) | 2.72 (±0.20) | 4.21 (±0.33) | 3.63 (±0.27) | *** | 0.055 | n.s. |
| Condensed tannin (g m−2) | 1.01 (±0.05) | 0.97 (±0.08) | 1.41 (±0.12) | 1.32 (±0.10) | *** | n.s. | n.s. | |
| Oak | Total phenolics (g m−2) | 5.72 (±0.70) | 8.46 (±0.70) | 10.12 (±0.87) | 9.90 (±0.66) | *** | n.s. | 0.061 |
| Condensed tannin (g m−2) | 0.86 (±0.26) | 1.23 (±0.23) | 1.05 (±0.21) | 1.38 (±0.16) | n.s. | 0.087 | n.s. | |
| Magnolia | Total phenolics (g m−2) | 2.98 (±0.52) | 3.80 (±0.46) | 3.82 (±0.29) | 3.32 (±0.35) | n.s. | n.s. | n.s. |
| Condensed tannin (g m−2) | 0.16 (±0.03) | 0.18 (±0.09) | 0.11 (±0.03) | 0.15 (±0.03) | n.s. | n.s. | n.s. | |
| Factor | PC1 | PC2 |
|---|---|---|
| LMA (g m−2) | 0.87 | −0.38 |
| N content (mg g−1) | −0.94 | −0.19 |
| C content (mg g−1) | −0.08 | 0.68 |
| C/N ratio | 0.89 | 0.19 |
| Total phenolics (mg g−1) | 0.49 | −0.73 |
| Condensed tannin (mg g−1) | 0.83 | 0.48 |
Publisher’s Note: MDPI stays neutral with regard to jurisdictional claims in published maps and institutional affiliations. |
© 2021 by the authors. Licensee MDPI, Basel, Switzerland. This article is an open access article distributed under the terms and conditions of the Creative Commons Attribution (CC BY) license (https://creativecommons.org/licenses/by/4.0/).
Share and Cite
Watanabe, Y.; Hinata, K.; Qu, L.; Kitaoka, S.; Watanabe, M.; Kitao, M.; Koike, T. Effects of Elevated CO2 and Nitrogen Loading on the Defensive Traits of Three Successional Deciduous Broad-Leaved Tree Seedlings. Forests 2021, 12, 939. https://doi.org/10.3390/f12070939
Watanabe Y, Hinata K, Qu L, Kitaoka S, Watanabe M, Kitao M, Koike T. Effects of Elevated CO2 and Nitrogen Loading on the Defensive Traits of Three Successional Deciduous Broad-Leaved Tree Seedlings. Forests. 2021; 12(7):939. https://doi.org/10.3390/f12070939
Chicago/Turabian StyleWatanabe, Yoko, Kiyomi Hinata, Laiye Qu, Satoshi Kitaoka, Makoto Watanabe, Mitsutoshi Kitao, and Takayoshi Koike. 2021. "Effects of Elevated CO2 and Nitrogen Loading on the Defensive Traits of Three Successional Deciduous Broad-Leaved Tree Seedlings" Forests 12, no. 7: 939. https://doi.org/10.3390/f12070939