Article

Photosynthesis Traits of Pioneer Broadleaves Species from Tailing Dumps in Călimani Mountains (Eastern Carpathians)

1
Forestry Faculty, Ștefan cel Mare University of Suceava, Universității 13, 720229 Suceava, Romania
2
National Institute for Research and Development in Forestry Marin Drăcea, Calea Bucovinei 73bis, 725100 Câmpulung Moldovenesc, Romania
*
Author to whom correspondence should be addressed.
Forests 2021, 12(6), 658; https://doi.org/10.3390/f12060658
Submission received: 12 May 2021 / Revised: 20 May 2021 / Accepted: 21 May 2021 / Published: 22 May 2021
(This article belongs to the Special Issue Climate Change and Air Pollution Effects on Forest Ecosystems)

Abstract

:
The reforestation and stable ecological restoration of tailings dumps resulting from surface mining activities in the Călimani Mountains represent an ongoing environmental challenge. To assess the suitability of different tree species for restoration efforts, photosynthetic traits were monitored in four broadleaf pioneer species—green alder (Alnus alnobetula (Ehrh.) K. Koch), aspen (Populus tremula L.), silver birch (Betula pendula Roth.), and goat willow (Salix caprea L.)—that naturally colonized the tailings dumps. Green alder and birch had the highest photosynthetic rate, followed by aspen and goat willow. Water use efficiency parameters (WUE and iWUE) were the highest for green alder and the lowest for birch, with intermediary values for aspen and goat willow. Green alder also exhibited the highest carboxylation efficiency, followed by birch. During the growing season, net assimilation and carboxylation efficiency exhibited a maximum in late July and a minimum in late June. The key limitation parameters of the photosynthetic process derived from the FvCB model (Vcmax and Jmax) were the highest for green alder and exhibited a maximum in late July, regardless of the species. Based on photosynthetic traits, the green alder—a woody N2-fixing shrub—is the most well-adapted and photosynthetically efficient species that naturally colonized the tailings dumps in the Călimani Mountains.

Graphical Abstract

1. Introduction

Climate change and anthropic activities have given rise to the most serious environmental problems of the 21st century [1]. Today, in an increasing number of ecosystems, anthropic influences are harming biodiversity and ecosystem functioning. Human activities change the condition of natural vegetation, leading to disturbances such as degradation of vegetation, erosion of soil, decline in land productivity and even reduction of ecosystem services [2].
A large proportion of the Earth’s geological resources (metals, minerals, fuel, etc.) are underground; mining activities to access these resources damage the above-ground landscape and have a significant impact on natural ecosystems such as forests, rivers and lakes [3]. Even after the mining activity is complete (especially in the case of surface mining), dump areas remain in the place of former natural ecosystems and have the potential to cause serious environmental problems. Due to social and political pressure to undertake more sustainable development, the restoration of mining areas has gradually become an important phase of mining activities [4]. Multiple restoration solutions are available; of these, soil amendment combined with phytoremediation (reforestation) is the most environmentally friendly method [5].
Due to high soil degradation (lack of nutrients and organic matter, small edaphic volume, high concentration of heavy metals), it is important to choose a mix of species that are well-adapted to the local climate and the unique conditions of the mining habitat [6]. Successful reforestation of these degraded landscapes depends on the adaptability of tree species to degraded soil and the capacity of plant associations to contribute to the restoration of soil proprieties and former environmental conditions [7].
The process of ecosystem reconstruction on degraded mining soils progresses gradually from dump consolidation and soil amendments to pioneering species installation and finally climax tree species establishment [8]. In many cases, human interventions through ecological reconstruction are informed by the natural colonization of pioneer species. The optimal species composition for reforestation is chosen based on criteria such as adaptative capacity (survival rate), growth and biomass production (photosynthesis), and the capacity to cover the land through vegetative or generative regeneration [7].
In mountainous areas (e.g., the Carpathians), pioneer species colonize open soils on degraded or abandoned lands as part of primary succession. These pioneer species include green alder (Alnus alnobetula (Ehrh.) K. Koch = Alnus viridis (Chaix) DC), aspen (Populus tremula L.), silver birch (Betula pendula Roth.), goat willow (Salix caprea L.) and rowan (Sorbus aucuparia L.) [9]. Green alder, an N2-fixing shrub, plays an important role in mountain ecosystems due to its capacity to stabilize slopes and prevent erosion [10,11]. On the other hand, silver birch is a fast-growing deciduous species that occurs naturally throughout most of Europe and is frequently observed on degraded lands [12,13]. Aspen and goat willow have high ecological amplitudes and are widely distributed throughout the temperate and boreal areas of Europe and Asia [14,15].
Carbon assimilation, as an indicator of species’ adaptability to specific habitat conditions, is related to biomass production, CO2 storage, competitiveness and survival capacity [16]. Gas exchange measurements play a major role in understanding photosynthetic processes [17,18]. The performance of forest species in terms of photosynthetic traits is evaluated through gas exchange, which is measured under controlled experimental conditions or in situ conditions [19,20]. Particular growing conditions specific to mining-degraded soils modify the normal assimilation process [21,22,23].
To the best of our knowledge, no previous studies have measured gas exchange to analyse the photosynthetic traits of mountain pioneer species growing in former mining areas. However, analyses of photosynthetic parameters under different growing conditions (exposure to ozone, fertilization variants, enriched CO2, etc.) have been performed for Populus spp. [24,25,26], Salix spp. [27,28,29], Betula spp. [30,31,32], and Alnus spp. [33,34,35].
Our work aimed to quantify the eco-physiological performance of four broadleaf pioneer species that naturally colonized a mountain tailings dump area. The following scientific questions were examined: (i) Which of these four pioneer species is best adapted for use in reforestation processes from the point of view of photosynthetic traits? (ii) What are the seasonal patterns of the photosynthetic traits?

2. Materials and Methods
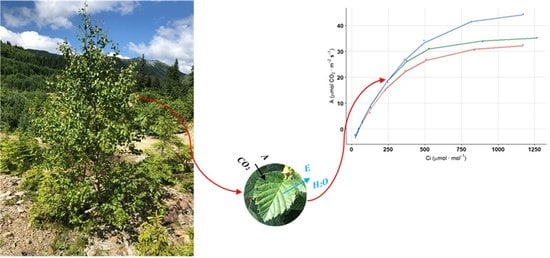
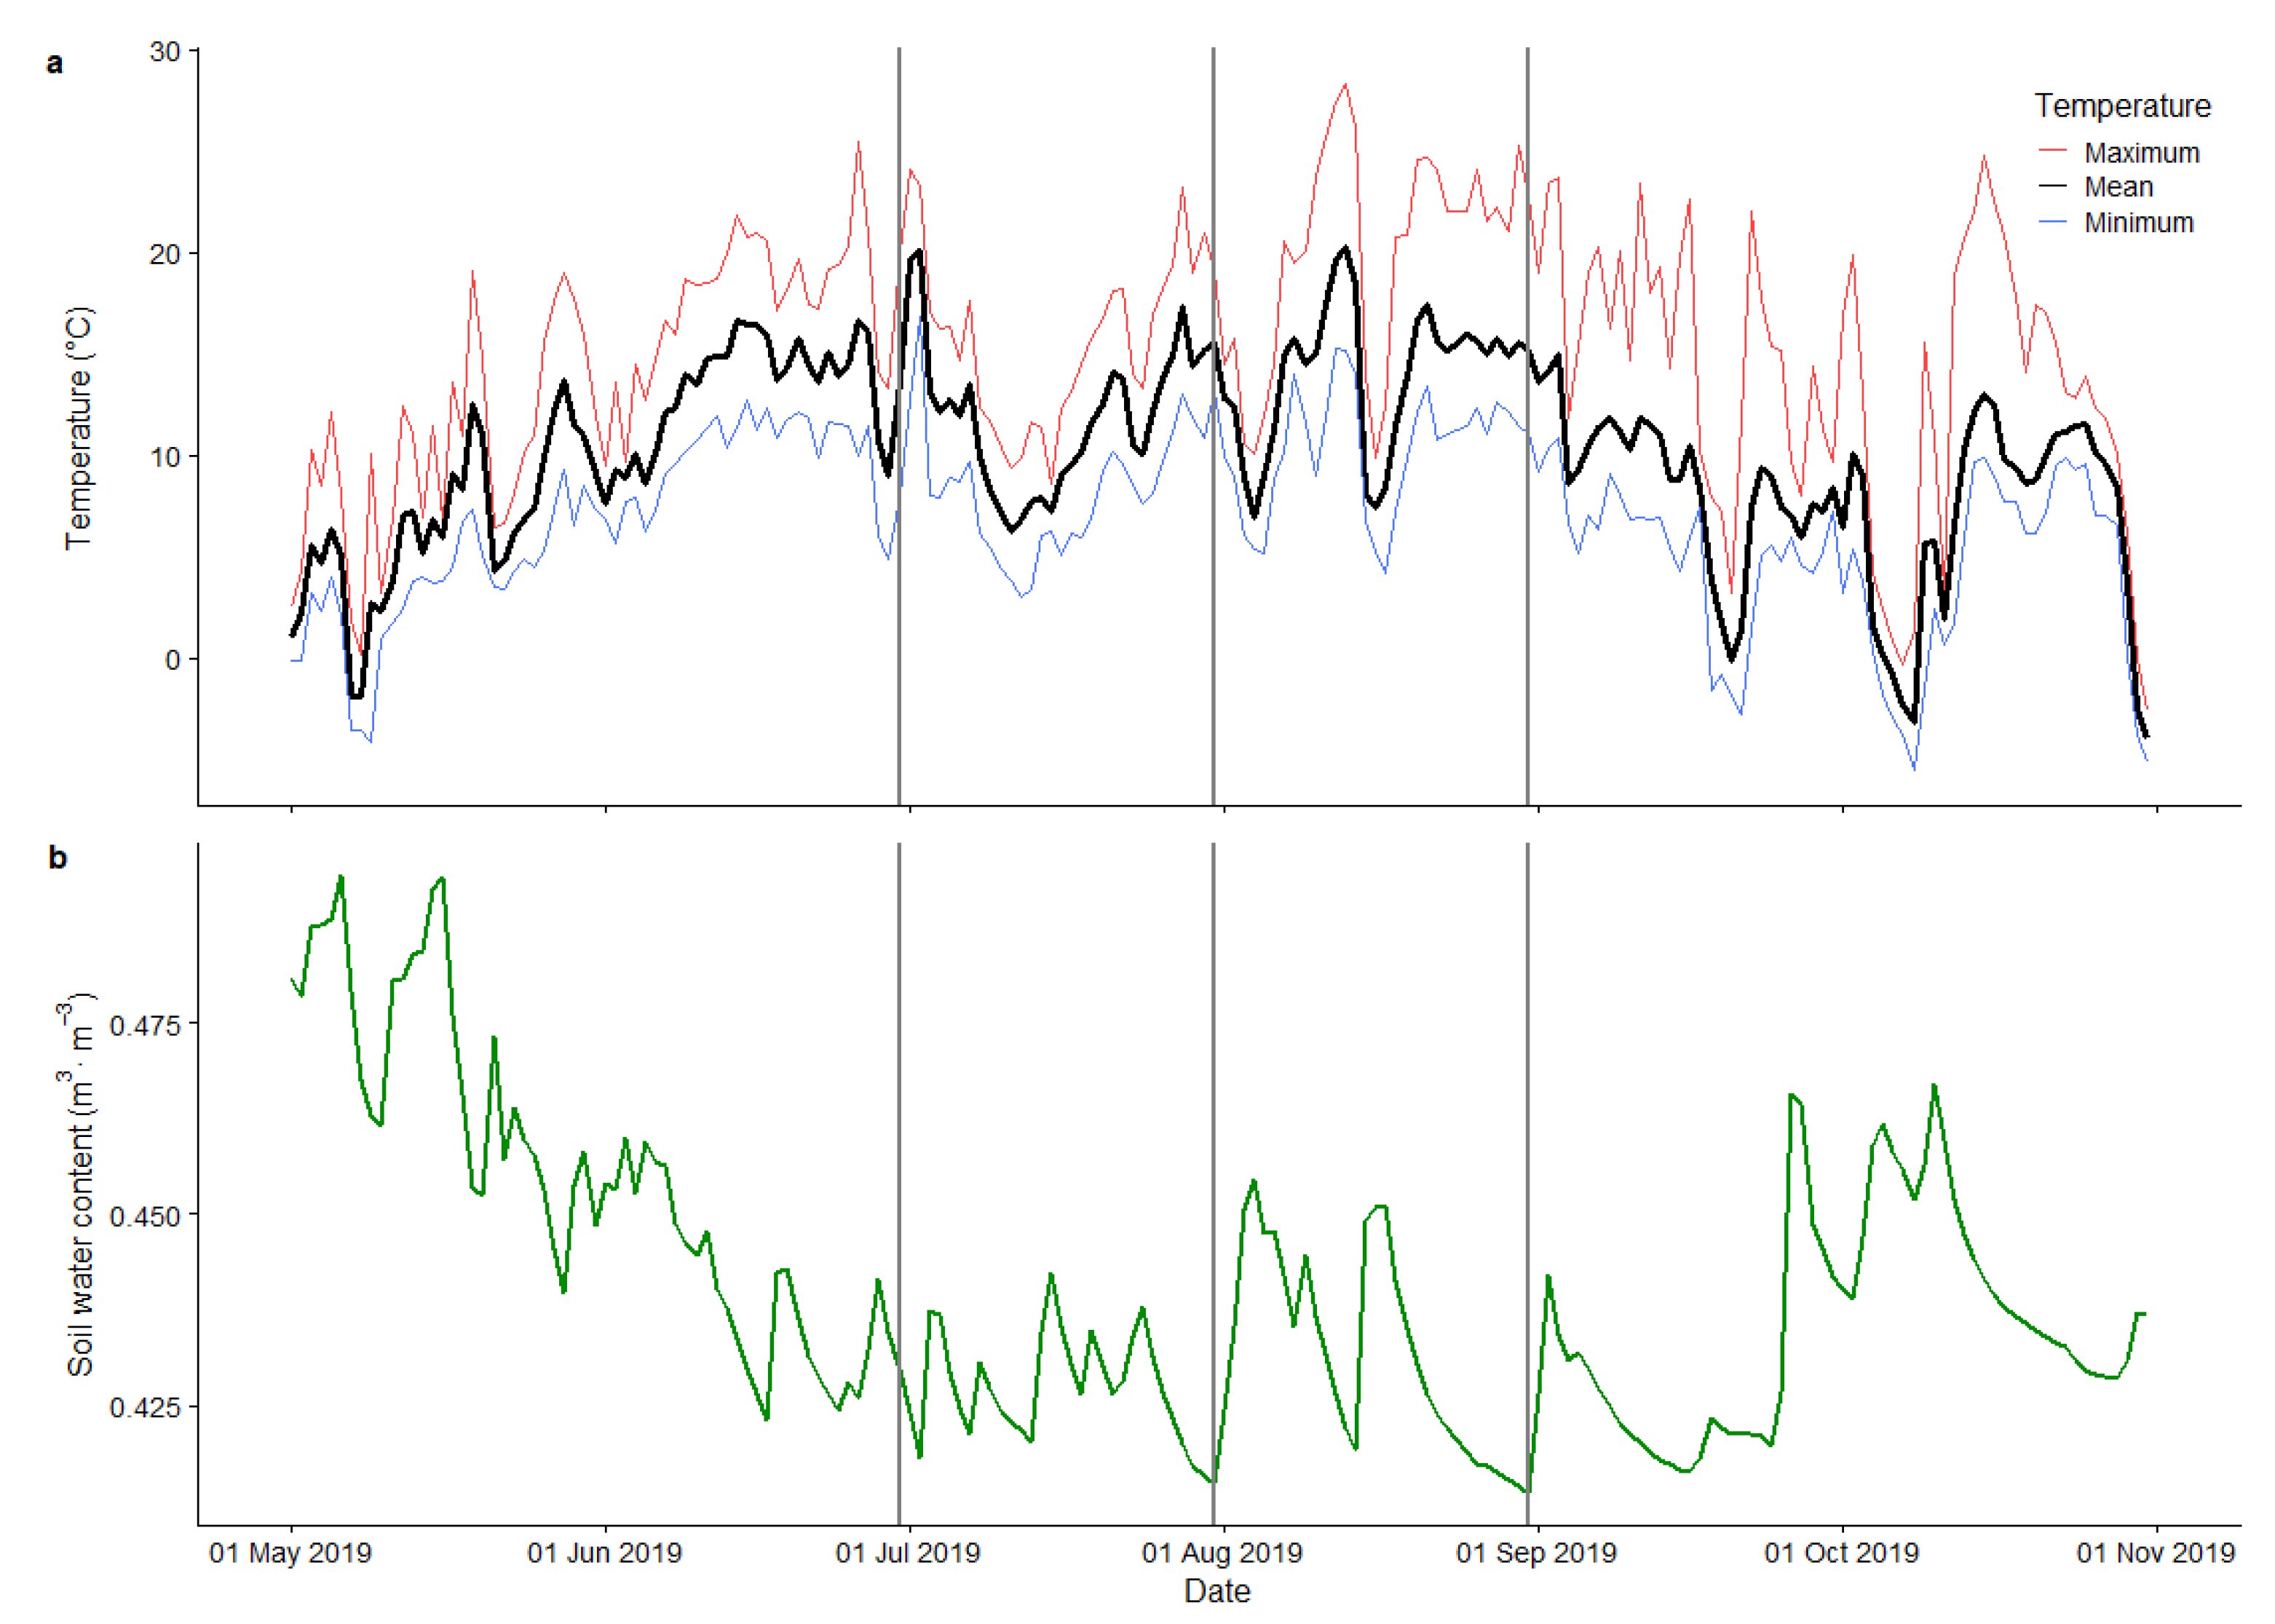
2.1. Study Site

This study took place in the Călimani Mountains (Eastern Carpathians, Romania; 47°7′24′′ N and 25°13′48′′ E; 1500 m a.s.l.) on degraded tailings dumps resulting from sulfur surface mining that occurred between 1969 and 1997. During this period, the former natural forest ecosystem (a mixture of Norway spruce and Swiss stone pine) and organic soil were destroyed, and dumps were formed by the successive storage of tailings. In 2007, an ecological reconstruction effort began with the stabilization of the slopes with high slants, alkaline amendment of the soil (debris from former buildings) and afforestation of some areas with Norway spruce (Picea abies L., H. Karst.) and green alder. Currently, the upper part of the mining dump is colonized by pioneer forest species (green alder, aspen, goat willow, birch) in combination with herbaceous species, and the area is characterized by a primary succession of vegetation [9,36].
The woody species present on the site comprise species specific to the upper mountain area: green alder, Norway spruce, dwarf mountain pine (Pinus mugo Turra), aspen, goat willow and birch. Shrubby vegetation is represented by blueberry (Vaccinium myrtillus L.), cranberry (Vaccinium vitis-idaea L.), bog blueberry (Vaccinium uliginosum L.) and rhododendron (Rhododendron myrtifolium Schott & Kotschy).
Air temperature (2 m) and soil water content (10 cm depth) were measured using dedicated sensors (HOBO U23-001, Onset Computer Corporation, Bourne, MA, USA and CS650, Campbell Scientific, Logan, UT, USA). The average annual air temperature at the site in 2019 was 4.3 °C and, in the vegetation season, it was 10.7 °C (Figure 1). The average annual precipitation in the study area is 1000–1200 mm. The snow layer is present for an average of 180–200 days each year, the first snowfall can occur in early October, and the typical vegetation season starts in the second decade of May until middle October [37].
The tailings dump soils are characterized by high acidity (pH 3.2) and missing organic components [9,36].

2.2. Gas Exchange Measurements

Gas exchange during photosynthesis was measured using a portable photosynthesis system (LI-6800, LI-COR Inc., Lincoln, NE, USA) equipped with a standard infrared gas-exchange analyser (IRGA) and a chamber for broadleaf species (area: 6 cm2). Instantaneous gas exchange was recorded at three time points in 2019 (29–30 June, 30–31 July and 30–31 August) between 9 am and 3 pm. Measurements, at each time point during the season, were performed on one leaf from five different exemplars of each broadleaf species: green alder, birch, aspen and goat willow. Due to difficult site accessibility (high mountain and degraded land) and the long time required for measurement (multiple dead times for stabilization and between measurements), we extended the day measurement period by 3 h, compared with the standard practice. We planned the experiment, in order to minimize the influence of diurnal variability of photosynthesis, by measuring the first exemplar of each species, followed by the second exemplar of each species and so on. We took into consideration that increasing the number of measurement days (now limited to two days for each time point during the season) could induce more variability because climatic parameters can change significantly (e.g., precipitation or temperature).
All studied species have C3 photosynthetic pathways. The selected trees were saplings, with a mean height of 1.5–2.0 m for silver birch, goat willow and aspen and 1.0 m for green alder. Measurements were performed on different leaves from one time point to another, but from the same exemplars. Selected leaves were completely developed, had no damage and were located on the upper part of the crown, in full exposure to light.
Instrument calibration was performed at the start of each session following the manufacturer’s recommendations [38]. To assure measurement accuracy, the gas analyser was matched when the following conditions were met: elapsed time since the last match >10 min, CO2 measured by the reference analyser have changed by 100 μmol·mol−1 since the last match, difference between CO2 reference and CO2 sample <10 μmol·mol−1, and difference in H2O <1 mmol·mol−1. While collecting the measurements, the mean temperature and relative humidity in the measurement chamber were 22.3 ± 1.8 °C and 60 ± 1.2%, respectively, the fan speed was 10,000 rpm and the flow rate was 500 µmol·s−1. The irradiance photosynthetic photon flux density (PPFD) was set to 1000 µmol·m−2·s−1 and was kept constant for all measurements, with following light composition ratio of 0.9 red and 0.1 blue using the LI-COR 6800 light source.
To obtain response curves for net photosynthetic rate as a function of intercellular CO2 concentration, a chamber CO2 gradient consisting of 400, 200, 100, 50, 400, 600, 800, 1000, and 1200 μmol·mol−1 was used. Response curve measurements were performed on one leaf from five different exemplars for each species. Between each measurement time point during the season, the exemplars were kept the same, but the leaves differ. Steady-state values from each leaf at different CO2 concentrations were recorded after 2–3 min, an interval which allowed the leaf to adjust to the new environmental conditions (a stability point was reached when the standard deviation for CO2 and H2O differences was ≤0.1 for 20 s) [38,39].
Light-saturated net photosynthetic rate A (μmol CO2·m−2·s−1), transpiration rate E (mmol H2O·m−2·s−1), stomatal conductance to water vapour gsw (mol H2O·m−2·s−1), and intercellular CO2 concentration Ci (µmol·mol−1) and leaf temperature Tleaf (°C) were measured. Using these measured parameters, three efficiency parameters were then calculated: water use efficiency WUE (as A/E, μmol CO2·m−2·s−1/mmol H2O·m−2·s−1), intrinsic water use efficiency iWUE (as A/gsw, µmol·mol−1) and instantaneous carboxylation efficiency A/Ci (μmol CO2·m−2·s−1/µmol·mol−1) [40]. During the gas exchange measurements, a uniform distribution of photosynthesis and transpiration over the leaf was assumed [41].

2.3. The Farquhar–Von Caemmerer–Berry Model

Data from the response curve of net photosynthetic rate to CO2 were analysed using the Farquhar–von Caemmerer–Berry model (the FvCB model) [42]. This model was developed to model leaf gas exchange and net photosynthetic rate (A) for C3 plants under any given environmental conditions. It has been used widely in recent decades to summarise the dependence of carbon assimilation rate on intercellular CO2 concentration (Ci) because of its simple form and the comparable metrics of photosynthetic capacity that are provided. The net photosynthetic rate predicted by the FvCB model is the minimum between the Rubisco limited rate (Ac), the ribulose 1,5-bisphosphate (RuBP)-regeneration or electron (e-) transport limited rate (Aj) and the triose phosphate utilization (TPU) limited rate (Ap) of CO2 assimilation [43,44]. Considering the three limitation phases, the net photosynthetic rate can be modelled as follows:
A = min ( A c , A j , A p )
In the Rubisco limited phase, the response of net assimilation (Ac) to Ci is defined by:
A c = V c max ( C i Γ ) C i + K C ( 1 + O / K O ) R d
where Rd is day respiration (μmol·m−2·s−1), Vcmax is the maximum carboxylation rate of Rubisco (μmol CO2·m−2·s−1), Γ* is the photosynthetic compensation point (μmol·mol−1), KC is the Michaelis–Menten constant of Rubisco for CO2 (μmol·mol−1), KO is the Michaelis–Menten constant of Rubisco for O2 (μmol·mol−1), and O is the intercellular partial pressure of O2 (mmol·mol−1) set to 21 KPa.
During the RuBP-regeneration or electron transport, the response of net assimilation (Aj) to Ci is defined by:
A j = J ( C c Γ ) 4 C c + 8 Γ R d
where J is the rate of electron transport (μmol·e−1·m−2·s−1).
In the TPU limited phase, the net assimilation rate (Ap) is defined as:
A p = 3 T p R d
where Tp is the rate of phosphate release in triose phosphate utilization (μmol·m−2·s−1).
The kinetic constants of Rubisco (Γ*, KC, KO), which are temperature-dependent, were derived using Arrhenius-type equations using the leaf temperature measurements [45,46]. Traits of photosynthetic capacity (Vcmax, Jmax, TPU) were derived from the FvCB model and were corrected to a temperature of 25 °C [47]. More information and details about A/Ci data fitting can be found in the literature [48,49,50]. The FvCB model was applied for each leaf, and coefficients were analysed as mean.

2.4. Data Analyses

Differences between species were analysed using ANOVA followed by post hoc Tukey tests [51]. The dependence between photosynthetic parameters was quantified using the Pearson correlation coefficient. Statistical tests were considered significant at the p < 0.05 level. FvCB model parameters were estimated using the R package ‘plantecophys’ [47], and figures were constructed using the packages ‘ggplot2’ and ‘cowplot’. All data processing was done using R 4.0.3 software [52].

3. Results and Discussion

3.1. Photosynthetic Parameters for Deciduous Pioneer Species

To compare the eco-physiological performance of the deciduous pioneer species that naturally colonized the mining dump areas in the Călimani Mountains, the mean values of photosynthetic traits during the 2019 vegetation period were analysed for CO2 concentration close to the actual environmental concentration (400 µmol·mol−1).
Green alder and birch had the highest net assimilation rate for the entire season among the four species analysed (Table 1). The lowest net assimilation rate was recorded for goat willow. The net assimilation rate for green alder was significantly higher than those of aspen and goat willow, while the net assimilation rate of birch was significantly different only from that of goat willow. Similar values for net assimilation (ranging from 12.8 to 17.3 µmol CO2·m−2·s−1) have been documented under similar measurement conditions (1400 µmol·m−2·s−1 PPFD and 320 µmol·mol−1 CO2 concentration) for the seedlings of different Alnus species [33]. However, our results showed slightly higher net assimilation values for silver birch compared with the range reported in the literature [31,32,53].
Birch had the highest rates of transpiration and stomatal conductance. The rates of transpiration for birch were significantly higher than those for green alder, but stomatal conductance was not significantly different between species. Similar transpiration rate (3.4 mmol·m−2·s−1) and stomatal conductance (0.4 mol·m−2·s−1) have been observed for mountain birch at the treeline on the Tibetan Plateau [54]. Birch proveniences and leaf types (early vs. late leaves) can induce differences in stomatal conductance [12].
Diffusion of CO2 into the intercellular spaces inside leaves occurs mainly through stomatal pores [55]. Stomatal density and distribution on leaves differ among species. As a result, we obtained different Ci values even though the CO2 concentration in the measurement chamber (400 µmol·mol−1) was similar for all species. Green alder had the lowest intercellular CO2 concentration, which was significantly different from those of the other species. The variation in intercellular CO2 concentration allows us to understand whether the decline in net photosynthesis rate is due to stomatal limitations or to the reduction of photosynthetic activity in the leaves’ cells [56].
Instantaneous carboxylation efficiency was the lowest for aspen and goat willow and the highest for green alder. This photosynthetic parameter can be considered as an estimate of Rubisco activity; generally, higher intercellular CO2 concentration is associated with lower stomatal conductance. Water use efficiency (WUE and iWUE) was also the highest for green alder and differed significantly from those of the other species.
Regardless of the species, the highest correlation was observed between transpiration rate and stomatal conductance (Table 2). For birch only, a negative correlation was found between net assimilation rate and intercellular CO2 concentration. The correlation coefficient between net assimilation rate and transpiration rate varied from 0.74 (birch) to 0.93 (goat willow) and was significant in all cases. Similar significant negative correlations between Ci and A have also been found for birch in a Lithuanian forest (boreal zone) [40].

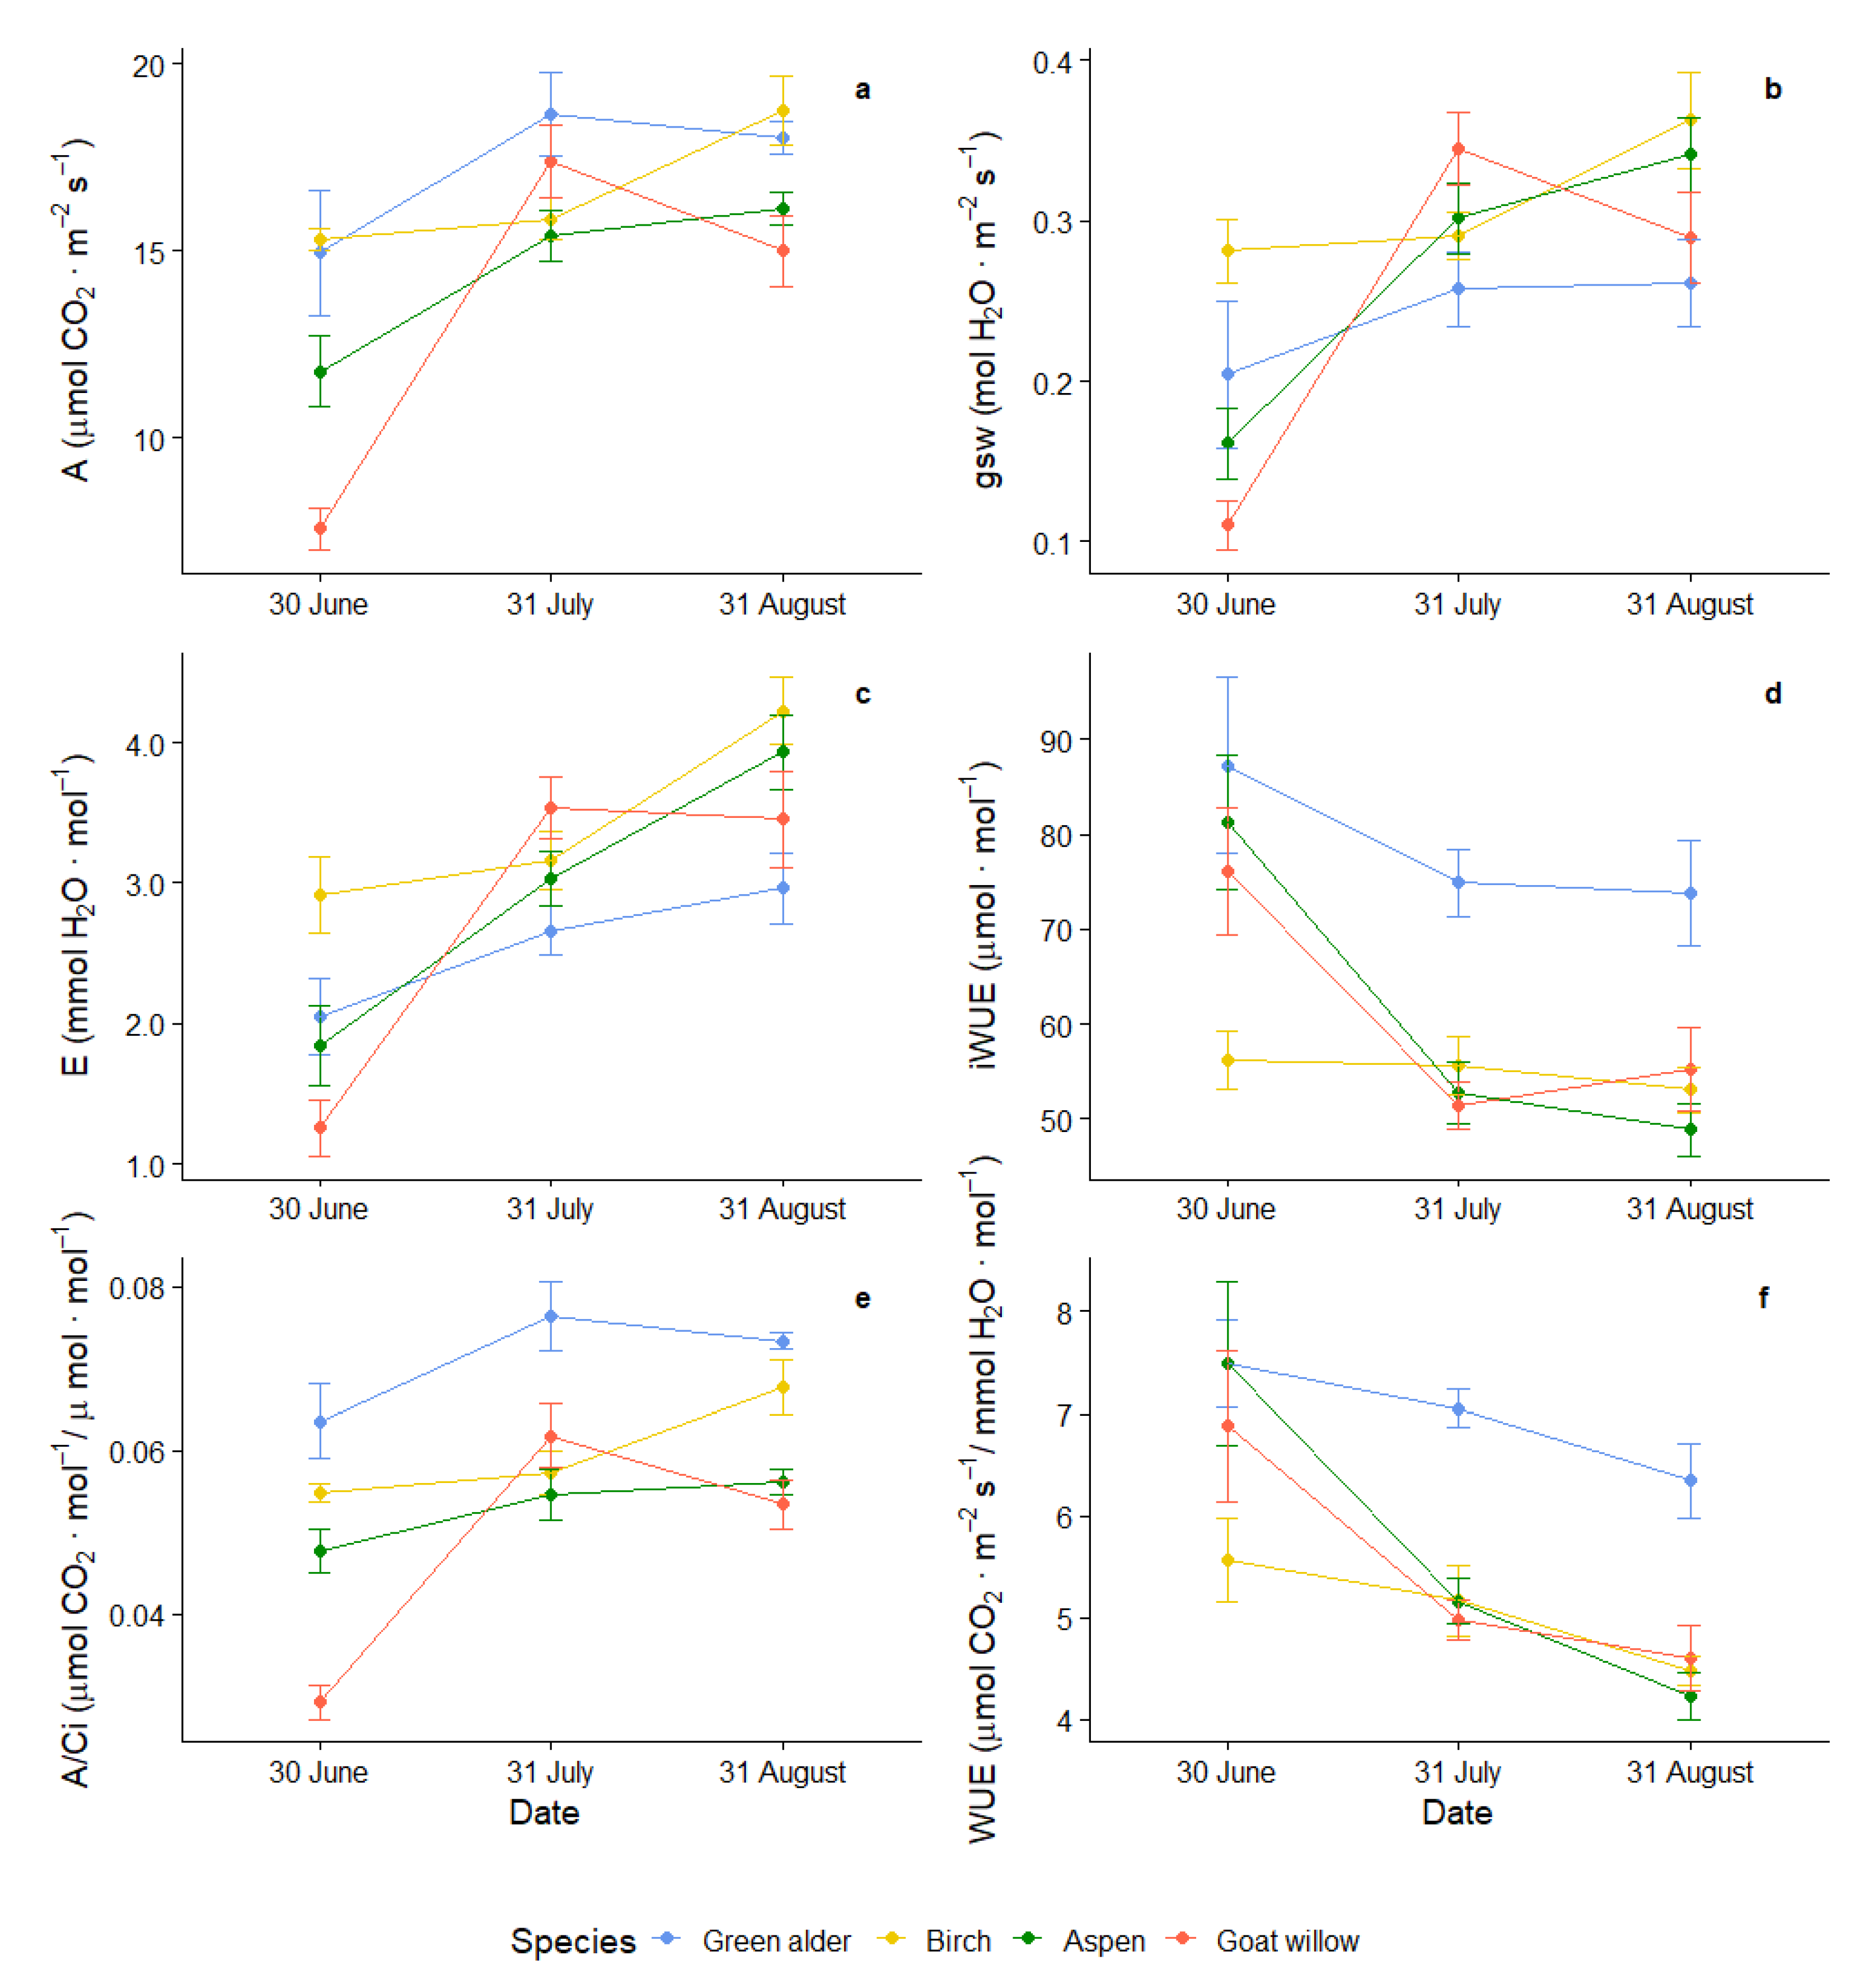
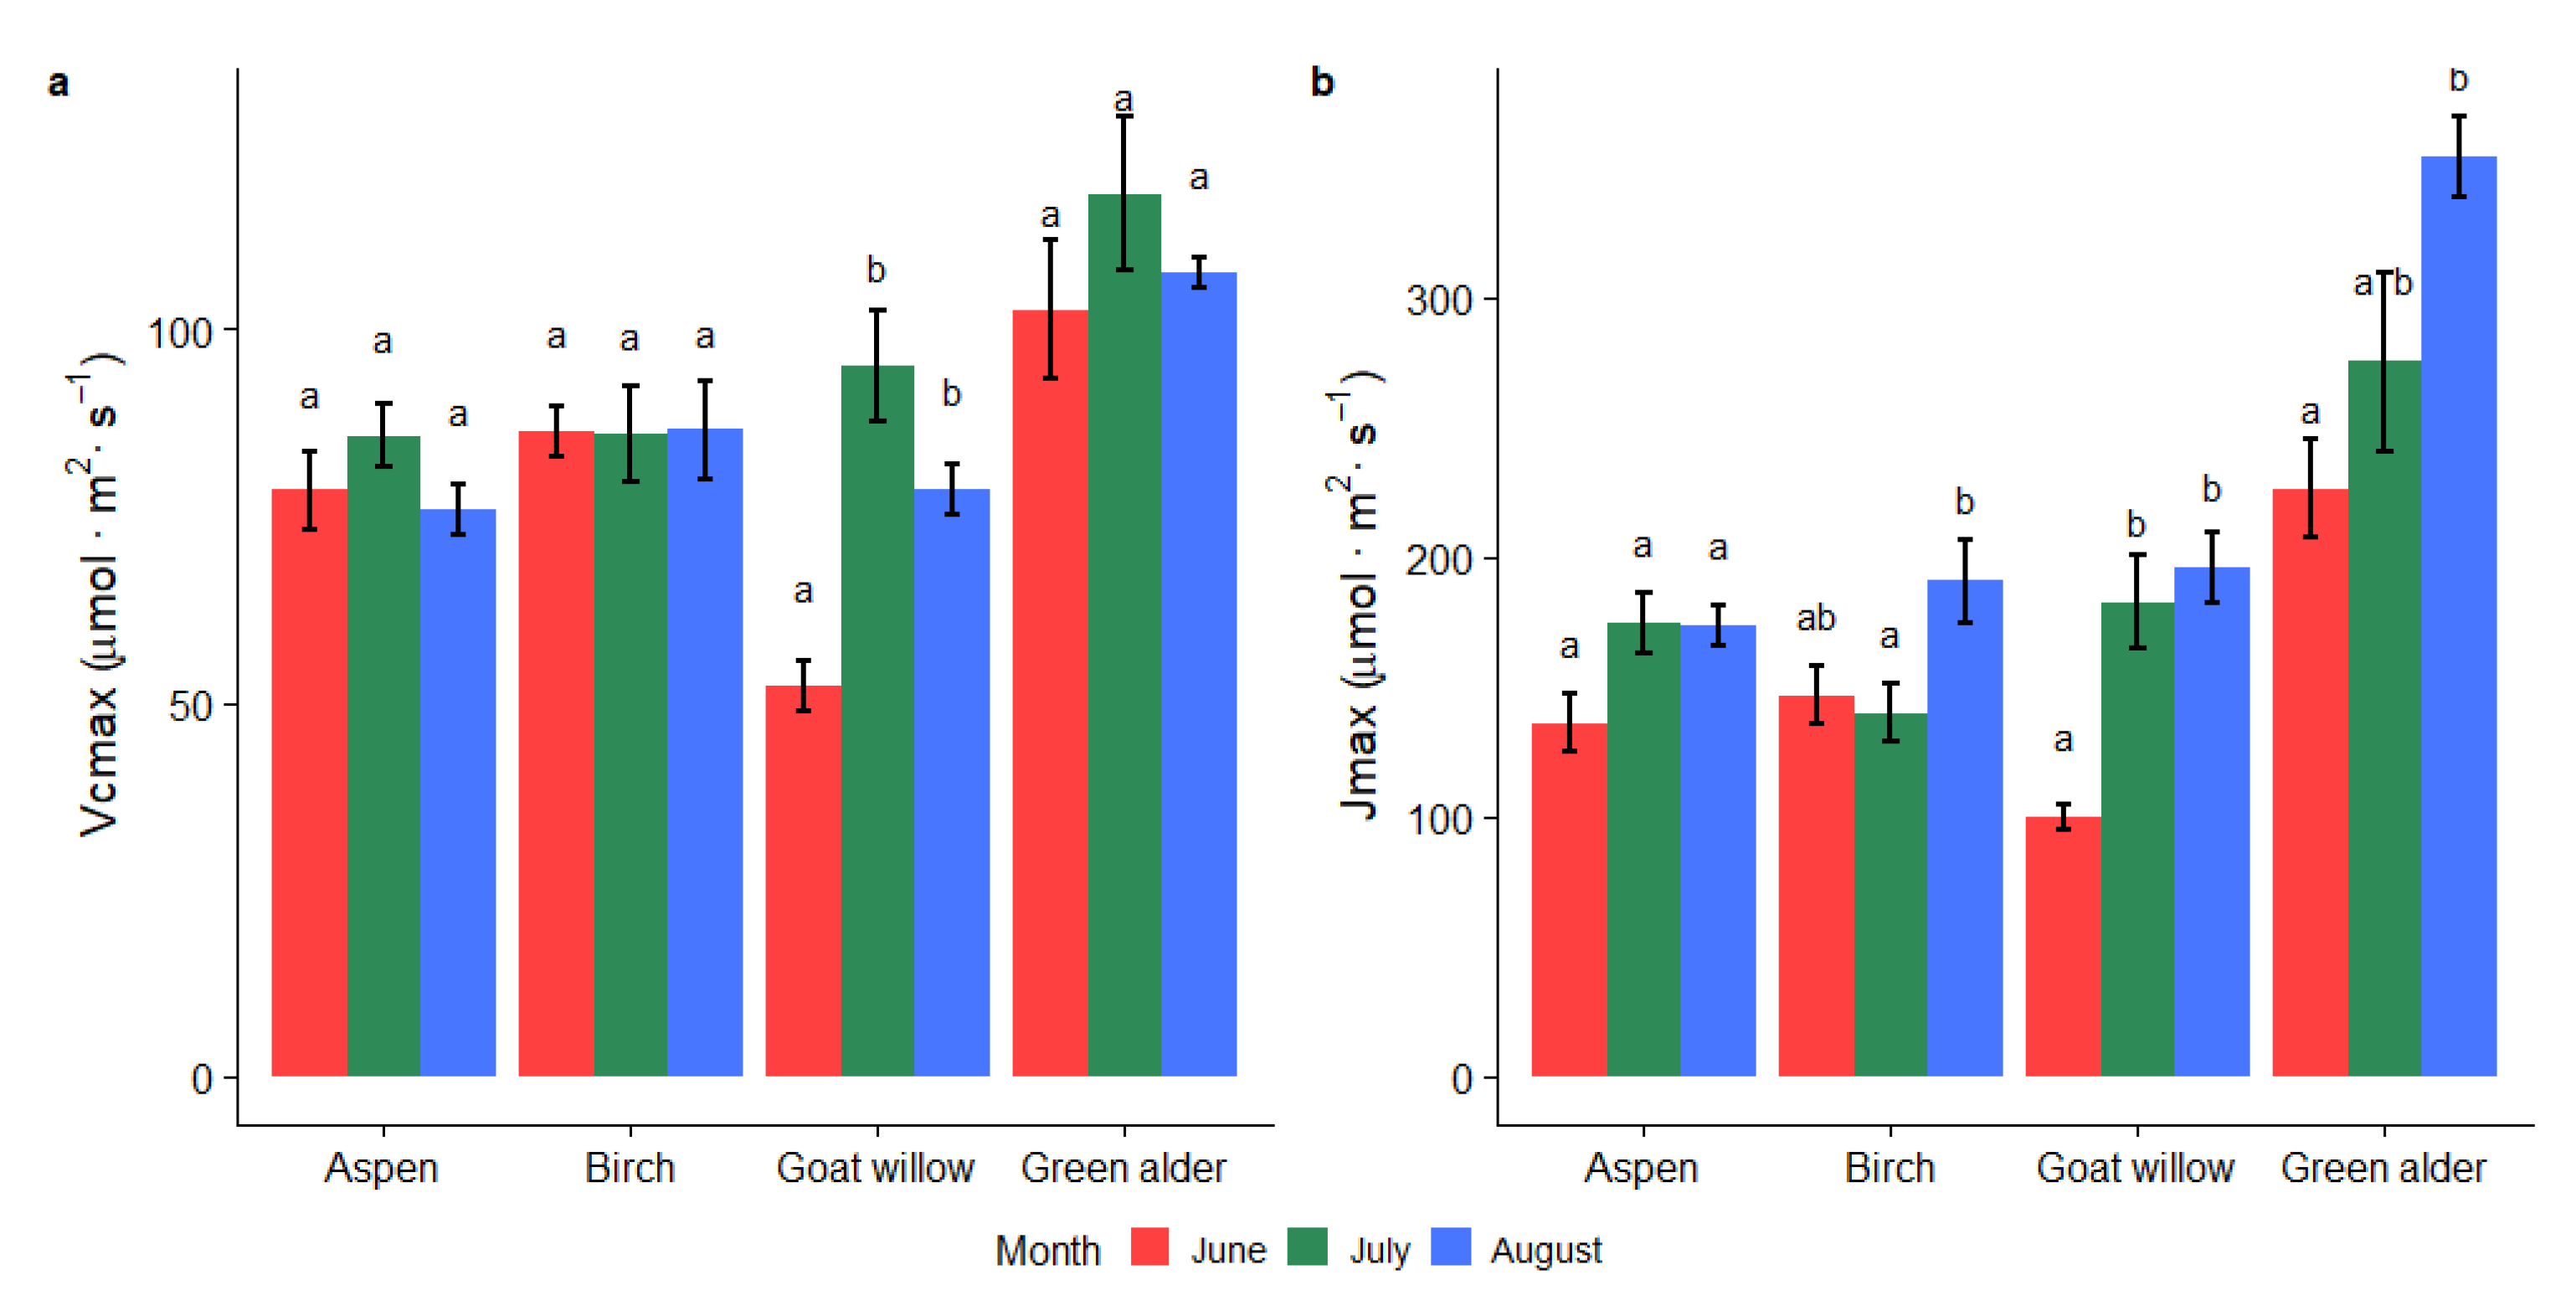
3.2. Variability of Photosynthetic Parameters during the Vegetation Season

For broadleaf species, the chlorophyll content of leaves changes throughout the growing season, which induces variability in eco-physiological processes. Because of these biochemical changes in leaves, it is important to explore the variation in individual photosynthetic parameters during the vegetation season [12]. To avoid the systematic influence of diurnal variation, the gas exchange measurements were distributed during the day from 9 am to 3 pm. The net assimilation rate varied across the season for all four species, with the lowest values recorded at the end of June (Figure 2a). The lowest net assimilation rate was observed for goat willow at the end of June (7.55 μmol CO2·m−2·s−1) and was significantly different from the values in other months. For green alder, the maximum value of net assimilation was measured at the end of July (18.64 μmol CO2·m−2·s−1), and the minimum was recorded at the end of June (14.93 μmol CO2·m−2·s−1). A similar trend in variation was found for goat willow. On the contrary, net assimilation rates for birch and aspen increased continuously during the season.
Studies in boreal forests indicate that, for birch, the highest rates of leaf-mass net assimilation occur under light-saturated conditions in early May after the leaves unfold, and there is minimal variation during the vegetation season [12]. For other species, the maximum leaf-area net assimilation occurs in late June and early July [31]. Studies on different Salix spp. have highlighted a weak correlation between biomass yield and photosynthetic rate and a positive influence of total leaf area per plant [27].
Stomatal conductance increased continuously from the beginning of the season to autumn for all species, except goat willow (Figure 2b). A similar pattern was observed for transpiration rate, but with a higher rate of increase from the beginning to the end of the season. These two parameters had a similar trend in variation because transpiration is regulated mainly by stomatal conductance [56]. The stomatal conductance of aspen and goat willow in June was significantly different from that measured in July or August. The maximum values for transpiration rate were measured in August for green alder (2.96 mmol H2O·m−2·s−1), aspen (3.93 mmol H2O·m−2·s−1) and birch (4.22 mmol H2O·m−2·s−1) and in July for goat willow (3.35 mmol H2O·m−2·s−1) (Figure 2c).
iWUE and WUE decreased during the vegetation season for all studied species, possibly linked with the lower soil water content during the measurements in July and August (see Figure 1). Water use efficiency parameters were significantly different between all three measurement timepoints only in the case of aspen. Similarly, differences between monthly values of WUE have been reported for another poplar species (Populus angustifolia) from North America [57]. Goat willow exhibited a different trend in variation, with slightly higher iWUE values at the end of August compared to July. Green alder had the highest values of both WUE and iWUE compared to other species.
Variation in iWUE and WUE during the season is a consequence of both changing environmental conditions and physiological changes in leaf structure due to ageing [58]. Both parameters reflect water use efficiency (how much carbon is fixed per unit of water loss), but WUE can also be used as a water stress indicator (drought indicator) [59]. Higher values of iWUE or WUE can be achieved through lower stomatal conductance or transpiration rate, higher assimilation capacity or a combination of both [60]. Water supply is one factor that can cause plants to have a lower stomatal conductance and higher WUE [12]. Our study was conducted in a mountain area where precipitation is not a limiting factor, but variations in WUE may still occur due to particular conditions induced by precipitation variation during vegetation season. In the second and third measurement time points, low soil water content was reported (see Figure 1), which may induce a decrease in water use efficiency parameters.
Green alder also demonstrated the highest instantaneous carboxylation efficiency compared with other deciduous pioneer species, with a maximum in late July (Figure 2e). It had a lower intercellular CO2 concentration but maximum values for assimilation rate. One possible explanation for this is that green alder is in its optimal distribution range, is acclimatized to cold environments and uses resources more efficiently. The maximum instantaneous carboxylation efficiency occurred in July for goat willow and at the end of August for aspen and birch.
The mining dump areas are exposed to high light intensity, large temperature variability and low nitrogen availability. Low availability of soil nitrogen can be an important limiting factor of photosynthesis [19,21]. N2-fixing plants that are capable of fixing atmospheric nitrogen, like green alder, can be more performant in terms of photosynthetic traits on degraded soils compared with other pioneer species [61]. Leaf size and structure, combined with crown size and branching patterns, play an important role in the assimilation performance of different species [62]. Field observations confirm that the leaf area and crown development of green alder are greater than for the other species.

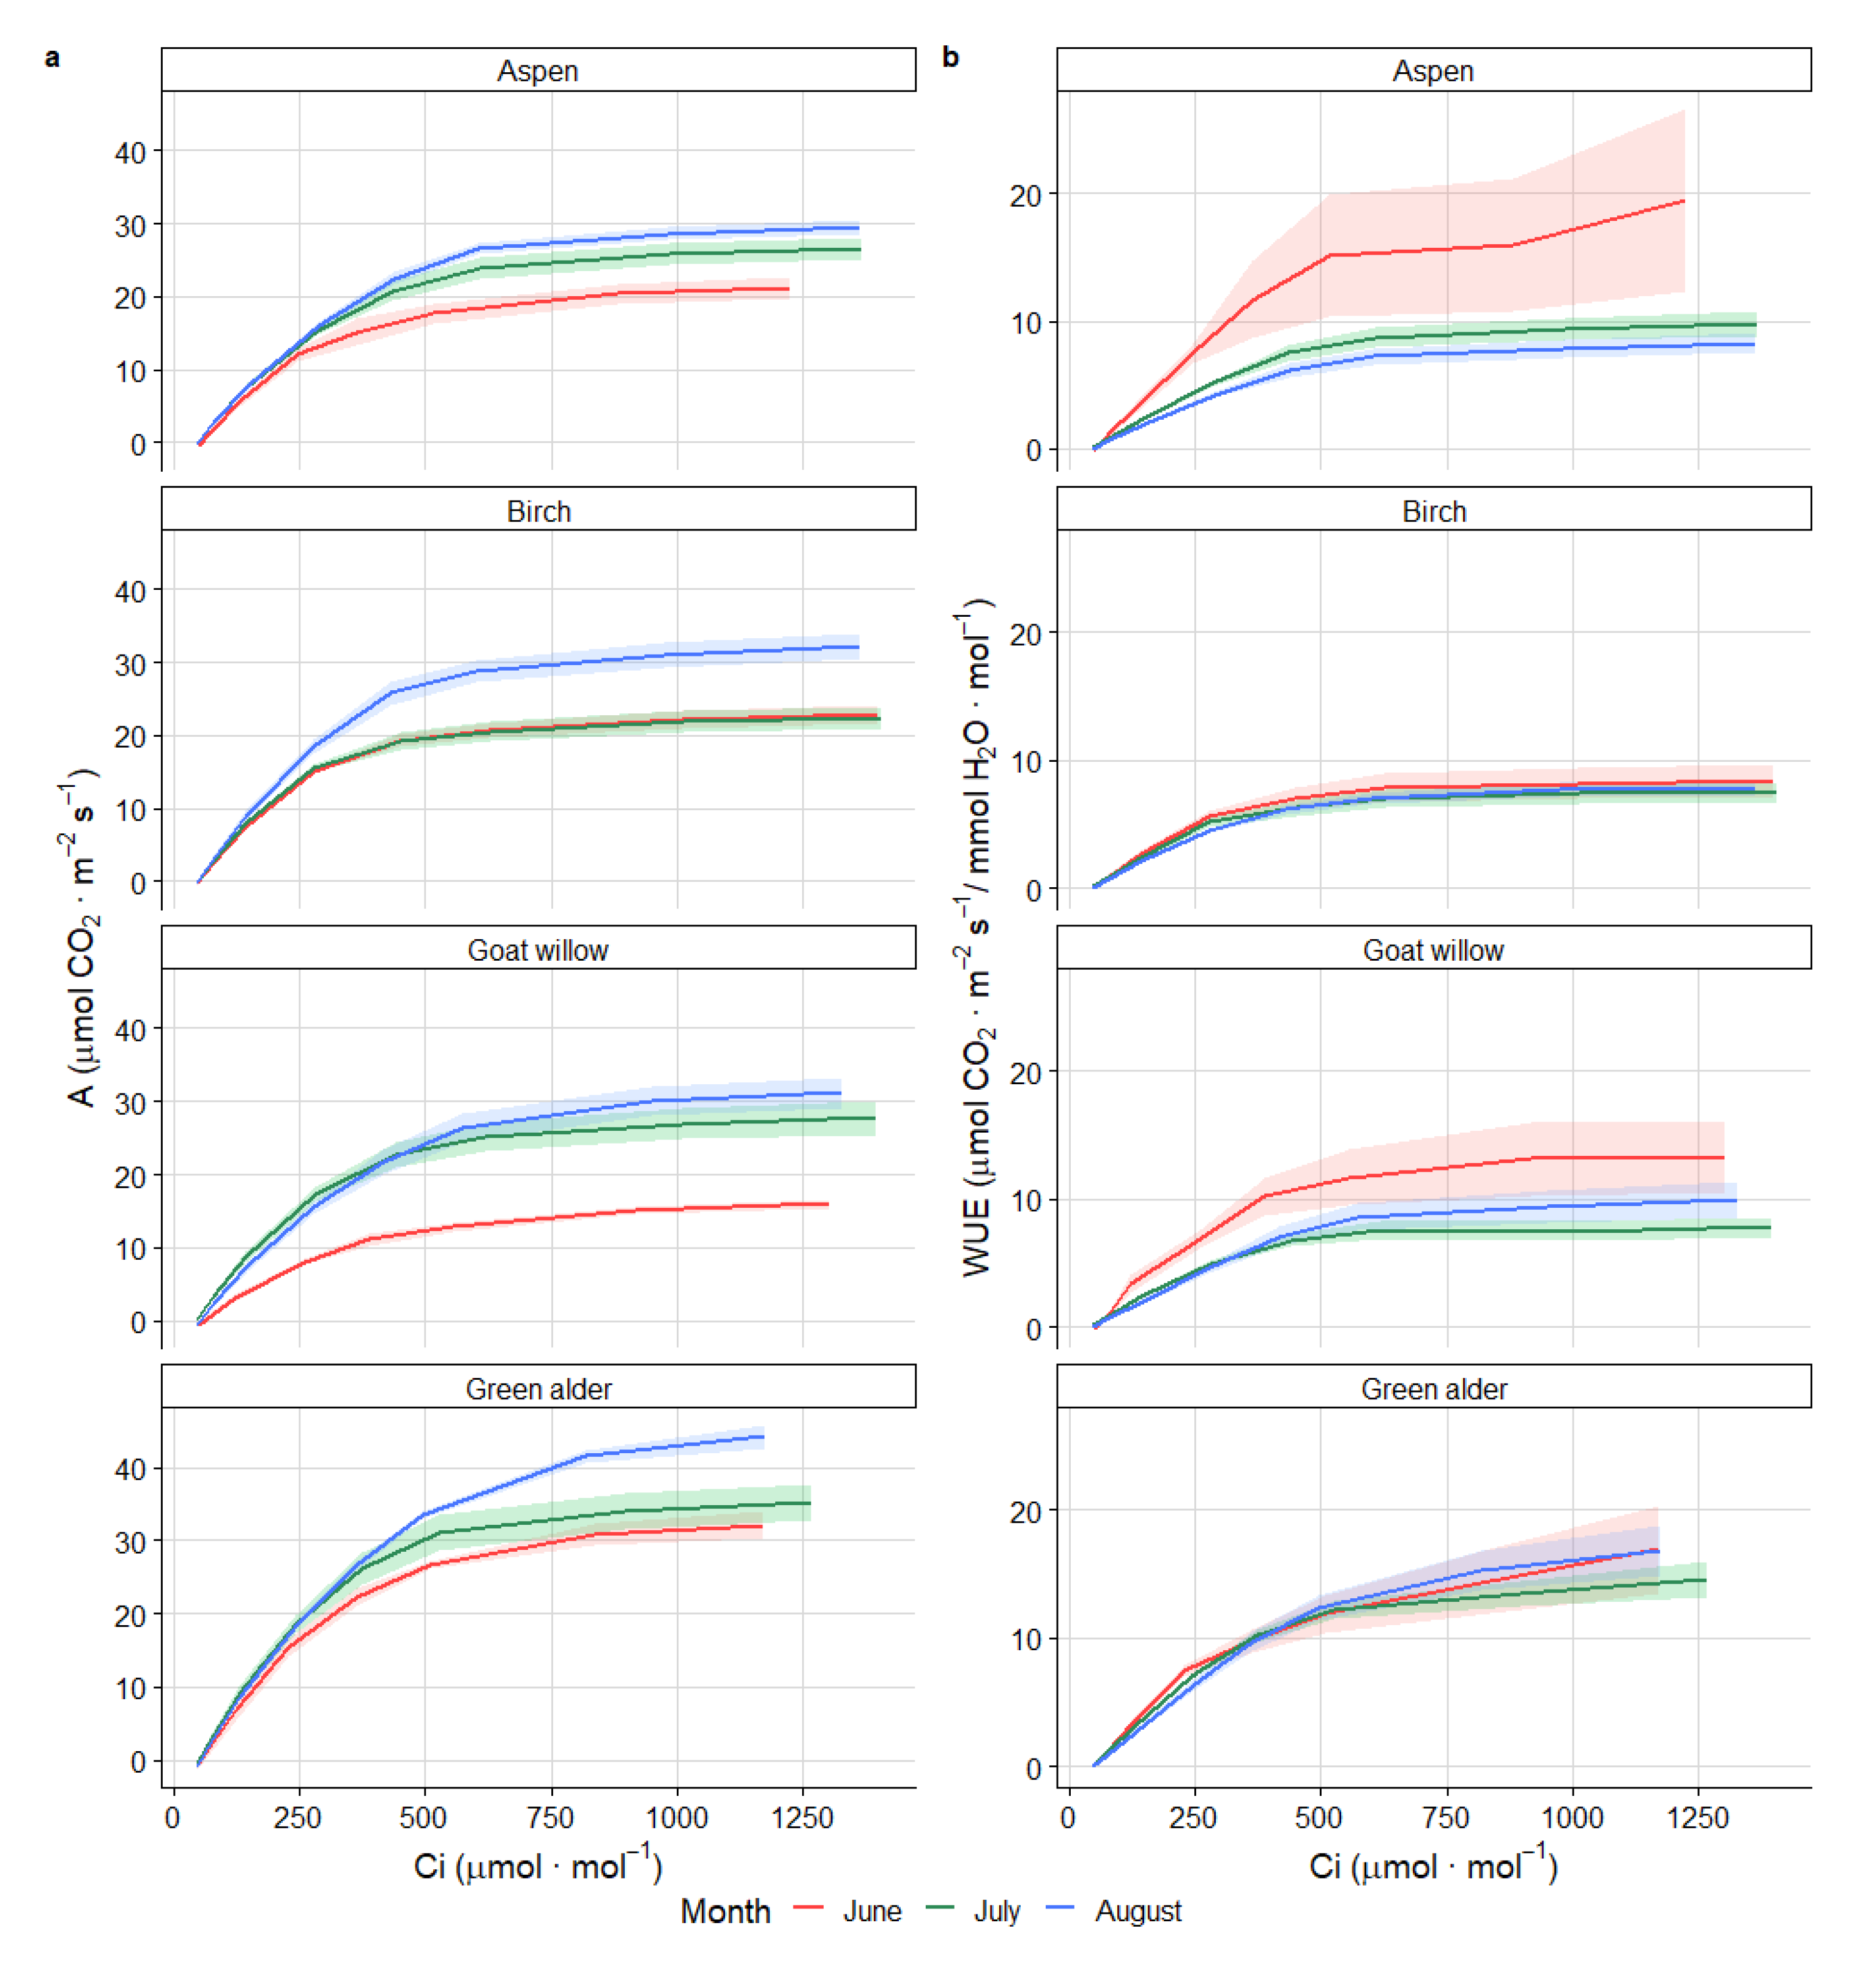
3.3. Photosynthesis Response Curve under Increasing CO2 Concentration

Using a variable concentration of CO2 to understand assimilation performance is more efficient than using a constant CO2 concentration [63]. An A/Ci curve can be constructed to understand and interpret the biochemical processes of leaf photosynthesis under various environmental conditions. The measured values of net assimilation at different CO2 concentrations are used to estimate photosynthetic limitations and parameters of photosynthetic performance using two key parameters from the FvCB model: Vcmax and Jmax.
The response curve for the relationship between assimilation and CO2 concentration shows an initial increase followed by a relatively constant variation caused by light limitation (Figure 3). A clear difference between the three measurement time points was observed for all species, except for birch in June and July. The limitation of assimilation rate due to light availability occurred after reaching an intercellular CO2 concentration of 500 µmol·mol−1. After passing this threshold, the highest assimilation rate was measured in August for all four species. For goat willow and aspen, variation in WUE in relation to CO2 concentration was higher in June.
Based on the FvCB model, the limitations of the photosynthetic process are characterized by two main parameters—Vcmax and Jmax—and occasionally also by TPU. Estimation of these parameters is regulated by the limitations of one of three curves of the FvCB model. Vcmax is the maximum rate of Rubisco activity and reflects a limitation in RuBP-regeneration [48]. For green alder, the highest values of Vcmax were recorded in July, and the lowest in June, without significant differences during the season (Figure 4a). For birch and aspen, there were no significant differences in Vcmax during the season. The lowest Vcmax for goat willow was recorded in June, statistically different from the rest of the season, and was associated with lower assimilation levels. To derivate the seasonal mean of Vcmax, it is recommended to perform measurements in midsummer. Maximum values of Vcmax were obtained in the middle of the vegetation season (end July).
Jmax represents the maximum rate of electron transport for RuPB-regeneration at the light intensity used in the study (1000 µmol·m−2·s−1) (Figure 4b) [64]. Jmax was the lowest in June and highest in August, regardless of the species. With exception of aspen, the Jmax differs significantly between time points during the season. Vcmax and Jmax are correlated with Amax (the maximum value of assimilation) because these parameters all reflect limitations in photosynthetic processes. Green alder exhibited the highest values of Vcmax and Jmax and also had the highest rate of photosynthesis at both ambient and saturating CO2, while goat willow presented the lowest values for all of these variables. The ratio of Jmax to Vcmax varied in the typical range (1.5 to 2.5) observed for other woody species [65].
TPU limitation occurred in less than half of the samples, as it generally requires a higher Ci concentration than that used in our study. This third state of photosynthesis limitation occurs when the chloroplast system’s reaction is greater than the possibility of the leaf using the triose phosphate [43]. This is more likely to happen under experimental conditions than in natural situations, and this limitation state has not been taken into account in many studies [66].
Light dependence of Jmax varied by up to 40% across the different leaves of birch [30]. Meanwhile, Vcmax is dependent on the temperature and increases at higher temperatures, but with limitations at very high temperatures [30]. For Populus species, multiple studies have documented Vcmax and Jmax values lower than those reported in this study, even though the light radiance used was higher, at 200–500 µmol·m−2·s−1 [25]. A global study that analysed more than 350 species highlighted that, for tree species, the mean values of Vcmax and Jmax were 66.6 µmol·m−2·s−1 and 114.4 µmol·m−2·s−1, respectively [67].

4. Conclusions

Reforestation and the stable ecological restoration of tailings dumps resulting from surface mining activities in the Călimani Mountains have been a high priority for regional and national administrations in the last two decades. Even though several solutions have been implemented (dumps stabilization, soil amendments, etc.), the complete recovery of the degraded habitats is still a challenge. Gaining a better understanding of natural colonization with pioneer woody species, such as through studying primary natural succession, can offer valuable knowledge about the species that are most adapted to these particular environmental conditions.
The most productive pioneer species in terms of photosynthetic traits was the green alder, a woody N2-fixing shrub. It showed the highest rates of net assimilation, carboxylation efficiency and water use efficiency and can be a suitable species for reforestation based on the study conditions. During the growing season, this species’ maximum photosynthetic capacity is generally observed at the end of July, with a minimum in late June.
A detailed understanding of the variability and dynamics of the photosynthetic capacity of pioneer species that naturally occur on tailings dumps is essential, offering valuable data to the process of characterizing suitable species for ecological restoration systems to heal these open wounds in the landscape.

Author Contributions

Conceptualization, I.P. and A.P.; methodology, A.P.; writing—original draft preparation, A.P.; writing—review and editing, I.P. All authors have read and agreed to the published version of the manuscript.

Funding

This research was funded by the Romanian Ministry of Research and Innovation in Core Program for forestry–BIOSERV (2019)–Project PN 19070102.

Data Availability Statement

Data is available on request formed to the corresponding author.

Acknowledgments

We thank Margareta Grudnicki for valuably suggestions and the Forestry Faculty of Suceava for supporting this study.

Conflicts of Interest

The authors declare no conflict of interest.

References

  1. Shukla, P.R.; Skea, J.; Buendia, E.C.; Masson-Delmotte, V.; Pörtner, H.-O.; Roberts, D.C.; Zhai, P.; Slade, R.; Connors, S.; van Diemen, R.; et al. IPCC, 2019: Climate Change and Land: An IPCC Special Report on Climate Change, Desertification, Land Degradation, Sustainable Land Management, Food Security, and Greenhouse Gas Fluxes in Terrestrial Ecosystems; Intergovernmental Panel on Climate Change (IPCC): Geneva, Switzerland, 2019; pp. 1–864. [Google Scholar]
  2. Liu, S.; Li, W.; Qiao, W.; Wang, Q.; Hu, Y.; Wang, Z. Effect of Natural Conditions and Mining Activities on Vegetation Variations in Arid and Semiarid Mining Regions. Ecol. Indic. 2019, 103, 331–345. [Google Scholar] [CrossRef]
  3. Chauhan, S.S. Mining, Development and Environment: A Case Study of Bijolia Mining Area in Rajasthan, India. J. Hum. Ecol. 2010, 31, 65–72. [Google Scholar] [CrossRef]
  4. Deng, J.; Bai, X.; Zhou, Y.; Zhu, W.; Yin, Y. Variations of Soil Microbial Communities Accompanied by Different Vegetation Restoration in an Open-Cut Iron Mining Area. Sci. Total Environ. 2020, 704, 135243. [Google Scholar] [CrossRef] [PubMed]
  5. Henry, H.F.; Burken, J.G.; Maier, R.M.; Newman, L.A.; Rock, S.; Schnoor, J.L.; Suk, W.A. Phytotechnologies—Preventing Exposures, Improving Public Health. Int. J. Phytoremediat. 2013, 15, 889–899. [Google Scholar] [CrossRef] [PubMed] [Green Version]
  6. Macdonald, S.E.; Landhäusser, S.M.; Skousen, J.; Franklin, J.; Frouz, J.; Hall, S.; Jacobs, D.F.; Quideau, S. Forest Restoration Following Surface Mining Disturbance: Challenges and Solutions. New For. 2015, 46, 703–732. [Google Scholar] [CrossRef] [Green Version]
  7. Pietrzykowski, M. Tree Species Selection and Reaction to Mine Soil Reconstructed at Reforested Post-Mine Sites: Central and Eastern European Experiences. Ecol. Eng. X 2019, 3, 100012. [Google Scholar] [CrossRef]
  8. Frouz, J.; Dvorščík, P.; Vávrová, A.; Doušová, O.; Kadochová, Š.; Matějíček, L. Development of Canopy Cover and Woody Vegetation Biomass on Reclaimed and Unreclaimed Post-Mining Sites. Ecol. Eng. 2015, 84, 233–239. [Google Scholar] [CrossRef]
  9. Cenușă, E. Instalarea Vegetației Naturale În Zone Afectate de Activități Miniere Din Parcul National Călimani; Forestry Technical Publishing House: Voluntari, Romania, 2018. [Google Scholar]
  10. Boscutti, F.; Poldini, L.; Buccheri, M. Green Alder Communities in the Alps: Phytosociological Variability and Ecological Features. Plant Biosyst. 2014, 148, 917–934. [Google Scholar] [CrossRef]
  11. Mauri, A.; Caudullo, G. Alnus viridis in Europe: Distribution, Habitat, Usage and Threats. In European Atlas of Forest Tree Species; European Commission: Brussels, Belgium, 2016; p. 68. [Google Scholar] [CrossRef]
  12. Tenkanen, A.; Keski-Saari, S.; Salojärvi, J.; Oksanen, E.; Keinänen, M.; Kontunen-Soppela, S. Differences in Growth and Gas Exchange between Southern and Northern Provenances of Silver Birch (Betula Pendula Roth) in Northern Europe. Tree Physiol. 2020, 40, 198–214. [Google Scholar] [CrossRef]
  13. Beck, P.; Caudullo, G.; de Rigo, D.; Tinner, W. Betula pendula, Betula pubescens and Other Birches in Europe: Distribution, Habitat, Usage and Threats. In European Atlas of Forest Tree Species; European Commission: Brussels, Belgium, 2016; pp. 70–73. [Google Scholar] [CrossRef]
  14. Caudullo, G.; de Rigo, D. Populus tremula in Europe: Distribution, Habitat, Usage and Threats. In European Atlas of Forest Tree Species; European Commission: Brussels, Belgium, 2016; pp. 138–139. [Google Scholar] [CrossRef]
  15. Enescu, C.M.; Houston Durrant, T.; de Rigo, D.; Caudullo, G. Salix caprea in Europe: Distribution, Habitat, Usage and Threats. In European Atlas of Forest Tree Species; European Commission: Brussels, Belgium, 2016; pp. 170–171. [Google Scholar] [CrossRef]
  16. Pallardy, S. Physiology of Woody Plants. Pac. Conserv. Biol. 1998, 4, 272. [Google Scholar] [CrossRef] [Green Version]
  17. Cavaleri, M.A.; Reed, S.C.; Smith, W.K.; Wood, T.E. Urgent Need for Warming Experiments in Tropical Forests. Glob. Chang. Biol. 2015, 21, 2111–2121. [Google Scholar] [CrossRef]
  18. Long, S.P.; Bernacchi, C.J. Gas Exchange Measurements, What Can They Tell Us about the Underlying Limitations to Photosynthesis? Procedures and Sources of Error. J. Exp. Bot. 2003, 54, 2393–2401. [Google Scholar] [CrossRef] [PubMed] [Green Version]
  19. Zhao, X.; Mao, Z.; Xu, J. Gas Exchange, Chlorophyll and Growth Responses of Betula Platyphylla Seedlings to Elevated CO2 and Nitrogen. Int. J. Biol. 2010, 2, 143–149. [Google Scholar] [CrossRef]
  20. Liu, M.Z.; Jiang, G.M.; Li, Y.G.; Gao, L.M.; Niu, S.L.; Cui, H.X.; Ding, L. Gas Exchange, Photochemical Efficiency, and Leaf Water Potential in Three Salix Species. Photosynthetica 2003, 41, 393–398. [Google Scholar] [CrossRef]
  21. Bojarczuk, K.; Karolewski, P.; Oleksyn, J.; Kieliszewska-Rokicka, B.; Zytkowiak, R.; Tjoelker, M.G. Effect of Polluted Soil and Fertilisation on Growth and Physiology of Silver Birch (Betula pendula Roth.) Seedlings. Polish J. Environ. Stud. 2002, 11, 483–492. [Google Scholar]
  22. Hermle, S.; Vollenweider, P.; Günthardt-Goerg, M.S.; Mcquattie, C.J.; Matyssek, R. Leaf Responsiveness of Populus tremula and Salix viminalis to Soil Contaminated with Heavy Metals and Acidic Rainwater. Tree Physiol. 2007, 27, 1517–1531. [Google Scholar] [CrossRef] [PubMed] [Green Version]
  23. Han, G.; Cui, B.X.; Zhang, X.X.; Li, K.R. The Effects of Petroleum-Contaminated Soil on Photosynthesis of Amorpha fruticosa Seedlings. Int. J. Environ. Sci. Technol. 2016, 13, 2383–2392. [Google Scholar] [CrossRef] [Green Version]
  24. Horton, J.L.; Kolb, T.E.; Hart, S.C. Leaf Gas Exchange Characteristics Differ among Sonoran Desert Riparian Tree Species. Tree Physiol. 2001, 21, 233–241. [Google Scholar] [CrossRef] [Green Version]
  25. Zhu, G.F.; Li, X.; Su, Y.H.; Huang, C.L. Parameterization of a Coupled CO2 and H2O Gas Exchange Model at the Leaf Scale of Populus euphratica. Hydrol. Earth Syst. Sci. 2010, 14, 419–431. [Google Scholar] [CrossRef] [Green Version]
  26. Rood, S.B.; Nielsen, J.L.; Shenton, L.; Gill, K.M.; Letts, M.G. Effects of Flooding on Leaf Development, Transpiration, and Photosynthesis in Narrowleaf Cottonwood, a Willow-like Poplar. Photosynth. Res. 2010, 104, 31–39. [Google Scholar] [CrossRef]
  27. Andralojc, P.J.; Bencze, S.; Madgwick, P.J.; Philippe, H.; Powers, S.J.; Shield, I.; Karp, A.; Parry, M.A.J. Photosynthesis and Growth in Diverse Willow Genotypes. Food Energy Secur. 2014, 3, 69–85. [Google Scholar] [CrossRef]
  28. Talbot, R.J.; Etherington, J.R.; Bryant, J.A. Comparative Studies of Plant Growth and Distribution in Relation to Waterlogging. XII. Growth, Photosynthetic Capacity and Metal Ion Uptake in Salix Caprea and S. Cinerea Ssp. Oleifolia. New Phytol. 1987, 105, 563–574. [Google Scholar] [CrossRef]
  29. Johnson, J.D.; Tognetti, R.; Paris, P. Water Relations and Gas Exchange in Poplar and Willow under Water Stress and Elevated Atmospheric CO2. Physiol. Plant. 2002, 115, 93–100. [Google Scholar] [CrossRef]
  30. Aalto, T.; Juurola, E. Parametrization of a Biochemical CO2 Exchange Model for Birch (Betula pendula Roth.). Boreal Environ. Res. 2001, 6, 53–64. [Google Scholar]
  31. Oleksyn, J.; Żytkowiak, R.; Reich, P.B.; Tjoelker, M.G.; Karolewski, P. Ontogenetic Patterns of Leaf CO 2 Exchange, Morphology and Chemistry in Betula Pendula Trees. Trees Struct. Funct. 2000, 14, 271–281. [Google Scholar] [CrossRef]
  32. Hoshika, Y.; Watanabe, M.; Inada, N.; Mao, Q.; Koike, T. Photosynthetic Response of Early and Late Leaves of White Birch (Betula platyphylla Var. Japonica) Grown under Free-Air Ozone Exposure. Environ. Pollut. 2013, 182, 242–247. [Google Scholar] [CrossRef]
  33. Côté, B.; Carlson, R.W.; Dawson, J.O. Leaf Photosynthetic Characteristics of Seedlings of Actinorhizal Alnus Spp. and Elaeagnus Spp. Photosynth. Res. 1988, 16, 211–218. [Google Scholar] [CrossRef]
  34. Piper, F.I.; Cavieres, L.A. Gas Exchange of Juvenile and Mature Trees of Alnus jorullensis (Betulaceae) at Sites with Contrasting Humidity in the Venezuelan Andes. Ecol. Res. 2010, 25, 51–58. [Google Scholar] [CrossRef]
  35. Popa, A.; Popa, I. Caracteristici ale procesului de fotosinteză la aninul verde din Munții Călimani. Rev. Silvic. Cinegetică 2019, 44, 20–23. [Google Scholar]
  36. Gorea, D.; Hancu, G.; Rusu, A.; Cârje, A.; Barabás, E. Quality Assessment Indicators of Surface Waters and Soils in the Vicinity of the Former Sulfur Mine in the Călimani Mountains. Forum Geogr. 2014, XIII, 212–218. [Google Scholar] [CrossRef]
  37. Erzberger, P.; Höhn, M.; Pócs, T. Contribution to the Bryoflora of Călimani Mountains in the Eastern Carpathians, Romania, I. Acta Biol. Plant. Agriensis 2012, 2, 75–97. [Google Scholar]
  38. LI-COR. Using the LI-6800 Portable Photosynthesis System for Bluestem OSTM Version 1.3; Li-Cor Biosciences: Lincoln, NE, USA, 2018; Volume 1. [Google Scholar]
  39. Covshoff, S. Photosynthesis Methods and Protocols; Humana Press: Totowa, NJ, USA, 2018; Volume 1770. [Google Scholar] [CrossRef]
  40. Marozas, V.; Augustaitis, A.; Pivoras, A.; Baumgarten, M.; Mozgeris, G.; Sasnauskienė, J.; Dautartė, A.; Abraitienė, J.; Bičenkienė, S.; Mordas, G.; et al. Comparative Analyses of Gas Exchange Characteristics and Chlorophyll Fluorescence of Three Dominant Tree Species during the Vegetation Season in Hemi-Boreal Zone, Lithuania. J. Agric. Meteorol. 2019, 75, 3–12. [Google Scholar] [CrossRef] [Green Version]
  41. Terashima, I. Anatomy of Non-Uniform Leaf Photosynthesis. Photosynth. Res. 1992, 31, 195–212. [Google Scholar] [CrossRef] [PubMed]
  42. Farquhar, G.D.; von Caemmerer, S.; Berry, J.A. A Biochemical Model of Photosynthetic CO2 Assimilation in Leaves of C3 Species. Planta 1980, 149, 78–90. [Google Scholar] [CrossRef] [PubMed] [Green Version]
  43. Sharkey, T.D.; Bernacchi, C.J.; Farquhar, G.D.; Singsaas, E.L. Fitting Photosynthetic Carbon Dioxide Response Curves for C3 Leaves. Plant Cell Environ. 2007, 30, 1035–1040. [Google Scholar] [CrossRef] [PubMed]
  44. Yin, X.; Struik, P.C.; Romero, P.; Harbinson, J.; Evers, J.B.; Van Der Putten, P.E.L.; Vos, J. Using Combined Measurements of Gas Exchange and Chlorophyll Fluorescence to Estimate Parameters of a Biochemical C3 Photosynthesis Model: A Critical Appraisal and a New Integrated Approach Applied to Leaves in a Wheat (Triticum aestivum) Canopy. Plant Cell Environ. 2009, 32, 448–464. [Google Scholar] [CrossRef] [PubMed]
  45. Medlyn, B.E.; Dreyer, E.; Ellsworth, D.; Forstreuter, M.; Harley, P.C.; Kirschbaum, M.U.F.; Le Roux, X.; Montpied, P.; Strassemeyer, J.; Walcroft, A.; et al. Temperature Response of Parameters of a Biochemically Based Model of Photosynthesis. II. A Review of Experimental Data. Plant Cell Environ. 2002, 25, 1167–1179. [Google Scholar] [CrossRef] [Green Version]
  46. Bernacchi, C.J.; Singsaas, E.L.; Pimentel, C.; Portis, A.R.; Long, S.P. Improved Temperature Response Functions for Models of Rubisco-Limited Photosynthesis. Plant Cell Environ. 2001, 24, 253–259. [Google Scholar] [CrossRef]
  47. Duursma, R.A. Plantecophys—An R Package for Analysing and Modelling Leaf Gas Exchange Data. PLoS ONE 2015, 10, 1–13. [Google Scholar] [CrossRef] [PubMed]
  48. Dubois, J.J.B.; Fiscus, E.L.; Booker, F.L.; Flowers, M.D.; Reid, C.D. Optimizing the Statistical Estimation of the Parameters of the Farquhar-von Caemmerer-Berry Model of Photosynthesis. New Phytol. 2007, 176, 402–414. [Google Scholar] [CrossRef]
  49. Yin, X.; Struik, P.C. Theoretical Reconsiderations When Estimating the Mesophyll Conductance to CO2 Diffusion in Leaves of C3 Plants by Analysis of Combined Gas Exchange and Chlorophyll Fluorescence Measurements. Plant Cell Environ. 2009, 32, 1513–1524. [Google Scholar] [CrossRef] [PubMed]
  50. Moualeu-Ngangue, D.P.; Chen, T.W.; Stützel, H. A New Method to Estimate Photosynthetic Parameters through Net Assimilation Rate−intercellular Space CO2 Concentration (A−Ci) Curve and Chlorophyll Fluorescence Measurements. New Phytol. 2017, 213, 1543–1554. [Google Scholar] [CrossRef] [PubMed]
  51. Abdi, H.; Williams, L.J. Tukey’s Honestly Significant Difference (HSD) Test. Encycl. Res. Des. 2010, 3, 1–5. [Google Scholar]
  52. R Core Team. A Language and Environment for Statistical Computing; R Foundation for Statistical Computing: Vienna, Austria, 2019; Available online: https://www.R--project.org (accessed on 2 May 2021).
  53. Maurer, S.; Matyssek, R. Nutrition and the Ozone Sensitivity of Birch (Betula Pendula) II. Carbon Balance, Water-Use Efficiency and Nutritional Status of the Whole Plant. Trees Struct. Funct. 1997, 12, 11–20. [Google Scholar] [CrossRef]
  54. Xu, Z.; Hu, T.; Zhang, Y. Effects of Experimental Warming on Phenology, Growth and Gas Exchange of Treeline Birch (Betula utilis) Saplings, Eastern Tibetan Plateau, China. Eur. J. For. Res. 2012, 131, 811–819. [Google Scholar] [CrossRef]
  55. Hanson, D.T.; Stutz, S.S.; Boyer, J.S. Why Small Fluxes Matter: The Case and Approaches for Improving Measurements of Photosynthesis and (Photo)Respiration. J. Exp. Bot. 2016, 67, 3027–3039. [Google Scholar] [CrossRef] [PubMed] [Green Version]
  56. Collatz, G.J.; Ball, J.T.; Grivet, C.; Berry, J.A. Physiological and Environmental Regulation of Stomatal Conductance, Photosynthesis and Transpiration: A Model That Includes a Laminar Boundary Layer. Agric. For. Meteorol. 1991, 54, 107–136. [Google Scholar] [CrossRef]
  57. Kaluthota, S.; Pearce, D.W.; Evans, L.M.; Letts, M.G.; Whitham, T.G.; Rood, S.B. Higher Photosynthetic Capacity from Higher Latitude: Foliar Characteristics and Gas Exchange of Southern, Central and Northern Populations of Populus angustifolia. Tree Physiol. 2015, 35, 936–948. [Google Scholar] [CrossRef] [Green Version]
  58. Medrano, H.; Tomás, M.; Martorell, S.; Flexas, J.; Hernández, E.; Rosselló, J.; Pou, A.; Escalona, J.M.; Bota, J. From Leaf to Whole-Plant Water Use Efficiency (WUE) in Complex Canopies: Limitations of Leaf WUE as a Selection Target. Crop J. 2015, 3, 220–228. [Google Scholar] [CrossRef] [Green Version]
  59. Franks, P.J.; Adams, M.A.; Amthor, J.S.; Barbour, M.M.; Berry, J.A.; Ellsworth, D.S.; Farquhar, G.D.; Ghannoum, O.; Lloyd, J.; McDowell, N.; et al. Sensitivity of Plants to Changing Atmospheric CO2 Concentration: From the Geological Past to the next Century. New Phytol. 2013, 197, 1077–1094. [Google Scholar] [CrossRef] [PubMed]
  60. Alía, L.A.; Lüttschwager, D.; Ewald, D. Investigation of Gas Exchange and Biometric Parameters in Isogenic Lines of Poplar Differing in Ploidy. Silvae Genet. 2015, 64, 46–59. [Google Scholar] [CrossRef] [Green Version]
  61. Bühlmann, T.; Hiltbrunner, E.; Körner, C. Alnus Viridis Expansion Contributes to Excess Reactive Nitrogen Release, Reduces Biodiversity and Constrains Forest Succession in the Alps. Alp. Bot. 2014, 124, 187–191. [Google Scholar] [CrossRef] [Green Version]
  62. Koike, T. Autumn coloring, photosynthetic performance and leaf development of deciduous broad-leaved trees in relation to forest succession. Tree Physiol. 1990, 7, 21–32. [Google Scholar] [CrossRef] [PubMed]
  63. Manter, D.K.; Kerrigan, J. A/Ci Curve Analysis across a Range of Woody Plant Species: Influence of Regression Analysis Parameters and Mesophyll Conductance. J. Exp. Bot. 2004, 55, 2581–2588. [Google Scholar] [CrossRef] [PubMed] [Green Version]
  64. Qian, T.; Elings, A.; Dieleman, J.A.; Gort, G.; Marcelis, L.F.M. Estimation of Photosynthesis Parameters for a Modified Farquhar-von Caemmerer-Berry Model Using Simultaneous Estimation Method and Nonlinear Mixed Effects Model. Environ. Exp. Bot. 2012, 82, 66–73. [Google Scholar] [CrossRef]
  65. Farquhar, G.D.; Von Caemmerer, S.; Berry, J.A. Models of Photosynthesis. Plant Physiol. 2001, 125, 42–45. [Google Scholar] [CrossRef] [PubMed] [Green Version]
  66. Miao, Z.; Xu, M.; Lathrop, R.G.; Wang, Y. Comparison of the A-Cc Curve Fitting Methods in Determining Maximum Ribulose 1·5-Bisphosphate Carboxylase/Oxygenase Carboxylation Rate, Potential Light Saturated Electron Transport Rate and Leaf Dark Respiration. Plant Cell Environ. 2009, 32, 109–122. [Google Scholar] [CrossRef] [PubMed]
  67. Rostamza, M.; McNickle, G.G. A Global Database of Photosynthesis Model Parameters, and Phylogenetically Controlled Analysis of Photosynthetic Responses from Every Major Terrestrial Plant Clade. bioRxiv 2020. [Google Scholar] [CrossRef]
Figure 1. Air temperature (a) and soil water content (b) variation during the 2019 growing season (vertical lines represent measurements dates).
Forests 12 00658 g001
Figure 2. Variability in photosynthetic parameters during the 2019 growing season for deciduous pioneer species on a tailing dump in the Călimani Mountains. (a) Net assimilation rate, (b) stomatal conductance, (c) transpiration rate, (d) intrinsic water use efficiency, (e) instantaneous carboxylation efficiency, (f) water use efficiency (points are mean values, and whiskers represent standard errors).
Forests 12 00658 g002
Figure 3. (a) Mean response curve of net assimilation relative to intercellular CO2 concentration as modelled by the FvCB model; (b) water use efficiency relative to intercellular CO2 concentration (shaded areas represent standard error).
Forests 12 00658 g003
Figure 4. Mean values of FvCB model parameters for deciduous pioneer species on tailings dumps in the Călimani Mountains: (a) Vcmax—maximum rate of Rubisco activity; (b) Jmax—maximum rate of electron transport for RuPB-regeneration (whiskers represent standard errors, and letters represent significant differences).
Forests 12 00658 g004
Table 1. Mean values (± standard deviation) of photosynthetic parameters for the 2019 growing season, at 400 µmol·mol−1 CO2 concentration and 1000 µmol·m−2·s−1 PPFD. Significant differences are shown using letters following the Tukey test (p < 0.05).
ParametersGreen AlderBirchAspenGoat Willow
A (μmol CO2·m−2·s−1)17.35 ± 3.62 a16.62 ± 2.47 ab14.43 ± 2.93 bc13.31 ± 4.97 c
E (mmol H2O·m−2·s−1)2.6 ± 0.78 a3.44 ± 0.94 b2.94 ± 1.16 ab2.75 ± 1.34 ab
gsw (mol H2O·m−2·s−1)0.24 ± 0.10 a0.31 ± 0.08 a0.27 ± 0.10 a0.25 ± 0.12 a
Ci (µmol·mol−1)240.76 ± 26.07 a278.21 ± 13.61 b272.36 ± 29.13 b274.16 ± 24.30 b
A/Ci (μmol CO2·m−2·s−1/µmol·mol−1)0.07 ± 0.01 a0.06 ± 0.01 b0.05 ± 0.01 bc0.05 ± 0.02 c
WUE (μmol CO2·m−2·s−1/mmol H2O·m−2·s−1)6.92 ± 1.08 a5.07 ± 1.09 b5.63 ± 2.07 b5.49 ± 1.78 b
iWUE (µmol·mol−1)78.05 ± 18.91 a54.92 ± 8.85 b60.93 ± 20.73 b60.9 ± 18.41 b
Table 2. Pearson correlation coefficients for relationships between gas exchange parameters (A–net photosynthetic rate, E–transpiration rate, gsw–stomatal conductance, Ci–intercellular CO2 concentration).
ParametersEgswCi
Green alder
A0.80 **0.87 **0.73 **
E 0.88 **0.84 **
gsw 0.93 **
Birch
A0.74 **0.77 **−0.13
E 0.94 **0.46 *
gsw 0.52 **
Aspen
A0.84 **0.84 **0.66 **
E 0.96 **0.82 **
gsw 0.87 **
Goat willow
A0.93 **0.94 **0.45 *
E 0.97 **0.66 **
gsw 0.67 **
** Significance at p < 0.01; * Significance at p < 0.05.
Publisher’s Note: MDPI stays neutral with regard to jurisdictional claims in published maps and institutional affiliations.

