Article

Niche Selection by Soil Bacterial Community of Disturbed Subalpine Forests in Western Sichuan

1
Institute of Mountain Hazard and Environment, Chinese Academy of Sciences, Chengdu 610041, China
2
University of Chinese Academy of Sciences, Beijing 100049, China
3
Key Laboratory of Urban Environment and Health, Institute of Urban Environment, Chinese Academy of Sciences, Xiamen 361021, China
4
School of Marine Sciences, Ningbo University, Ningbo 315211, China
*
Authors to whom correspondence should be addressed.
Forests 2021, 12(4), 505; https://doi.org/10.3390/f12040505
Submission received: 12 March 2021 / Revised: 1 April 2021 / Accepted: 12 April 2021 / Published: 17 April 2021
(This article belongs to the Section Forest Ecology and Management)

Abstract

:
Soil bacterial microbial communities are important in the ecosystem function and succession of forests. Using high-throughput 16S rRNA gene sequencing and relative importance for linear regression, we explored how the structures of soil bacterial community were influenced by the environmental factors and restoration succession of secondary forests in the Miyaluo Mountains of western Sichuan, China. Using a space-for-time approach, field measurements and sampling were conducted in four stands at different stages of natural restoration. Results of distance-based multivariate analysis showed that soil pH, organic carbon, available phosphorus, and C/N ratio were the predominant environmental factors that collectively explained a 46.9% variation in the bacterial community structures. The community compositions were jointly controlled by the direct and indirect effects of the rehabilitation stages. The changes in soil environmental factors coincided with restoration succession could lead to the shifts in the relative abundance of different soil bacterial taxa. We screened 13 successional discriminant taxa that could quantitatively indicate the secondary succession subalpine stage. Collectively, our findings show that soil bacteria in different taxa are governed by different local soil variables and rehabilitation ages, which can lead to shifts in the relative abundance of different taxa in successional stages, ultimately changing the entire soil bacterial community with the succession of secondary forest.

1. Introduction

Secondary forests formed by restoration succession after large-scale destruction (clear-cutting) have become one of the most important components of the terrestrial ecosystem, which provide many ecological services, including terrestrial vegetation and rehabilitation refugia for species diversity [1]. A classic secondary succession is from a shrub-grassland to broad-leaved forest, finally resembling a coniferous forest [2]. During this process, soil conditions and environmental resources begin to improve and gradually recover to the state of primary forest. The change in surface vegetation leads to different types of litter, which change the soil organic matter composition from simple to complex [3]. Soil microorganisms are important for regulating biogeochemical cycles, maintaining ecosystem functions, and predicting the functions of an alpine ecosystem. The alpine ecosystem is one of the most important components of the terrestrial system [4,5,6]. Previous studies have mainly focused on the effects of land use types and geographical differences on soil microorganisms [4,7,8]. There are few studies that have investigated the temporal patterns of soil microorganisms on the time scale of secondary succession, and there is still controversy on the main effect factor in the bacterial community assembly, i.e., soil pH is considered to be one of the key factors in determining soil microbial community composition in the Changbai Mountain area. On the contrary, soil microbial community structure is strongly influenced by water, SOC in the Qinling Mountains area, and the variation in the bacterial community assembly is driven more by soil carbon concentration than soil pH in the Miyaluo area in Sichuan. [9,10,11]. As such, more detailed data are needed to provide descriptive information about the distribution of soil microbial community and the influence of related factors. Additional studies of microbial recovery patterns and the influence of related factors along a timescale of secondary succession are necessary to further understand other underlying mechanisms.
The restoration patterns of bacterial community structures may coincide with changes in soil nutrients and aboveground plant communities [8,12,13,14]. This is accordant with the restoration ecology hypothesis that the recovery after a disturbance will proceed toward a primary, unperturbed state. Consistently, there is evidence that soil nutrients and vegetation communities become more similar with these in the natural forest ecosystem along restoration stages [15,16,17]. To a certain extent, when the environmental conditions were restored, the recovery of restricted species could be promoted due to the emergence of new ecological niches [18,19,20]. Similarly, previous studies have shown that the classification of restoration stages includes a shrub-grassland stage and a broad-leaved forest stage, but lacks a mixed forest stage, which generally has high vegetative species diversity, more litter species composition, and relatively complex soil organic matter [9,21]. These factors may lead to the increase in microbial variability during this stage, which may eventually affect the overall time lag for reaching the original state. Thus, whether this restoration model also holds true for microbial communities in subalpine areas requires further verification.
To clarify how soil bacterial communities respond to secondary succession in subalpine secondary forests, it is necessary to investigate the internal relationship among soil bacterial taxa and soil factors. The classification and composition of soil bacteria are closely related to soil factors, which include a variety of abiotic parameters (e.g., soil pH, carbon and nitrogen content) [22]. The change of these factors may form new niches, which will affect the soil bacterial community structures [7]. Although some studies have reported the change of soil microbial community structure in a secondary forest over time, these studies only investigated the variation in bacterial composition by clustering nucleotide sequences based on sequence similarity and the soil factors that affect the bacterial composition [9,23,24]. However, the environmental driving mechanisms of bacterial community composition are still unclear and our knowledge to explain microbial distribution and function is very limited. The changes of environmental factors caused by a niche may directly or indirectly affect the bacterial community structure [4,25]. The variations in soil bacterial community structure in response to secondary succession may be caused by the direct influence of soil factors on particular taxa. Quantitative analysis of the relationship between soil factors and soil microorganisms will therefore be helpful to understand the relationship between microorganisms and geochemical processes, and particularly the process of secondary forest restoration in subalpine secondary forest ecosystems.
Different restoration stages of secondary forests caused by large-scale destruction (clear-cutting) provide an ideal opportunity to evaluate the predictive influence of soil bacterial communities on environmental changes. DNA coding information can be used to quantitatively describe an environment owing to the rapid responses of microorganisms to changing conditions and their wide distribution [26,27]. This is based on the ecological hypothesis that ecological forces predictably restrict or promote the growth of characteristic taxa in accordance with environmental conditions [28]. Previous studies have assessed environmental conditions by integrating information collected from local bacterial communities, revealing the status of the secondary forest [29,30]. Different restoration stages of secondary forest caused by large-scale destruction (clear-cutting) provide ideal opportunities to evaluate the predictive power of the influence of soil bacterial communities on environmental changes. We therefore used this information in the present study to determine the degree of restoration of a secondary forest to address an important gap present in succession stage in secondary forests, especially in the subalpine areas of western Sichuan. The secondary forest in this area has become one of the main forest ecosystems in southwestern China [31].
The subalpine forest area of western Sichuan is located on the eastern Tibetan Plateau, where long-term and large-scale exploitation occurred from the middle to the end of the twentieth century [31]. Due to the different cutting times, a series of secondary forests with different restoration stages were formed via natural regeneration, which comprised the shrub-grassland (SG) (0–20 a), broad-leaved forest (BF) (20–50 a), mixed coniferous and broad-leaved forest (MF) (50–80 a), and dark coniferous forest (PF) [9,32,33,34]. Restoration succession will affect the soil bacterial community structure; however, there is little discussion on how soil bacterial community structures respond to the succession of a secondary forest and soil environment, especially for specific soil bacterial taxa. The subalpine forest area of western Sichuan is an ideal place to investigate how the structures of the soil bacterial community respond to the restoration succession of a subalpine secondary forest. We thus selected four representative stages of successive forest ages. Using multiple statistical methods, we addressed the following research questions: (1) Given the significant changes in soil properties, do the structures of the soil bacterial community also substantially change and restore; (2) Which factors determine soil bacterial niche separation in disturbed subalpine forests, and; (3) Can some biological indicators quantitatively predict the degree of succession for a secondary forest? There is evidence that the abundance of some bacterial groups is sensitive to the succession level of a secondary forest [35]. In these cases, we used the random forest model to identify the bacterial taxa featured in these successional stages and obtain independent variables to diagnose the restoration succession stage. We used multiple linear regressions to quantify the relative importance of the restoration stage and soil factors in governing the soil bacterial community structure. The partial least squares path model (PLS-PM) was also used to evaluate the interaction between the restoration stage and environmental factors on the soil bacterial structure.

2. Materials and Methods

2.1. Sample Sites and Soil Sampling

The study was conducted in the Miyaluo Forest Reserve in Lixian county (102°41′–102°4′ E, 31°42′–31°51′ N), Sichuan Province, China. This region belongs to the transition zone between the Tibetan Plateau and Sichuan Basin, with an elevation ranging from 2200–5500 m [36] and a montane, monsoon climate with an annual mean temperature of 6–10 °C. The annual precipitation ranges from 600 to 1100 mm [37]. The soils were categorized as brown soil series according to Chinese soil taxonomy [9].
We located four typical succession stages from different logging periods on the same slope in a gully, which helped to minimize impacts of macroclimate and soil texture on the microbial composition. Soil samples were collected in July (growth period) 2018 from the four adjacent vegetation types, including shrub-grassland (SG), broad-leaved forest (BF), coniferous and broad-leaved forest (MF), and primary forest (PF) (as control) (Table S1). The restoration age data from each stage were provided by the local forestry bureau (Forest Protection Bureau of West Sichuan in Aba Prefecture). Among them, PF is the virgin forest without destruction. The age of the primary forest is based on the earliest records available, and its real age may be older. This study was conducted on four succession stages, namely SG, BF, MF, and PF. Each treatment had 8 plots, each of which was a square area of 20 m × 20 m, and the distance between the adjacent plots was about 100–200 m, resulting in eight repetitions for each succession stage. A straight line was randomly drawn through the center point in each square area of 20 m × 20 m to make 6–8 points (the distance between each point was about 2–3 m). The Topsoil cores (0–10 cm) were obtained from the 6 to 8 points in each plot, which were mixed as a biological sample. The samples for chemical analysis and DNA extraction were evenly mixed into a pot and divided into two parts for determination. In total, 32 soil samples (four stages with eight biological samples for each stage) were used in this study. The samples were kept on ice until their arrival in the laboratory (6–8 h), then stored at −20 °C for the determination of the soil physical and chemical properties and DNA extraction (7 days).

2.2. Soil Physiochemical Properties

Soil pH and electrical conductivity (EC) were determined via soil suspension using a pH meter (soil: water ratio of 1:2.5 w/v). Soil organic carbon (SOC) was determined by dichromate oxidation [38]. Total nitrogen (TN) was detected by a CNS Element Analyzer (vario MAX C/N, Elemental, Germany). Soil ammonium (NH4+-N) and nitrate (NO3-N) concentrations were extracted from 1 M potassium chloride and measured using the indophenol blue colorimetric method. Ultraviolet spectrophotometry was used to determine the soil total phosphorus (TP) and the available phosphorus (AP) was extracted from the sodium bicarbonate and measured following the procedure by Olsen et al. [39]. The soil total potassium (TK) and available potassium (AK) were determined by atomic absorption spectrophotometry [14].

2.3. DNA Extraction and Sequencing of Soil Bacteria

Soil DNA was extracted by using the FastDNA® Spin kit for soil (Bio 101, Carlsbad, CA, USA) following the manufacturer’s instructions. The extracted soil DNA was quantified using a spectrophotometer. The V4–V5 hypervariable regions of the bacterial 16S rRNA gene were amplified using the primer pair 515f (GTGCCAGCMGCCGCGG) and 907r (CCGTCAATTCMTTTRAGTTT) with six barcodes. A PCR fragment kit (TaKaRa Biotech) was used to purify and pool the PCR products in each sample. Purified samples were sent to Meige (Guangzhou, China) for MiSeq sequence runs (Illumina, San Diego, CA, USA).

2.4. Data Preprocessing

The Illumina sequencing data were analyzed with the Quantitative Insights Into Microbial Ecology (QIIME v1.9.1) platform [40]. The sequences had no primer mismatch and maintained a sequencing length > 250 bp and quality score > 25. The bacterial phylotypes were identified using search [41] and binned into operational taxonomic units (OTUs) based on a 97% sequence identity. The most abundant sequence in the OTU was considered as a representative sequence, which was aligned using UPARSE [42]. The Ribosomal Database Project (RDP) (Silva 138 database) Classifier was used to determine the taxonomic identity of each phylotype [43]. The sequence data are available in the BIG Data Center, CAS under code CRA003745 (http://bigd.big.ac.cn/gsa).

2.5. Statistical Analysis

The Bray–Curtis distance were used to calculate the β diversity, demonstrated by Principal Coordinates Analysis (PCoA) using the vegan package in R (R v3.5.3) [44]. The analysis of similarity (ANOSIM) based on Bray–Curtis distance were performed to evaluate the overall differences in the soil bacterial communities [45]. Phylogenetic dissimilarities in the bacterial communities among the different typical succession stages were analyzed by PERMANOVA (vegan package, R v3.5.3) (The homogeneity of centroid variance is checked) [46]. The Mantel test with Pearson’s correlation analysis was used to assess the relationships between the environmental variables and bacterial community structure (vegan package, R v3.5.3). Two methods were used to determine the effects of soil factors and restoration years on microbial community composition: Redundancy analysis (RDA) using the R Vegan package and distance-based multivariate analysis for a linear model (DISTLM) based on Bray–Curtis distances using the DISTLM_forward3 program [47,48]. The relative importance of the predictors and explained variation were assessed by a linear model using the relaimpo package in R v3.5.3 [49]. PLS-PM is particularly useful for demonstrating cause and effect relationships among the observed and latent variables, and was used to explore the relationships between soil physicochemical properties, bacterial communities, and rehabilitation stages. The estimates of path coefficients and the coefficients of determination (R2) were validated by R (R 3.5.3) with the plspm package (1000 bootstraps) [50]. The fit of model was evaluated by the Goodnessof-Fit (GoF) statistic. To screen the rehabilitation age-discriminatory taxa (OTUs level), the relative abundances of OTUs were matched with their corresponding rehabilitation age using the ‘randomForest’ package [51]. The degree of secondary succession was stratified using the profiles of the rehabilitation age-discriminatory taxa and rehabilitation age coefficients as independent variables.

3. Results

3.1. Soil Properties of Disturbed Subalpine Forests

Soil physiochemical properties were systematically measured in all samples collected from the four typical secondary succession stages (Table 1). Among the measured soil variables, soil pH gradually decreased from 6.16 in shrubs to 4.76 in primary forest and significantly differed between the SG, BF, MF, and PF stages (one-way ANOVA, p < 0.001). The soil SOC, TN, and C/N ratio during the MF stage were significantly different from the other stages (one-way ANOVA, p < 0.001), and the AP was significantly higher during the PF stage (one-way ANOVA, p < 0.001). The soil AK in the SG stage was significantly lower than that in other stages (one-way ANOVA, p < 0.001). The soil TN, SOC, and AP successively increased, but decreased during the MF stage. The soil EC, TP, and TK also followed this trend, but decreased in the PF stage. These results indicate that the restoration succession of secondary forests significantly affects soil properties.

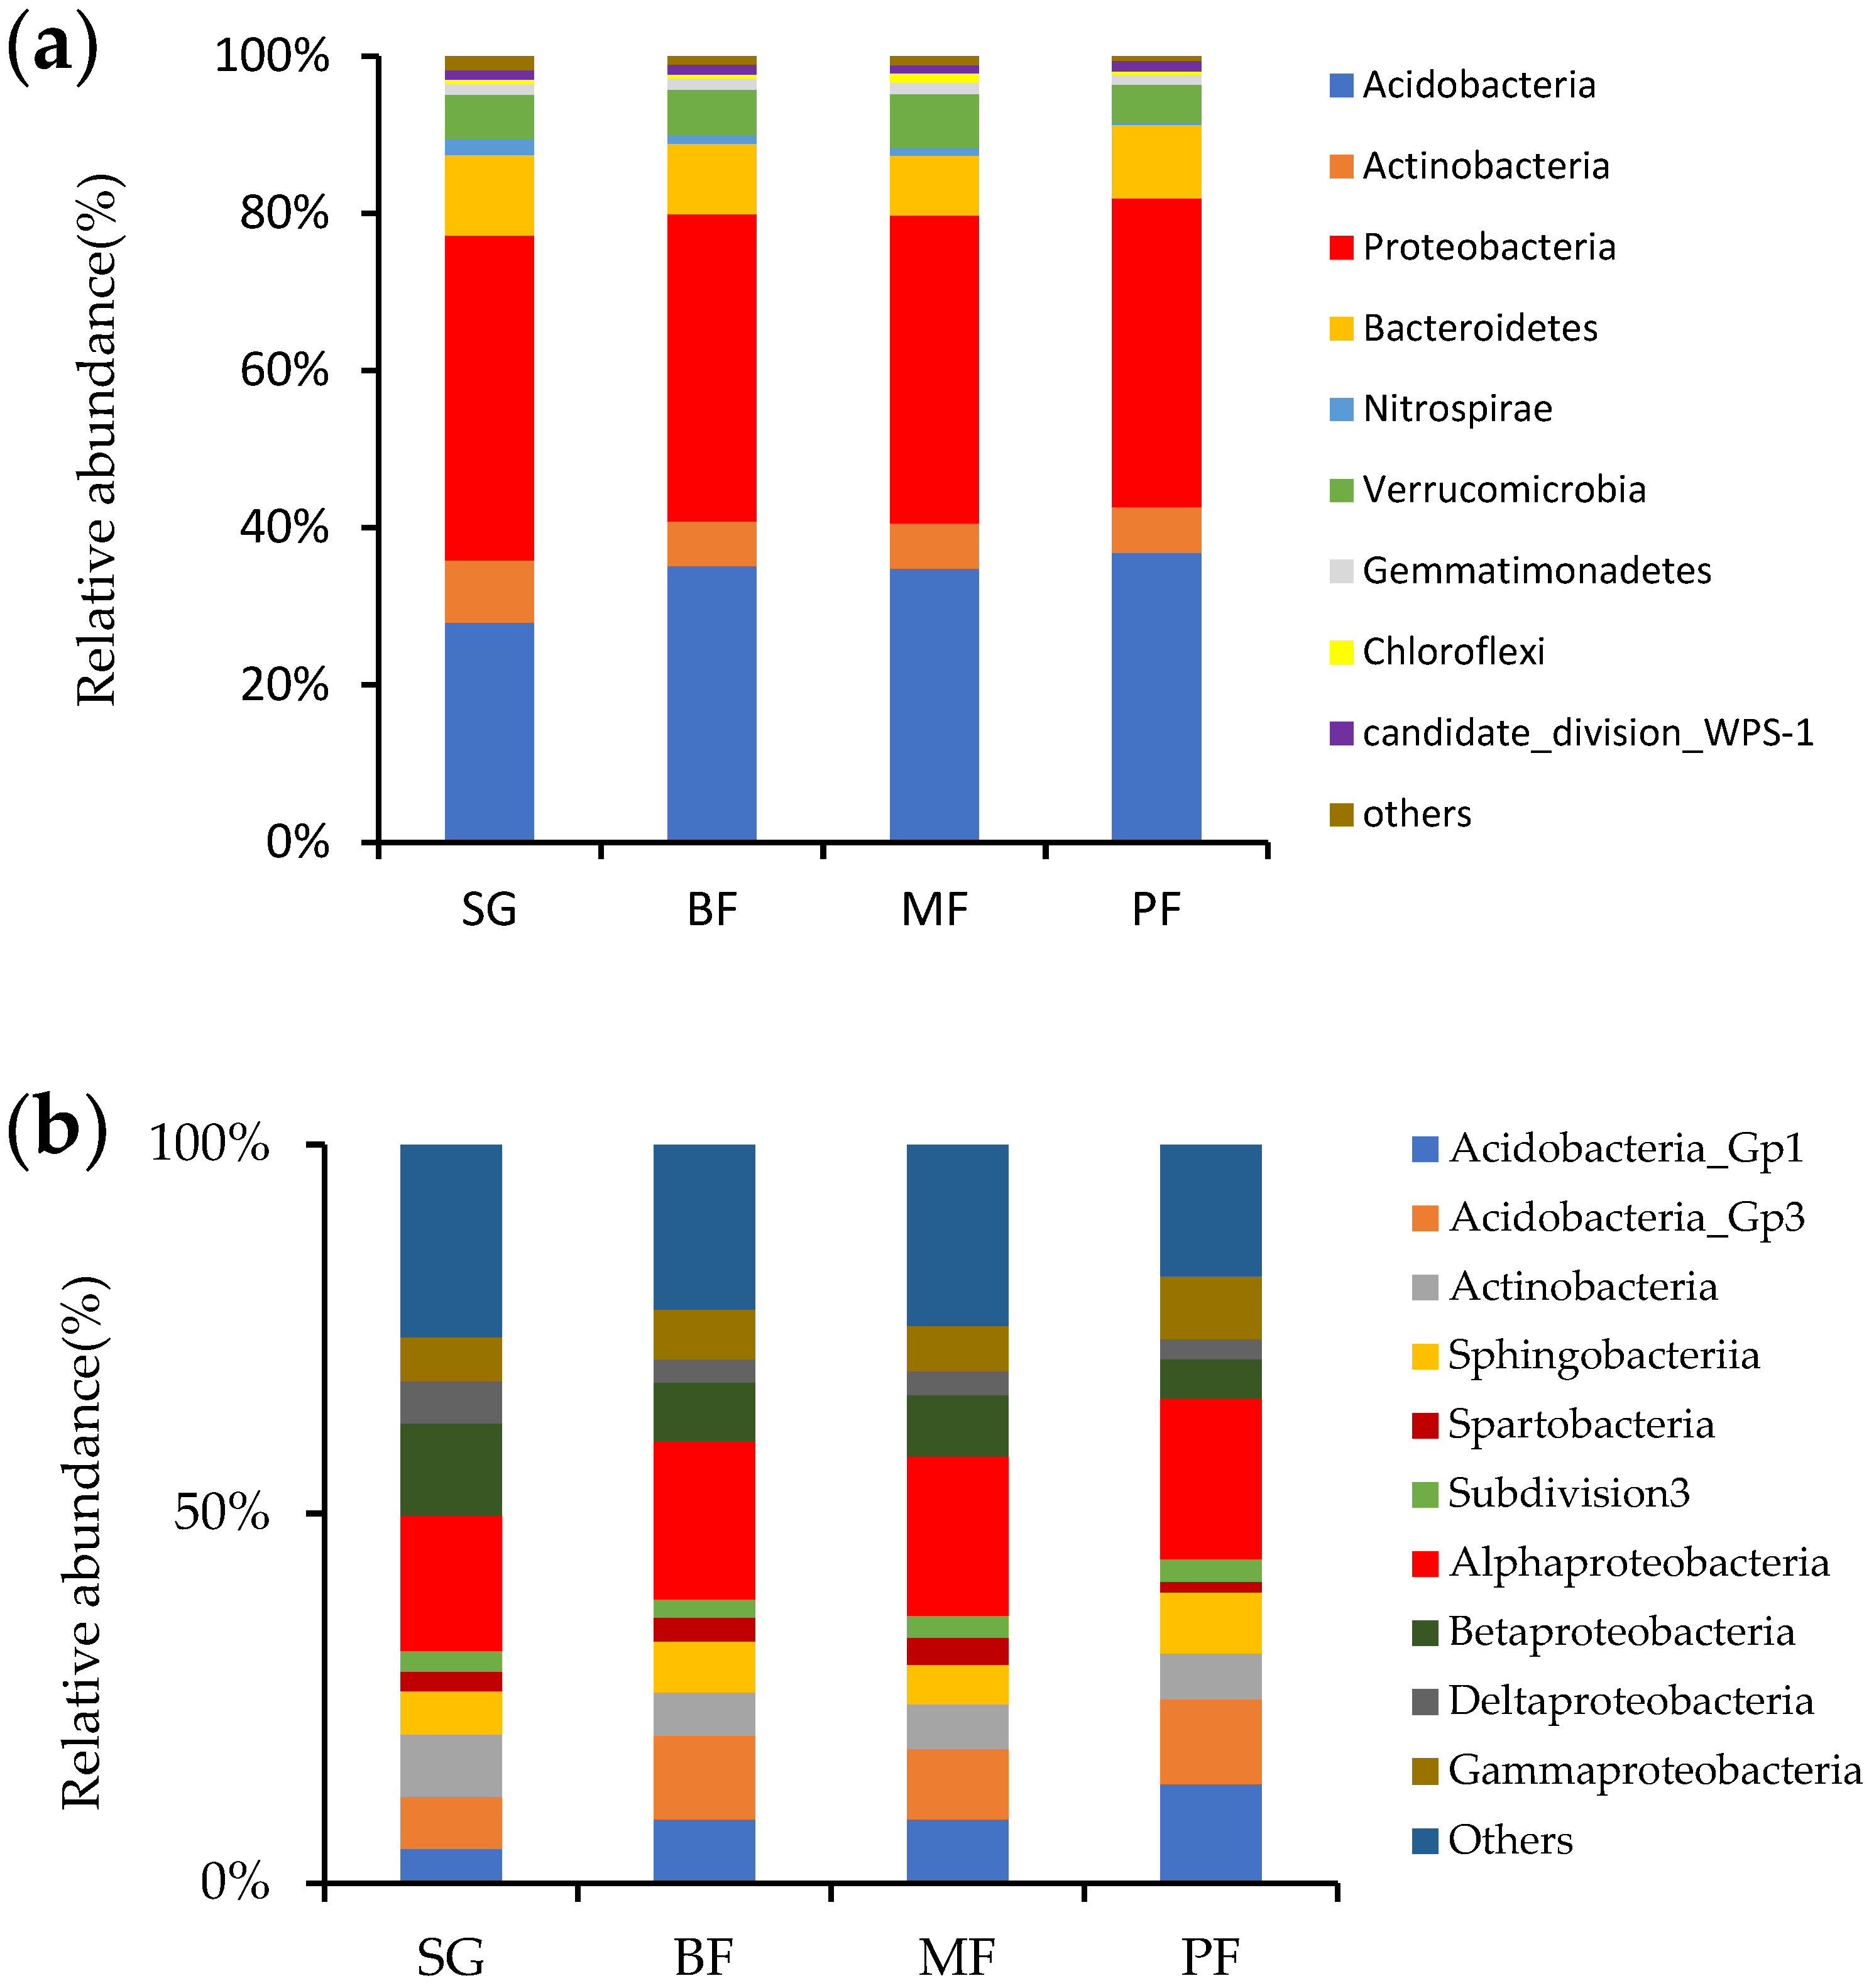
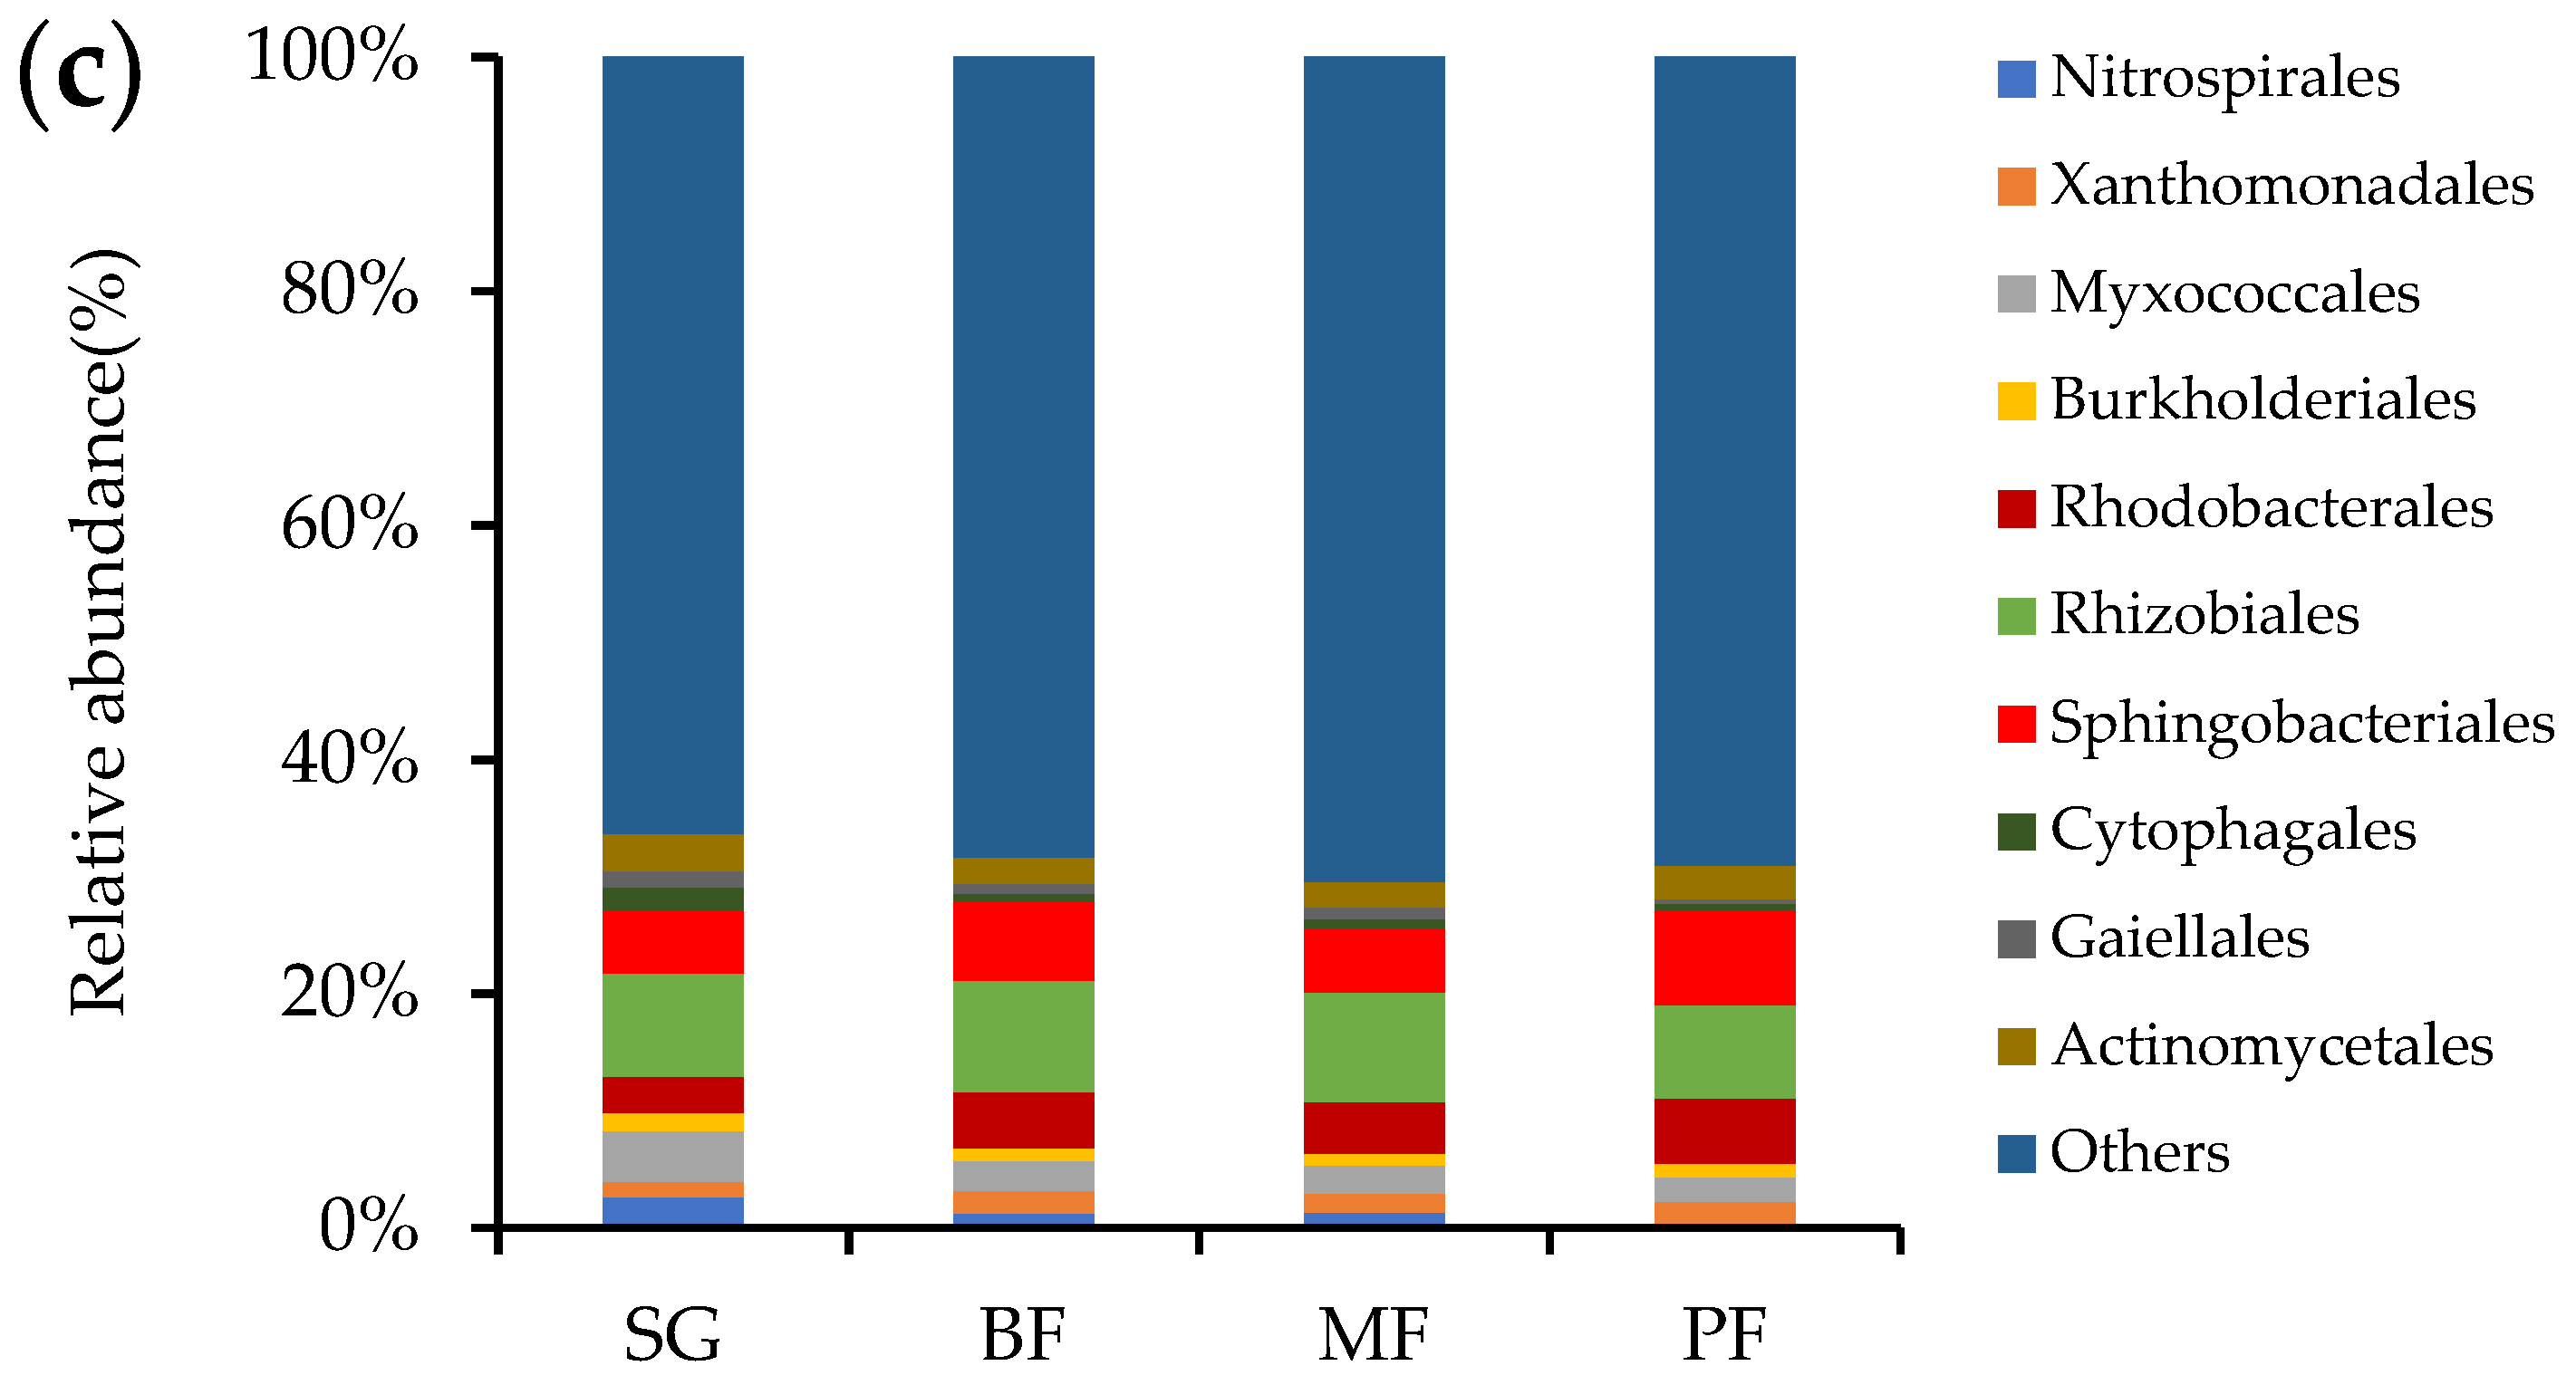
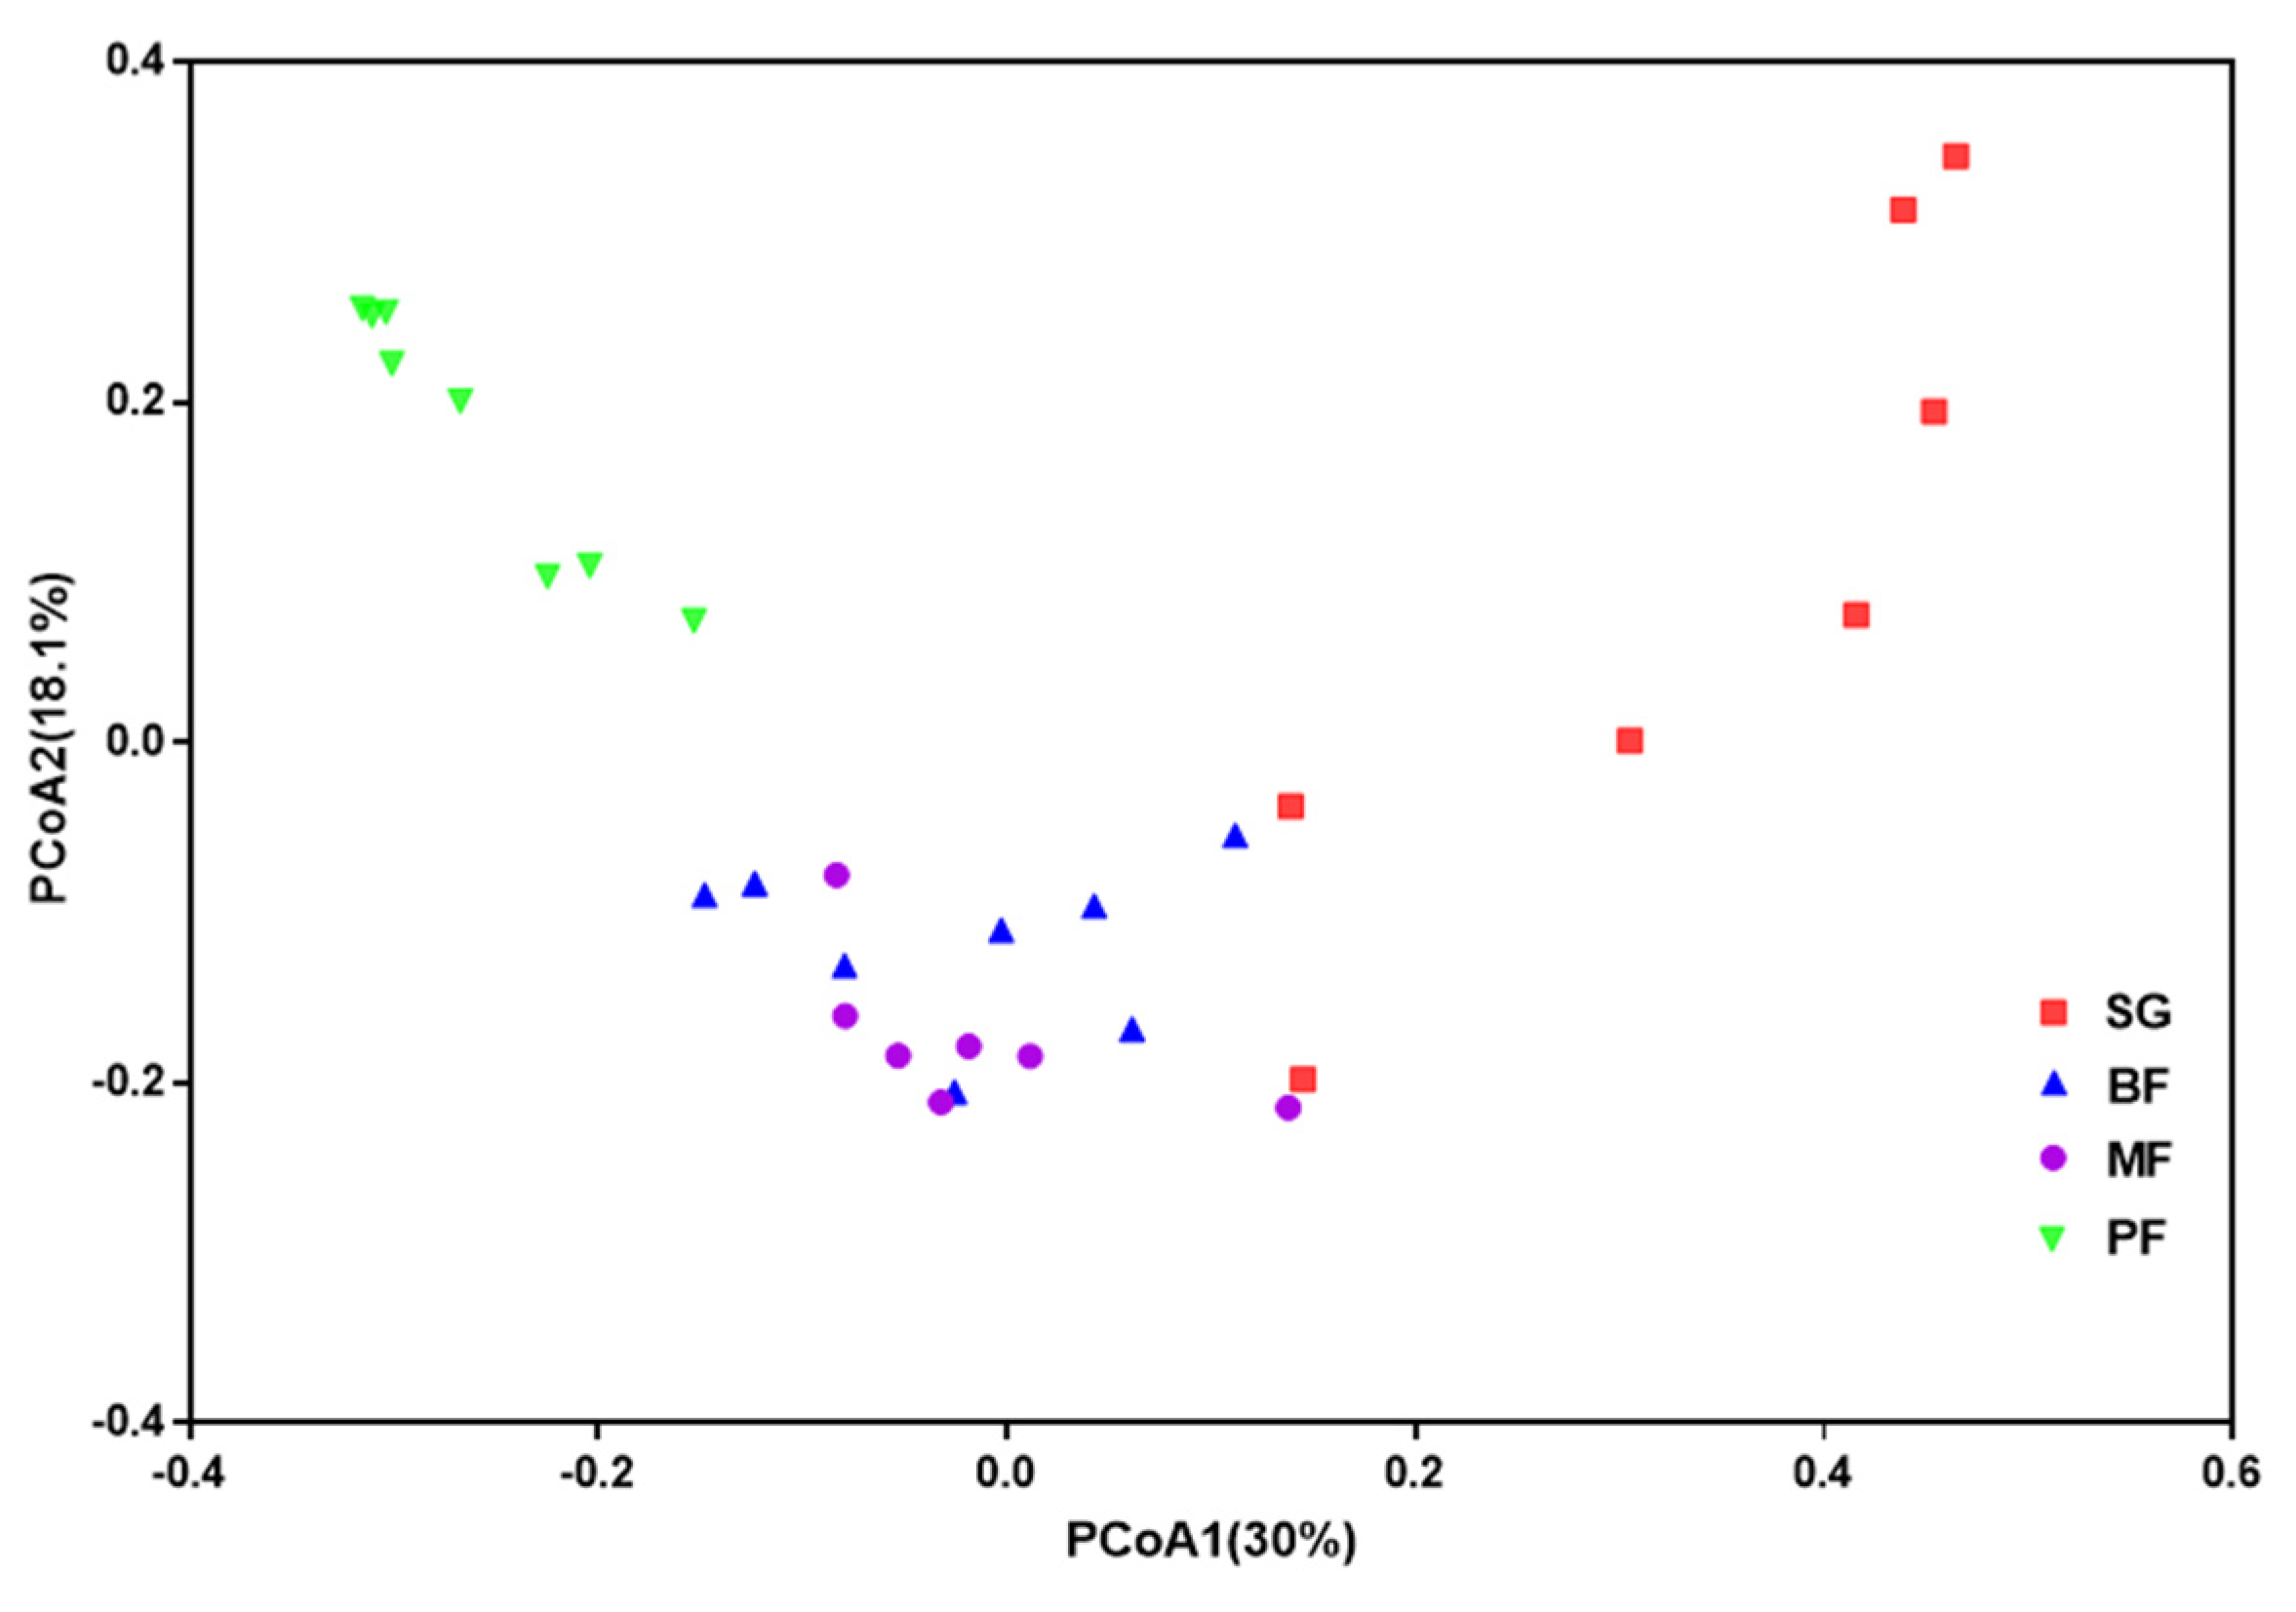
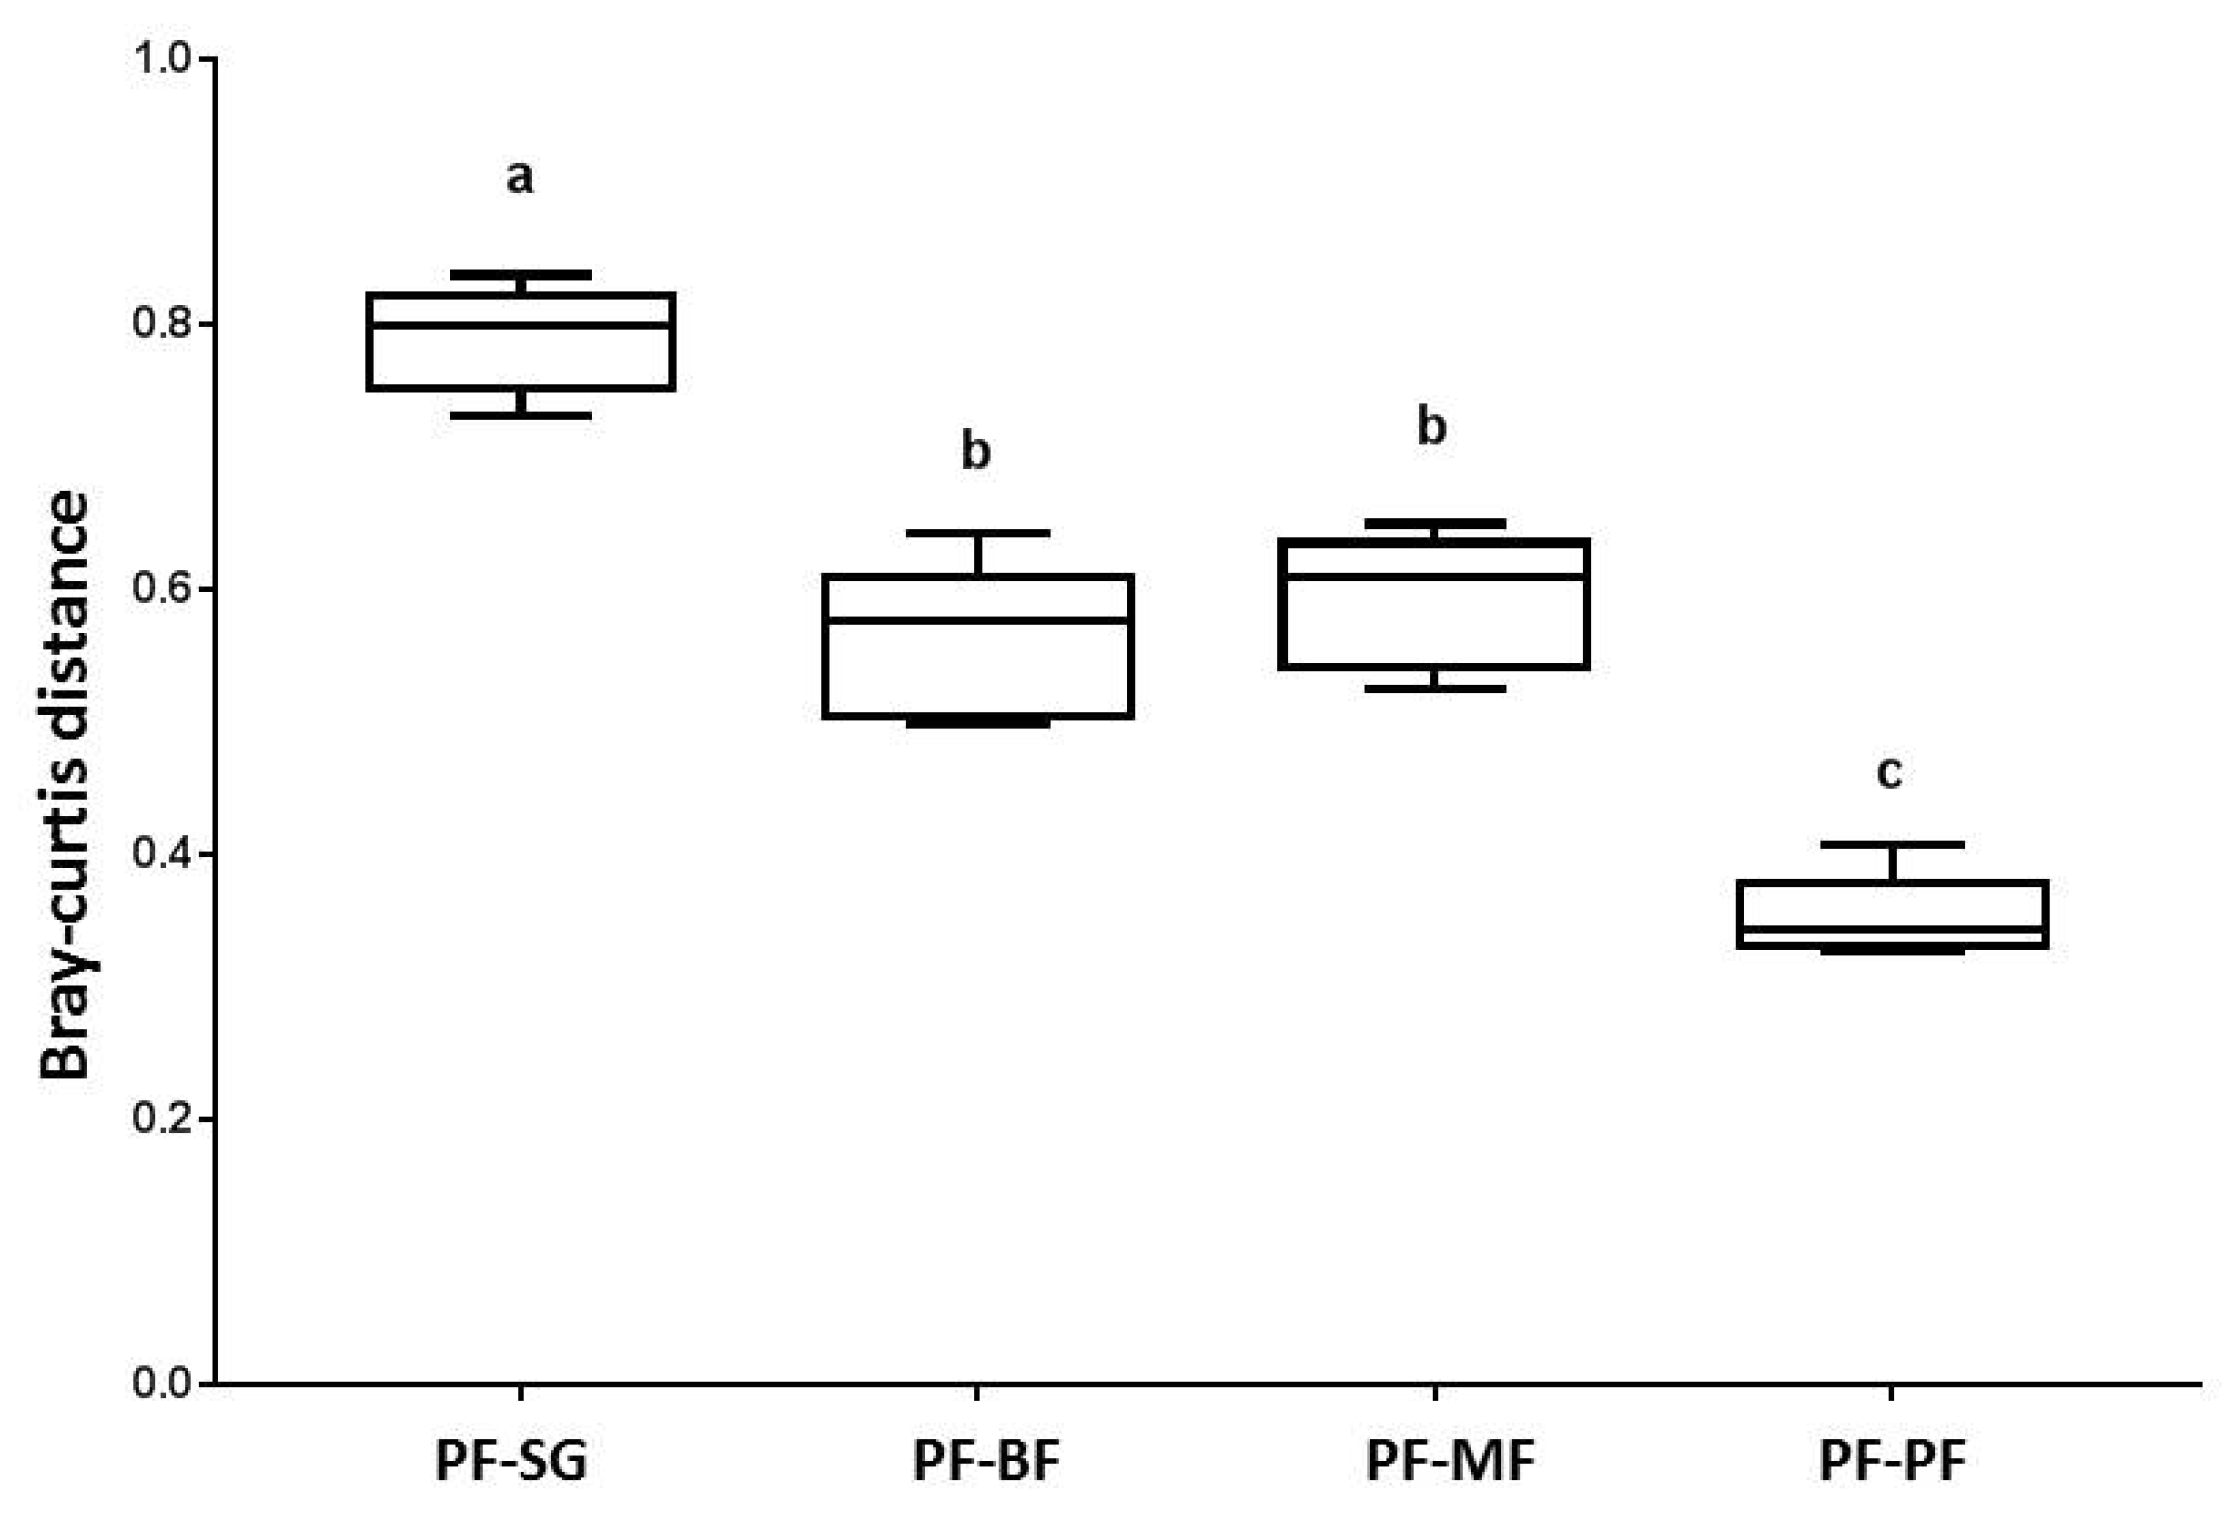
3.2. Bacterial Community Structure and Bray-Curtis Similarity

In all of the samples, Proteobacteria was the most abundant phylum, accounting for 38.0–42.1% of the total sequences. Acidobacteria was the second most dominant phylum with a relative abundance of 26.4–36.7%. Bacteroidetes, Actinobacteria, and Verrucomicrobia accounted for 7.7–10.29%, 5.3–8.22%, and 4.85–7.12%, respectively. Nitrospirae, Gemmatimonadetes, Chloroflexi, and Candidate_division_WPS-1 were also identified at relatively low abundances (mean relative abundance <3%) (Figure 1a, Table S2). Acidobacteria and Actinobacteria in the SG stage were significantly different from those in the other stages. In the BF stage, the dominant phyla (Acidobacteria and Actinobacteria) in the secondary forest returned to a similar level to that of the intact PF. Chloroflexi in the MF stage significantly differed from the others and Bacteroidetes and Verrucomicrobia were significantly different between the MF and PF stages. In the MF stage, these similar level phyla (Chloroflexi, Bacteroidetes, and Verrucomicrobia) deviated from that of the original forest. The abundance of Nitrospirae significantly decreased in the rehabilitation stage. Alphaproteobacteria, Betaproteobacteria, and Acidobacteria_Gp3 were the most abundant classes in all of the rehabilitation stages (Figure 1b, Table S3) and Rhizobiales, Sphingobacteriales, and Rhodobacterales were the most abundant orders (Figure 1c, Table S4). The relative abundances of Acidobacteria_Gp3, Acidobacteria_Gp1, and Rhodobacterales during the PF stage were significantly higher than those in the other stages. The relative abundances of Betaproteobacteria, Nitrospirales, and Gaiellales were the highest during the SG stages. There was no significant difference in Alphaproteobacteria and Rhizobiales abundance in the different stages. These results show that the bacterial community structures will gradually recover with the succession of restoration, but the recovery direction of the bacteria differs, especially in the true broad-leaved mixed forest stage.
The PCoA biplot (Figure 2) shows that the bacterial communities clustered according to the different rehabilitation stages, with the exception being between the BF and MF (Figure 2). This suggests that the site differences in bacterial community structure within the same rehabilitation stage were less, relative to differences between different rehabilitation stages. This pattern was further corroborated by an analysis of similarity (ANOSIM), revealing that the soil bacterial significantly (p < 0.05) differed between any two of compared stages, with the exception of between BF and MF (p = 0.066) (Table 2). The PERMANOVA results also revealed significant differences among the bacterial communities at different rehabilitation stages (R2 = 0.422, p < 0.001). The successional stages had a significant effect on the overall bacterial community structures, which accounted for a 48.1% variation in the bacterial communities (Figure 2).
To further elucidate the degree of recovery of bacterial communities along the four successional stages, we compared the distances of the soils’ bacterial community between the PF, SG, BF, and MF stages. The averaged Bray–Curtis distance within PF was 0.36. The averaged Bray--Curtis distances between the PF and SG, BF, and MF were 0.79, 0.57 and 0.59, respectively (Figure 3). This suggested a trend of increasing similarity of the soil bacterial communities from the SG to the BF compared with the intact PF (p < 0.001). However, the differences of average Bray–Curtis distance in soil bacterial community between PF and MF was indistinguishable to that between PF and BF.

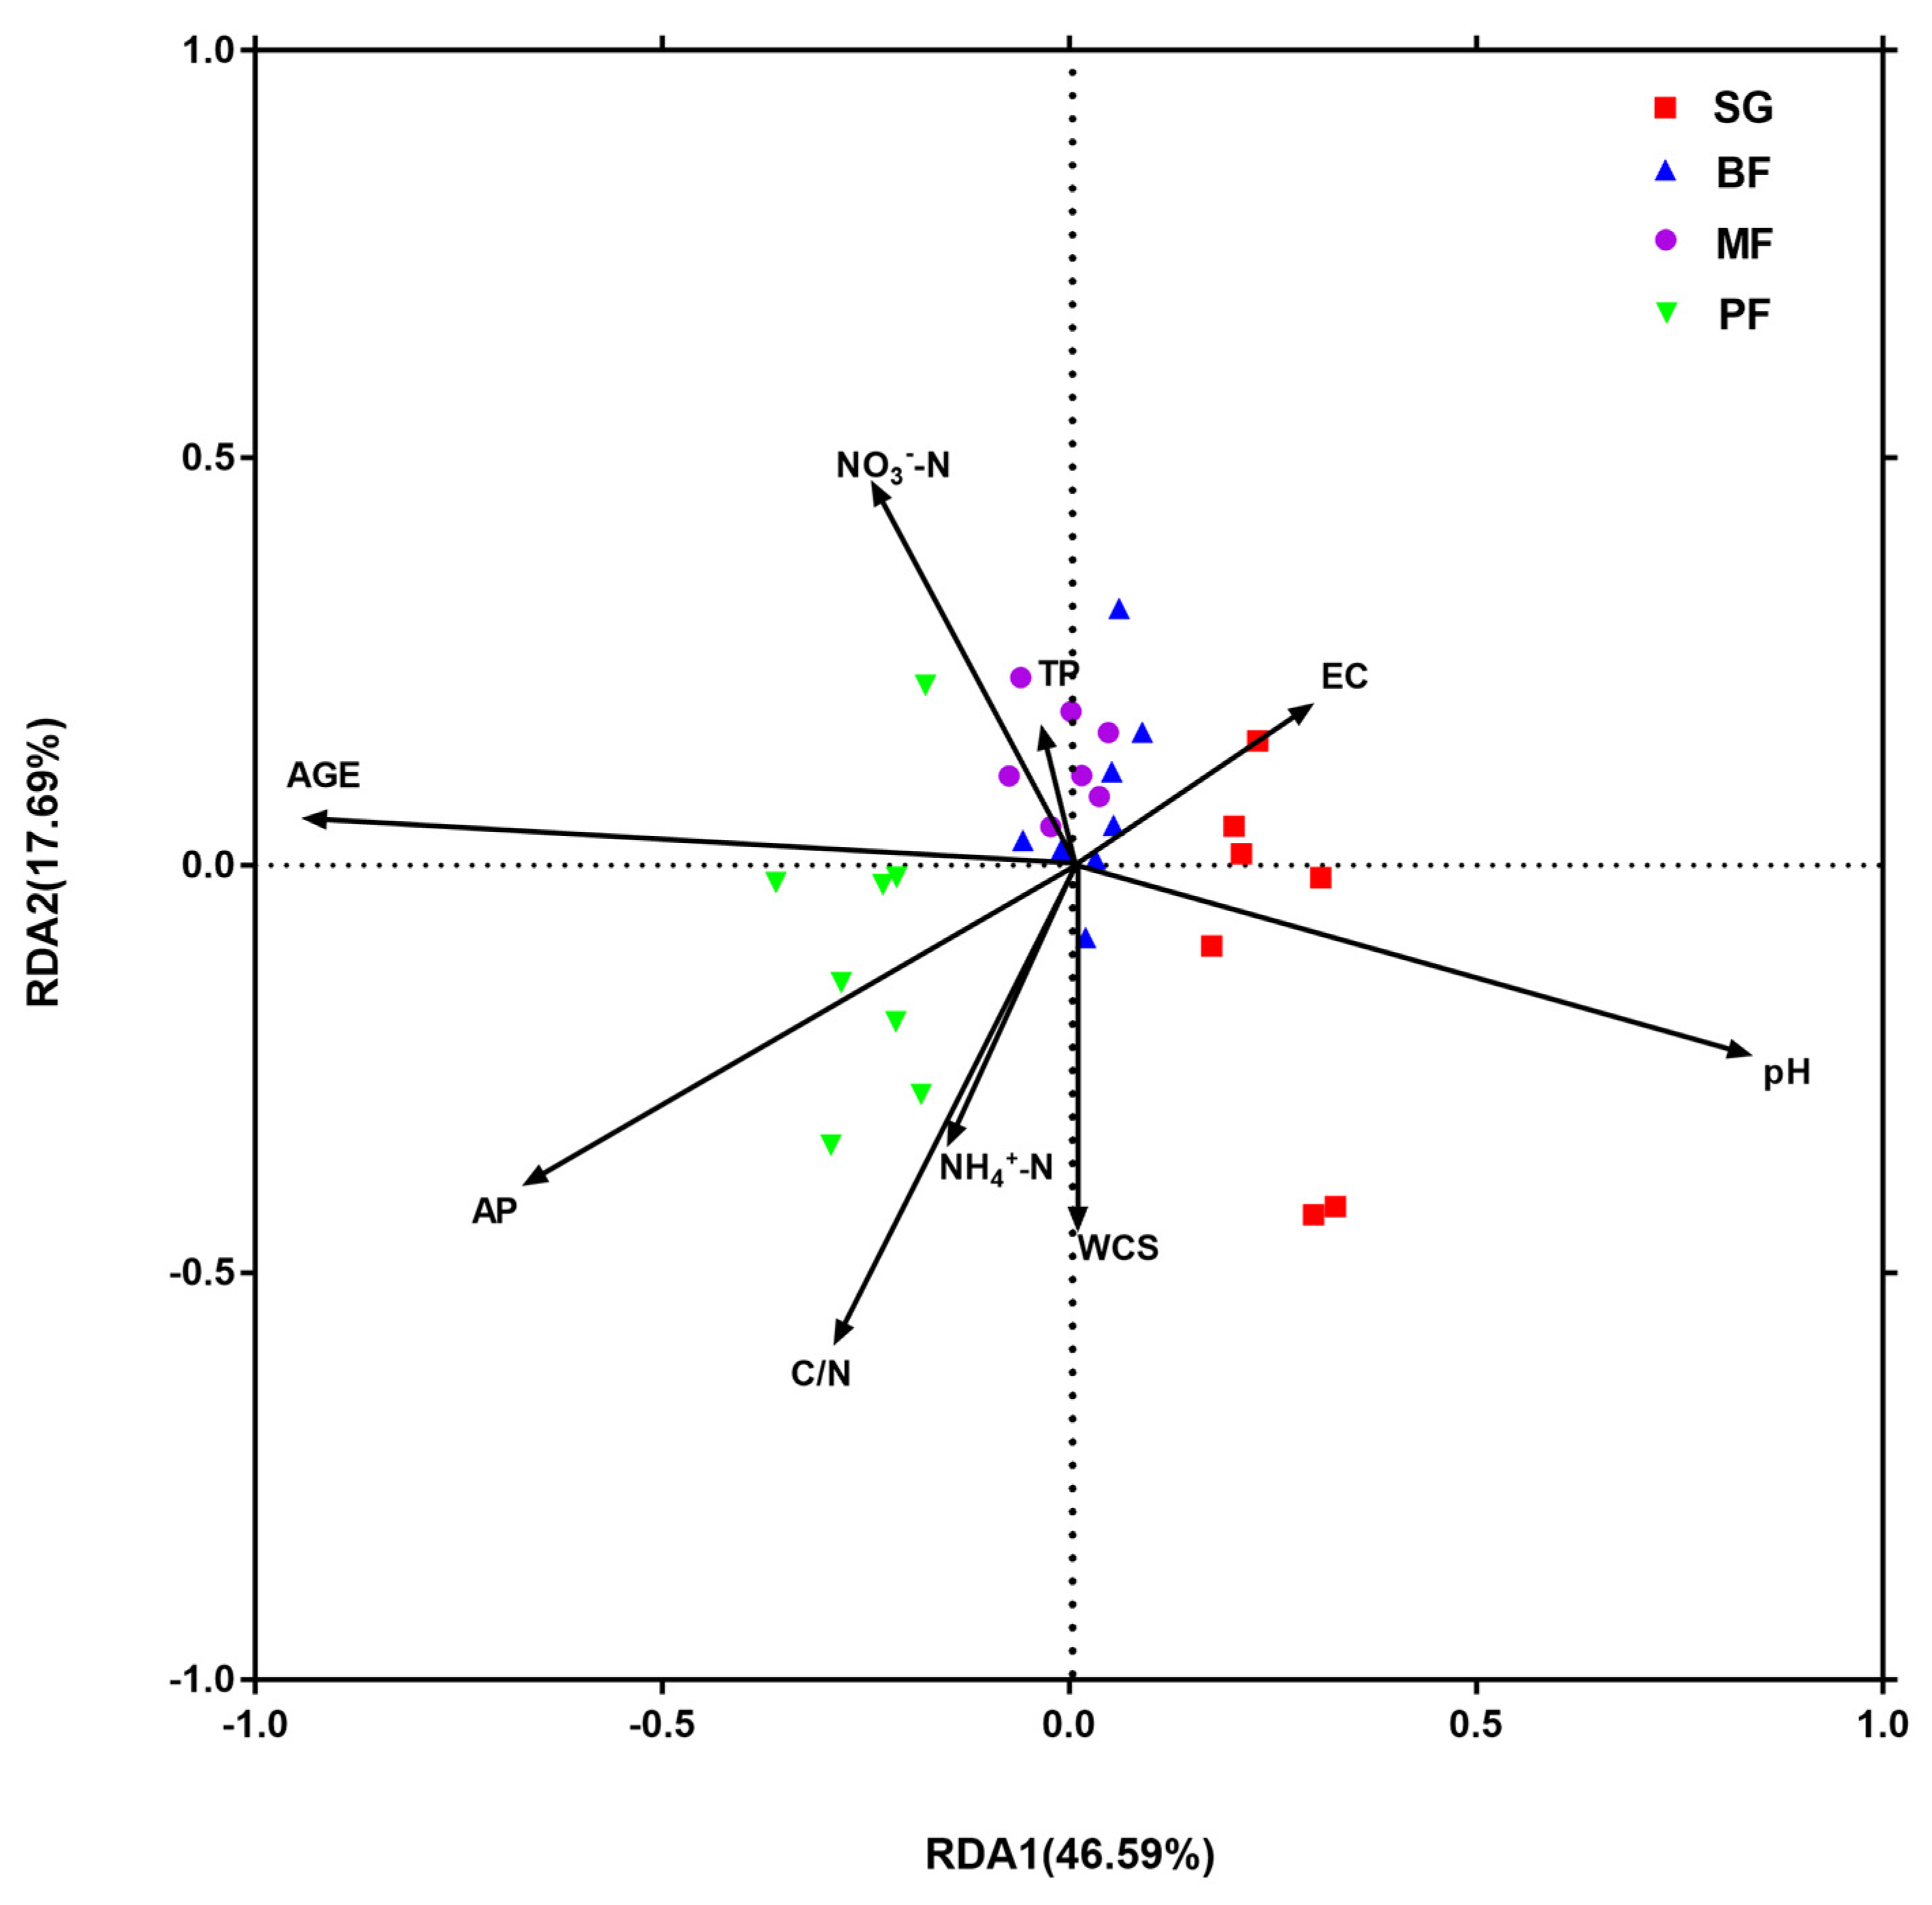
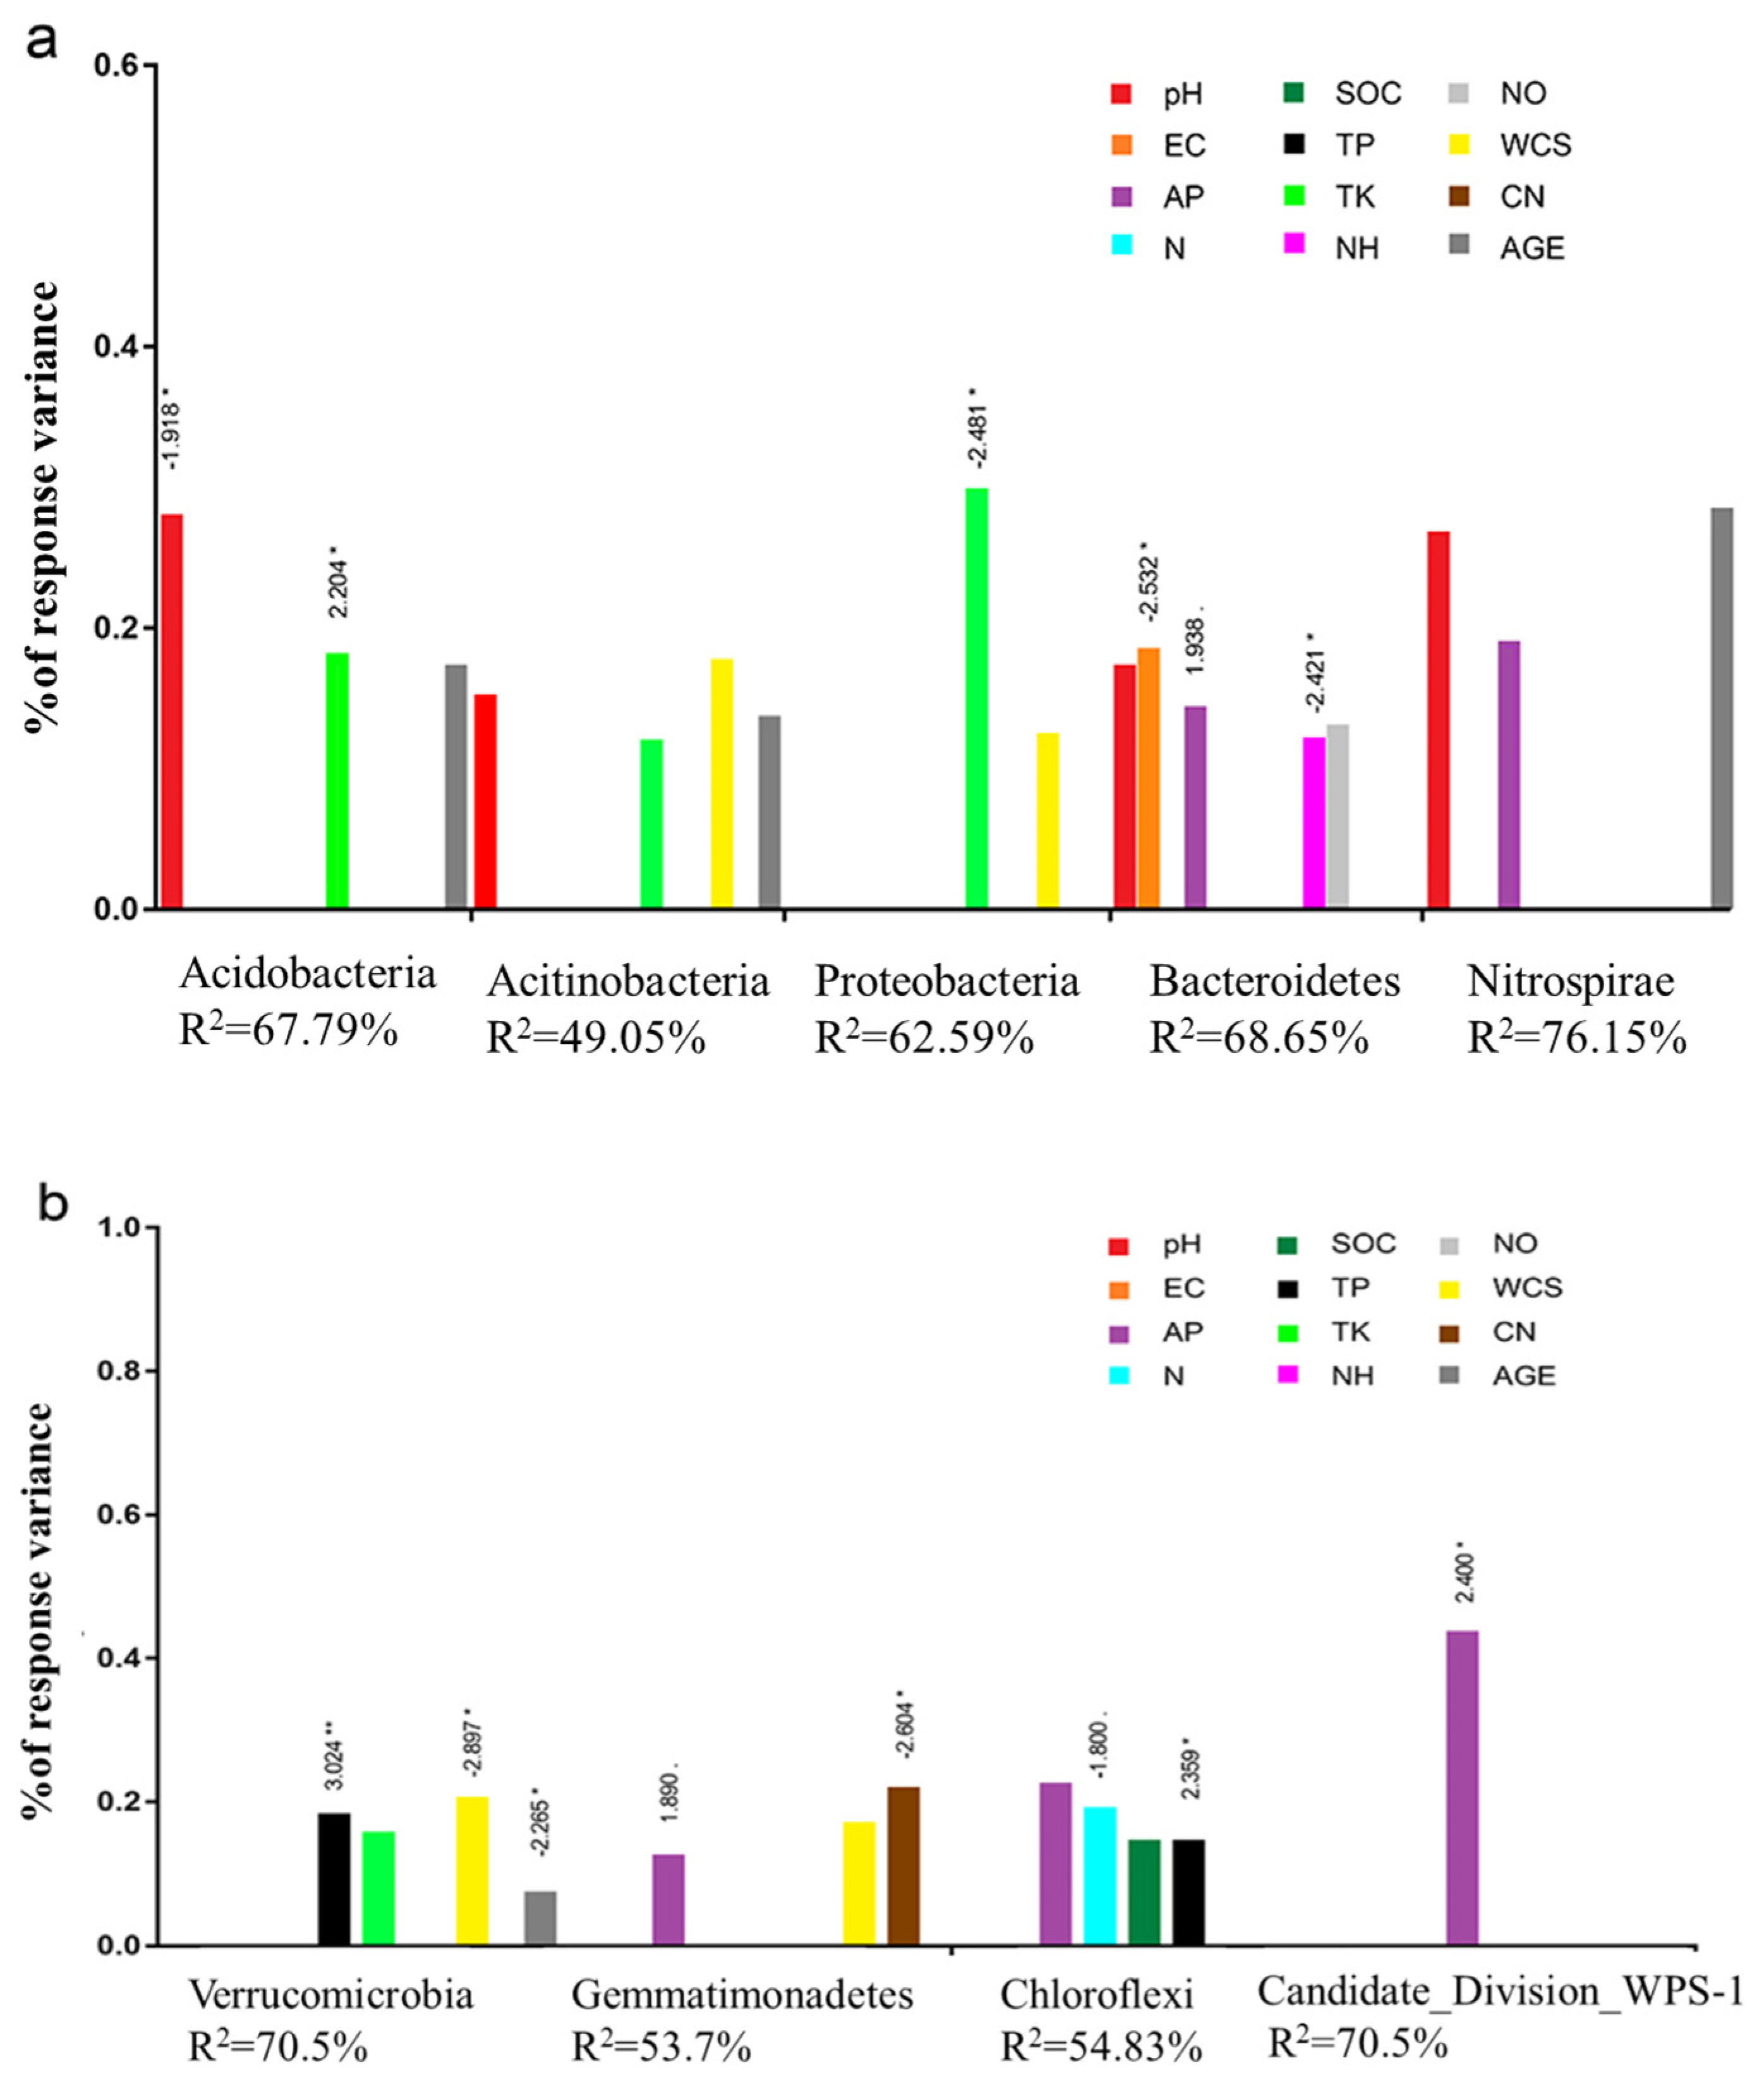
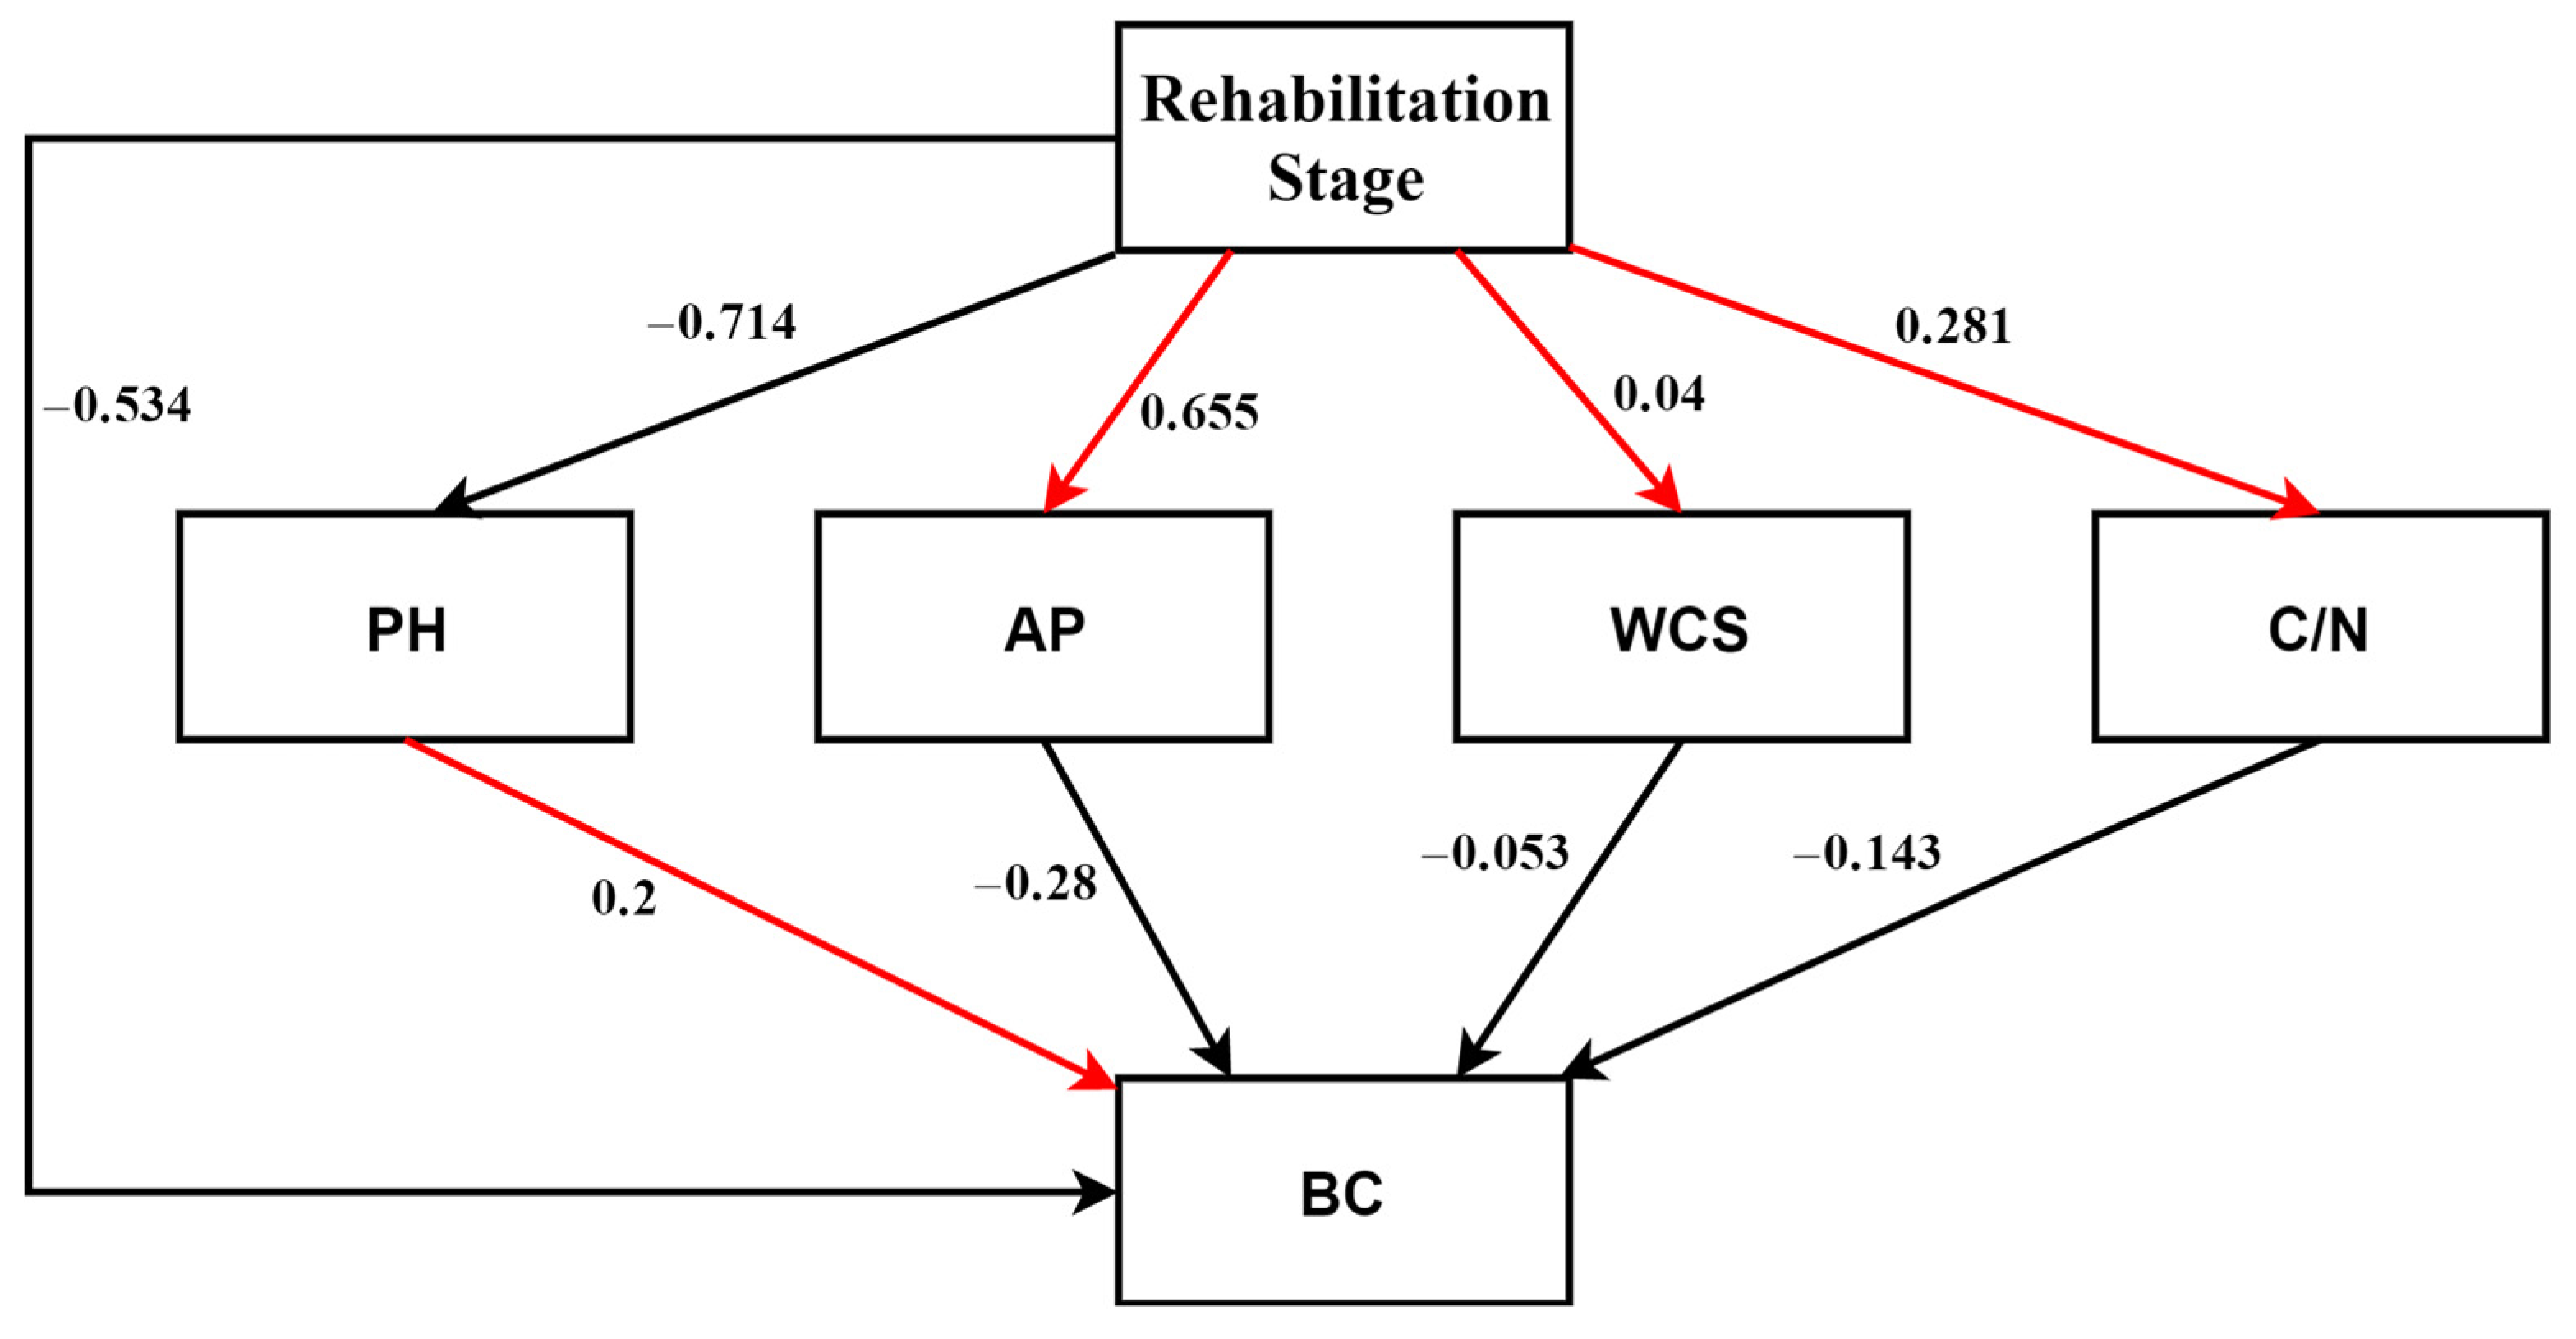
3.3. Relationships between Bacterial Community Structures and Environmetal Variables

The Mantel test revealed that the soil pH (r = 0.608, p = 0.001), AP (r = 0.292, p = 0.002), C/N ratio (r = 0.37, p = 0.002), and WCS (r = 0.208, p = 0.023) were significantly correlated with the variations in bacterial community structures. In addition, the rehabilitation stage was found to be a significant factor affecting soil bacterial community structures (r = 0.544, p = 0.001) (Table S5, Supporting Information). The DistLM analysis consistently revealed that some measured soil factors were correlated with bacterial community structures when considered together (Table 3): pH (27.76%), AP (7.94%), WCS (6.8%), C/N (4.42%), and rehabilitation stage (2.43%) were closely correlated soil factors, which cumulatively explained a 46.9% variation in the bacterial community structures occurring in the forest soil environment. The relationships between the environmental variables and soil bacterial communities were examined by RDA based on the OTUs (Figure 4). Among the selected environmental variables, pH, AP, and AGE contributed significantly to the changes of bacterial communities among the four succession stages. These results suggest that all of these factors significantly affected the soil bacterial community structure.
We further used multiple linear regression (MLR) models to determine the relative importance of these environmental variables in governing the relative abundances of dominant bacterial phyla. Our results showed that only a few abiotic variables had a significant effect on the abundance of soil bacteria. The number of variables with significant linear correlation with taxon abundance was ~1–2 and not more than 3. These significant variables accounted for 6.86% to 43.16% of the variation in taxonomic bacterial abundance (R2 ranged from 0.0686 to 0.4316) (Figure 5). Some other variables showed no significant correlation with the taxon abundance, but could be well explained. For example, the soil pH could be used to explain 26.51%, 17.05%, and 14.93% for Nitrospirae, Bacteroidetes and Actinobacteria, respectively. The interpretation values of soil AP to Nitrospirae and Chloroflexi were 18.74% and 22.03%, respectively. The interpretation values of soil moisture content (WCS) for Actinobacteria, Proteobacteria, and Gemmatimonadetes were 17.44%, 12.15%, and 16.53%, respectively. The rehabilitation age could be used to explain 17.01%, 13.39%, and 28.17% for Acidobacteria, Actinobacteria and Nitrospirae, respectively (Table S6).
We constructed a PLS-PM model to better integrate the interrelationships among bacterial community structures (BCs), the variation in soil properties, and rehabilitation stage (Figure 6). The GoF value for the best model represented here was 0.28. The rehabilitation stages exerted the largest contribution (−0.9, imposed by the conjoint direct (−0.534) and indirect (−0.369) effects) on the variation in BC. Furthermore, the rehabilitation stages represented significantly affected soil properties (soil pH (−0.714), soil total phosphorus (AP) (0.665), soil water content (WCS) (0.04), and soil C/N ratio (C/N) (0.281)). Soil pH was significantly and positively correlated with BC (0.2), AP (−0.28), WCS (−0.053), and C/N (−0.143) directly regulated the soil bacterial community structures.

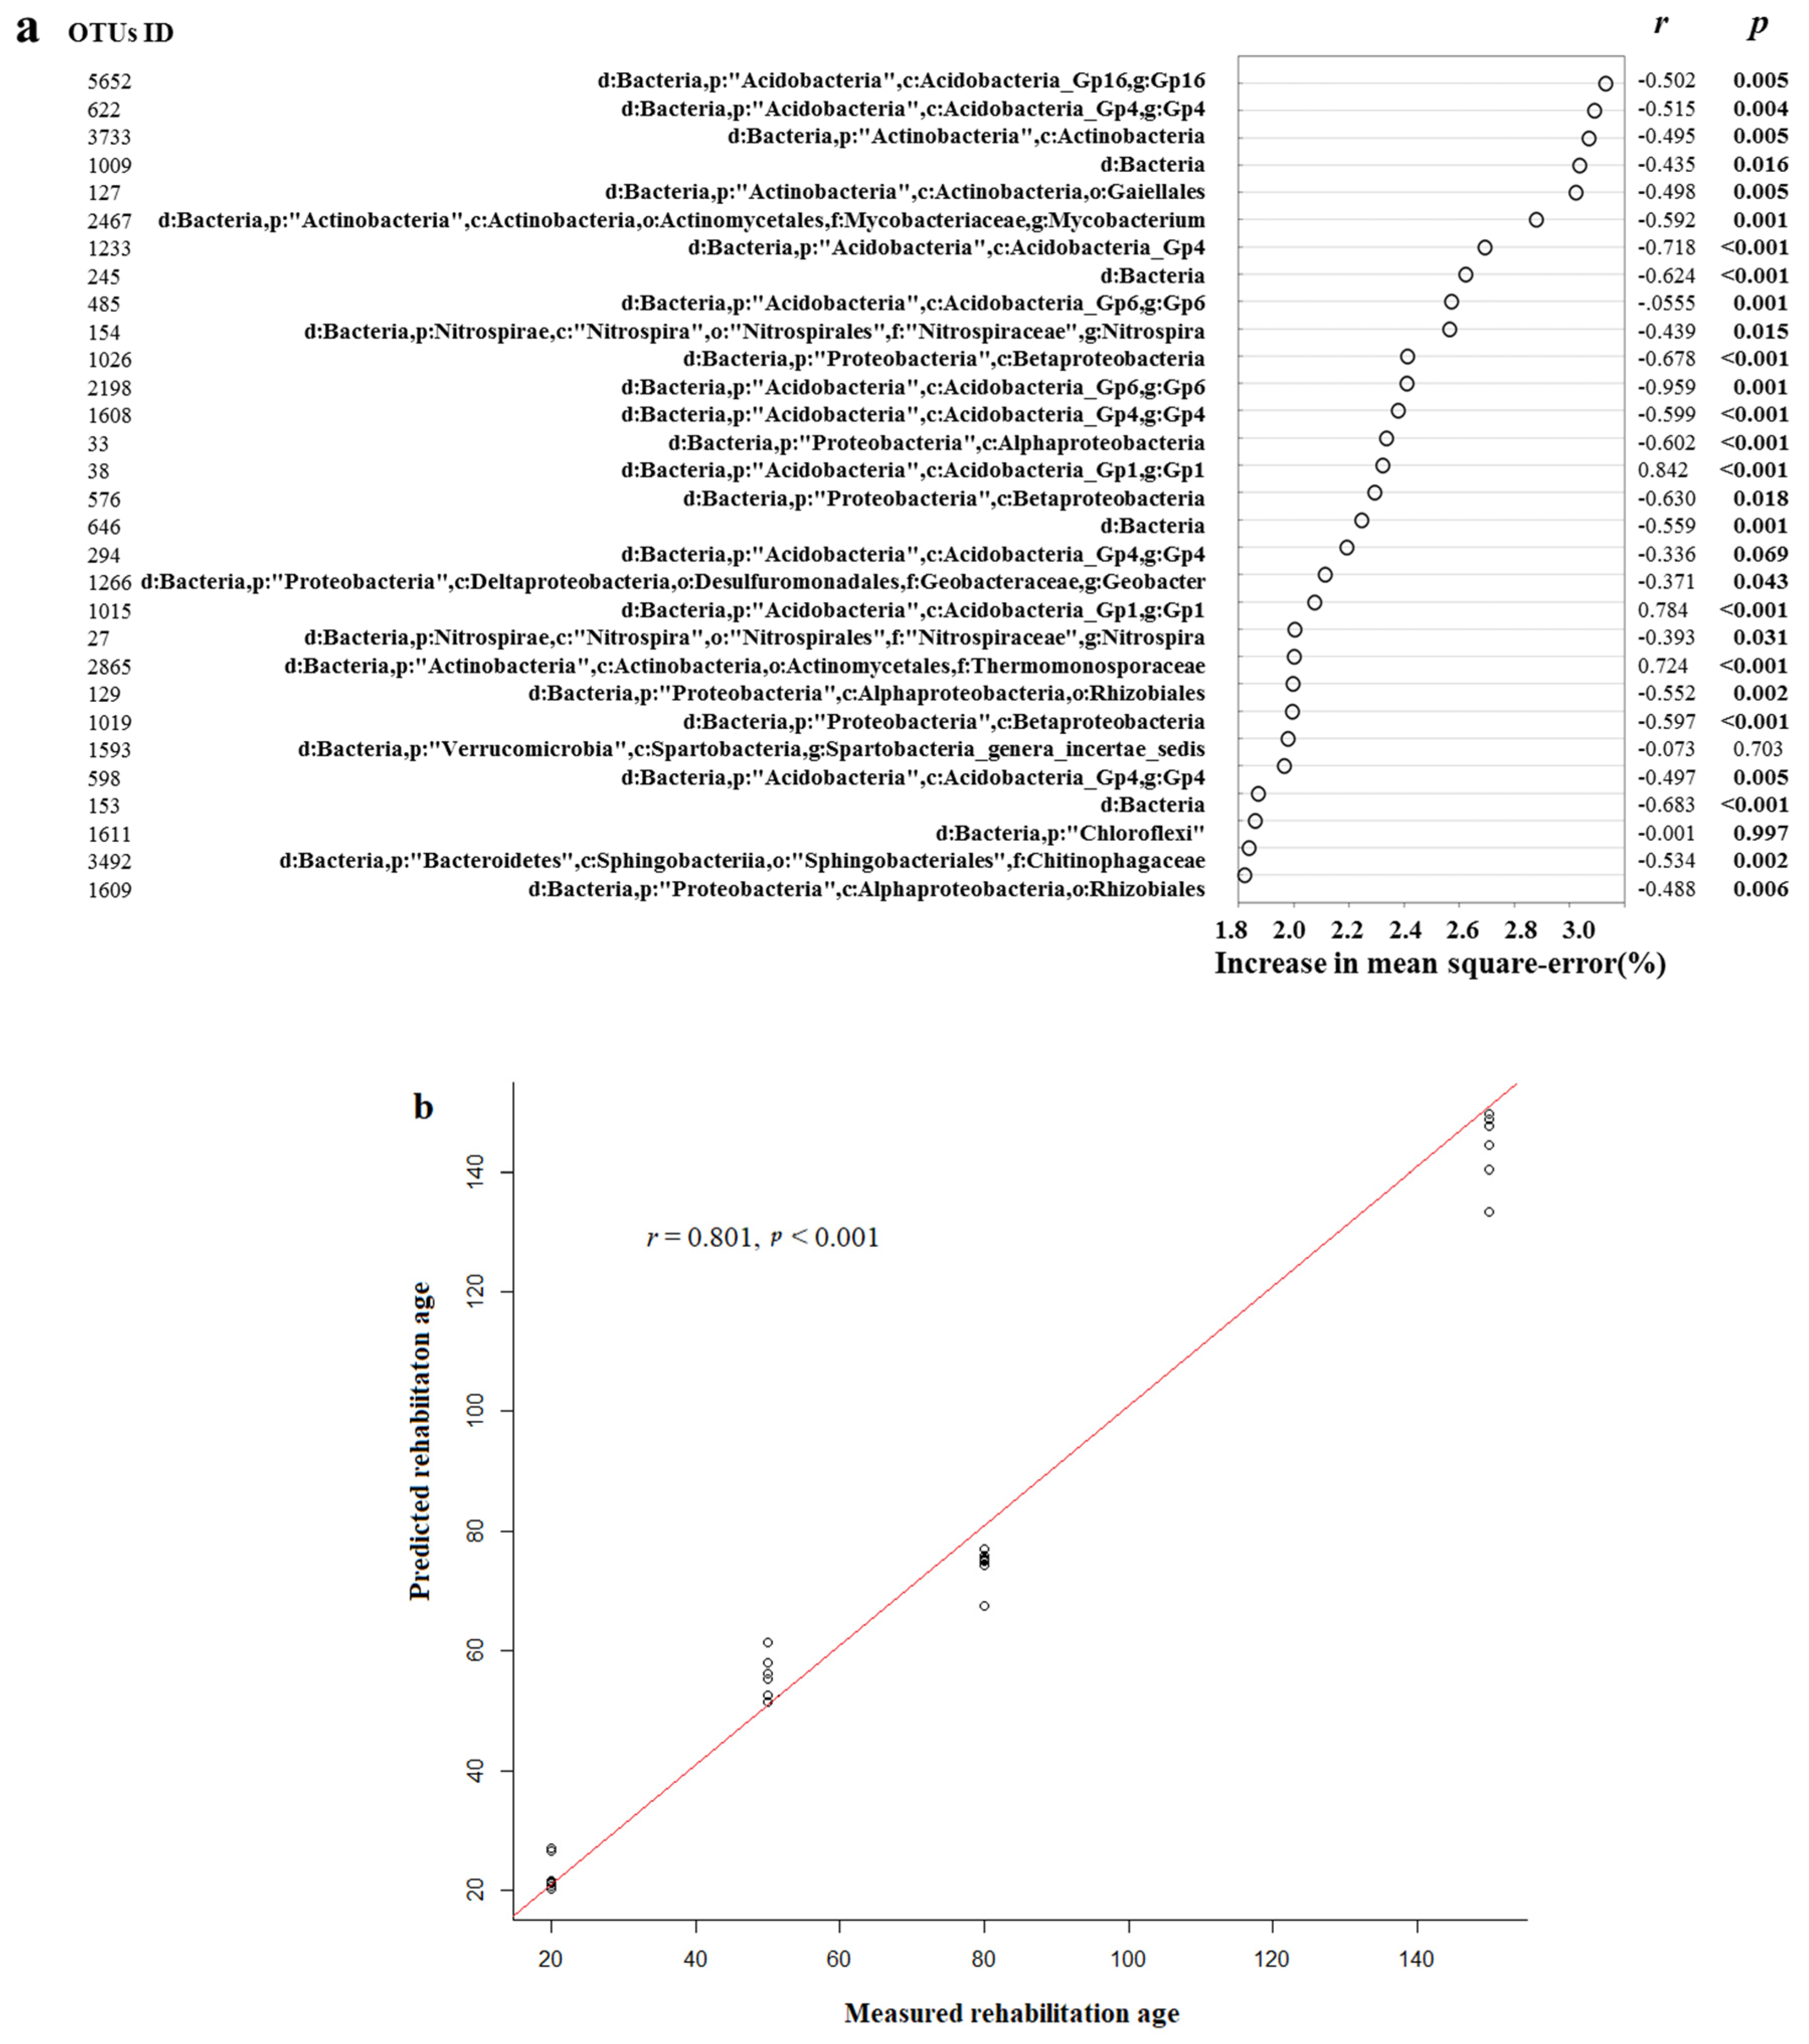
3.4. The Abundance of Sensitive Taxa Correlated with Secondary Succession

Given that the soil bacterial community structure was significantly different during secondary succession (Figure 2) and the rehabilitation age was an important factor affecting the soil bacterial community structure (Table S1), there may be certain bacterial lineages to predict the degree of secondary succession. The relative abundances of OTUs were regressed using the rehabilitation age of each sample using the Random Forests machine learning algorithm. The regression explained 74.8% of the variance related to rehabilitation age. Thirty top rehabilitation age taxa were selected according to their feature importance. These taxa were mainly affiliated with Acidobacteria, Proteobacteria, Actinobacteria, two Nitrospira, one Chitinophagaceae, and four unknown bacteria. The relative abundance of the total taxa was significantly correlated with the age of rehabilitation (p < 0.05) (Figure 7a), except for Verucomicrobia and Chloroflexi. The predicted rehabilitation age fitted well with the field measured rehabilitation age (r = 0.801, p < 0.001) (Figure 7b).

4. Discussion

Previous studies have shown that there are predictable patterns in microbial communities that occur during secondary succession or ecosystem restoration [52,53]. Soil bacterial communities can be restored after forest disturbances (clear-cutting) and return to a level similar to the original state after about 35 years [8]. The results of Cao et al. also showed that soil microbial communities can be predicted [9]. These results are consistent with our findings, in that succession of a secondary forest caused dramatic changes in the soil bacterial community composition and structure (Figure 2). The trend of composition and structure restoration of soil bacterial community is developing towards the direction of original forest state throughout the 50 years of rehabilitation (Figure 3). These results support the theory of restoration ecology that ecosystem degeneration is not irreversible and that post-disturbance recovery will proceed toward a primary stage [53,54]. It should be noted that the recovery trend was delayed in the MF and BF stages in our results. Our records span approximately 70 years from this stage of succession (Figure 3), which was not considered in previous studies [20]. A plausible explanation is the increase of soil bacterial diversity in the coniferous and broad-leaved mixed forest stage or the selection of an environmental niche may have led to the change in microbial recovery direction because the sensitivity and reversibility of the bacterial community responses to environmental changes could lead to differences in the soil bacterial communities [7,55,56]. The time frame we propose for restoring soil bacterial communities in a subalpine secondary forest would therefore be at least 60–70 years or longer.
The diversity of soil microbial structure in subalpine secondary forests in western Sichuan was mainly related to the differences in basic soil properties [9]. Notably, soil pH was the subset of variables that best explained the dissimilarities in the bacterial community, followed by soil AP, WCS, and C/N ratio. Previous evidence showed that soil pH is a determinative factor in affecting the soil bacterial community structures [7]. During the secondary forest restoration process, the soil AP was the main element limiting the growth of species and driving the soil bacterial community structures as a whole [57]. Under the influence of litter, the C/N ratio of the soil can affect the distribution of bacteria [58]. In addition, the soil moisture content (WCS) can cause anoxic soil environments and indirectly affect the growth of anaerobic or aerobic bacteria by affecting microbial respiration [59,60]. In our study, soil factors significantly affected the differences in soil bacterial communities during the succession of secondary forests (Table S5), which cumulatively contributed 46.91% variation in BC (Table 3). The large unexplained portion can be attributed to unmeasured biotic factors, such as tree species composition and the feeding traits of soil nematodes, both of which are known to cause variability in soil bacteria [9]. It is also worth mentioning that the rehabilitation age of a forest directly affects the community composition of soil bacteria in the restoration succession of a secondary forest.
Changes in the relative abundances of some dominant bacteria phyla might be responsible for the variations in soil bacterial community (Table S2). Previous studies found that different taxa might recover at different rates and in differing directions [8], which is consistent with our results (Table S2). In particular, Chloroflexi, Bacteroidetes, and Verrucomicrobia were significantly different in the MF and PF stages. Therefore, we propose that the soil factors and the increase of rehabilitation age can both lead to shifts in the relative abundance of different soil microbial taxa. It must also be noted that in the context of this explanation, there will be a certain degree of correlation between the detailed soil bacterial taxa and some potential factors (e.g., soil factors, forest age). Therefore, we can further explain the differences of bacterial community structures in different taxa by these potential factors.
We used the relative importance of linear models to determine the potential drivers of different types of soil bacteria. This regression model could explain the differences between the predictive factors and bacterial community structures well, further clarifying how the secondary restoration succession directly or indirectly affected the soil bacterial community through soil characteristics and rehabilitation age [25]. Although this regression model had been studied in forests, its application remains relatively rare for subalpine restoration succession [61]. Our results show that soil pH is linearly correlated with the soil bacteria Acidobacteria, which had the highest relative importance (p < 0.05; 0.2772). It is well known that Acidobacteria bacteria are very sensitive to soil pH [7]. In addition, although there was no significant linear relationship with Actinobacteria, Bacteroidetes, or Nitrospirae, the relative importance was relatively high (Actinobacteria (0.1493), Bacteroidetes (0.1705), Nitrospirae (0.2651). Our results showed that the above four groups were controlled by soil pH. Previous studies showed that these bacteria accounted for a large proportion of soil bacteria, which further indicated that soil pH was the key factor affecting the composition and structure of soil bacteria [62,63].
In our study, soil AP explained the changes in abundance for Bacteroidetes (0.2917), Gemmatimonadetes (0.227), and Candidate_division_WPS-1 (0.4855), and the Candidate_division_WPS-1 was positively correlated with soil AP (p < 0.01) (Table S6). The only study that showed bacteria similar to the candidate division focused on obligate anaerobes in cold areas with abundant water resources, such as high mountains or arctic regions [64]. Candidate_division_WPS-1 values may have a cold tolerance, whereas soil phosphorus plays an important role in stimulating microbial metabolism. The increase of soil AP would therefore explain the activity of the Candidate_division_WPS-1 bacteria. Gemmatimonadetes and Bacteroidetes had a weak positive correlation with soil AP (p < 0.1) (Table S6); a plausible explanation could be that they were involved in soil nutrient metabolism and promoted the growth of these bacteria under the stimulation of phosphorus [65]. In addition, we found that Gemmatimonadetes were controlled by soil C/N, N, and SOC. Gemmatimonadetes negatively correlated with soil C/N (0.2144, p < 0.01) and N (0.14, p < 0.1) and positively correlated with soil SOC (0.14, p < 0.1) (Table S6). Previous studies showed that a suitable C/N condition was beneficial for the decomposition of bacterial dominant droppings without phosphorus limitation [58]. The growth of fungi can be stimulated by nitrogen additions [66] and when the plant substrate is combined with a nitrogen addition, the growth of fungi should increase [67]. Therefore, a reasonable explanation is that Gemmatimonadetes are beneficial to the growth of soil bacteria when phosphorus is not limited and the nitrogen content is low. We found that Chloroflexi (0.2203) and Nitrospirae (0.1874) were also affected by soil AP (Table S6), although the correlation was not significant. Chloroflexi were previously considered oligotrophs [68,69] and likely specialize in the degradation of complex and refractory carbon compounds. When available nutrients are deficient, such as the p limitations, microorganisms must first degrade complex compounds [70]. Thus, the increase of soil nutrient demand would promote the growth of Chloroflexi [71] and the bacteria could be dominant in the late stage of restoration succession.
Although there was no significant difference in WCS among the four successional stages, WCS explained 0.2008 of the variation in Verrucomicrobia abundance. Verrucomicrobia was negatively correlated with soil water content (p < 0.01) (Table S6). In previous studies, the abundant representatives of Verrucomicrobia were detected only in oxic peat [72]. It is well known that an increase in WCS will reduce the oxygen content in the soil; therefore, higher soil water content and moisture content may be detrimental to the growth of Verrucomicrobia. On the contrary, Actinobacteria and Proteobacteria have the ability to tolerate long periods of oxygen starvation and also to thrive in anoxic conditions by fermenting their characteristic storage compound (poly-b-hydroxybutyrate) [73], which is consistent with our results. Actinobacteria (0.1744) and Proteobacteria (0.1215) were also affected by soil WCS, although their correlation was not significant (Table S6). In addition, Acidobacteria, Actinobacteria, and Nitrospirae were directly controlled by the forest age in the succession stage, although the correlation was not significant. Previous reports have shown that Actinobacteria and Nitrospirae are limited by inorganic nitrogen [74]. With the development of restoration succession, the secondary forest tended to change from the conservative nitrogen rule to the high-efficiency development nitrogen rule [2]. Consequently, Acidobacteria, Actinobacteria, and Nitrospirae, with low utilization rates of organic nitrogen, can be limited.
In subalpine regions, soil microbial communities are more sensitive to external disturbances than to plants or animals [75]. As mentioned, the restoration age is an important factor affecting the structure of the soil bacterial community (Table S1) and can explain the differences in some categories, such as Acidobacteria (17.01%) and Actinobacteria (13.39%) (Table S6). To reduce the list of indicators, we selected the first 30 restoration age groups according to the importance of their characteristics. These taxa mainly belong to Acidobacteria, Proteobacteria, and Actinobacteria. Except for individual taxa, the relative abundance of 28 age-specific taxa was significantly correlated with age (Figure 7a). This indicates that most of the restoration age taxa show adaptive changes with ongoing secondary succession. We found that in the age groups, Proteobacteria and Actinobacteria species consistently negatively correlated with age recovery. Proteobacteria and Actinobacteria species can tolerate long-term hypoxia and provide organic matter for growth by fermenting and storing compounds [73]. In the early stage of secondary forest succession, the soil porosity is small and the soil oxygen content is relatively low [76], which gives these species competitive advantage. On the other hand, Proteobacteria and Actinobacteria belong to co-cultured microorganisms, which have a high resource utilization rate. In the early stage of succession, species with high resource utilization rates have a growth advantage [1]. The response of Acidobacteria members to the increase of recovery years was different and a reasonable explanation for this phenomenon is that Acidobacteria are very sensitive to soil pH; when soil pH increases, Acidobacteria bacteria will have different responses [77,78,79]. These characteristics make Acidobacteria better adapted to the changes in soil pH, which tends to change continuously during secondary forest succession [80,81]. Similar characteristics of Nitrospirae bacteria have been reported [82] and may be the reason for the negative correlation between Nitrospirae members and restoration age. These discriminative taxa can therefore be used as biological indicators for the degree of secondary succession. In addition, there is a high consistency between the predicted and detected values of the recovery period (Figure 7b). Generally speaking, although there are two non-linear changes between the restoration years, the relative abundance of most of the restoration years’ taxa is gradual. This gradient model provides an objective index for the diagnosis of secondary succession status by tracking the abundance of a few restoration age taxa. However, whether or not the first test group is suitable for sub mountain secondary forest areas remains unclear, thus further work is required for model verification.
Soil bacterial communities were related to both soil factors and restoration succession. Our PLS-PM model further verifies this hypothesis (Figure 6). It is worth noting that the contribution of rehabilitation stage to soil bacteria is only 2.43% by DistLM analysis (Table 2). ANOVA was used to analyze the simple effect of rehabilitation stage on soil bacteria and the rehabilitation stage accounted for 17.88% of the variation of soil bacteria (Table S7). In the PLS-PM model, the direct effect of rehabilitation stage on the change of soil bacterial community was −0.534 (Figure 6). In addition to the differences in methods, we suggest that the result of the differences in data level is due to a two-directional interrelationship. The influence of the rehabilitation stage may be both direct and indirect (environmental factors) on the bacterial community effects. Many results show that there is a strong relationship between environmental factors and soil bacterial community [4,5,6], and the rehabilitation stage will change environmental factors in the process of succession [8,9]. This relationship may lead to the difference of the interpretation rates of the rehabilitation stage to the changes of soil bacterial community.

5. Conclusions

Our findings provide comprehensive insights into how soil variable and restoration succession affect the distribution of soil bacterial communities. Overall, soil bacteria are primarily influenced by soil pH, AP, C/N, and rehabilitation age. These factors help to explain the differences of soil bacteria in different succession stages. At each taxon, soil bacteria are governed by different local variables and some show a linear response to soil factors and rehabilitation age. Moreover, the degree of secondary restoration can be accurately evaluated using the profiles of some sensitive taxa of secondary restoration succession. This is a new attempt to quantitatively determine the degree of secondary restoration, although additional experiments are needed to verify the model. Our study provides evidence for the restoration of ecological degradation caused by forest disturbances (clear-cutting) and a basis for the restoration and management of secondary forests. Due to the shortcomings of spatial scale and the limitation of stand division representing different successional stages, these results can not represent the complete model of soil bacterial community change and the complete description of the influence of soil factors on soil bacterial community through niche selection under natural restoration of subalpine secondary forest. Therefore, the integration of regional and local views, as well as more research on restoration stages is required to confirm these findings.

Supplementary Materials

The following are available online at https://www.mdpi.com/article/10.3390/f12040505/s1, Figure S1: The relative abundance of dominant bacterial (a–d) at different rehabilitation stages. Table S1: The plot characteristics of the four successional stages in a Miyaluo region of Sichuan. Table S2: The bacterial communities in the different rehabilitation stages at different Phylum levels (a), Class levels (b) and Order levels (c). Table S3. The bacterial communities in the different rehabilitation stages at different Class levels. Table S4. The bacterial communities in the different rehabilitation stages at different Order levels. Table S5: Mantel test showing the effects of rehabilitation stage and soil factors on bacteria community structure. Table S6: Relative importance of the significant independent variables explaining the variance in abundance of the different taxonomic groups. Table S7: ANOVA analysis (Simple effect) explaining the explanatory value of single factors on the change of soil bacterial community.

Author Contributions

Conceptualization, W.Z., H.Y. and Z.S.; methodology, Z.S.; software, Z.S.; validation, S.S., X.L. and S.M.; formal analysis, Z.S.; investigation, Z.S., S.S.; resources, Z.S., X.L. and S.M.; data curation, Z.S.; writing—original draft preparation, Z.S.; writing—review and editing, Y.L., J.X. and H.Y.; visualization, Z.S. and Y.L.; supervision, W.Z.; project administration, W.Z.; funding acquisition, W.Z. All authors have read and agreed to the published version of the manuscript.

Funding

This research was funded by the National key research and development program of China (2017YFC0505004), Major scientific and technological projects of environmental governance and ecological protection of Sichuan Province (2018SZDZX0031) and 135 Strategic Program of the Institute of Mountain Hazards and Environment, CAS (SDS-135-1707).

Data Availability Statement

The sequence data presented in this study are openly available in the BIG Data Center, CAS under code CRA003333 at http://bigd.big.ac.cn/gsa.

Conflicts of Interest

The authors declare no conflict of interest.

References

  1. Zhou, Z.; Wang, C.; Jiang, L.; Luo, Y. Trends in soil microbial communities during secondary succession. Soil Biol. Biochem. 2017, 115, 92–99. [Google Scholar] [CrossRef]
  2. Manuel, R.G.; Ostertag, R. Neotropical secondary forest succession: Changes in structural and functional characteristics. For. Ecol. Manag. 2001, 148, 185–206. [Google Scholar]
  3. Norden, N.; Angarita, H.A.; Bongers, F.; Martinez-Ramos, M.; Granzow-de la Cerda, I.; van Breugel, M.; Lebrija-Trejos, E.; Meave, J.A.; Vandermeer, J.; Williamson, G.B.; et al. Successional dynamics in Neotropical forests are as uncertain as they are predictable. Proc. Natl. Acad. Sci. USA 2015, 112, 8013–8018. [Google Scholar] [CrossRef] [Green Version]
  4. Cui, Y.; Bing, H.; Fang, L.; Wu, Y.; Yu, J.; Shen, G.; Jiang, M.; Wang, X.; Zhang, X. Diversity patterns of the rhizosphere and bulk soil microbial communities along an altitudinal gradient in an alpine ecosystem of the eastern Tibetan Plateau. Geoderma 2019, 338, 118–127. [Google Scholar] [CrossRef]
  5. Chen, Y.L.; Deng, Y.; Ding, J.Z.; Hu, H.W.; Xu, T.L.; Li, F.; Yang, G.B.; Yang, Y.H. Distinct microbial communities in the active and permafrost layers on the Tibetan Plateau. Mol. Ecol. 2017, 26, 6608–6620. [Google Scholar] [CrossRef]
  6. Li, J.; Shen, Z.; Li, C.; Kou, Y.; Wang, Y.; Tu, B.; Zhang, S.; Li, X. Stair-Step Pattern of Soil Bacterial Diversity Mainly Driven by pH and Vegetation Types Along the Elevational Gradients of Gongga Mountain, China. Front. Microbiol. 2018, 9, 569. [Google Scholar] [CrossRef] [Green Version]
  7. Shen, C.C.; Xiong, J.B.; Zhang, H.Y.; Feng, Y.Z.; Lin, X.G.; Li, X.Y.; Liang, W.J.; Chu, H.Y. Soil pH drives the spatial distribution of bacterial communities along elevation on Changbai Mountain. Soil Biol. Biochem. 2013, 57, 204–211. [Google Scholar] [CrossRef]
  8. Zhang, X.; Liu, S.R.; Li, X.Z.; Wang, J.X.; Ding, Q.; Wang, H.; Tian, C.; Yao, M.J.; An, J.X.; Huang, Y.T. Changes of soil prokaryotic communities after clear-cutting in a karst forest: Evidences for cutting-based disturbance promoting deterministic processes. FEMS Microbiol. Ecol. 2016, 92, 3. [Google Scholar] [CrossRef]
  9. Cao, J.; Pan, H.; Chen, Z.; Shang, H. Bacterial, fungal, and archaeal community assembly patterns and their determining factors across three subalpine stands at different stages of natural restoration after clear-cutting. J. Soils Sediments 2020, 20, 2794–2803. [Google Scholar] [CrossRef]
  10. You, Y.Y.; Wang, J.; Huang, X.M.; Tang, Z.X.; Liu, S.R.; Sun, O.J. Relating microbial community structure to functioning in forest soil organic carbon transformation and turnover. Ecol. Evol. 2014, 4, 633–647. [Google Scholar] [CrossRef]
  11. Wan, X.H.; Huang, Z.Q.; He, Z.M.; Yu, Z.P.; Wang, M.H.; Davis, M.R.; Yang, Y.S. Soil C:N ratio is the major determinant of soil microbial community structure in subtropical coniferous and broadleaf forest plantations. Plant Soil 2015, 387, 103–116. [Google Scholar] [CrossRef]
  12. Pennanen, T.; Caul, S.; Daniell, T.J.; Griffiths, B.S.; Ritz, K.; Wheatley, R.E. Community-level responses of metabolically-active soil microorganisms to the quantity and quality of substrate inputs. Soil Biol. Biochem. 2004, 36, 841–848. [Google Scholar] [CrossRef]
  13. Carney, K.M.; Matson, P.A. Plant Communities, Soil Microorganisms, and Soil Carbon Cycling: Does Altering the World Belowground Matter to Ecosystem Functioning? Ecosystems 2005, 8, 928–940. [Google Scholar] [CrossRef]
  14. Yao, M.; Rui, J.; Li, J.; Dai, Y.; Bai, Y.; Heděnec, P.; Wang, J.; Zhang, S.; Pei, K.; Liu, C.; et al. Rate-specific responses of prokaryotic diversity and structure to nitrogen deposition in the Leymus chinensis steppe. Soil Biol. Biochem. 2014, 79, 81–90. [Google Scholar] [CrossRef]
  15. Achat, D.L.; Deleuze, C.; Landmann, G.; Pousse, N.; Ranger, J.; Augusto, L. Quantifying consequences of removing harvesting residues on forest soils and tree growth—A meta-analysis. For. Ecol. Manag. 2015, 348, 124–141. [Google Scholar] [CrossRef]
  16. Ivanova, N.S. Recovery of tree stand after clear-cutting in the ural mountains. Int. J. Bio-Resour. Stress Manag. 2014, 5, 090–092. [Google Scholar] [CrossRef]
  17. Xu, H.; Li, Y.; Liu, S.; Zang, R.; He, F.; Spence, J.R.; Cadotte, M. Partial recovery of a tropical rain forest a half-century after clear-cut and selective logging. J. Appl. Ecol. 2015, 52, 1044–1052. [Google Scholar] [CrossRef]
  18. Banning, N.C.; Gleeson, D.B.; Grigg, A.H.; Grant, C.D.; Andersen, G.L.; Brodie, E.L.; Murphy, D.V. Soil microbial community successional patterns during forest ecosystem restoration. Appl. Environ. Microb. 2011, 77, 6158–6164. [Google Scholar] [CrossRef] [PubMed] [Green Version]
  19. Ferrenberg, S.; O’Neill, S.P.; Knelman, J.E.; Todd, B.; Duggan, S.; Bradley, D.; Robinson, T.; Schmidt, S.K.; Townsend, A.R.; Williams, M.W.; et al. Changes in assembly processes in soil bacterial communities following a wildfire disturbance. ISME J. 2013, 7, 1102–1111. [Google Scholar] [CrossRef] [Green Version]
  20. Xiang, X.; Shi, Y.; Yang, J.; Kong, J.; Lin, X.; Zhang, H.; Zeng, J.; Chu, H. Rapid recovery of soil bacterial communities after wildfire in a Chinese boreal forest. Sci. Rep. 2014, 4, 03829. [Google Scholar] [CrossRef] [Green Version]
  21. Liu, Y.; Wang, S.; Wang, Z.; Zhang, Z.; Qin, H.; Wei, Z.; Feng, K.; Li, S.; Wu, Y.; Yin, H.; et al. Soil microbiome mediated nutrients decline during forest degradation process. Soil Ecol. Lett. 2019, 1, 59–71. [Google Scholar] [CrossRef] [Green Version]
  22. Cui, Y.; Fang, L.; Guo, X.; Wang, X.; Wang, Y.; Zhang, Y.; Zhang, X. Responses of soil bacterial communities, enzyme activities, and nutrients to agricultural-to-natural ecosystem conversion in the Loess Plateau, China. J. Soils Sediments 2018, 19, 1427–1440. [Google Scholar] [CrossRef]
  23. Allison, S.D. A trait-based approach for modelling microbial litter decomposition. Ecol. Lett. 2012, 15, 1058–1070. [Google Scholar] [CrossRef] [PubMed]
  24. Thimo, K.; Klaus, K.; Georg, G.; Christiane, G.; Karsten, K. A new conceptual model for the fate of lignin in decomposing plant litter. Ecology 2011, 92, 1052–1062. [Google Scholar]
  25. Wilhelm, R.C.; Singh, R.; Eltis, L.D.; Mohn, W.W. Bacterial contributions to delignification and lignocellulose degradation in forest soils with metagenomic and quantitative stable isotope probing. ISME J. 2019, 13, 413–429. [Google Scholar] [CrossRef] [Green Version]
  26. Fischer, T.; Agarwal, A.; Hess, H. A smart dust biosensor powered by kinesin motors. Nat. Nanotechnol. 2009, 4, 162–166. [Google Scholar] [CrossRef]
  27. Wu, J.; Park, J.P.; Dooley, K.; Cropek, D.M.; West, A.C.; Banta, S. Rapid development of new protein biosensors utilizing peptides obtained via phage display. PLoS ONE. 2011, 6, e24948. [Google Scholar] [CrossRef] [PubMed] [Green Version]
  28. Barbeta, A.; Julio Camarero, J.; Sanguesa-Barreda, G.; Muffler, L.; Penuelas, J. Contrasting effects of fog frequency on the radial growth of two tree species in a Mediterranean-temperate ecotone. Agric. For. Meteorol. 2019, 264, 297–308. [Google Scholar] [CrossRef]
  29. Xuan, L.; Sheng, Z.; Lu, J.; Qiu, Q.; Chen, J.; Xiong, J. Bacterioplankton community responses and the potential ecological thresholds along disturbance gradients. Sci. Total Environ. 2019, 696, 134015. [Google Scholar] [CrossRef]
  30. Fernandez, A.L.; Sheaffer, C.C.; Wyse, D.L.; Staley, C.; Gould, T.J.; Sadowsky, M.J. Associations between soil bacterial community structure and nutrient cycling functions in long-term organic farm soils following cover crop and organic fertilizer amendment. Sci. Total Environ. 2016, 566–567, 949–959. [Google Scholar] [CrossRef] [PubMed] [Green Version]
  31. Liu, Y.; Zhang, Y.; Liu, S. Aboveground biomass, ANPP and stem volume of birch stands in natural restoration process of subalpine secondary forest in Western Sichuan. Acta Ecol. Sin. 2010, 30, 594–601, (In Chinese with English abstract). [Google Scholar]
  32. Zhang, Y.; Liu, S.; Ma, J.; Shi, Z.; Liu, X. Woodland hydrological effects of birch forests in sub-alpine region of western Sichuan, China. Acta Ecol. Sin. 2005, 25, 2939–2946, (In Chinese with English abstract). [Google Scholar]
  33. Shi, L.X.; Wang, J.X.; Su, Y.M.; Hou, G.W. Earlier-stage succession of vegetation on the clear-cuts in mialou forest district in western Sichuan. Acta Phytoecol. Sci. 1988, 12, 306–313, (In Chinese with English abstract). [Google Scholar]
  34. Wang, Q.; Wu, N.; Luo, P. Simulation of light regimes in typical subalpine forest succession series of eastern Tibetan Plateau. Pol. J. Ecol. 2009, 57, 251–260, (In Chinese with English abstract). [Google Scholar]
  35. Jiang, Y.; Lei, Y.; Yang, Y.; Korpelainen, H.; Niinemets, Ü.; Li, C. Divergent assemblage patterns and driving forces for bacterial and fungal communities along a glacier forefield chronosequence. Soil Biol. Biochem. 2018, 118, 207–216. [Google Scholar] [CrossRef] [Green Version]
  36. Ma, J.; Shi, Z.; Zhang, Y.; Chen, B. Quantitative analysis of different restoration stages during natural succession processes of subalpine dark brown coniferous forests in western Sichuan, China. Chin. J. Appl. Ecol. 2007, 18, 1695–1701, (In Chinese with English abstract). [Google Scholar]
  37. Xu, Z.; Yin, H.; Xiong, P.; Wan, C.; Liu, Q. Short-term responses of Picea asperata seedlings of different ages grown in two contrasting forest ecosystems to experimental warming. Environ. Exp. Bot. 2012, 77, 1–11. [Google Scholar] [CrossRef]
  38. Jones, D.; Willett, V. Experimental evaluation of methods to quantify dissolved organic nitrogen (DON) and dissolved organic carbon (DOC) in soil. Soil Biol. Biochem. 2006, 38, 991–999. [Google Scholar] [CrossRef]
  39. Olsen, S.R.; Cole, C.V.; Watanabe, F.S.; Dean, L.A. Estimation of Available Phosphorus in Soils by Extraction with Sodium Bicarbonate; USDA Circular 939; US Government Printing Office: Washington, DC, USA, 1954.
  40. Caporaso, J.G.; Bittinger, K.; Bushman, F.D.; DeSantis, T.Z.; Andersen, G.L.; Knight, R. PyNAST: A flexible tool for aligning sequences to a template alignment. Bioinformatics 2010, 26, 266–267. [Google Scholar] [CrossRef] [Green Version]
  41. Edgar, R.C. Search and clustering orders of magnitude faster than BLAST. Bioinformatics 2010, 26, 2460–2461. [Google Scholar] [CrossRef] [Green Version]
  42. Caporaso, J.; Kuczynski, J.; Stombaugh, J.; Bittinger, K.; Bushman, F.D.; Costello, E.; Fierer, N.; Pena, A.; Goodrich, J.; Gordon, J. QIIME allows analysis of high-throughput community sequencing data. Nat. Methods 2010, 7, 335–336. [Google Scholar] [CrossRef] [Green Version]
  43. Wang, Q.; Garrity, G.; Tiedje, J.; Cole, J. Naive Bayesian classifier for rapid assignment of rRNA sequences into the new bacterial taxonomy. Appl. Environ. Microb. 2007, 73, 5261–5267. [Google Scholar] [CrossRef] [PubMed] [Green Version]
  44. Clarke, K.R. Non-parametric multivariate analyses of changes in community structure. Aust. J. Ecol. 1993, 18, 117–143. [Google Scholar] [CrossRef]
  45. Kenkel, N.; Orlóci, L. Applying metric and nonmetric multidimensional scaling to ecological studies: Some new results. Ecology 1986, 67, 919–928. [Google Scholar] [CrossRef]
  46. Oksanen, J.; Blanchet, G.; Kindt, R.; Legendre, P.; Minchin, P.R.; O’Hara, R.B.; Stevens, M.; Oksanen, M. Vegan: Community Ecology Package–R Package v.2.3–0; R Foundation for Statistical Computing: Vienna, Austria, 2015; Available online: http://www.r-project.org (accessed on 16 April 2021).
  47. McArdle, B.; Anderson, M. Fitting multivariate models to community data: A comment on distance-based redundancy analysis. Ecology 2001, 82, 290. [Google Scholar] [CrossRef]
  48. R Core Team. R: A Language and Environment for Statistical Computing. 2013. Available online: http://www.r-project.org (accessed on 16 April 2021).
  49. Grömping, U. Relative importance for linear regression in R: The package relaimpo. J. Stat. Softw. 2006, 17, 1–27. [Google Scholar] [CrossRef] [Green Version]
  50. Sanchez, G. PLS Path Modeling with R; Trowchez Editions: Berkeley, CA, USA, 2013. [Google Scholar]
  51. Cutler, D.; Edwards, T.; Beard, K.; Cutler, A.; Hess, K.; Gibson, J.; Lawler, J. Random Forests or classification in ecology. Ecology 2007, 88, 2783–2792. [Google Scholar] [CrossRef] [PubMed]
  52. Bardgett, R.; Van Der Putten, W.H. Belowground biodiversity and ecosystem functioning. Nature 2014, 515, 505–511. [Google Scholar] [CrossRef]
  53. Fierer, N.; Nemergut, D.; Knight, R.; Craine, J.M. Changes through time: Integrating microorganisms into the study of succession. Res. Microbiol. 2010, 161, 635–642. [Google Scholar] [CrossRef]
  54. Hobbs, R.J.; Norton, D.A. Towards a Conceptual Framework for Restoration Ecology. Restor. Ecol. 1996, 4, 93–110. [Google Scholar] [CrossRef]
  55. Rui, J.P.; Li, J.B.; Wang, S.P.; An, J.X.; Liu, W.T.; Lin, Q.Y.; Yang, Y.F.; He, Z.L.; Li, X.Z. Responses of Bacterial Communities to Simulated Climate Changes in Alpine Meadow Soil of the Qinghai-Tibet Plateau. Appl. Environ. Microbiol. 2015, 81, 6070–6077. [Google Scholar] [CrossRef] [PubMed] [Green Version]
  56. Wang, J.T.; Cao, P.; Hu, H.W.; Li, J.; Han, L.L.; Zhang, L.M.; Zheng, Y.M.; He, J.Z. Altitudinal distribution patterns of soil bacterial and archaeal communities along mt. Shegyla on the Tibetan Plateau. Microb. Ecol. 2015, 69, 135–145. [Google Scholar] [CrossRef] [PubMed]
  57. Cui, Y.X.; Fang, L.C.; Guo, X.B.; Wang, X.; Zhang, Y.J.; Li, P.F.; Zhang, X.C. Ecoenzymatic stoichiometry and microbial nutrient limitation in rhizosphere soil in the arid area of the northern Loess Plateau, China. Soil Biol. Biochem. 2018, 116, 11–21. [Google Scholar] [CrossRef]
  58. Güsewell, S.; Gessner, M.O. N:P ratios influence litter decomposition and colonization by fungi and bacteria in microcosms. Funct. Ecol. 2009, 23, 211–219. [Google Scholar] [CrossRef]
  59. Davidson, E.; Verchot, L.; Cattânio, J.; Ackerman, I.; Carvalho, J. Effects of soil water content on soil respiration in forests and cattle pastures of eastern Amazonia. Biogeochemistry 2000, 48, 53–69. [Google Scholar] [CrossRef]
  60. Xu, M.; Qi, Y. Soil-surface CO2 efflux and its spatial and temporal variations in a young ponderosa pine plantation in northern California. Glob. Chang. Biol. 2001, 7, 667–677. [Google Scholar] [CrossRef] [Green Version]
  61. Wen, Z.; Zheng, H.; Zhao, H.; Xie, S.; Liu, L.; Ouyang, Z. Land-use intensity indirectly affects soil multifunctionality via a cascade effect of plant diversity on soil bacterial diversity. Glob. Ecol. Conserv. 2020, 23, e01061. [Google Scholar] [CrossRef]
  62. Tsyganov, A.N.; Milbau, A.; Beyens, L. Environmental factors influencing soil testate amoebae in herbaceous and shrubby vegetation along an altitudinal gradient in subarctic tundra (Abisko, Sweden). Eur. J. Protistol. 2013, 49, 238–248. [Google Scholar] [CrossRef]
  63. Bates, S.; Clemente, J.; Flores, G.; Walters, W.; Parfrey, L.; Knight, R.; Fierer, N. Global biogeography of highly diverse protistan communities in soil. ISME J. 2013, 7, 652–659. [Google Scholar] [CrossRef] [PubMed]
  64. Kim, M.; Lim, H.; Hyun, C.; Cho, A.; Noh, H.; Hong, S.; Kim, O. Local-scale variation of soil bacterial communities in ice-free regions of maritime Antarctica. Soil Biol. Biochem. 2019, 133, 165–173. [Google Scholar] [CrossRef]
  65. Stursova, M.; Zifcakova, L.; Leigh, M.B.; Burgess, R.; Baldrian, P. Cellulose utilization in forest litter and soil: Identification of bacterial and fungal decomposers. FEMS Microbiol. Ecol. 2012, 80, 735–746. [Google Scholar] [CrossRef] [PubMed]
  66. Rousk, J.; Baath, E. Fungal and bacterial growth in soil with plant materials of different C/N ratios. FEMS Microbiol. Ecol. 2007, 62, 258–267. [Google Scholar] [CrossRef] [PubMed] [Green Version]
  67. Marklein, A.; Houlton, B. Nitrogen inputs accelerate phosphorus cycling rates across a wide variety of terrestrial ecosystems. New Phytol. 2012, 193, 696–704. [Google Scholar] [CrossRef]
  68. Bryant, D.A.; Liu, Z.F.; Li, T.; Zhao, F.Q.; Garcia Costas, A.M.; Klatt, C.G.; Ward, D.M.; Frigaard, N.U.; Overmann, J. Comparative and functional genomics of anoxygenic green bacteria from the taxa Chlorobi, Chloroflexi, and Acidobacteria. In Functional Genomics and Evolution of Photosynthetic Systems; Advances in Photosynthesis and Respiration; Burnap, R., Vermaas, W., Eds.; Springer: Dordrecht, The Netherlands, 2012; Volume 3, pp. 47–102. [Google Scholar]
  69. Fierer, N.; Bradford, M.; Jackson, R. Toward an ecological classification of soil bacteria. Ecology 2007, 88, 1354–1364. [Google Scholar] [CrossRef] [PubMed]
  70. Agren, G.; Bosatta, N. Theoretical analysis of the long-term dynamics of carbon and nitrogen in soils. Ecology 1987, 68, 1181–1189. [Google Scholar] [CrossRef]
  71. Youssef, N.H.; Elshahed, M.S. Diversity rankings among bacterial lineages in soil. ISME J. 2009, 3, 305–313. [Google Scholar] [CrossRef]
  72. Serkebaeva, Y.; Kim, Y.; Liesack, W.; Dedysh, S. Pyrosequencing-based assessment of the bacteria diversity in surface and subsurface peat layers of a northern wetland, with focus on poorly studied phyla and candidate divisions. PLoS ONE. 2013, 8, e63994. [Google Scholar] [CrossRef] [Green Version]
  73. Vecherskaya, M.; Dijkema, C.; Saad, H.; Stams, A. Microaerobic and anaerobic metabolism of a Methylocystis parvus strain isolated from a denitrifying bioreactor. Environ. Microbiol. Rep. 2009, 1, 442–449. [Google Scholar] [CrossRef]
  74. Ai, C.; Liang, G.; Sun, J.; Wang, X.; He, P.; Zhou, W.; He, X. Reduced dependence of rhizosphere microbiome on plant-derived carbon in 32-year long-term inorganic and organic fertilized soils. Soil Biol. Biochem. 2015, 80, 70–78. [Google Scholar] [CrossRef]
  75. Shen, C.; Ni, Y.; Liang, W.; Wang, J.; Chu, H. Distinct soil bacterial communities along a small-scale elevational gradient in alpine tundra. Front. Microbiol. 2015, 6, 00582. [Google Scholar] [CrossRef] [Green Version]
  76. Marshall, V. Impacts of forest harvesting on biological processes in northern forest soils. For. Ecol. Manag. 2000, 133, 43–60. [Google Scholar] [CrossRef]
  77. Jones, R.; Robeson, M.; Lauber, C.; Hamady, M.; Knight, R.; Fierer, N. A comprehensive survey of soil acidobacterial diversity using pyrosequencing and clone library analyses. ISME J. 2009, 3, 442–453. [Google Scholar] [CrossRef] [PubMed]
  78. Dimitriu, P.; Grayston, S. Relationship between soil properties and patterns of bacterial beta-diversity across reclaimed and natural boreal forest soils. Microb. Ecol. 2010, 59, 563–573. [Google Scholar] [CrossRef]
  79. Chu, H.; Fierer, N.; Lauber, C.; Caporaso, J.; Knight, R.; Grogan, P. Soil bacterial diversity in the Arctic is not fundamentally different from that found in other biomes. Environ. Microbiol. 2010, 12, 2998–3006. [Google Scholar] [CrossRef] [PubMed]
  80. BÁRcenas-Moreno, G.; GÓMez-BrandÓN, M.; Rousk, J.; BÅÅTh, E. Adaptation of soil microbial communities to temperature: Comparison of fungi and bacteria in a laboratory experiment. Glob. Chang. Biol. 2009, 15, 2950–2957. [Google Scholar] [CrossRef]
  81. Xiong, J.; Ye, X.; Wang, K.; Chen, H.; Hu, C.; Zhu, J.; Zhang, D. Biogeography of the sediment bacterial community responds to a nitrogen pollution gradient in the East China Sea. Appl. Environ. Microbiol. 2014, 80, 1919–1925. [Google Scholar] [CrossRef] [Green Version]
  82. Hui, N.; Jumpponen, A.; Francini, G.; Kotze, D.; Liu, X.; Romantschuk, M.; Strömmer, R.; Setälä, H. Soil microbial communities are shaped by vegetation type and park age in cities under cold climate. Environ. Microbiol. 2017, 19, 1281–1295. [Google Scholar] [CrossRef]
Figure 1. Distribution of bacterial communities in the different rehabilitation stages at different Phylum (a), Class (b), and Order (c) levels. SG: Shrub-grassland; BF: Broad-leaved; MF: Coniferous broad-leaved; PF: Primary forest.
Forests 12 00505 g001aForests 12 00505 g001b
Figure 2. Principal coordinates analysis (PCoA) of Bray–Curtis distances of the bacterial communities among the four succession stages. (R2 = 0.422, p = 0.001). SG: Shrub-grassland; BF: Broad-leaved; MF: Coniferous broad-leaved; PF: Primary forest.
Forests 12 00505 g002
Figure 3. Bray–Curtis distance of bacterial communities at the operational taxonomic unit (OTU) level between rehabilitation age and primary forest communities. SG: Shrub-grassland; BF: Broad leaved; MF: Coniferous broad-leaved; PF: Primary forest.
Forests 12 00505 g003
Figure 4. Redundancy analysis (RDA) showing the effects of environmental variables on the bacterial communities among the four succession stages. SG: Shrub-grassland; BF: Broad-leaved; MF: Coniferous broad-leaved; PF: Primary forest. pH, soil pH; EC, electrical conductivity; NH4+-N, Ammonium; NO3-N, nitrate; TP, total phosphorus; AP, available phosphorus; WCS, soil water content; AGE, rehabilitation age; C/N, soil C/N ratio.
Forests 12 00505 g004
Figure 5. Relative importance of the significant independent variables explaining the variance in abundance of the different taxonomic groups ((a), major bacterial phyla for Acidobacteria, Proteobacteria, Actinobacteria, Bacteroidetes and Nitrospirae; (b), major bacterial phyla for Verrucomicrobia, Gemmatimonadetes, Chloroflexi and Candidate_division_WPS-1). Partial regression coefficients are written on the bars and shown only for statistically significant variables of pH, soil pH; EC, electrical conductivity; SOC, soil organic carbon; TN, total nitrogen; NH4+-N, ammonium; NO3-N, nitrate; TP, total phosphorus; AP, available phosphorus; TK, total potassium; AK, available potassium; WCS, soil water content; AGE, rehabilitation age; CN, soil C/N ratio. N = 32 for all groups expect two in shrub-grassland number 8 and coniferous broad-leaved. Number 8, for which n = 30. ·, p < 0.1; *, p < 0.01; **, p < 0.001.
Forests 12 00505 g005
Figure 6. Directed graph of the partial least squares path model (PLS-PM). Each box represents an observed variable. Path coefficients are reflected in the arrow width with red and black indicating positive and negative effects, respectively. For the best model represented here, the GoF value was 0.28. Partial regression coefficients are written on the bars and shown variables of pH, soil pH; AP, available phosphorus; WCS, soil water content; CN, soil C/N ratio; BC, bacterial community.
Forests 12 00505 g006
Figure 7. Rehabilitation age-discriminatory taxa for defining secondary succession level. (a) The top 30 rehabilitation age-discriminatory bacterial taxa and their correlation with rehabilitation age. Species are shown in descending order of their importance to the accuracy of the model. Importance was determined based on the percentage increase in mean-squared error of the microbiota rehabilitation age prediction when the relative abundance values of each taxon were randomly permuted. (b) The consistency (r = 0.801, p < 0.001) between the observed and diagnosed values is based on the profiles of rehabilitation age-discriminatory taxa in the secondary succession level.
Forests 12 00505 g007
Table 1. Soil properties under different vegetation types.
SGBFMFPF
pH6.16 ± 0.568 a5.27 ± 0.31 b5.18 ± 0.23 b,c4.76 ± 0.41 c
EC (μs/cm)128 ± 27.08 a123.75 ± 56.37 a136.97 ± 22.84 a109.53 ± 32.17 a
WCS (%)44.36 ± 11.64 a44.59 ± 8.83 a44.34 ± 4.33 a45.2 ± 5.83 a
SOC (%)11.42 ± 5.79 a,b12.05 ± 4.71 a,b8.12 ± 2.75 b14.68 ± 5.56 a
TN (%)0.84 ± 0.32 a,b0.93 ± 0.32 a,b0.65 ± 0.18 b1.02 ± 0.35 a
TP (g/kg)0.99 ± 0.27 a1.10 ± 0.32 a1.14 ± 0.37 a1.02 ± 0.17 a
TK (g/kg)10.93 ± 4.14 b12.23 ± 3.41 a,b14.90 ± 2.62 a10.08 ± 2.73 b
NH4+-N (mg/kg)7.61 ± 1.82 a6.09 ± 2.20 a6.66 ± 2.62 a7.87 ± 1.84 a
NO3-N (mg/kg)1.89 ± 1.17 b4.36 ± 1.79 a3.80 ± 2.56 a,b2.94 ± 1.69 a,b
AP (mg/kg)15.29 ± 7.56 b17.22 ± 4.92 b13.52 ± 3.14 b31.57 ± 8.92 a
AK (g/kg)0.20 ± 0.08 b0.29 ± 0.07 a0.26 ± 0.08 a0.27 ± 0.04 a
C/N13.26 ± 2.50 a,b12.67 ± 0.97 a,b12.25 ± 0.94 b14.19 ± 1.13 a
NOTE: Values are the means ± SE (n = 8). Different lowercase letters indicate significant difference among four treatment in the different rehabilitation stages (p < 0.05). pH, soil pH; EC, Electrical conductivity; WCS, Soil water content; SOC, Soil organic carbon; TN, total nitrogen; TP, total phosphorus; TK, total potassium; NH4+-N, Ammonium; NO3-N, nitrate; AP, available phosphorus; AK, available potassium; CN, Soil C/N ratio. SG: Shrub-grassland; BF: Broad leaved; MF: Coniferous broadleaved; PF: Primary forest.
Table 2. Pairwise community dissimilarity test of the soil bacterial communities using analysis of similarity (ANOSIM) based on Bray–Curtis distance.
SGBFMFPF
SG 0.6030.5650.859
BF0.001 0.1810.891
MF0.0010.066 0.958
PF0.0010.0010.003
Note: Top diagonal cells are r values, and lower diagonal cells are p values. Bold values represent significant differences (p < 0.05) between bacterial communities in pairs of sampling groups. SG: Shrub-grassland; BF: Broad leaved; MF: Coniferous broad-leaved; PF: Primary forest.
Table 3. Distance-based multivariate analysis for a linear model (DISTLM) results of bacterial community data against four predictor variables selected for inclusion in the model for all sites (9999 permutations).
VariableSS (Trace)Pseudo-FpPropCumulative
pH5823.222510.75930.0010.27760.2776
AP1665.03963.33270.0030.07940.357
WCS1425.81233.0730.0030.0680.4249
C/N926.71412.08030.0240.04420.4691
Rehabilitation stage510.60141.15320.24800.02430.4935
Publisher’s Note: MDPI stays neutral with regard to jurisdictional claims in published maps and institutional affiliations.

