Nanopore-Level Wood-Water Interactions—A Molecular Simulation Study

Abstract
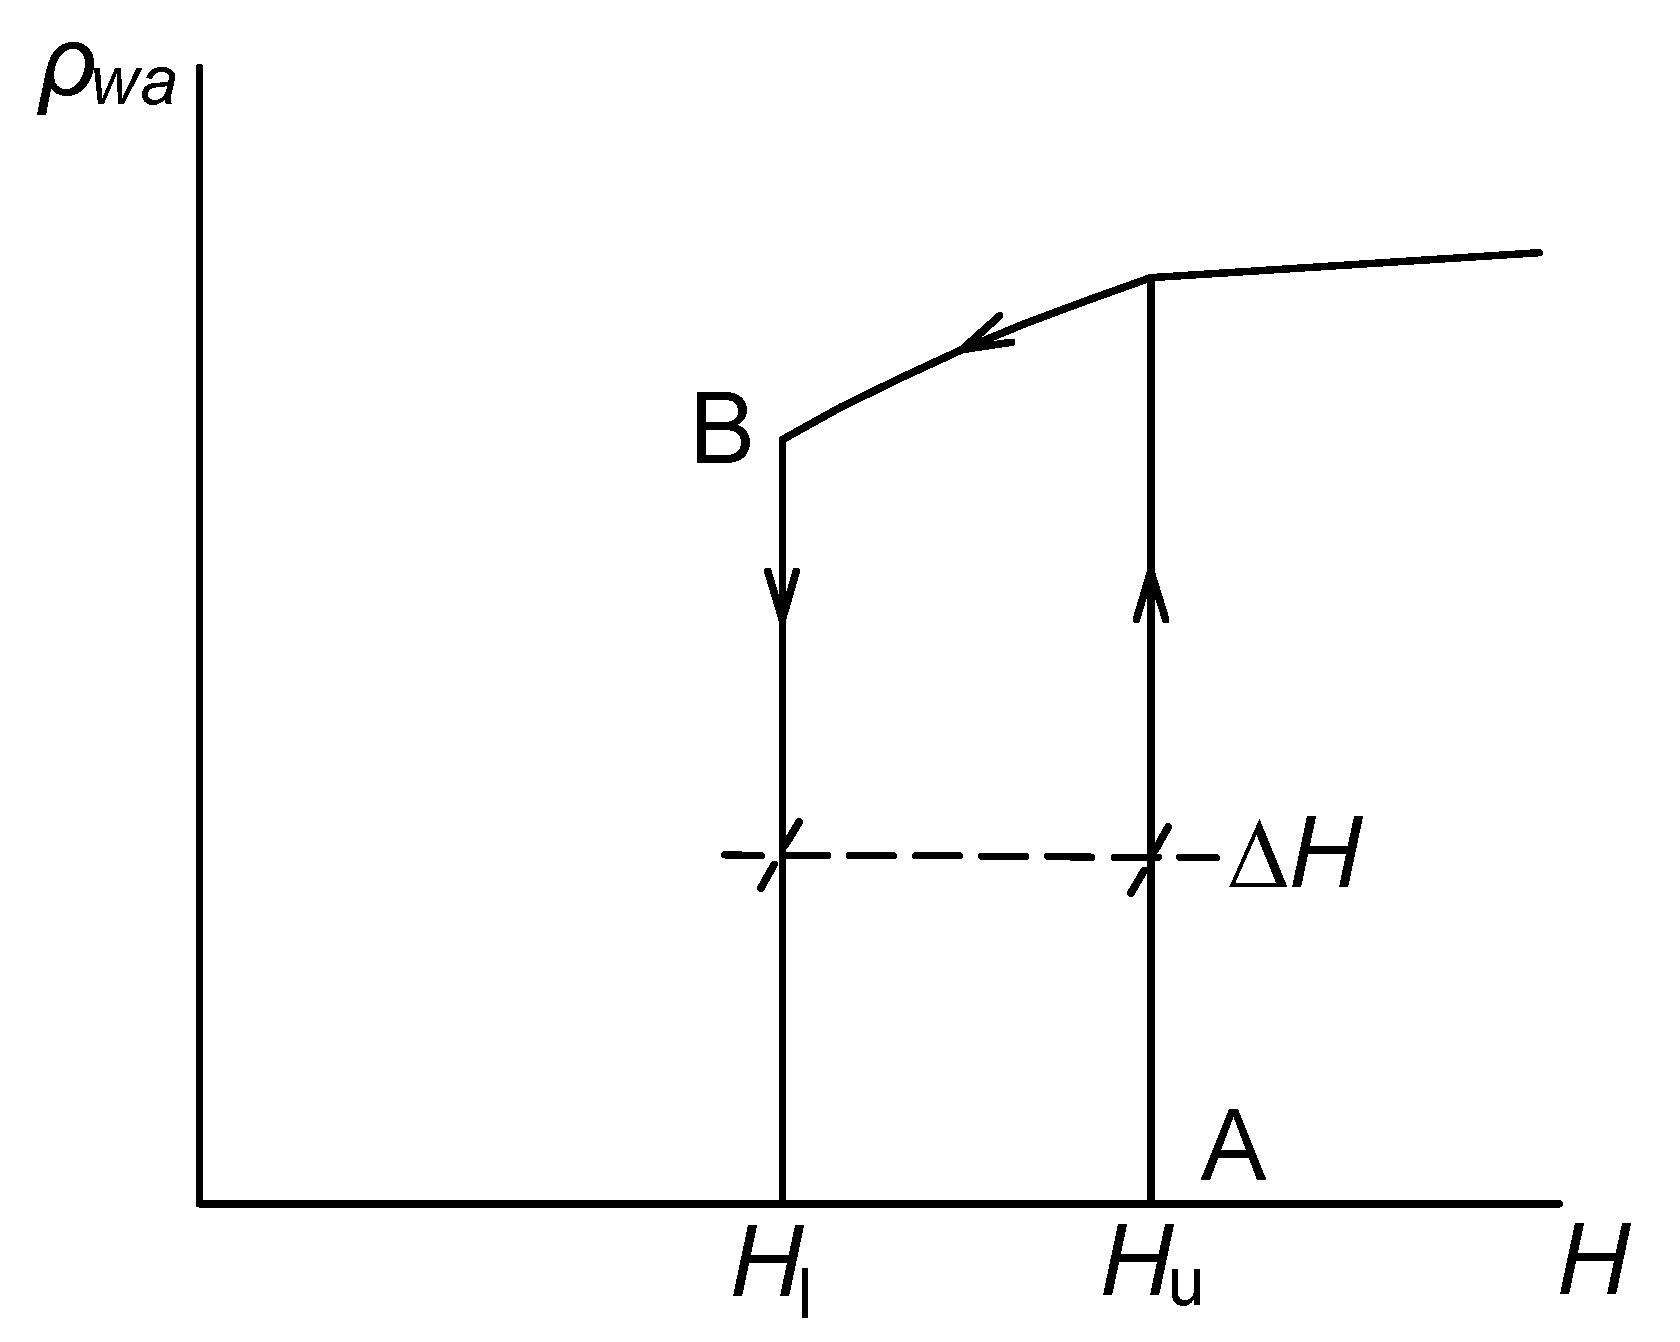
:1. Introduction
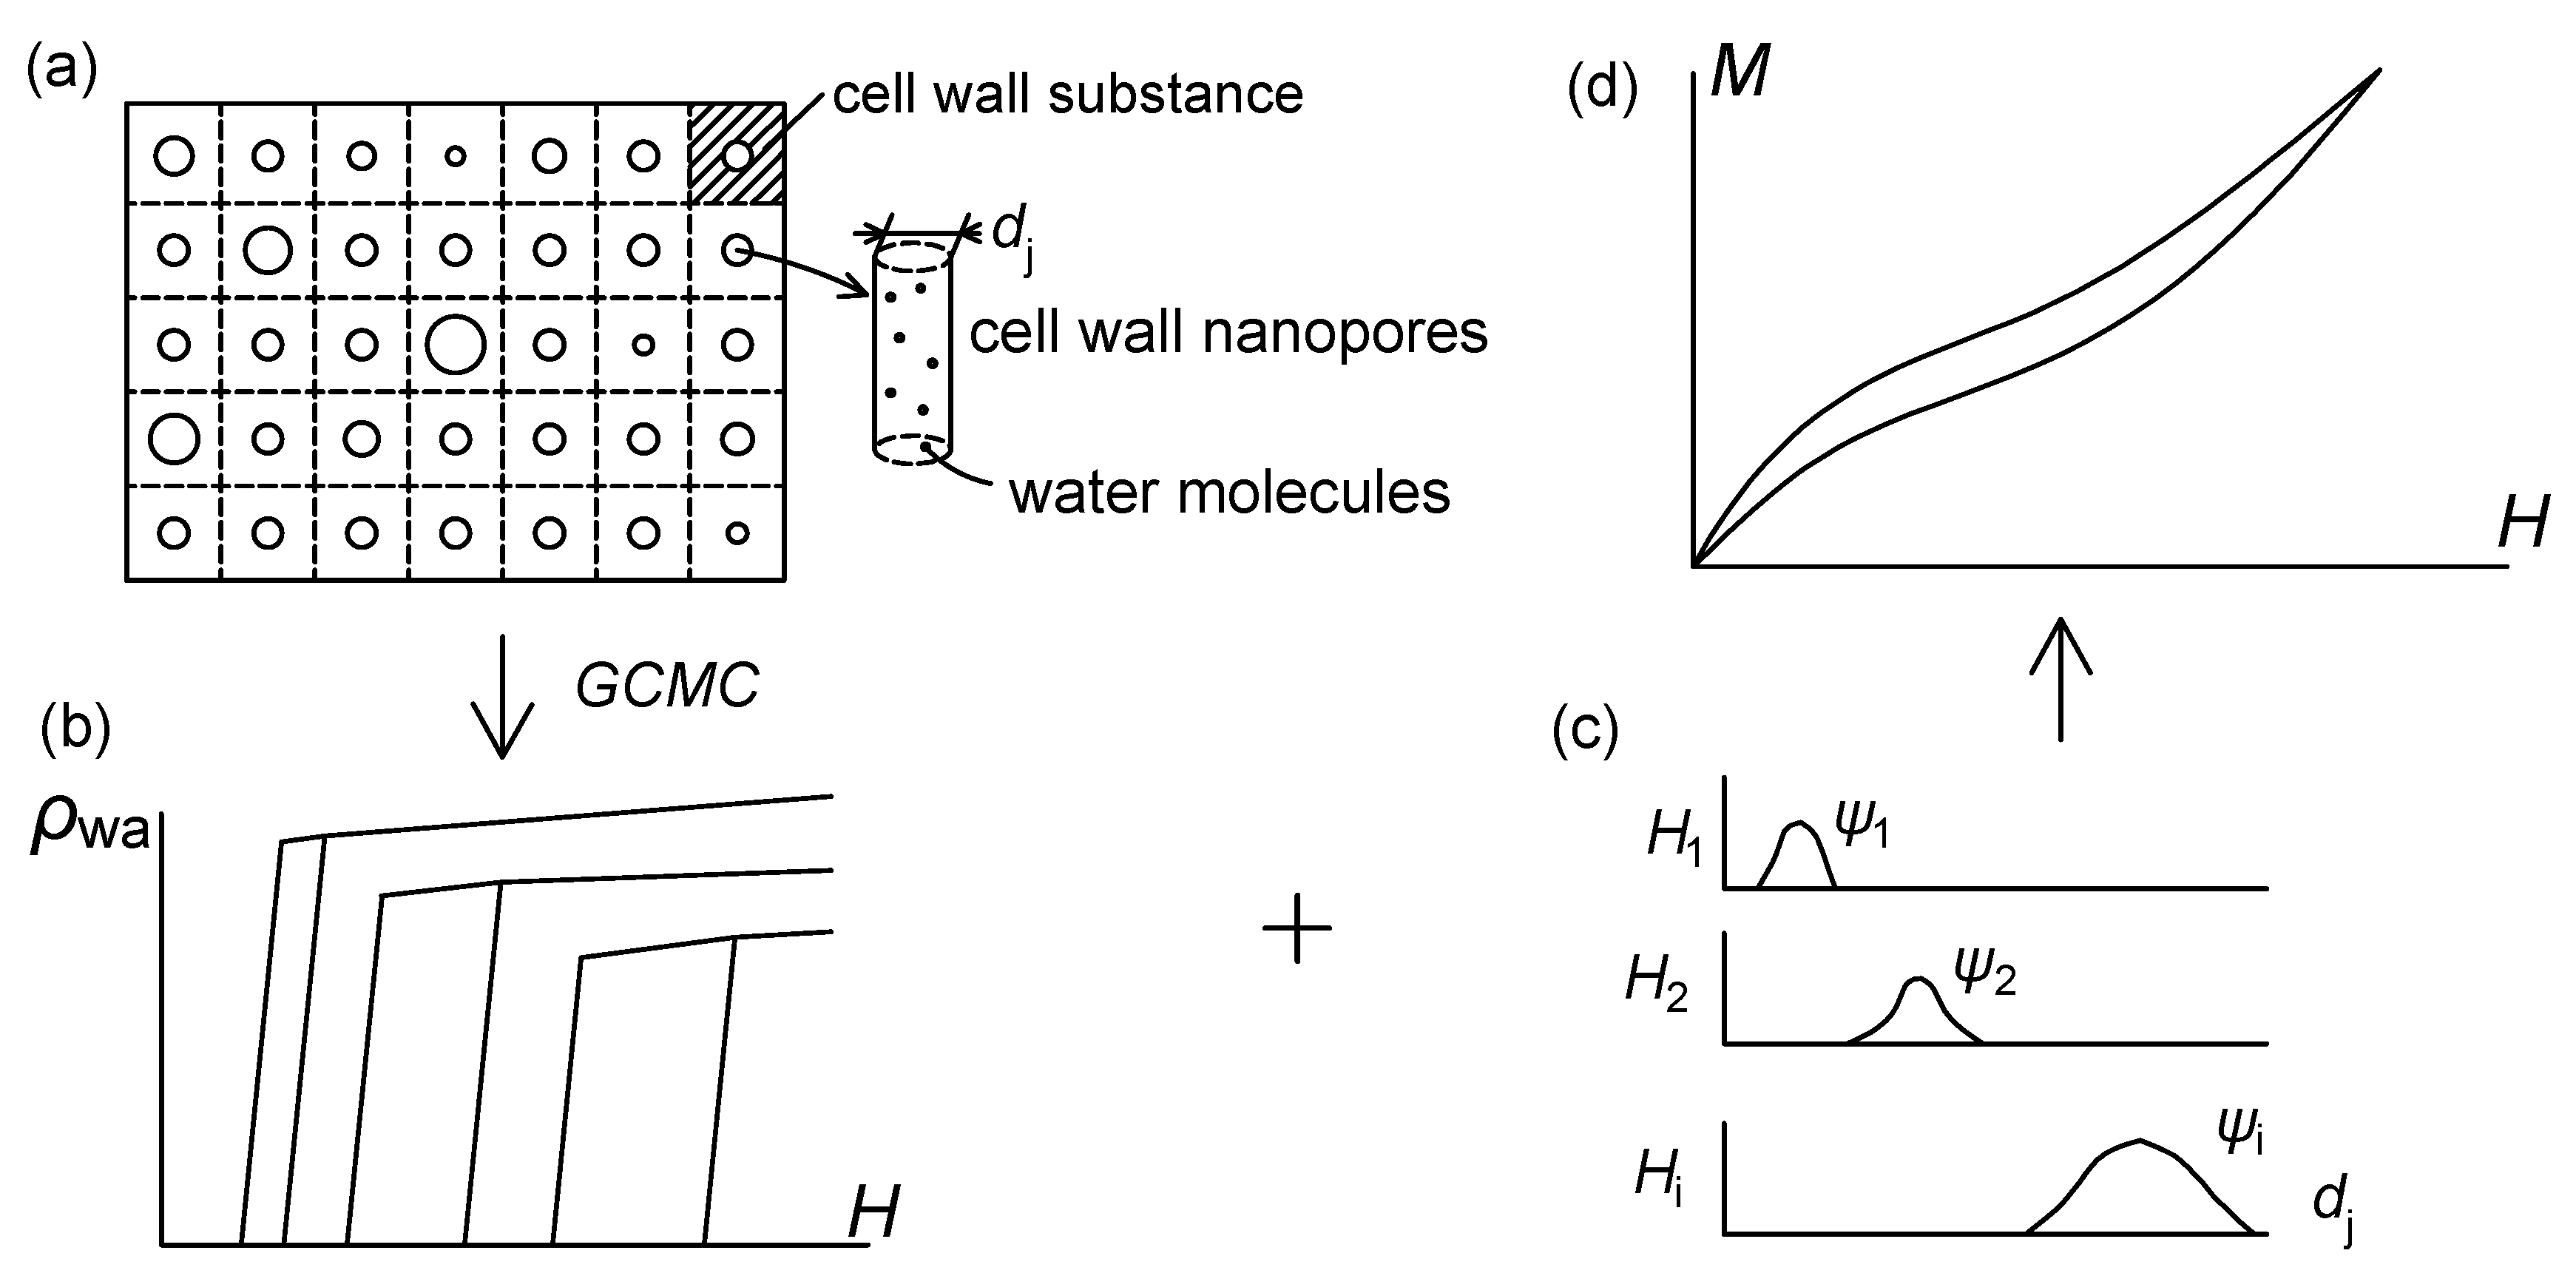
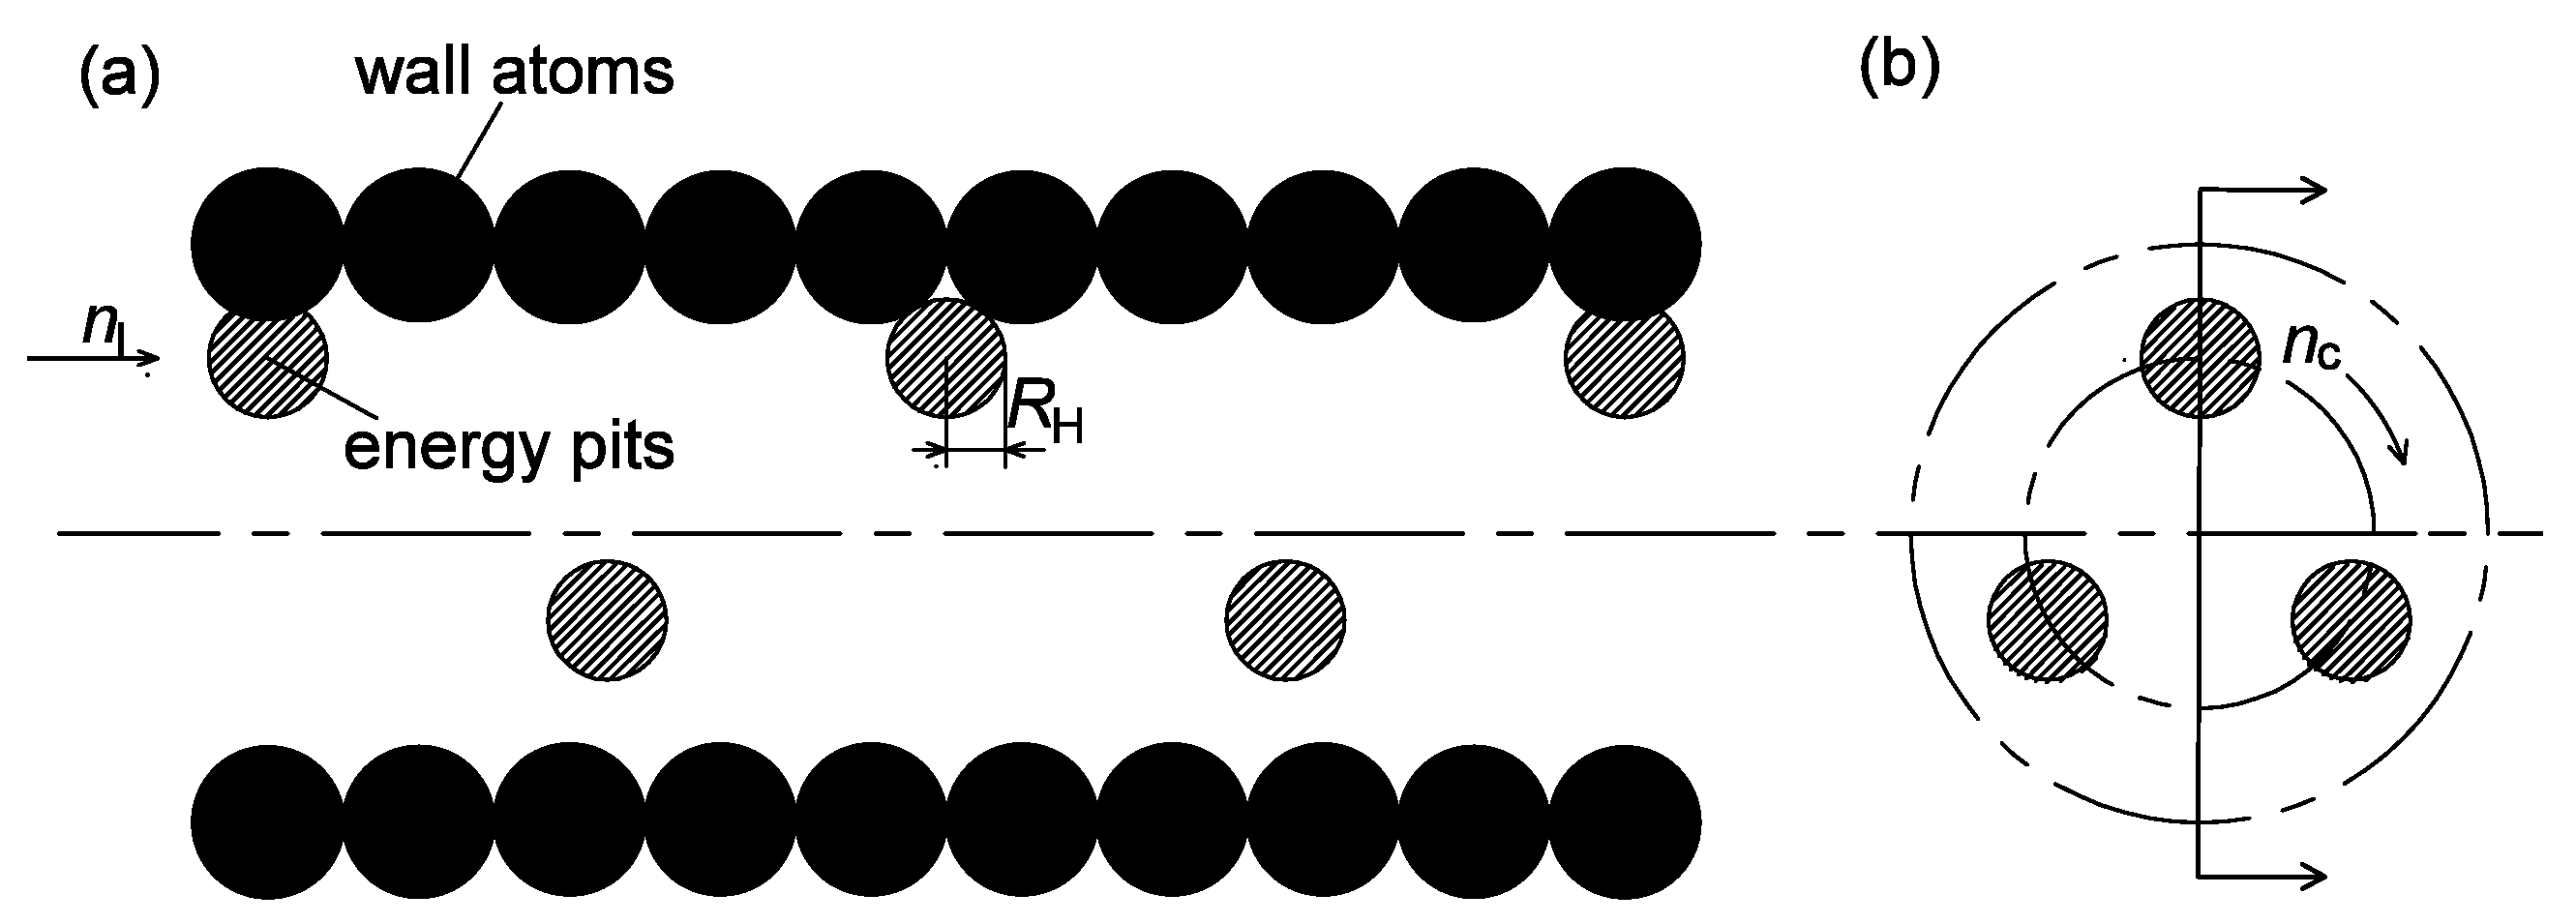
2. Simulation Model and Method
3. Results and Discussion
3.1. The Differences between the Shapes of Simulated and Experimental Sorption Isotherms
3.2. The Validity of the Simulation Model
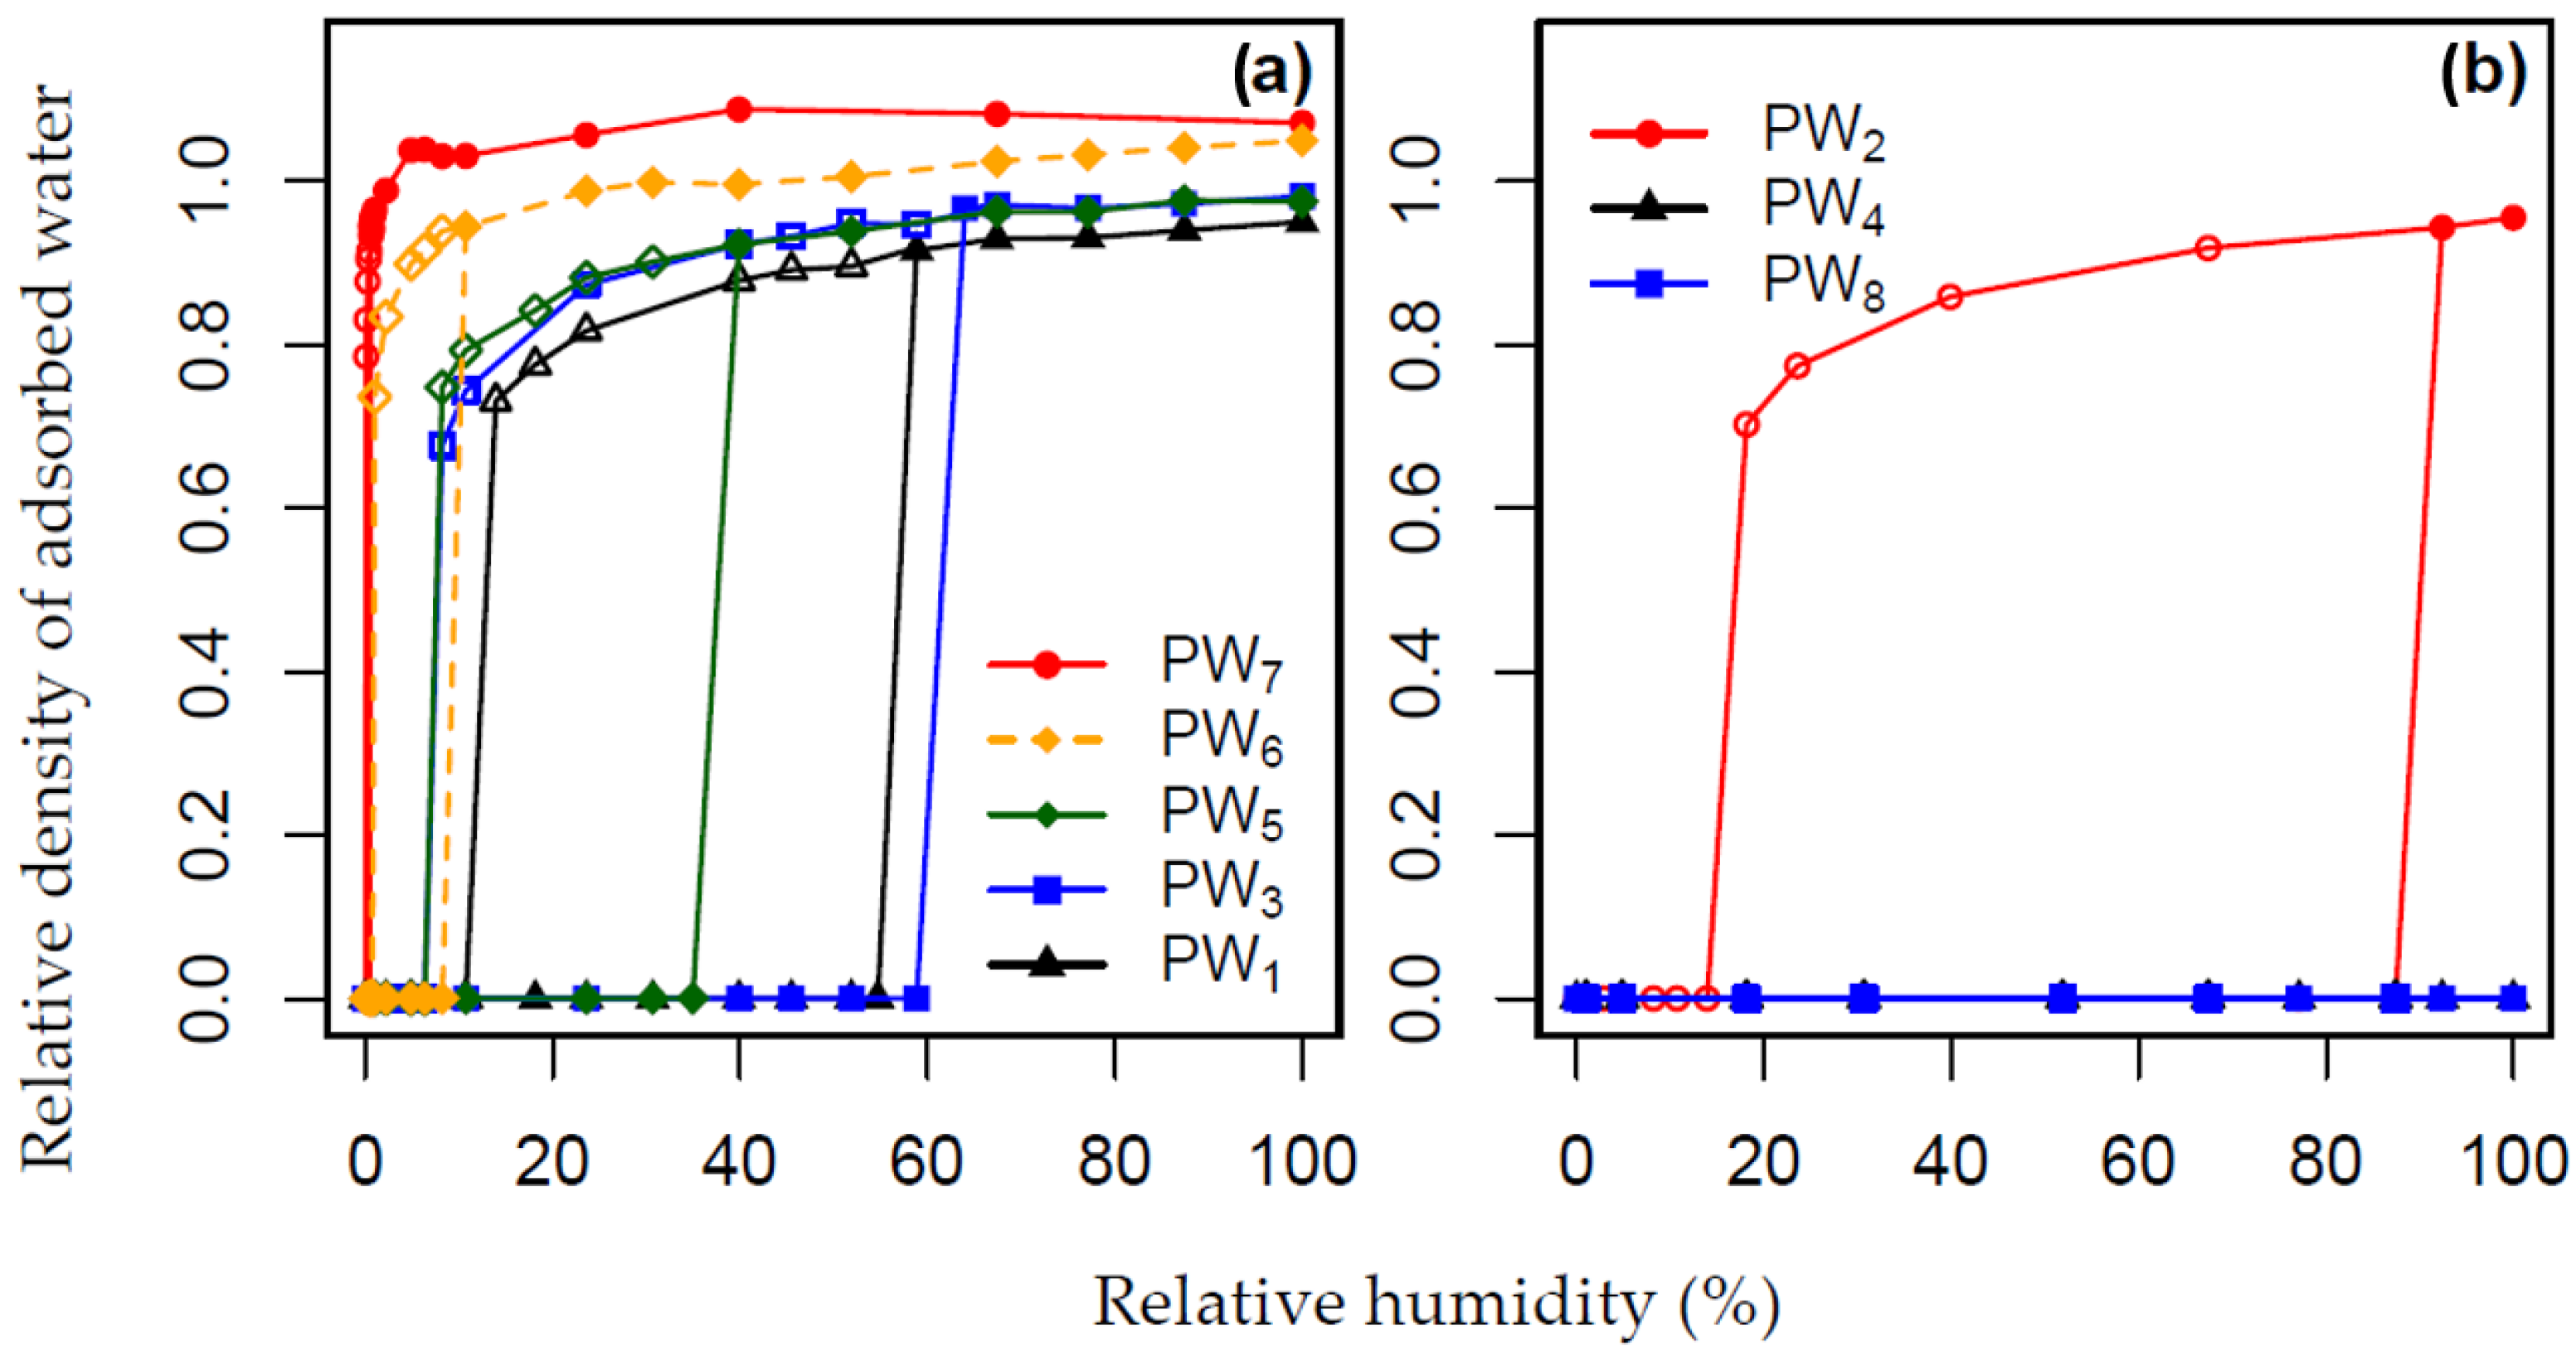
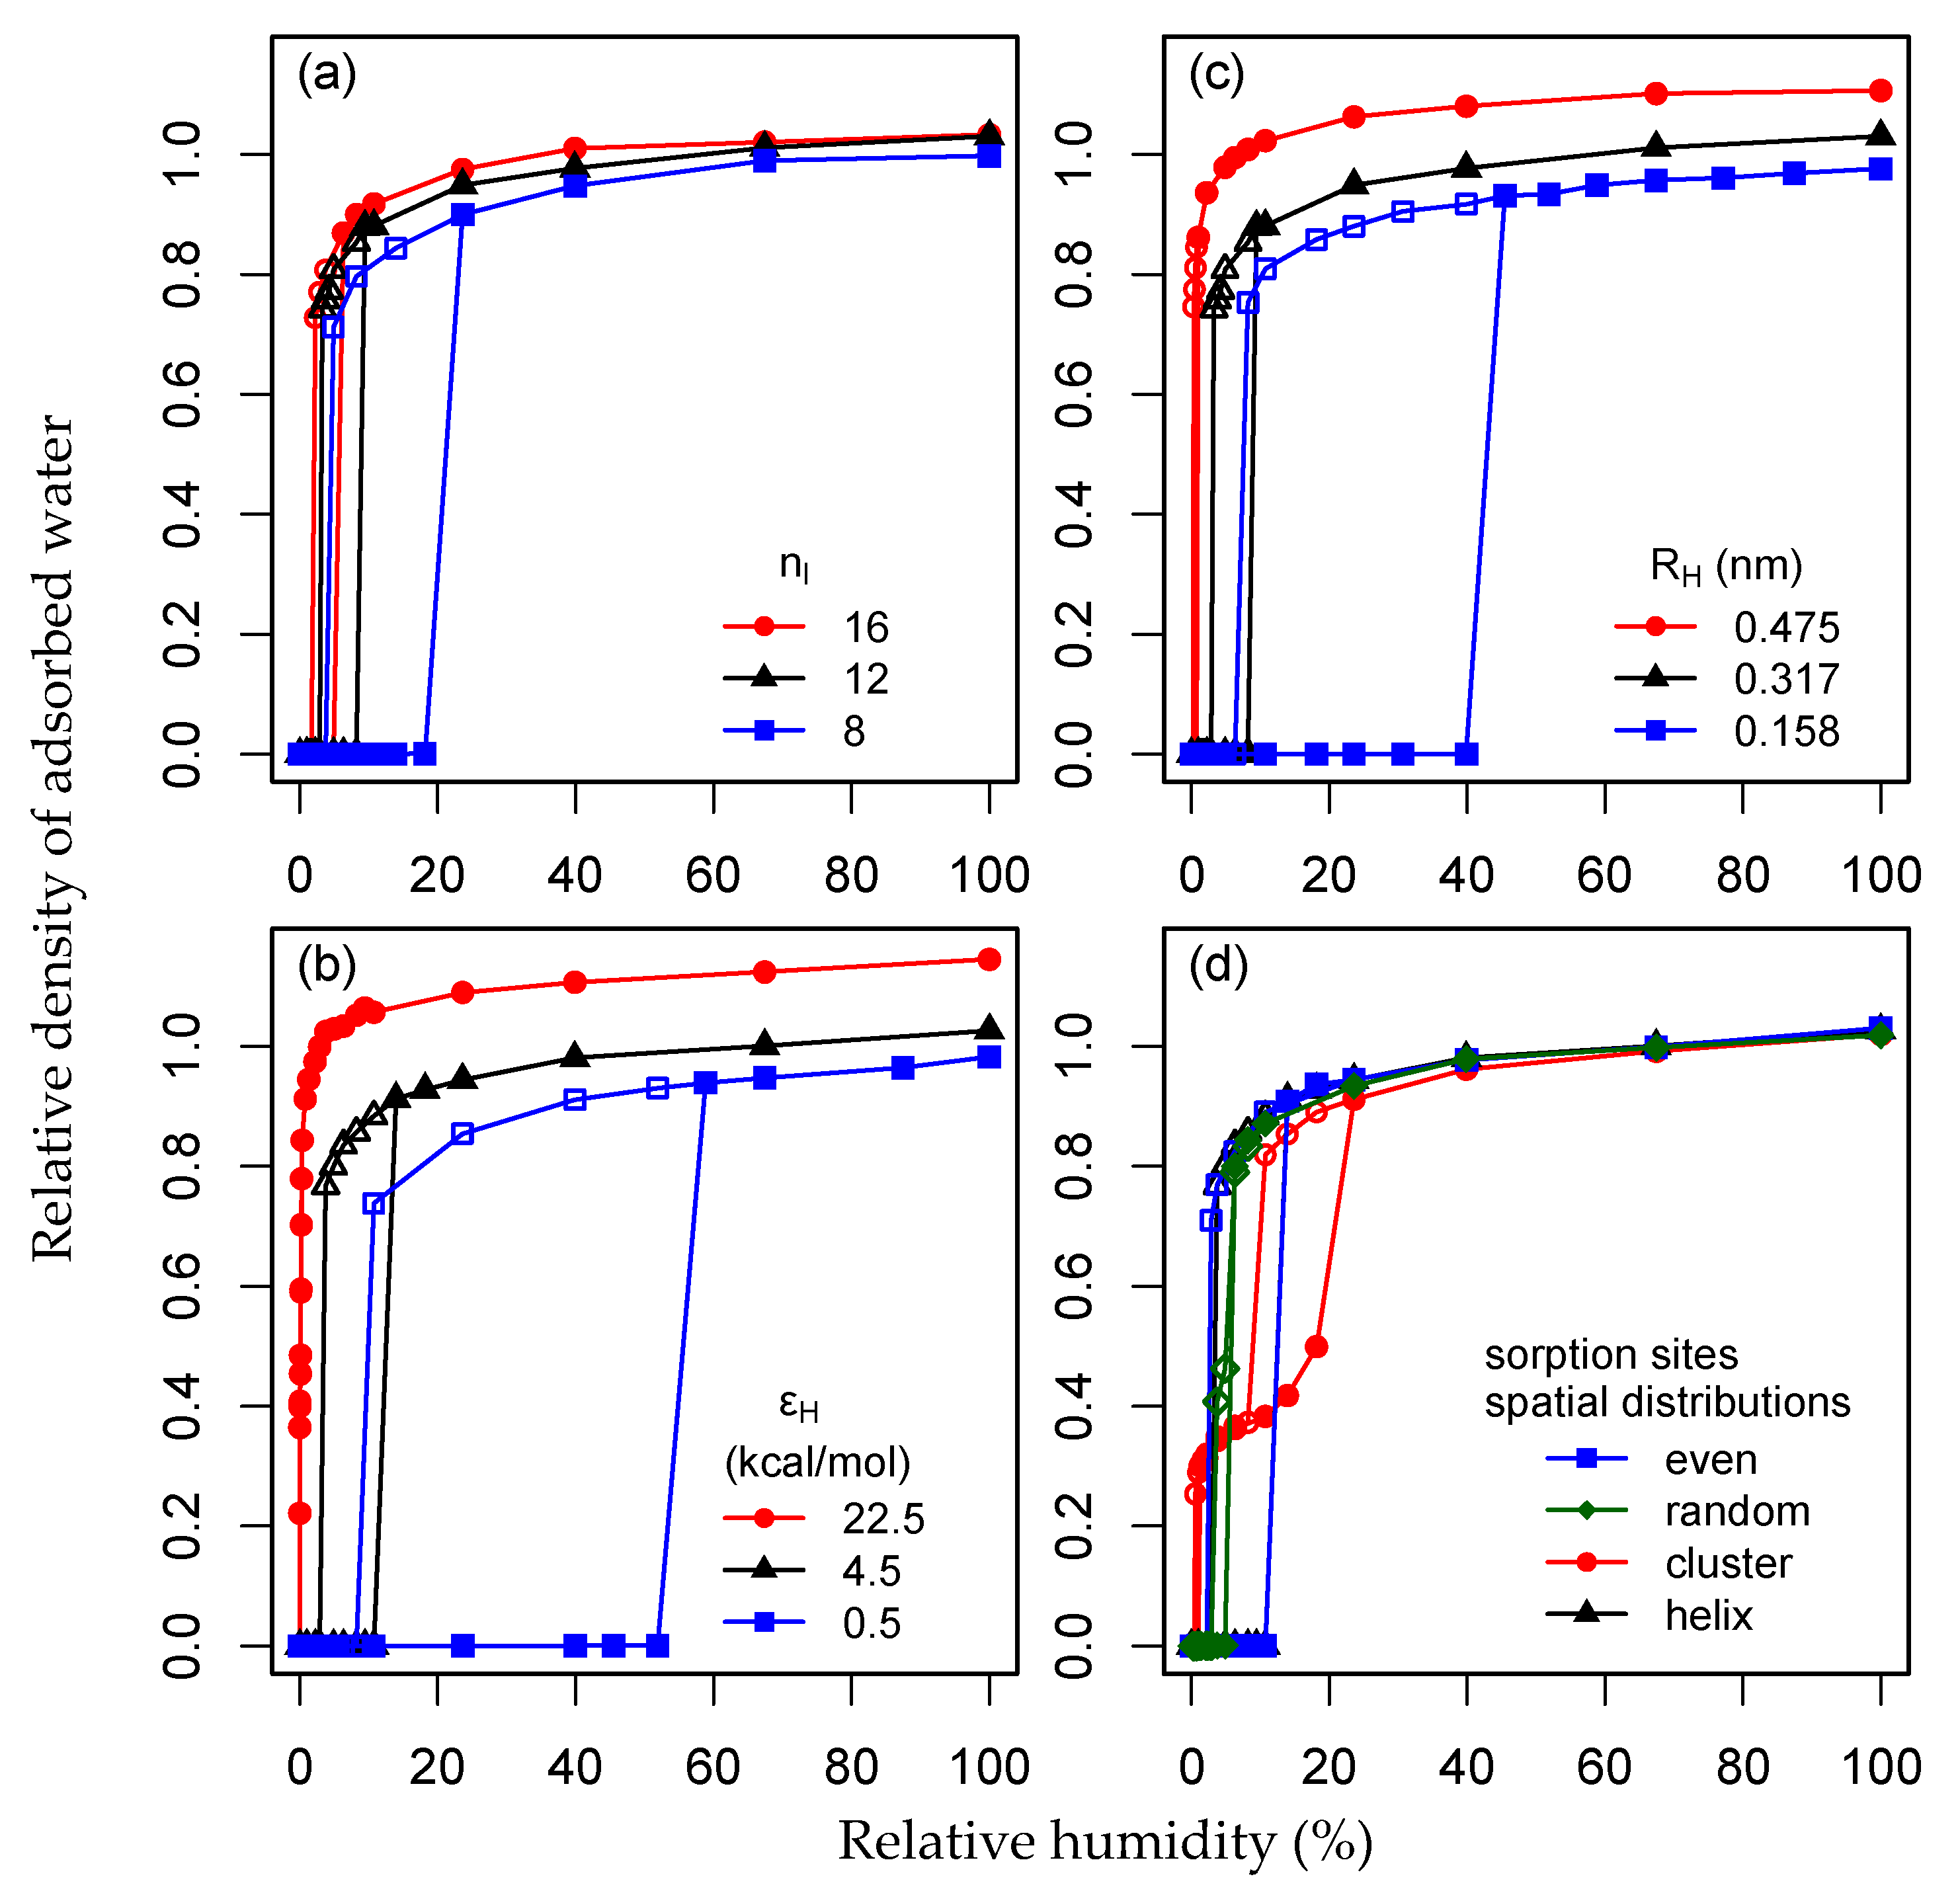
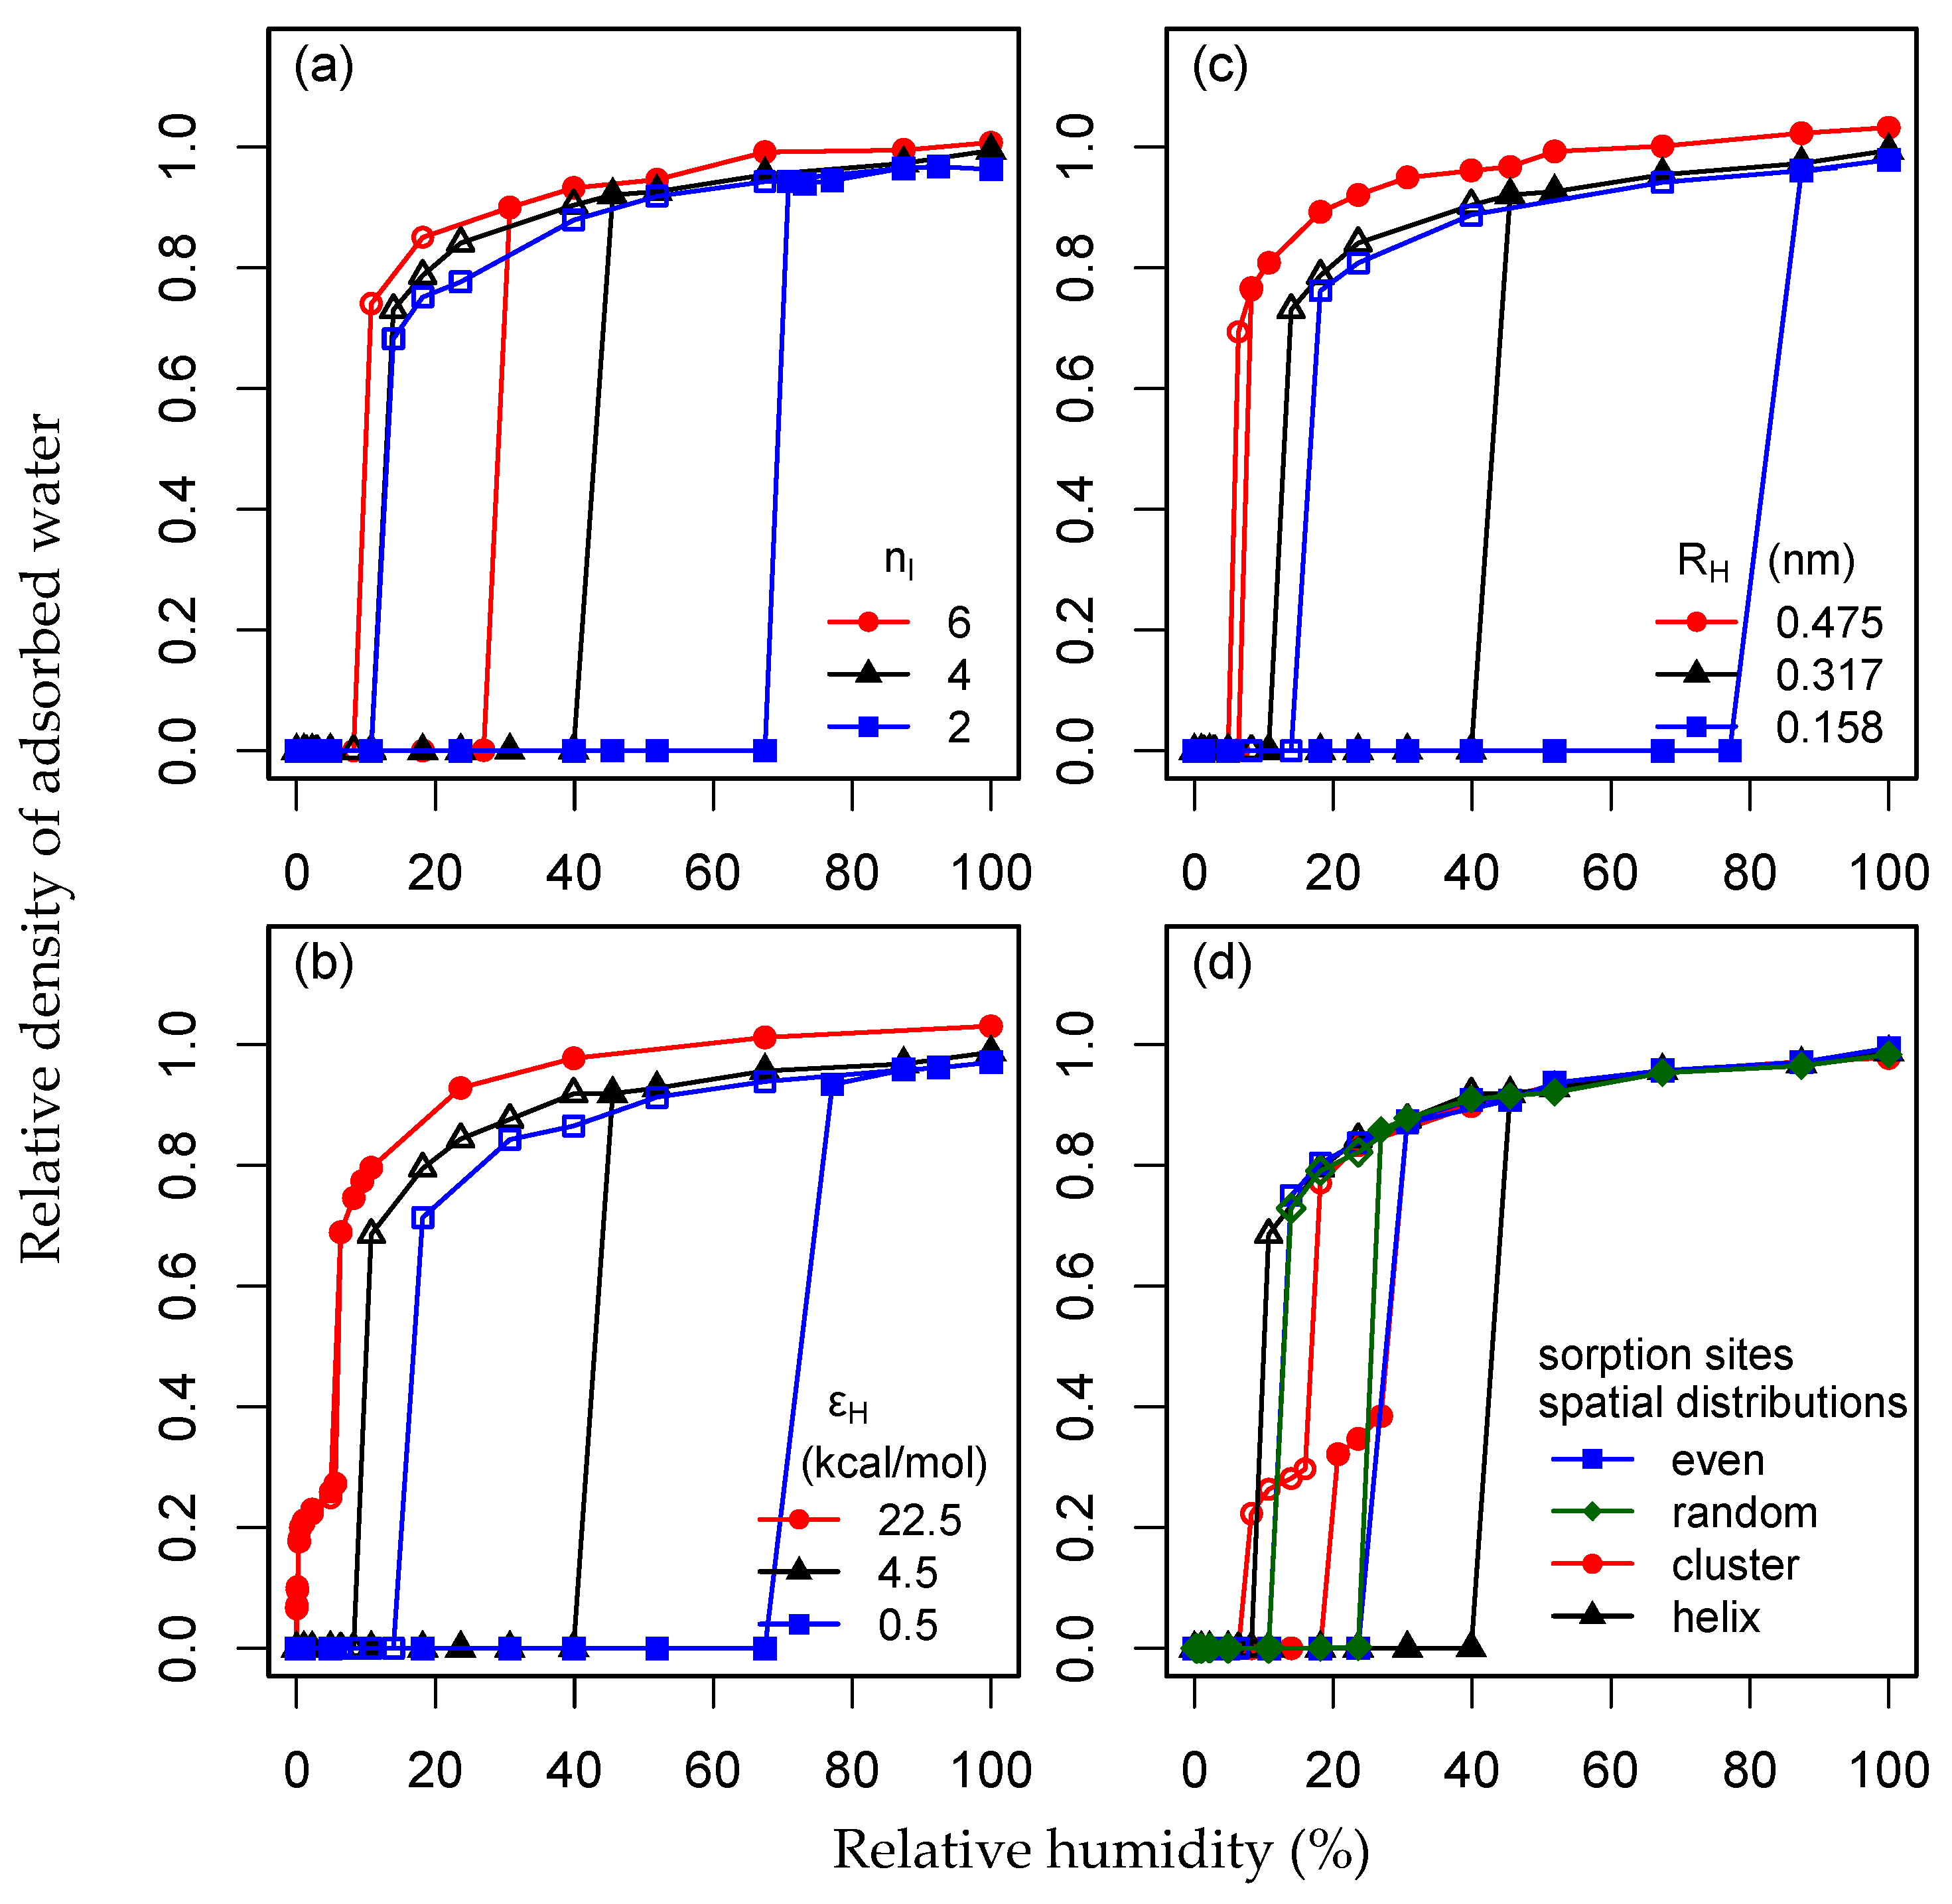
3.3. The Effect of Wood-Water Interaction Strength on Simulated Sorption Isotherms
3.4. The Effect of Sorption Sites on Simulated Sorption Isotherms
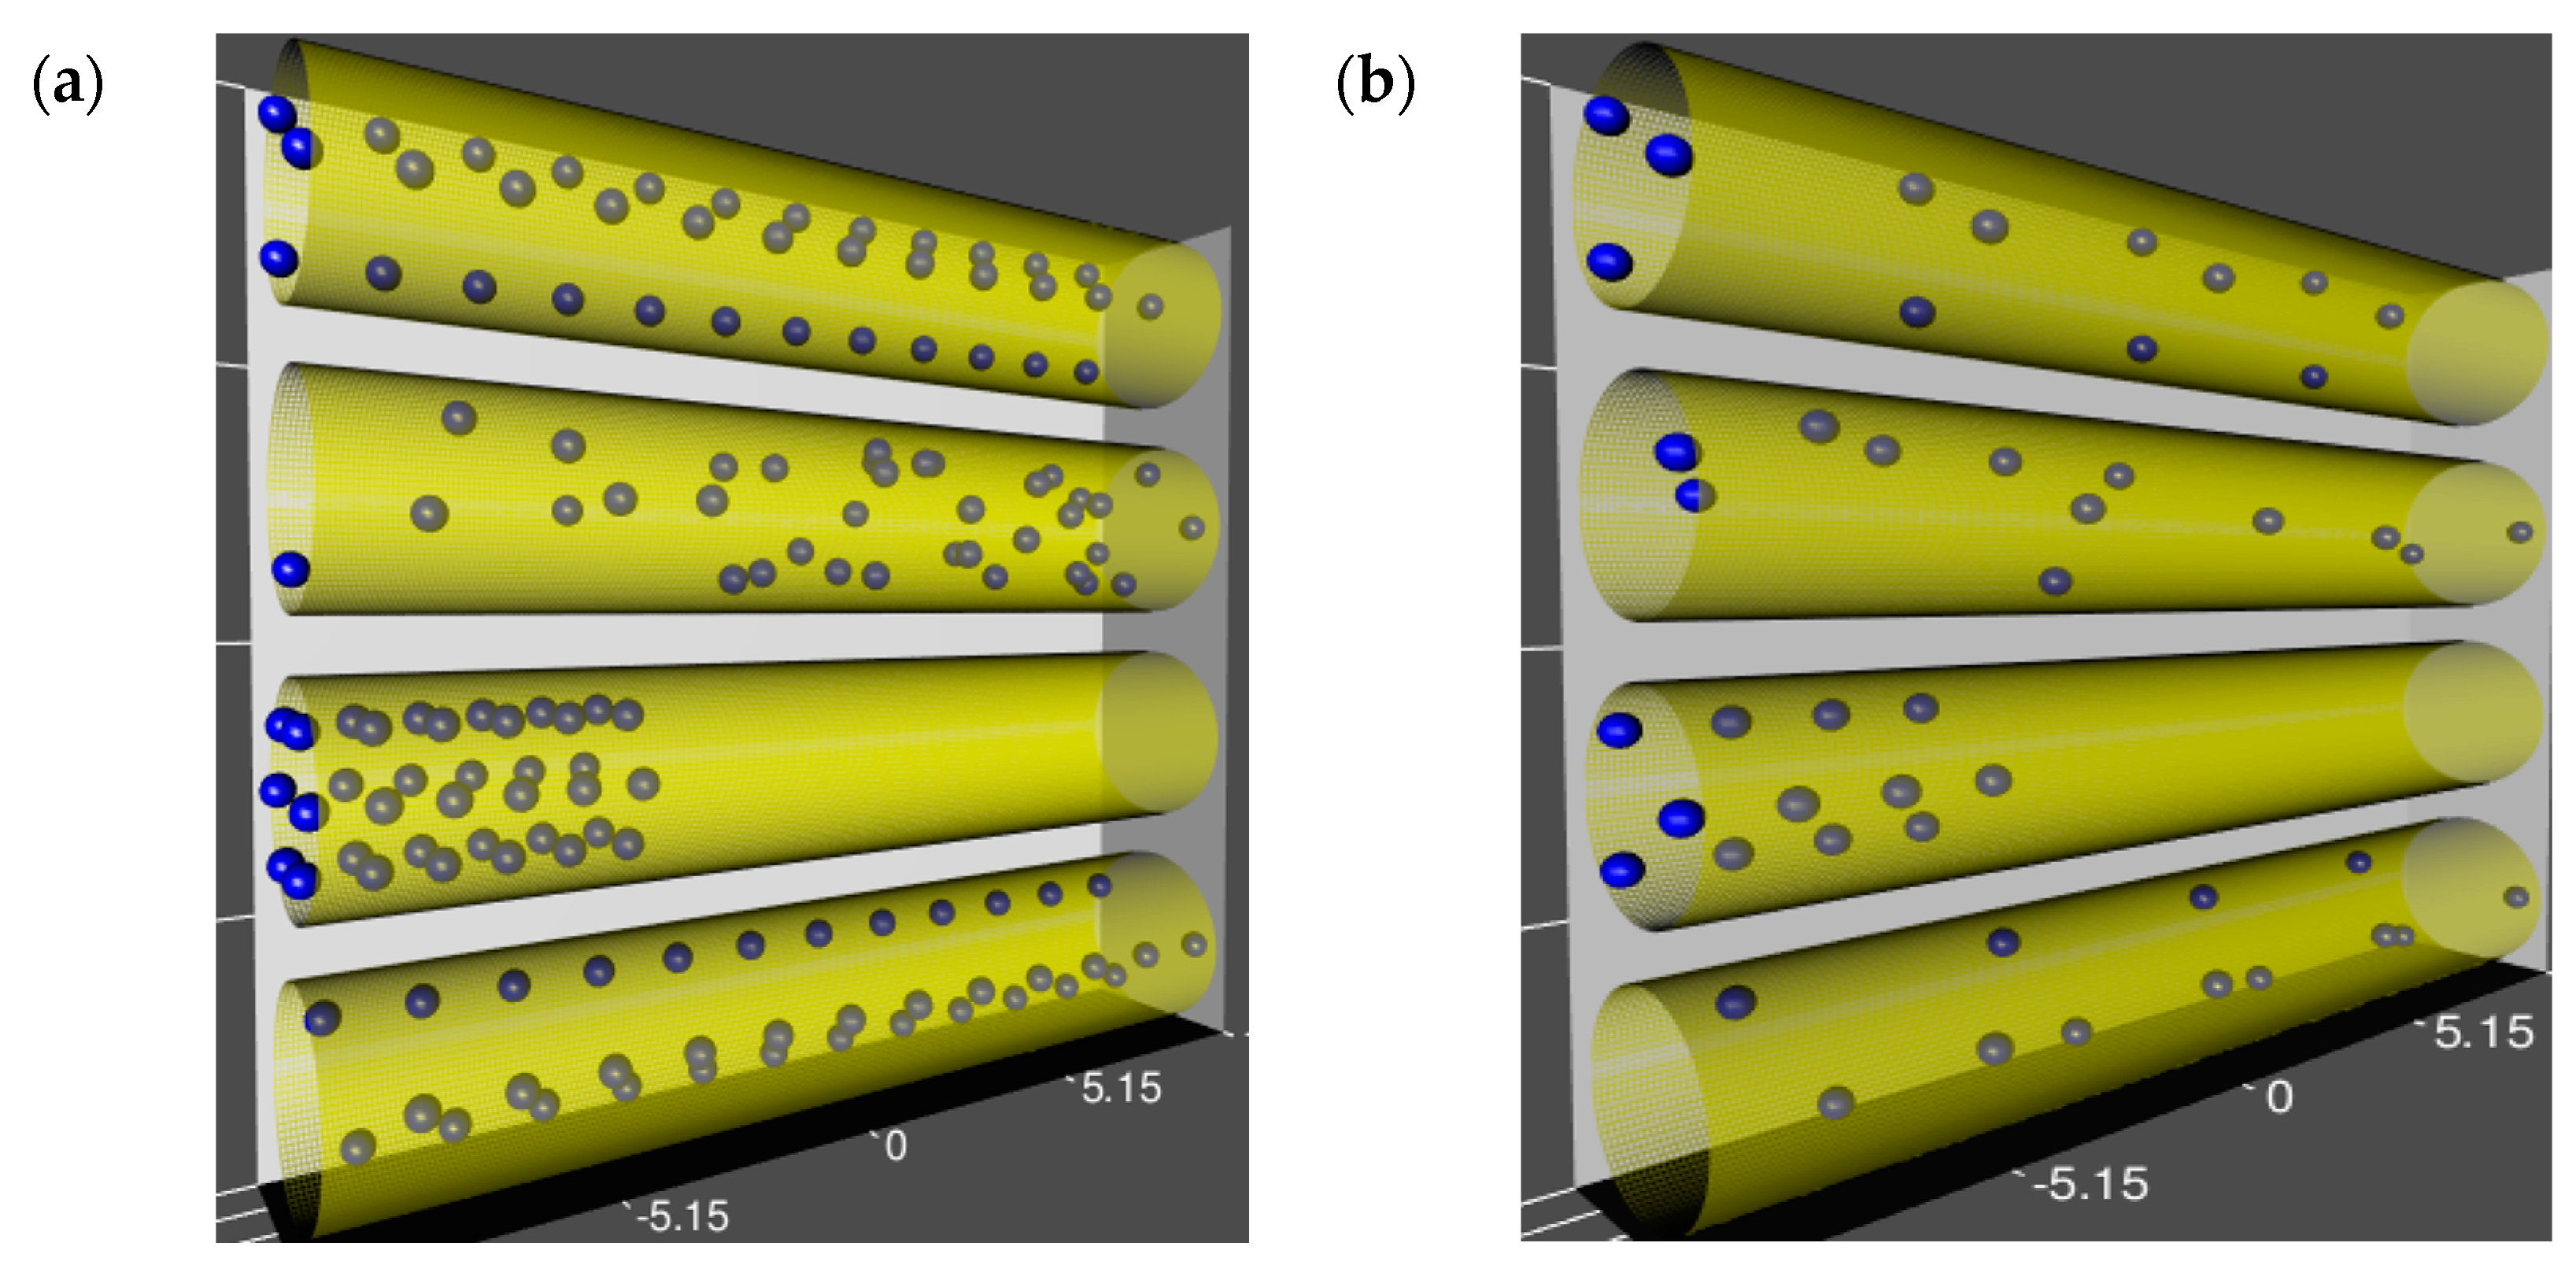
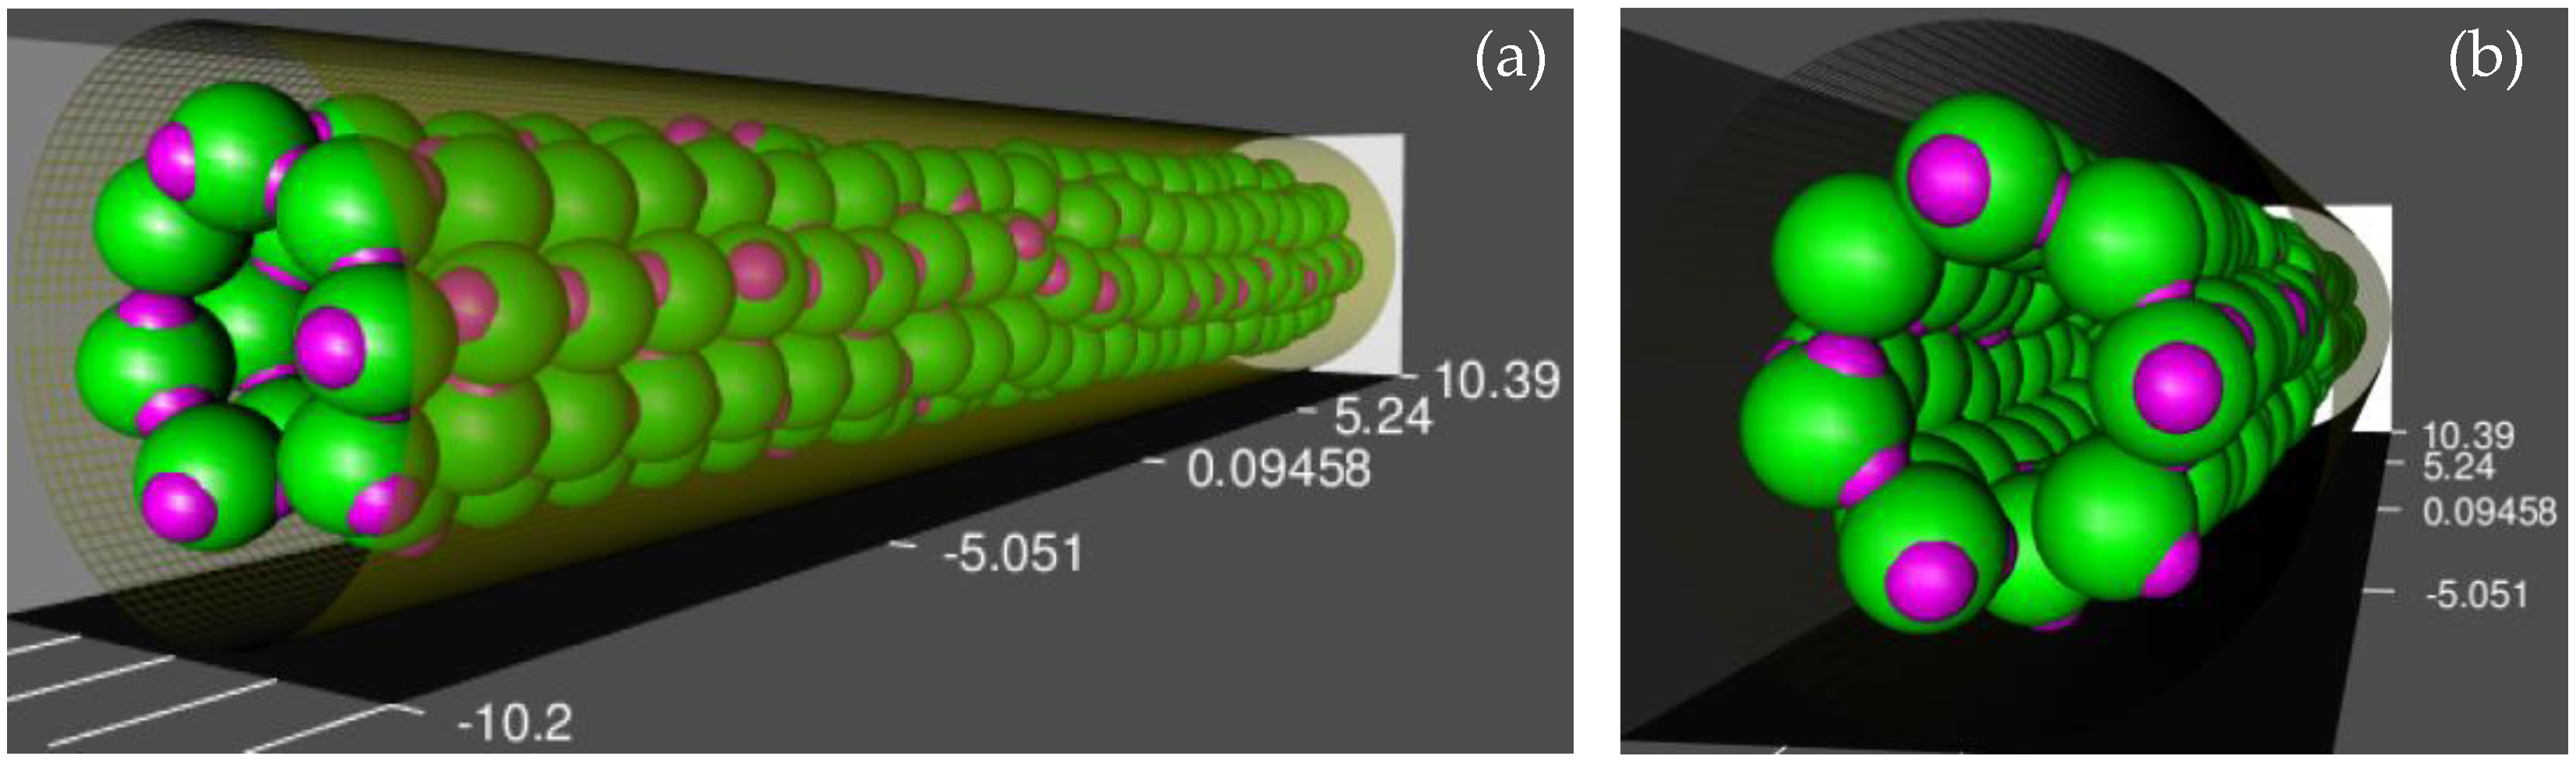
3.5. Water Monolayer
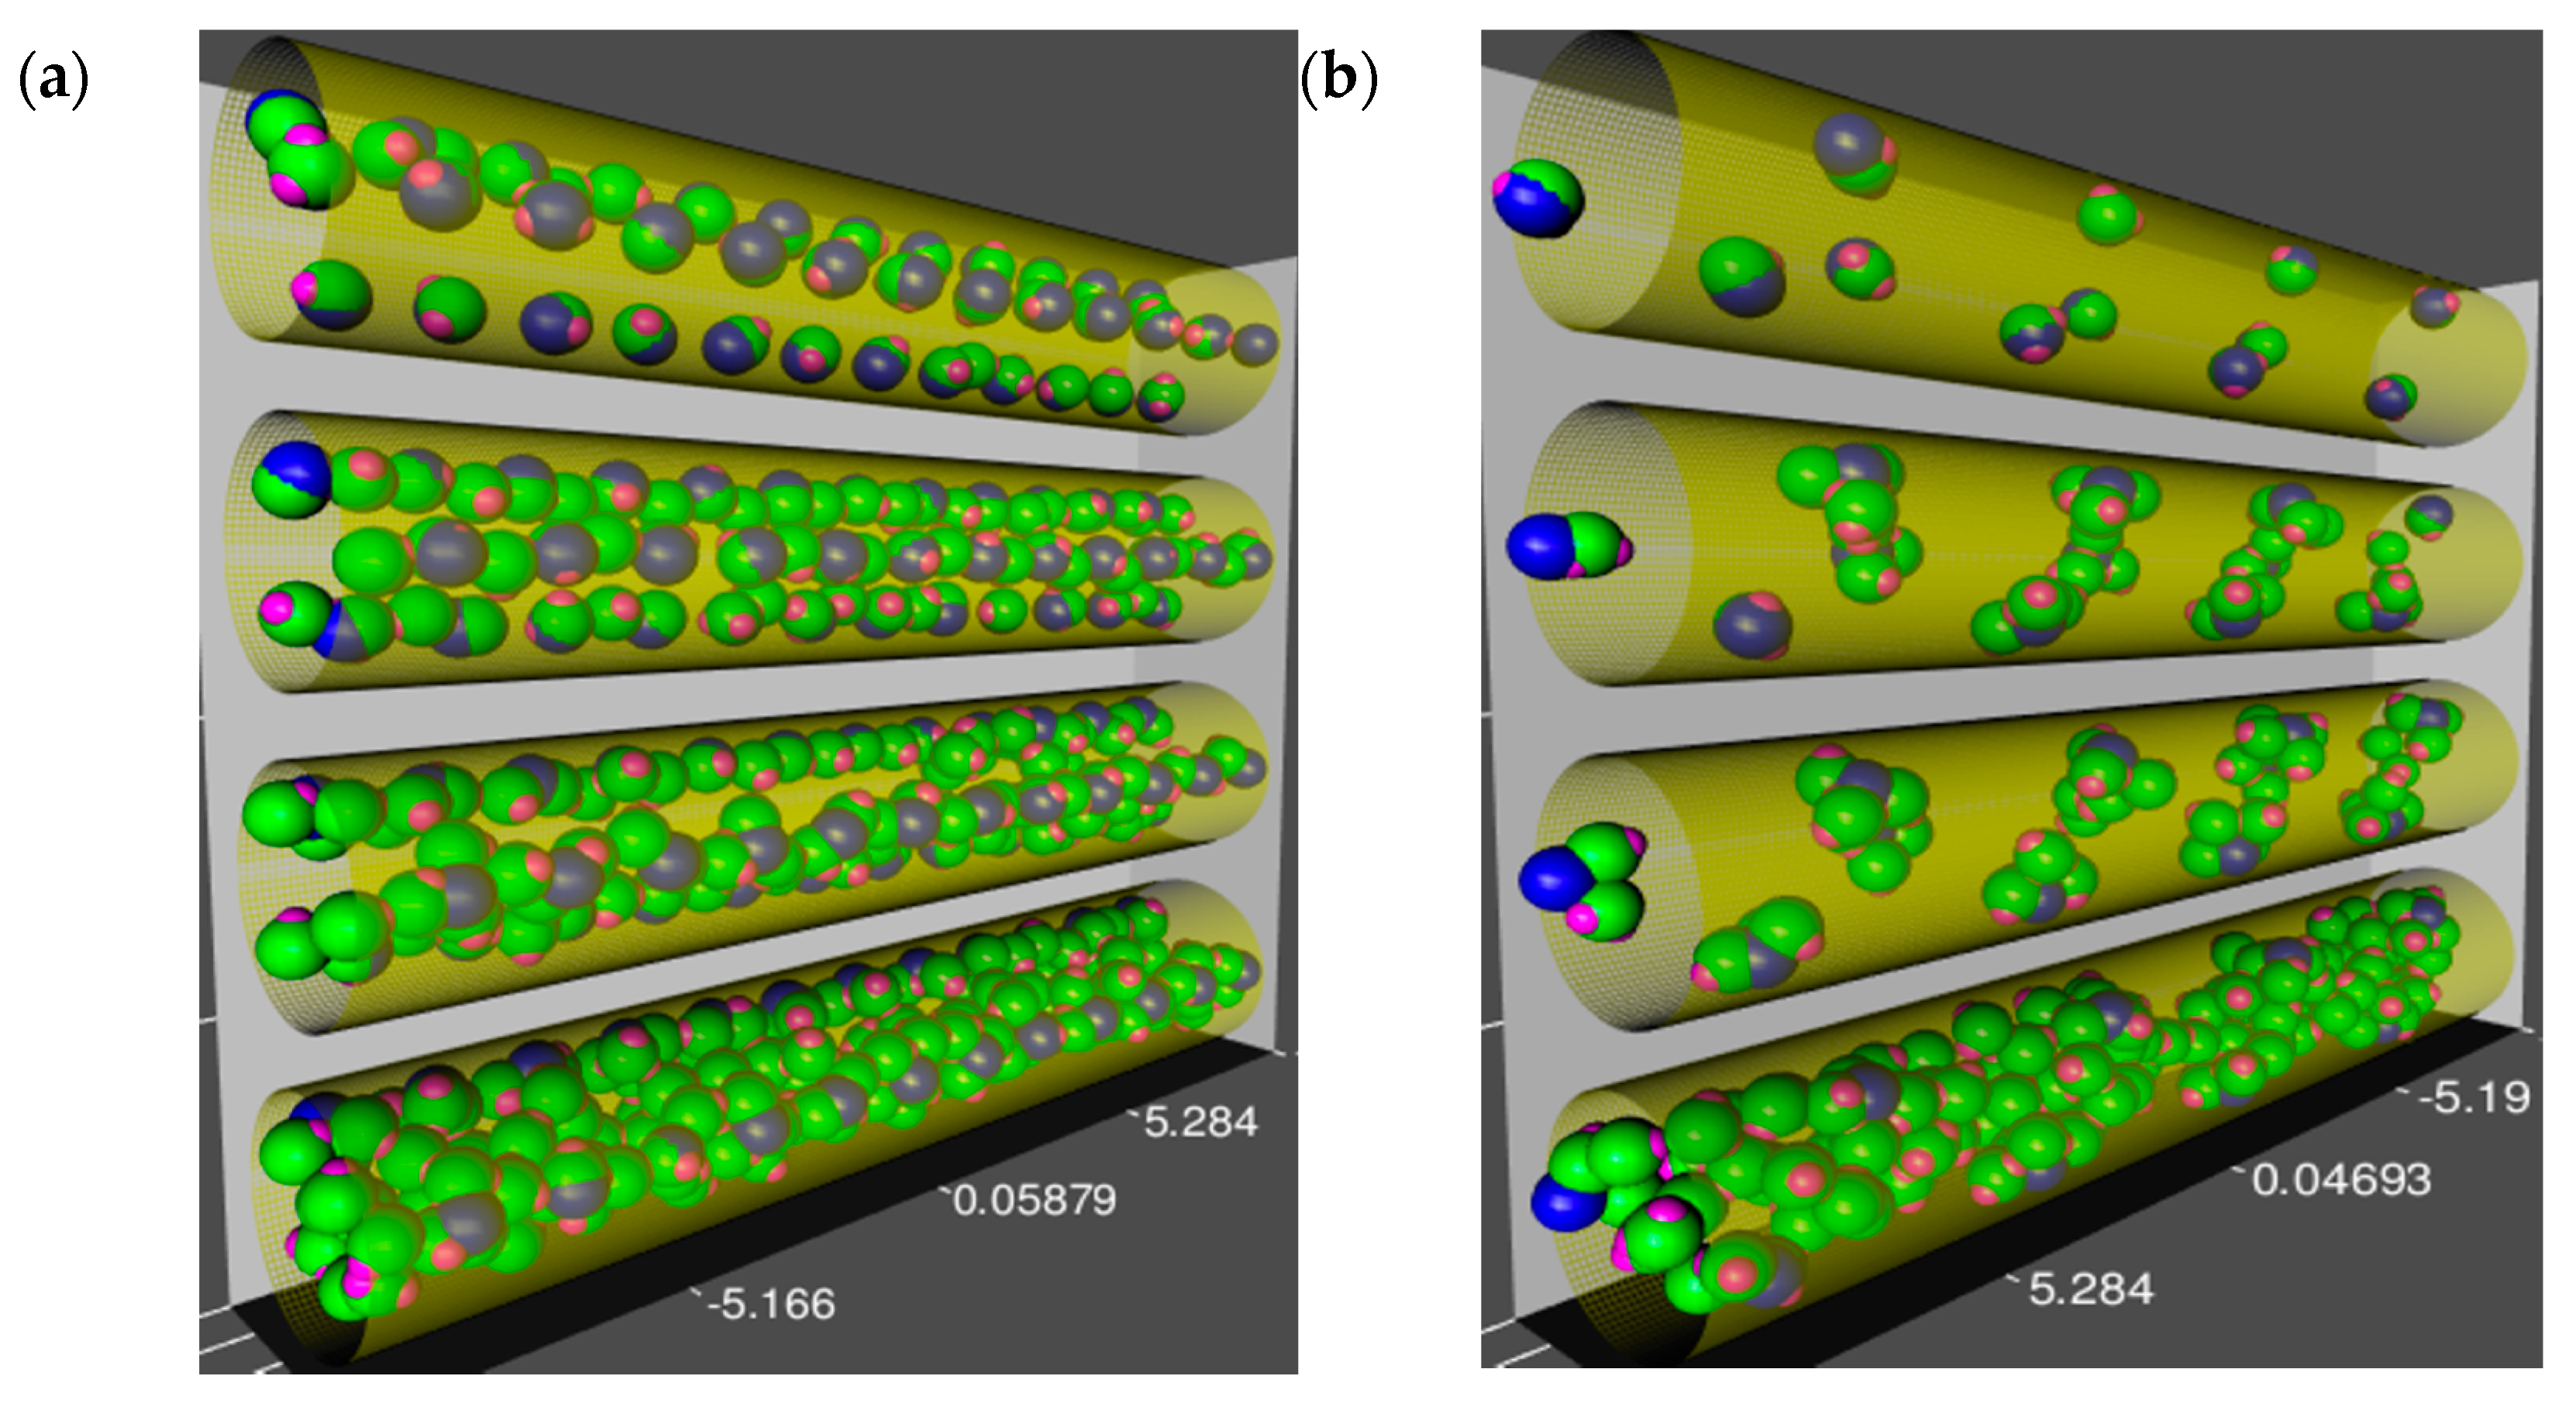
3.6. Water Clusters
3.7. Interaction of Simulation Parameters
4. Conclusions
Author Contributions
Funding
Institutional Review Board Statement
Informed Consent Statement
Data Availability Statement
Acknowledgments
Conflicts of Interest
Abbreviations
| IUPAC | International Union of Pure and Applied Chemistry; |
| M | Moisture content: |
| H | Relative humidity: |
| LJ | Lennard-Jones: |
| PW | Pore wall: |
| SPC/E | Extended simple point charge; |
| GCMC | Grand canonical Monte Carlo; |
| WWIS | Wood-water interaction strength |
References
- Lowell, S.; Shields, J.E.; Thomas, M.A.; Thommes, M. Characterization of Porous Solids and Powders: Surface Area, Pore Size and Density; Kluwer Academic Publishers: Boston, MA, USA, 2004. [Google Scholar]
- Pidgeon, L.M.; Maass, O. The Adsorption of Water by Wood. J. Am. Chem. Soc. 1930, 52, 1053–1069. [Google Scholar] [CrossRef]
- Engelund, E.T.; Thygesen, L.G.; Svensson, S.; Hill, C.A.S. A critical discussion of the physics of wood–water interactions. Wood Sci. Technol. 2013, 47, 141–161. [Google Scholar] [CrossRef] [Green Version]
- Simpson, W.T. Predicting equilibrium moisture content of wood by mathematical models. Wood Fiber Sci. 1973, 5, 41–49. [Google Scholar]
- Hartley, I.; Kamke, F.; Peemoeller, H. Cluster theory for water sorption in wood. Wood Sci. Technol. 1992, 26, 83–99. [Google Scholar] [CrossRef]
- Hartley, I.D.; Avramidis, S. Analysis of the Wood Sorption Isotherm Using Clustering Theory. Holzforschung 1993, 47, 163–167. [Google Scholar] [CrossRef]
- Avramidis, S. The Basics of Sorption. In Proceedings of the International Conference of COST Action E8, Copenhagen, Denmark, 16–17 June 1997. [Google Scholar]
- Chen, C.M.; Wangaard, F.F. Wettability and the hysteresis effect in the sorption of water vapour by wood. Wood Sci. Technol. 1968, 2, 177–187. [Google Scholar]
- Simpson, W. Sorption theories applied to wood. Wood Fiber Sci. 1980, 12, 183–195. [Google Scholar]
- Thygesen, L.G.; Engelund, E.T.; Hoffmeyer, P. Water sorption in wood and modified wood at high values of relative humidity. Part I: Results for untreated, acetylated, and furfurylated Norway spruce. Holzforschung 2010, 64, 315–323. [Google Scholar] [CrossRef]
- Engelund, E.T.; Thygesen, L.G.; Hoffmeyer, P.; Thybring, E. Water sorption in wood and modified wood at high values of relative humidity. Part 2: Appendix. Theoretical assessment of the amount of capillary water in wood microvoids. Holzforschung 2010, 64, 325–330. [Google Scholar] [CrossRef]
- Wang, J.; Mukhopadhyaya, P.; I Morris, P. Sorption and capillary condensation in wood and the moisture content of red pine. J. Build. Phys. 2014, 37, 327–347. [Google Scholar] [CrossRef]
- Rautkari, L.; Hill, C.A.S.; Curling, S.; Jalaludin, Z.; Ormondroyd, G. What is the role of the accessibility of wood hydroxyl groups in controlling moisture content? J. Mater. Sci. 2013, 48, 6352–6356. [Google Scholar] [CrossRef]
- Willems, W. A critical review of the multilayer sorption models and comparison with the sorption site occupancy (SSO) model for wood moisture sorption isotherm analysis. Holzforschung 2015, 69, 67–75. [Google Scholar] [CrossRef]
- Willems, W. Hygroscopic wood moisture: Single and dimerized water molecules at hydroxyl-pair sites? Wood Sci. Technol. 2018, 52, 777–791. [Google Scholar] [CrossRef]
- Guo, X.; Wu, Y.; Yan, N. In situ micro-FTIR observation of molecular association of adsorbed water with heat-treated wood. Wood Sci. Technol. 2018, 52, 971–985. [Google Scholar] [CrossRef]
- Shi, J.; Avramidis, S. Water sorption hysteresis in wood: I review and experimental patterns—Geometric characteristics of scanning curves. Holzforschung 2017, 71, 307–316. [Google Scholar] [CrossRef]
- Urquhart, A.R. 15—The Mechanism of the Adsorption of Water by Cotton. J. Text. Inst. Trans. 1929, 20, T125–T132. [Google Scholar] [CrossRef]
- Spalt, H.A. The fundamentals of water vapor sorption by wood. Forest Prod. J. 1958, 8, 288–295. [Google Scholar]
- Chen, M.; Coasne, B.; Guyer, R.; Derome, D.; Carmeliet, J. Role of hydrogen bonding in hysteresis observed in sorption-induced swelling of soft nanoporous polymers. Nat. Commun. 2018, 9, 1–7. [Google Scholar] [CrossRef] [PubMed]
- Chen, M.; Zhang, C.; Shomali, A.; Coasne, B.; Carmeliet, J.; Derome, D. Chen Wood–Moisture Relationships Studied with Molecular Simulations: Methodological Guidelines. Forests 2019, 10, 628. [Google Scholar] [CrossRef] [Green Version]
- Hill, C.A.S.; Norton, A.; Newman, G. The water vapor sorption behavior of natural fibers. J. Appl. Polym. Sci. 2009, 112, 1524–1537. [Google Scholar] [CrossRef]
- Hill, C.A.S.; Norton, A.J.; Newman, G. The water vapor sorption properties of Sitka spruce determined using a dynamic vapor sorption apparatus. Wood Sci. Technol. 2010, 44, 497–514. [Google Scholar] [CrossRef]
- Salmén, L.; Larsson, P.A. On the origin of sorption hysteresis in cellulosic materials. Carbohydr. Polym. 2018, 182, 15–20. [Google Scholar] [CrossRef]
- Shi, J.; Avramidis, S. Water sorption hysteresis in wood: III physical modeling by molecular simulation. Holzforschung 2017, 71, 733–741. [Google Scholar] [CrossRef]
- Olek, W.; Majka, J.; Czajkowski, Ł. Sorption isotherms of thermally modified wood. Holzforschung 2013, 67, 183–191. [Google Scholar] [CrossRef]
- Papadopoulos, A.N.; Hill, C.A.S. The sorption of water vapour by anhydride modified softwood. Wood Sci. Technol. 2003, 37, 221–231. [Google Scholar] [CrossRef]
- Beck, G.; Strohbusch, S.; Larnøy, E.; Militz, H.; Hill, C. Accessibility of hydroxyl groups in anhydride modified wood as measured by deuterium exchange and saponification. Holzforschung 2017, 72, 17–23. [Google Scholar] [CrossRef]
- Popescu, C.-M.; Hill, C.A.S.; Curling, S.; Ormondroyd, G.; Xie, Y. The water vapour sorption behaviour of acetylated birch wood: How acetylation affects the sorption isotherm and accessible hydroxyl content. J. Mater. Sci. 2014, 49, 2362–2371. [Google Scholar] [CrossRef]
- Phuong, L.X.; Takayama, M.; Shida, S.; Matsumoto, Y.; Aoyagi, T. Determination of the accessible hydroxyl groups in heat-treated Styrax tonkinensis (Pierre) Craib ex Hartwich wood by hydrogen-deuterium exchange and 2H NMR spectroscopy. Holzforschung 2007, 61, 488–491. [Google Scholar] [CrossRef]
- Guo, Y.; Zhang, M.; Xiao, Z.; Chen, H.; Xie, Y. Vaporization heat of bound water in wood chemically modified via grafting and crosslinking patterns by DSC and NMR analysis. Holzforschung 2018, 72, 1043–1049. [Google Scholar] [CrossRef]
- Beck, G.; Thybring, E.E.; Thygesen, L.G.; Hill, C. Characterization of moisture in acetylated and propionylated radiata pine using low-field nuclear magnetic resonance (LFNMR) relaxometry. Holzforschung 2018, 72, 225–233. [Google Scholar] [CrossRef]
- Hietala, S.; Maunu, S.L.; Sundholm, F.; Jämsä, S.; Viitaniemi, P. Structure of Thermally Modified Wood Studied by Liquid State NMR Measurements. Holzforschung 2002, 56, 522–528. [Google Scholar] [CrossRef]
- Shi, J.; Avramidis, S. Water sorption hysteresis in wood: II mathematical modeling—Functions beyond data fitting. Holzforschung 2017, 71, 317–326. [Google Scholar] [CrossRef]
- Shi, J.; Avramidis, S. Evolution of wood cell wall nanopore size distribution in the hygroscopic range. Holzforschung 2019, 73, 899–910. [Google Scholar] [CrossRef]
- Atkins, P.W.; de Paula, J. Physical Chemistry, 8th ed.; W. H. Freeman and Company: New York, NY, USA, 2006. [Google Scholar]
- Karniadakis, G.; Beskok, A.; Aluru, N. Microflows and Nanoflows: Fundamentals and Simulation; Springer Science & Business Media, Inc.: New York, NY, USA, 2005. [Google Scholar]
- Frenkel, D.; Smit, B.; Ratner, M.A. Understanding Molecular Simulation: From Algorithms to Applications; Academic Press: New York, NY, USA, 2002. [Google Scholar]
- Berendsen, H.J.C.; Grigera, J.R.; Straatsma, T.P. The missing term in effective pair potentials. J. Phys. Chem. 1987, 91, 6269–6271. [Google Scholar] [CrossRef]
- Peterson, B.K.; Walton, J.P.; Gubbins, K.E. Fluid behavior in narrow pores. J. Chem. Soc. Faraday Trans. 1986, 82, 1789–1800. [Google Scholar] [CrossRef]
- Walther, J.H.; Jaffe, R.; Halicioglu, T.; Koumoutsakos, P. Carbon Nanotubes in Water: Structural Characteristics and Energetics. J. Phys. Chem. B 2001, 105, 9980–9987. [Google Scholar] [CrossRef]
- Kaukonen, M.; Gulans, A.; Havu, P.; Kauppinen, E. Lennard-Jones parameters for small diameter carbon nanotubes and water for molecular mechanics simulations from van der Waals density functional calculations. J. Comput. Chem. 2012, 33, 652–658. [Google Scholar] [CrossRef]
- Busse-Wicher, M.; Li, A.; Silveira, R.L.; Pereira, C.S.; Tryfona, T.; Gomes, T.C.F.; Skaf, M.S.; DuPree, P. Evolution of Xylan Substitution Patterns in Gymnosperms and Angiosperms: Implications for Xylan Interaction with Cellulose. Plant Physiol. 2016, 171, 2418–2431. [Google Scholar] [CrossRef]
- Simmons, T.J.; Mortimer, J.C.; Bernardinelli, O.D.; Pöppler, A.-C.; Brown, S.P.; Deazevedo, E.R.; DuPree, R.; DuPree, P. Folding of xylan onto cellulose fibrils in plant cell walls revealed by solid-state NMR. Nat. Commun. 2016, 7, 13902. [Google Scholar] [CrossRef] [PubMed]
- Kang, X.; Kirui, A.; Widanage, M.C.D.; Mentink-Vigier, F.; Cosgrove, D.J.; Wang, T. Lignin-polysaccharide interactions in plant secondary cell walls revealed by solid-state NMR. Nat. Commun. 2019, 10, 347. [Google Scholar] [CrossRef] [PubMed]
- Striolo, A.; Gubbins, K.E.; Chialvo, A.A.; Cummings, P.T. Simulated water adsorption isotherms in carbon nanopores. Mol. Phys. 2004, 102, 243–251. [Google Scholar] [CrossRef]
- Striolo, A.; Chialvo, A.A.; Cummings, P.T.; Gubbins, K.E. Water Adsorption in Carbon-Slit Nanopores. Langmuir 2003, 19, 8583–8591. [Google Scholar] [CrossRef]
- Ohba, T.; Yamamoto, S.; Kodaira, T.; Hata, K. Changing Water Affinity from Hydrophobic to Hydrophilic in Hydrophobic Channels. Langmuir 2015, 31, 1058–1063. [Google Scholar] [CrossRef] [PubMed]
- Cychosz, K.A.; Guo, X.; Fan, W.; Cimino, R.; Gor, G.Y.; Tsapatsis, M.; Neimark, A.V.; Thommes, M. Characterization of the Pore Structure of Three-Dimensionally Ordered Mesoporous Carbons Using High Resolution Gas Sorption. Langmuir 2012, 28, 12647–12654. [Google Scholar] [CrossRef]
- Sarkisov, L.; Centineo, A.; Brandani, S. Molecular simulation and experiments of water adsorption in a high surface area activated carbon: Hysteresis, scanning curves and spatial organization of water clusters. Carbon 2017, 118, 127–138. [Google Scholar] [CrossRef]
- Di Lella, A.; Desbiens, N.; Boutin, A.; Demachy, I.; Ungerer, P.; Bellat, J.P.; Fuchs, A.H. Molecular simulation studies of water physisorption in zeolites. Phys. Chem. Chem. Phys. 2006, 8, 5396–5406. [Google Scholar] [CrossRef]
- Saliba, S.; Ruch, P.; Volksen, W.; Magbitang, T.P.; Dubois, G.; Michel, B. Combined influence of pore size distribution and surface hydrophilicity on the water adsorption characteristics of micro- and mesoporous silica. Microporous Mesoporous Mater. 2016, 226, 221–228. [Google Scholar] [CrossRef]
- Stamm, A.J. Wood and Cellulose Science; The Ronald Press Company: New York, NY, USA, 1964; 549p. [Google Scholar]


| Interaction | LJ Potential Parameters | |
|---|---|---|
| εsf/kB (K) | σsf (Å) | |
| PW1-water | 58.29 | 3.281 |
| PW2-water | 37.60 | 3.190 |
| PW3-water | 78.23 | 3.166 |
| PW4-water | 28 | 3.4 |
| PW5-water | 87.435 | 3.281 |
| PW6-water | 174.87 | 3.281 |
| PW7-water | 291.45 | 3.281 |
| PW8-water | 7.52 | 3.190 |
| Wall Type | nc | nl | (kcal mol−1) | RH (nm) | Spatial Distribution |
|---|---|---|---|---|---|
| PW1 | 3 | 12 | 4.5 | 0.317 | even |
| 3 | 16 | 0.5 | 0.158 | random | |
| 3 | 8 | 22.5 | 0.475 | clustered | |
| helix | |||||
| PW2 | 3 | 4 | 4.5 | 0.317 | even |
| 3 | 6 | 0.5 | 0.158 | random | |
| 3 | 2 | 22.5 | 0.475 | clustered | |
| helix |
| β0 | β1 | β2 | Adjusted R2 | |
|---|---|---|---|---|
| Hu | 5.2170 | −1.8975 | −0.0051 | 0.9417 |
| Hl | 3.7329 | −2.0409 | −0.0038 | 0.9271 |
| ΔH | 5.0573 | −2.1227 | −0.0035 | 0.8983 |
Publisher’s Note: MDPI stays neutral with regard to jurisdictional claims in published maps and institutional affiliations. |
© 2021 by the authors. Licensee MDPI, Basel, Switzerland. This article is an open access article distributed under the terms and conditions of the Creative Commons Attribution (CC BY) license (http://creativecommons.org/licenses/by/4.0/).
Share and Cite
Shi, J.; Avramidis, S. Nanopore-Level Wood-Water Interactions—A Molecular Simulation Study. Forests 2021, 12, 356. https://doi.org/10.3390/f12030356
Shi J, Avramidis S. Nanopore-Level Wood-Water Interactions—A Molecular Simulation Study. Forests. 2021; 12(3):356. https://doi.org/10.3390/f12030356
Chicago/Turabian StyleShi, Jingbo, and Stavros Avramidis. 2021. "Nanopore-Level Wood-Water Interactions—A Molecular Simulation Study" Forests 12, no. 3: 356. https://doi.org/10.3390/f12030356