Article

Recovery of Soil-Denitrifying Community along a Chronosequence of Sand-Fixation Forest in a Semi-Arid Desertified Grassland

College of Life and Health Sciences, Northeastern University, Shenyang 110169, China
*
Author to whom correspondence should be addressed.
Forests 2021, 12(3), 354; https://doi.org/10.3390/f12030354
Submission received: 18 February 2021 / Revised: 10 March 2021 / Accepted: 16 March 2021 / Published: 17 March 2021

Abstract

:
Revegetation on moving sand dunes is a widely used approach for restoring the degraded sandy land in northeastern China. The development of sand-fixation forest might improve the structures of soil microbial communities and affect soil N cycle. In the present study, the diversities of nitrite (nirS and nirK) and nitrous oxide (nosZ) reductase genes were investigated under a chronosequence of Caragana microphylla sand-fixation shrub forest (9- and 19-year), adjacent non-vegetated shifting sand-dune, and a natural forest dominated by C. microphylla. The dominant compositions and gene abundance were analyzed by a clone library technique and quantitative polymerase chain reaction, respectively. The compositions and dominant taxa of nirK, nirS, and nosZ communities under forest soil were all similar to those in the shifting sand-dune. However, the three gene abundances all linearly increased across forest age. Clones associated with known denitrifiers carrying nosZ, nirK, or nirS genes, such as members of Pseudomonas, Mesorhizobium, Rhizobium, Rhodopseudomonas, Azospirillum, and Cupriavidus, were detected. These denitrifiers were found to be abundant in soil and dominant in soil denitrification. Soil pH, total N, and available N affected the denitrifying communities by altering the relative abundance of dominant taxa. Overall, although soil attributes and forest age had no significant effects on the dominant constituents of nirK, nirS, and nosZ communities, revegetation on shifting sand-dunes facilitated the quantitative restoration of soil denitrifiers due to the increase in soil nutrients.

1. Introduction

Revegetation is widely adopted as useful approach in the restoration of degraded ecosystems in desertified regions [1]. The Horqin Sandy Land, located in the semi-arid zone in north China, has suffered from serious desertification in recent decades due to excessive reclamation, overgrazing, and heavy firewood collection caused by the increasing resident population pressure [2,3]. Revegetation via planting indigenous shrubs on moving or semi-moving sand dunes has been universally recognized as an effective measure for controlling the desertification of an area. Among the planted shrubs, Caragana microphylla is the most commonly used pioneer shrub for stabilizing shifting sand dunes because of its strong endurance in arid environments, high resistance to wind erosion of sand burial, fast growth, large root system, and easy propagation [4]. Information on the variations in soil attributes after revegetation on shifting sand dunes is needed to assess the ecological effects and further understand the process of soil restoration along plantation development. Many studies, including the previous works of the authors, have confirmed that the artificial establishment of C. microphylla forest improves the microclimate and soil organic matter as well [4,5,6]. These favorable effects increase with plantation age [7]. The development of plantations could also significantly change the soil microbial community [8,9]. However, whether and how the soil microbial community under secondary barren land (shifting sand dune) can be restored via the establishment of plantations is still unknown. Although several studies have utilized molecular tools or high-throughput sequencing techniques to investigate soil bacterial community under sand-fixation forests in this region [9,10,11,12,13], the response of soil-specific functional microbial groups, especially N-cycling microbes to the revegetation on shifting sand-dunes, was underestimated.
Some previous studies indicated that soil N content increased with forest age and significantly differed with forest type [1,7,14]. Therefore, close attention should be paid to the microbes associated to soil N dynamics during the recovery of degraded ecosystems [8,15]. It is possible that soil microbial functional communities involved in N transformation would be significantly altered by the development of sand-fixation forest and restored to its original state. However, the diversities and structures of these microbial communities in shifting sand land and vegetation-covered areas of Horqin Sandy Land have not been widely investigated, and limited information is available on the composition of soil microbial communities. Microbial denitrification, one of important process of N transformation, comprises four continuous reaction processes in which nitrate N is reduced into a molecular gaseous form (N2) [16]. The respiratory nitrate reduction process (i.e., NO3 to NO2) is catalyzed by either a membrane-bound or a periplasmic nitrate reductase [17,18]. The reduction reaction of NO2 into NO is catalyzed by two types of nitrite reductase, that is, a cytochrome cd1 nitrite reductase and a copper nitrite reductase, which are encoded by nirK and nirS genes, respectively [16,19]. The reduction of NO to N2O is catalyzed by NO oxide reductase. The last step in the denitrification process is the reduction of N2O into N2, which is mainly governed by the nosZ gene (encode N2O reductase) [16,20]. Denitrification can be regulated by a diversely phylogenetic group, including about 50 genera, mostly from Proteobacteria. Many denitrifiers are N-fixers (e.g., Rhizobiaceae and Bradyrhizobium) or nitrifiers (e.g., Nitrosospira), and they also can regulate the N cycle process under certain environment [21]. In general, denitrification is one of the key process of the N biogeochemical cycle and is a determinant of N level in soil especially in arid or semi-arid regions. Because all the steps of soil denitrification are driven by different denitrifying bacteria, the information of diversity, composition, and structure of the denitrifying community as well as their dynamics is needed for further understanding the process and the mechanism of the soil N cycle. Meanwhile, denitrifying community may be used as an indicator for ecological restoration and soil quality assessment in degraded ecosystems, because the recovery of soil denitrifying communities also implies the improvement of the N transformation rate, including fixation and nitrification.
In our recent study, we compared the denitrifying microbial communities among six different sand-fixation forests and found that forest type slightly influenced the dominant taxa in soil-denitrifying communities [22]. In this study, we selected a chronosequence native shrub (C. microphylla) plantation to study the temporal variations of denitrifying communities by clone library and quantitative polymerase chain reaction (qPCR) techniques. The aims of this study were (1) to study the recovery process of denitrifying community from secondary barren land (shifting sand dune) by planting native shrub plantation and (2) to determine the response of dominant taxa to plantation development. These communities at the early stage of revegetation on shifting sand dunes are assumed to differ from those in the developed substrates.

2. Materials and Methods

2.1. Study Location and Site Description

This study was conducted at the Wulanaodu Desertification Control Station (43°02′ N, 119°39′ E; altitude: 480 m) under the Chinese Academy of Sciences. This station is located in the western Horqin Sandy Land in north China. The geomorphology is characterized by the alternative distribution of shifting sand dunes, fixed/semi-fixed sand dunes, and interdunal lowlands. This region is under the temperate continental semi-arid monsoon climate zone. The annual mean temperature, precipitation, and pan evaporation are 6.3 °C, 340.5 mm, and 2500 mm. The soils are classified as cambic arenosols [23]. The typical plant species included: Agropyron cristatum, Aneurolepidium chinense, Astragalus adsurgens, Stipa grandis, and Lespedeza davurica. However, the original vegetation has been severely destroyed by long-term heavy grazing and overcutting over the past decades. At present, the sandy land vegetation is generally dominated by psammophytes, shrubs, and semishrubs, including Agriophyllum squarrosum, Salsola collina, Aristida adscensionis, Pennisetum flaecidum, C. microphylla, Atraphaxis manshurica, and Artemisia frigida.
A large area of C. microphylla was planted around the Wulanaodu Region in the 1980s with the aid of sand-protecting barriers to fix shifting or semi-shifting sand dunes and improve the local eco-environment. The experimental site was enclosed after seeding. The sand dunes can be fixed at 3–5 years after planting, and the stabilized shrubby grass vegetation gradually formed as sand binders. This phenomenon improved the soil properties and colonized short grasses and forbs.

2.2. Experimental Design and Soil Sampling

Representative C. microphylla sand-fixation forests (9 and 19 years old, designated as CM-9 and CM-19, respectively), adjacent non-vegetated shifting sand dunes (0-year, SSD), and a natural C. microphylla forest (approximately 50-year, NC) were selected as the experimental sites in September 2016. The morphological traits of the different sites are provided in Table 1. Three 30 m × 30 m plots were set up in each site, and in each plot 15 subsamples at 0–10 cm soil depth were randomly collected using a plastic shovel at 50 cm away from the center of different plant clumps and mixed into one sample. Half of each sample was air-dried and stored at room temperature, and the other half was immediately frozen at −80 °C.

2.3. Soil Property Analysis

Soil pH and electrical conductivity (EC) were measured in soil–water suspensions at 1:2.5 and 1:5 soil–water ratios, respectively. A portion of the air-dried and sieved samples was ground and passed through a 0.25 mm screen for the soil organic matter (SOM) and total N (TN) analyses. SOM was measured using the K2Cr2O7–H2SO4 oxidation method described by Nelson and Sommers [24], and TN was determined via an automatic Kjeldahl apparatus. Soil available N (Av. N) was extracted using 1 M KCl solution, and determined via an automated discrete analyzer (CleverChem 380, DeChem-Tech, Germany). Soil total P (TP) and available P (Av. P) were determined with the Olsen and Dean method [25]. Soil total K (TK) and available K (Av. K) were measured via the method of atomic absorption spectroscopy [25].

2.4. Clone Library Construction

Genomic DNA was extracted and purified separately from each soil sample (0.7 g wet soil) with three replicates by using the Soil DNA Quick Extraction Kit (Bioteke, China). The purified DNA was amplified with forward/reverse primer pairs nirK-F1aCu/nirK-R3Cu, nosZ-1F/nosZ-2R, and nirS-cd3aF/nirS-R3cd, which respectively targeted the nirK, nosZ, and nirS denitrification genes [26,27]. The three gene clone libraries were made from 0-, 9-, and 19-year C. microphylla forest sites and the NC site. Qualified clones were commercially sequenced according to the standard protocols. The obtained raw nucleotide sequences of the three genes were aligned and trimmed using the BioEdit software [28]. Discrepancies during alignment were manually verified and then compared against the genes in GenBank by using BLASTN on the NCBI’s homepage and clustered into operational taxonomic units (OTUs) with a cutoff of 97% similarity [29]. A phylogenetic tree was constructed using the representative OTUs by using the neighbor-joining method on the MEGA 4.0 software [30].

2.5. Quantifications of nosZ, nirK, and nirS Genes

The abundance of nosZ, nirK, and nirS genes was determined by using a real-time qPCR System (StepOneTM, Applied Biosystems, Foster City, CA, USA ) in a 20 μL reaction mixture containing the following: 1.0 μL of each primer for nosZ, nirK, or nirS, 10 μL of Gotaq qPCR Master Mix (Promega, France), 1.0 μL of DNA template, 2.5 μL of bovine serum albumin (BSA), and nuclease-free water. qPCRs of the three genes were performed with the above-mentioned primers [31]. Two independent real-time PCR assays were conducted for the three genes and each soil replicate [32].

2.6. Data Analysis

The responses of these indicators to forest development were analyzed by using the linear or quadratic regression model. All statistical analyses were performed using the SPSS 13.0 software, and a difference at the p < 0.05 level was considered statistically significant. OTU richness analysis was conducted using the Mothur 1.21.1 software The alpha diversity indexes, including the Shannon–Wiener index, Simpson index, abundance-based coverage estimator (ACE), and Chao’s species richness estimator (Chao), were calculated via the Mothur software [33]. Canonical correspondence analysis (CCA) was performed using CANOCO 4.5 to identify which soil factor most significantly affected the variations in the soil dominant denitrifiers.
The accession numbers for nosZ were KX695575-KX695638, KX695438-KX695524, KX695296-KX695374, KX695375-KX695437, and KX695639-KX695722. The accession numbers for nirS were KU309672-KU309708, KX581498-KX581585, KU309709- KU309734, KU310213-KU310263, and KU309769-KU309798. The accession numbers for nirK were KU310122-KU310159, KX555006-KX555070, KU310007-KU310042, KU310213-KU310263, and KU310264- KU310302.

3. Results

3.1. Soil Properties

All parameters in vegetation-cover soils were significantly higher than those in SSD, especially in SOM and TN concentrations. Significantly linear regression relationships were detected between these parameters and plantation age (Table 1, p < 0.05), and all the parameters displayed an increasing trend with forest age.

3.2. Diversities of nirK, nirS, and nosZ Gene Libraries

A total of 425 nirK, 419 nirS, and 417 nosZ, clones were obtained in this study. Approximately 94–125 clones for each gene were obtained from the SSD, CM-9, CM-19, and NC samples (Table 2). Among the three genes, nirK had the highest OTU number and diversity indexes (ACE, Chao, Shannon–Weiner, and Simpson). This finding indicates that the nirK bacteria had a richer species diversity than the two other genes in the sandy soil. Moreover, the OTU numbers and diversity indexes of most samples from vegetation-covered sites were higher than those from SSD. The OTU number of the three gene library increased with forest age. In the NC site, the diversity of the denitrifying community was lower than that of the plantation sites, except for the nirK gene.

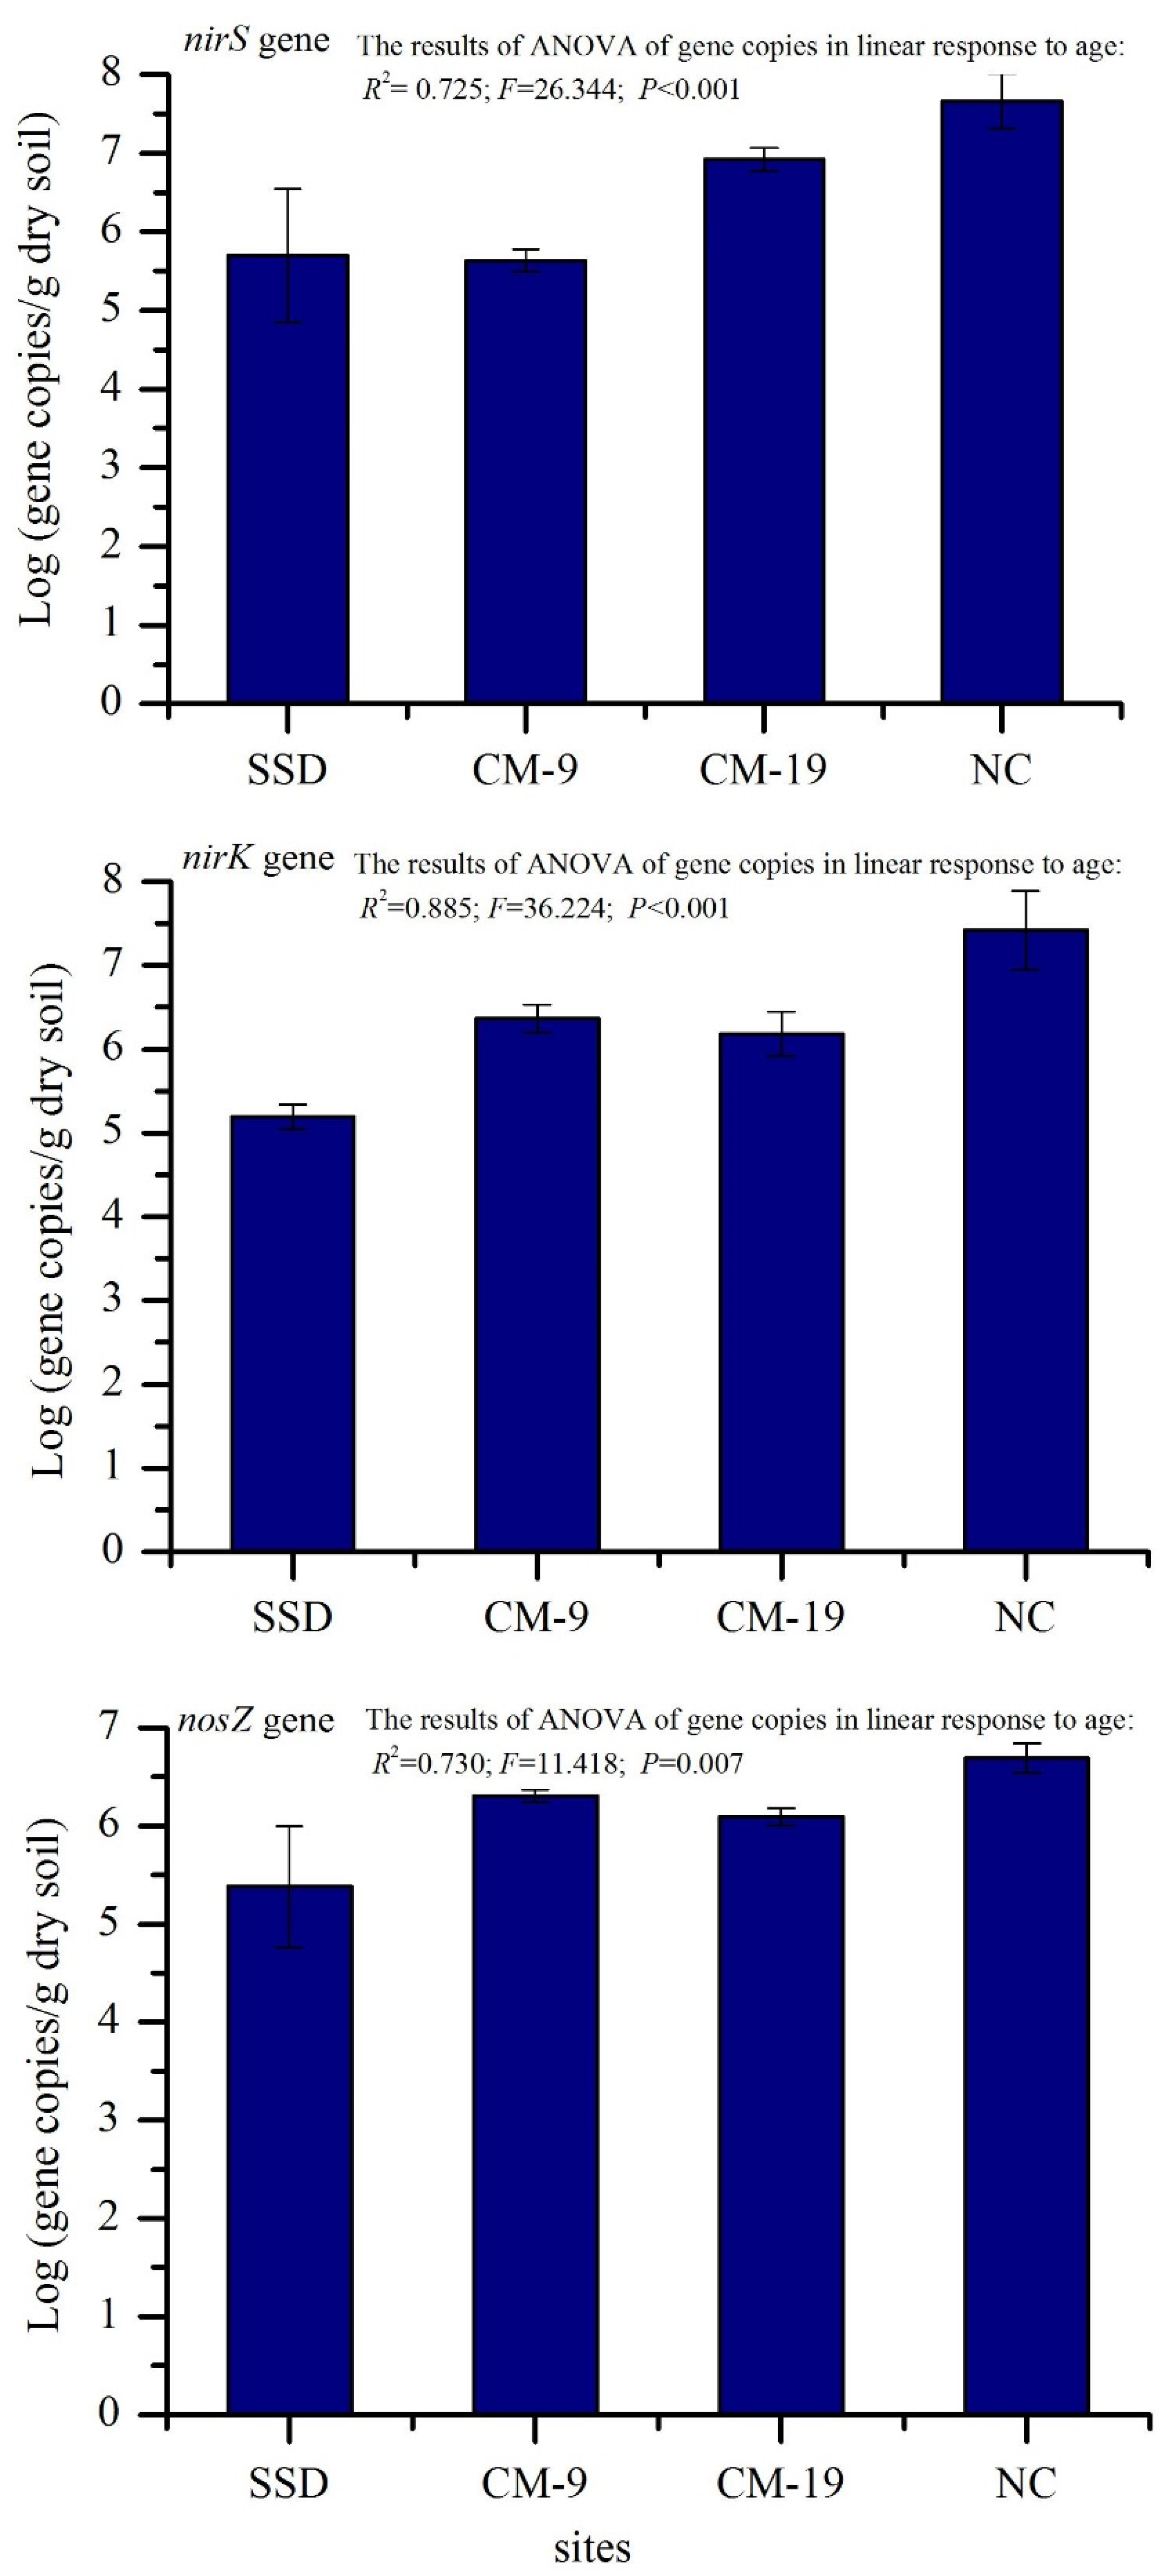
3.3. Abundance of the nirK, nirS, and nosZ Genes

qPCR assays were performed to determine the copies of the three genes in different soil samples. The number of bacterial nosZ gene ranged from 1.01 × 10⁵ to 7.05 × 10⁶ copies/g dry soil, whereas that of the nirK and nirS genes ranged from 1.27 × 10⁵ to 5.65 × 10⁷ copies/g dry soil and from 5.23 × 10⁴ to 9.14 × 10⁷ copies/g dry soil, respectively (Figure 1). The lowest and highest values of gene copies were observed in SSD and NC, respectively. Linear regression relationships were observed between the log-transformed gene abundance and forest age (Figure 1, p < 0.05). Overall, the copies of the three genes all consistently increased with plantation age. This trend is similar to the variations in soil nutrients with forest development.

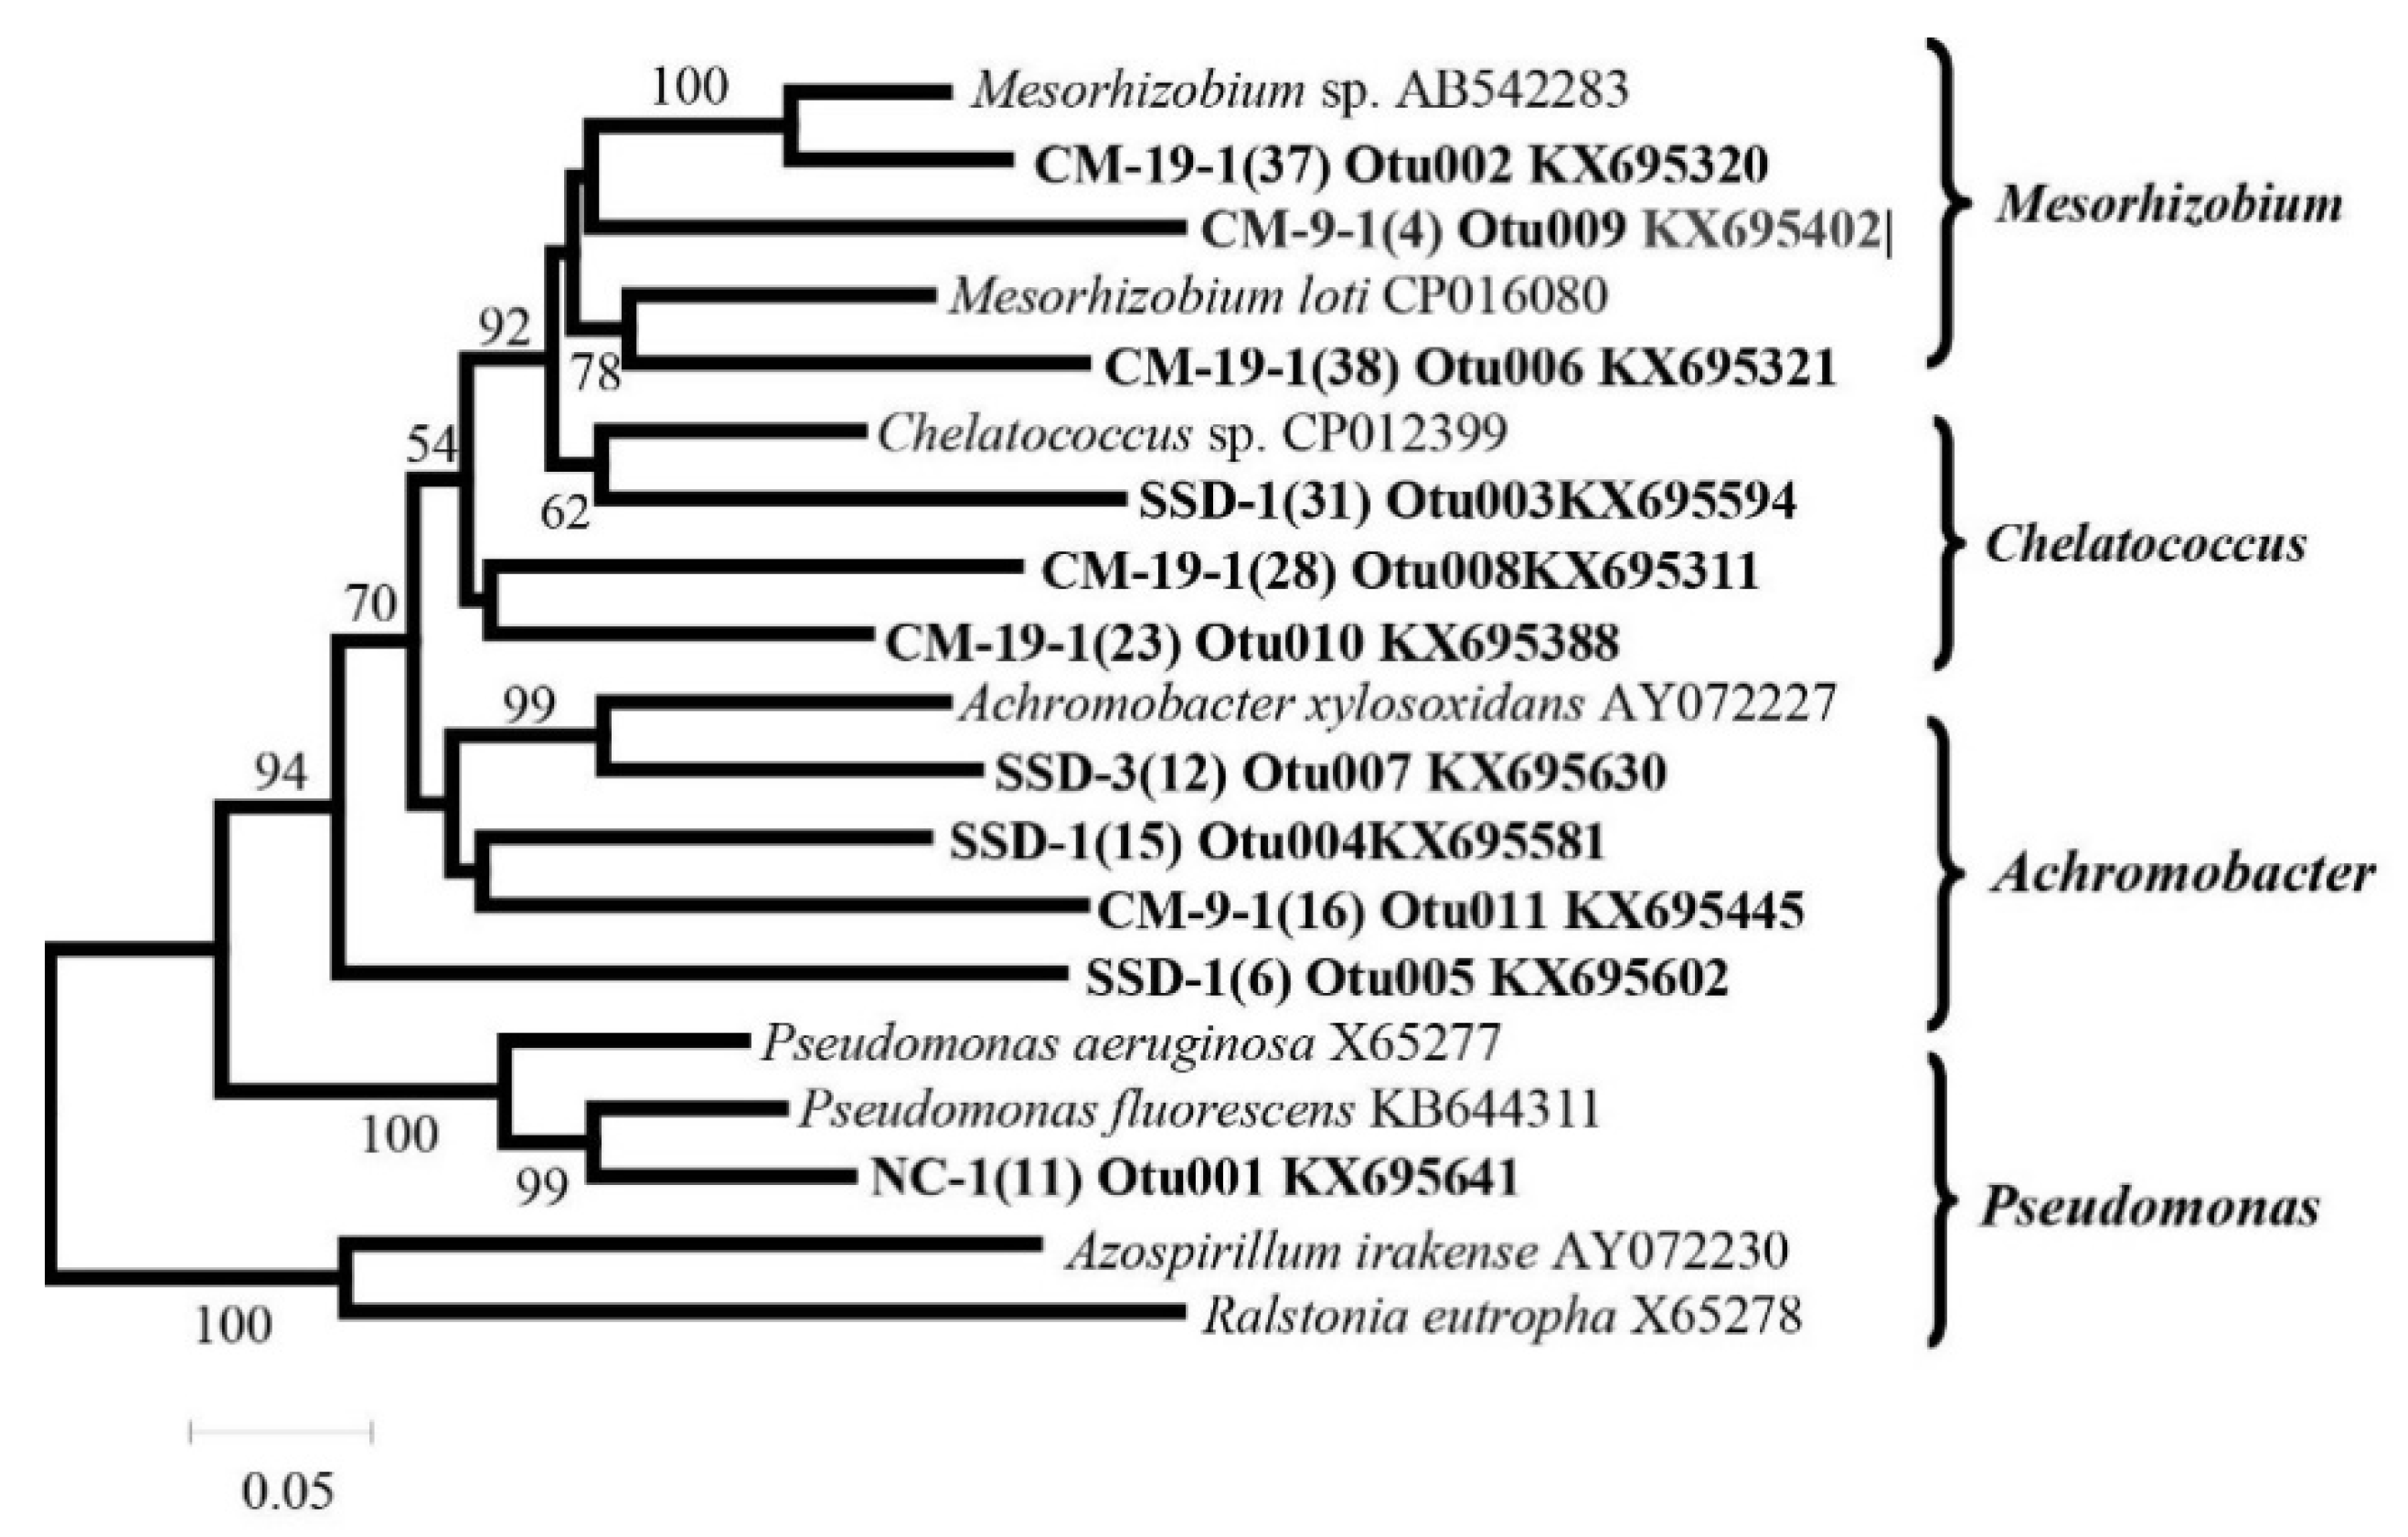
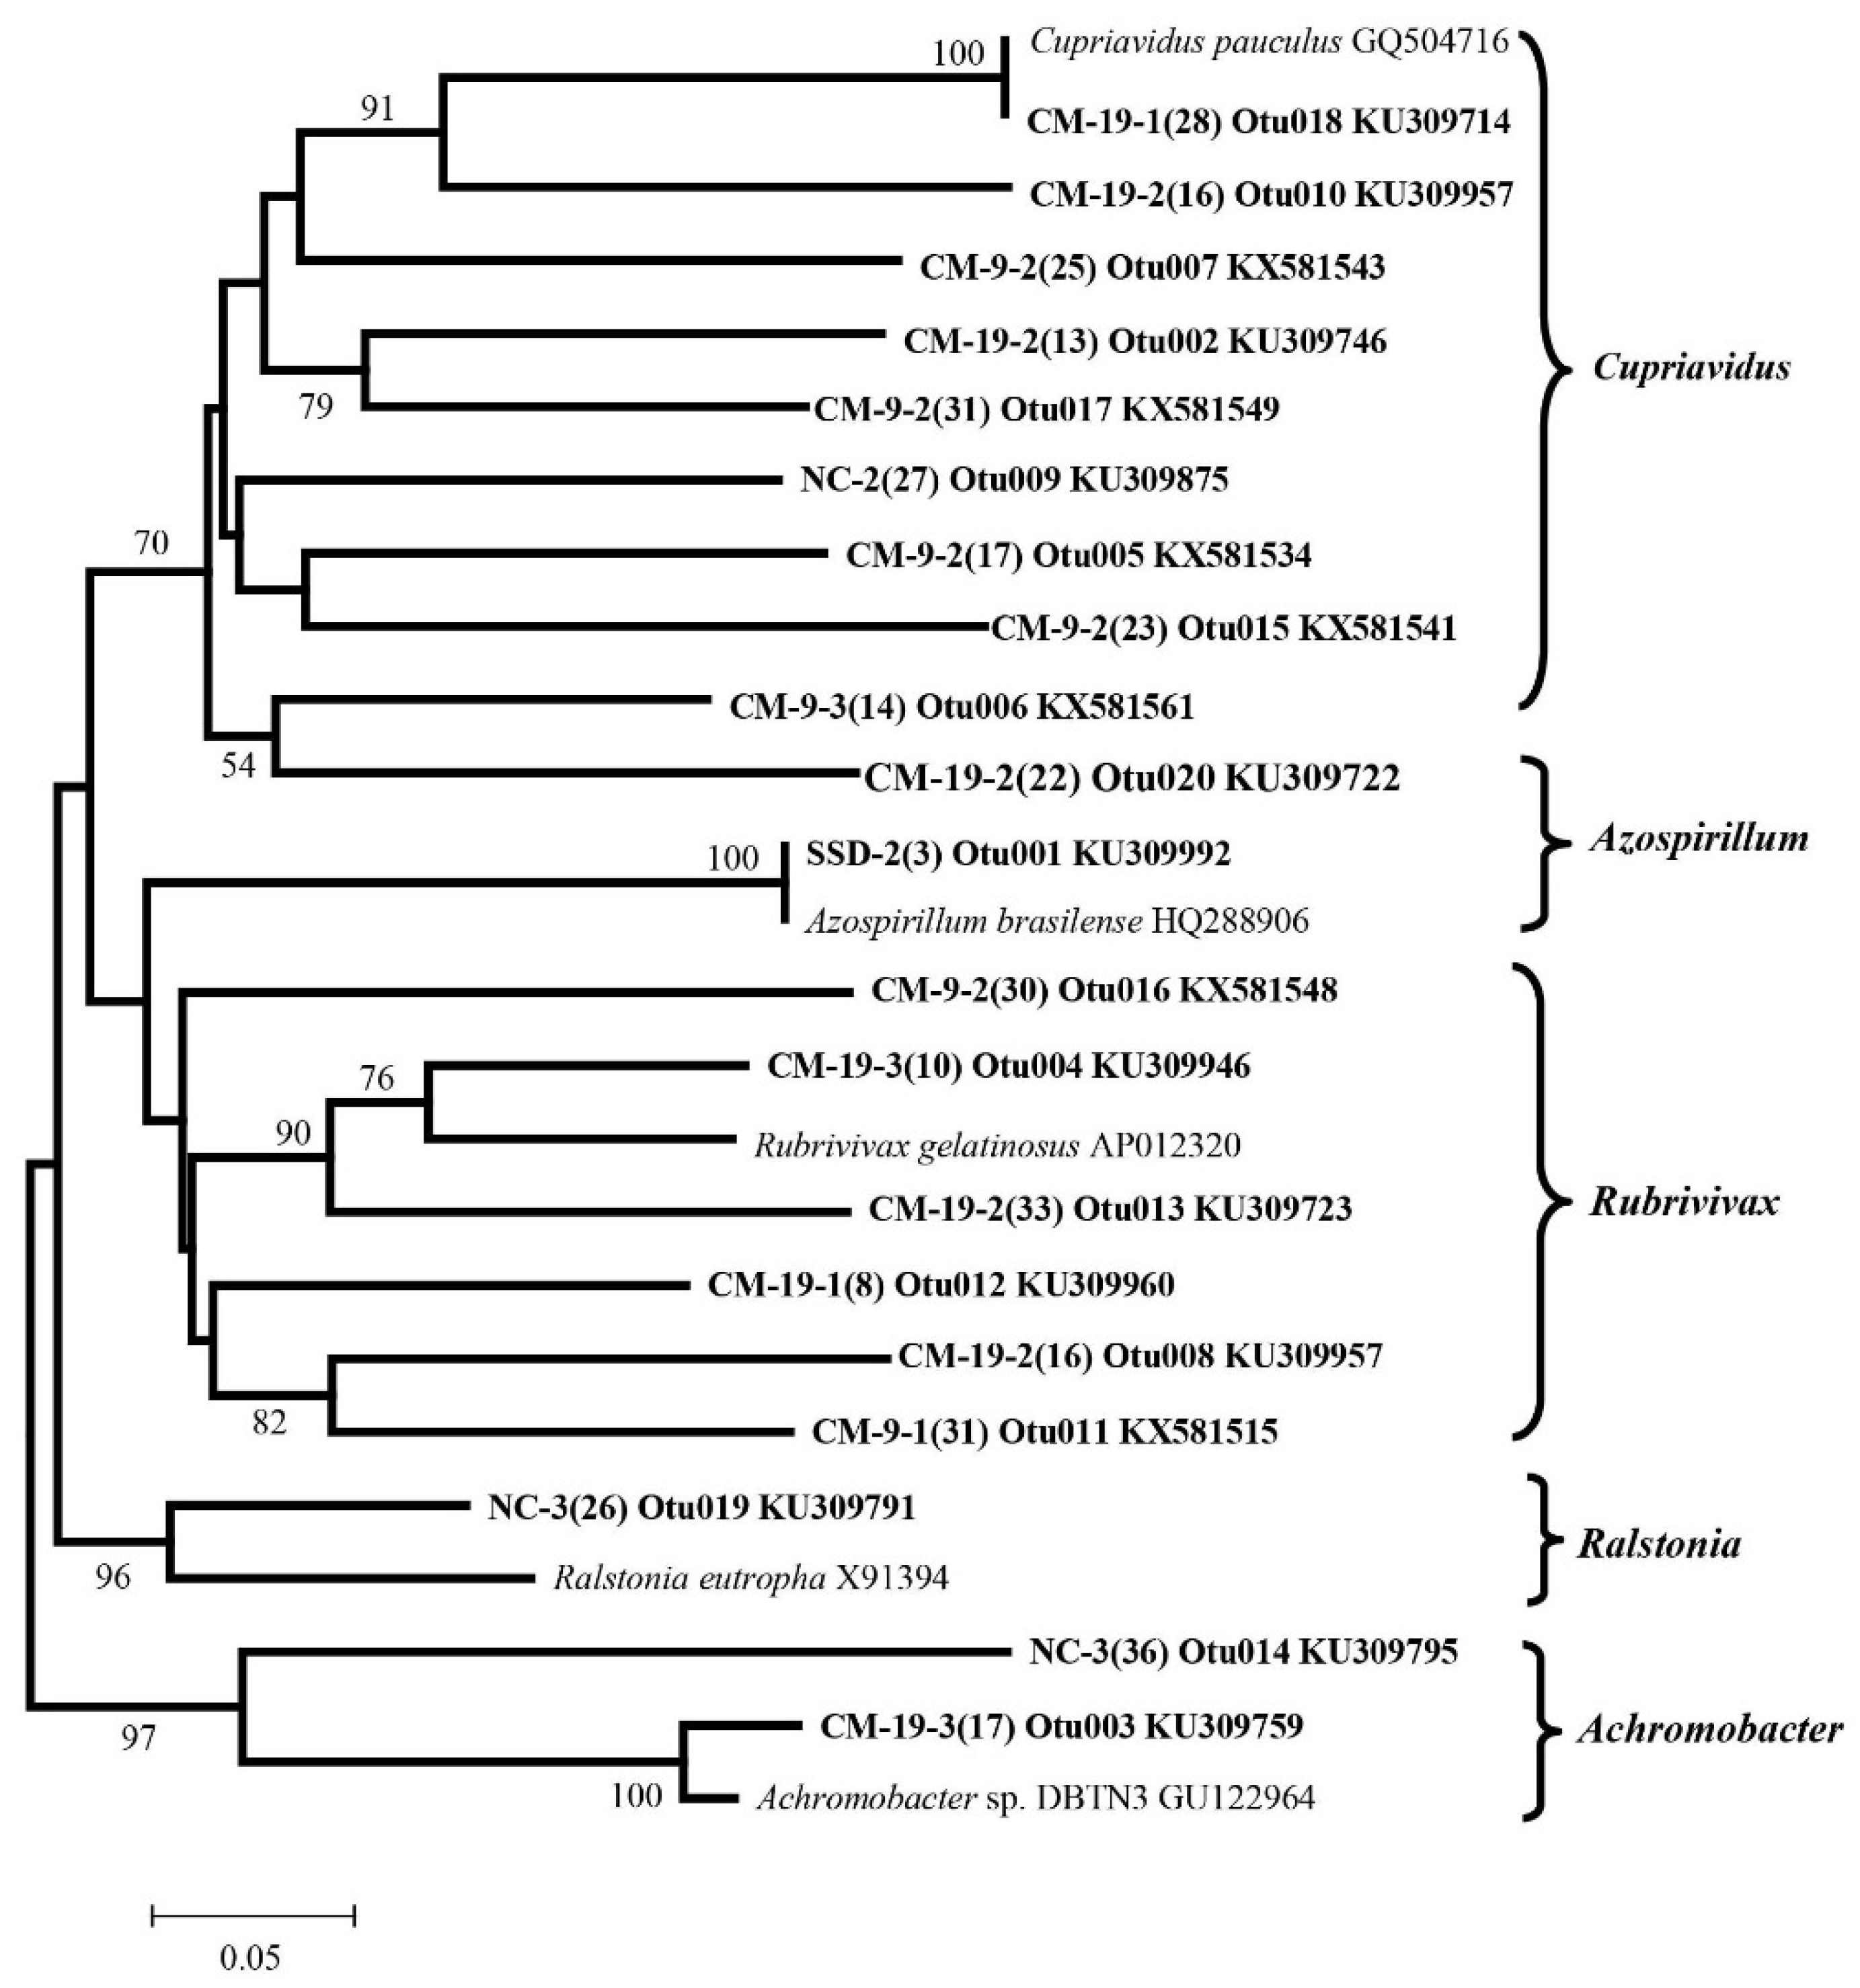
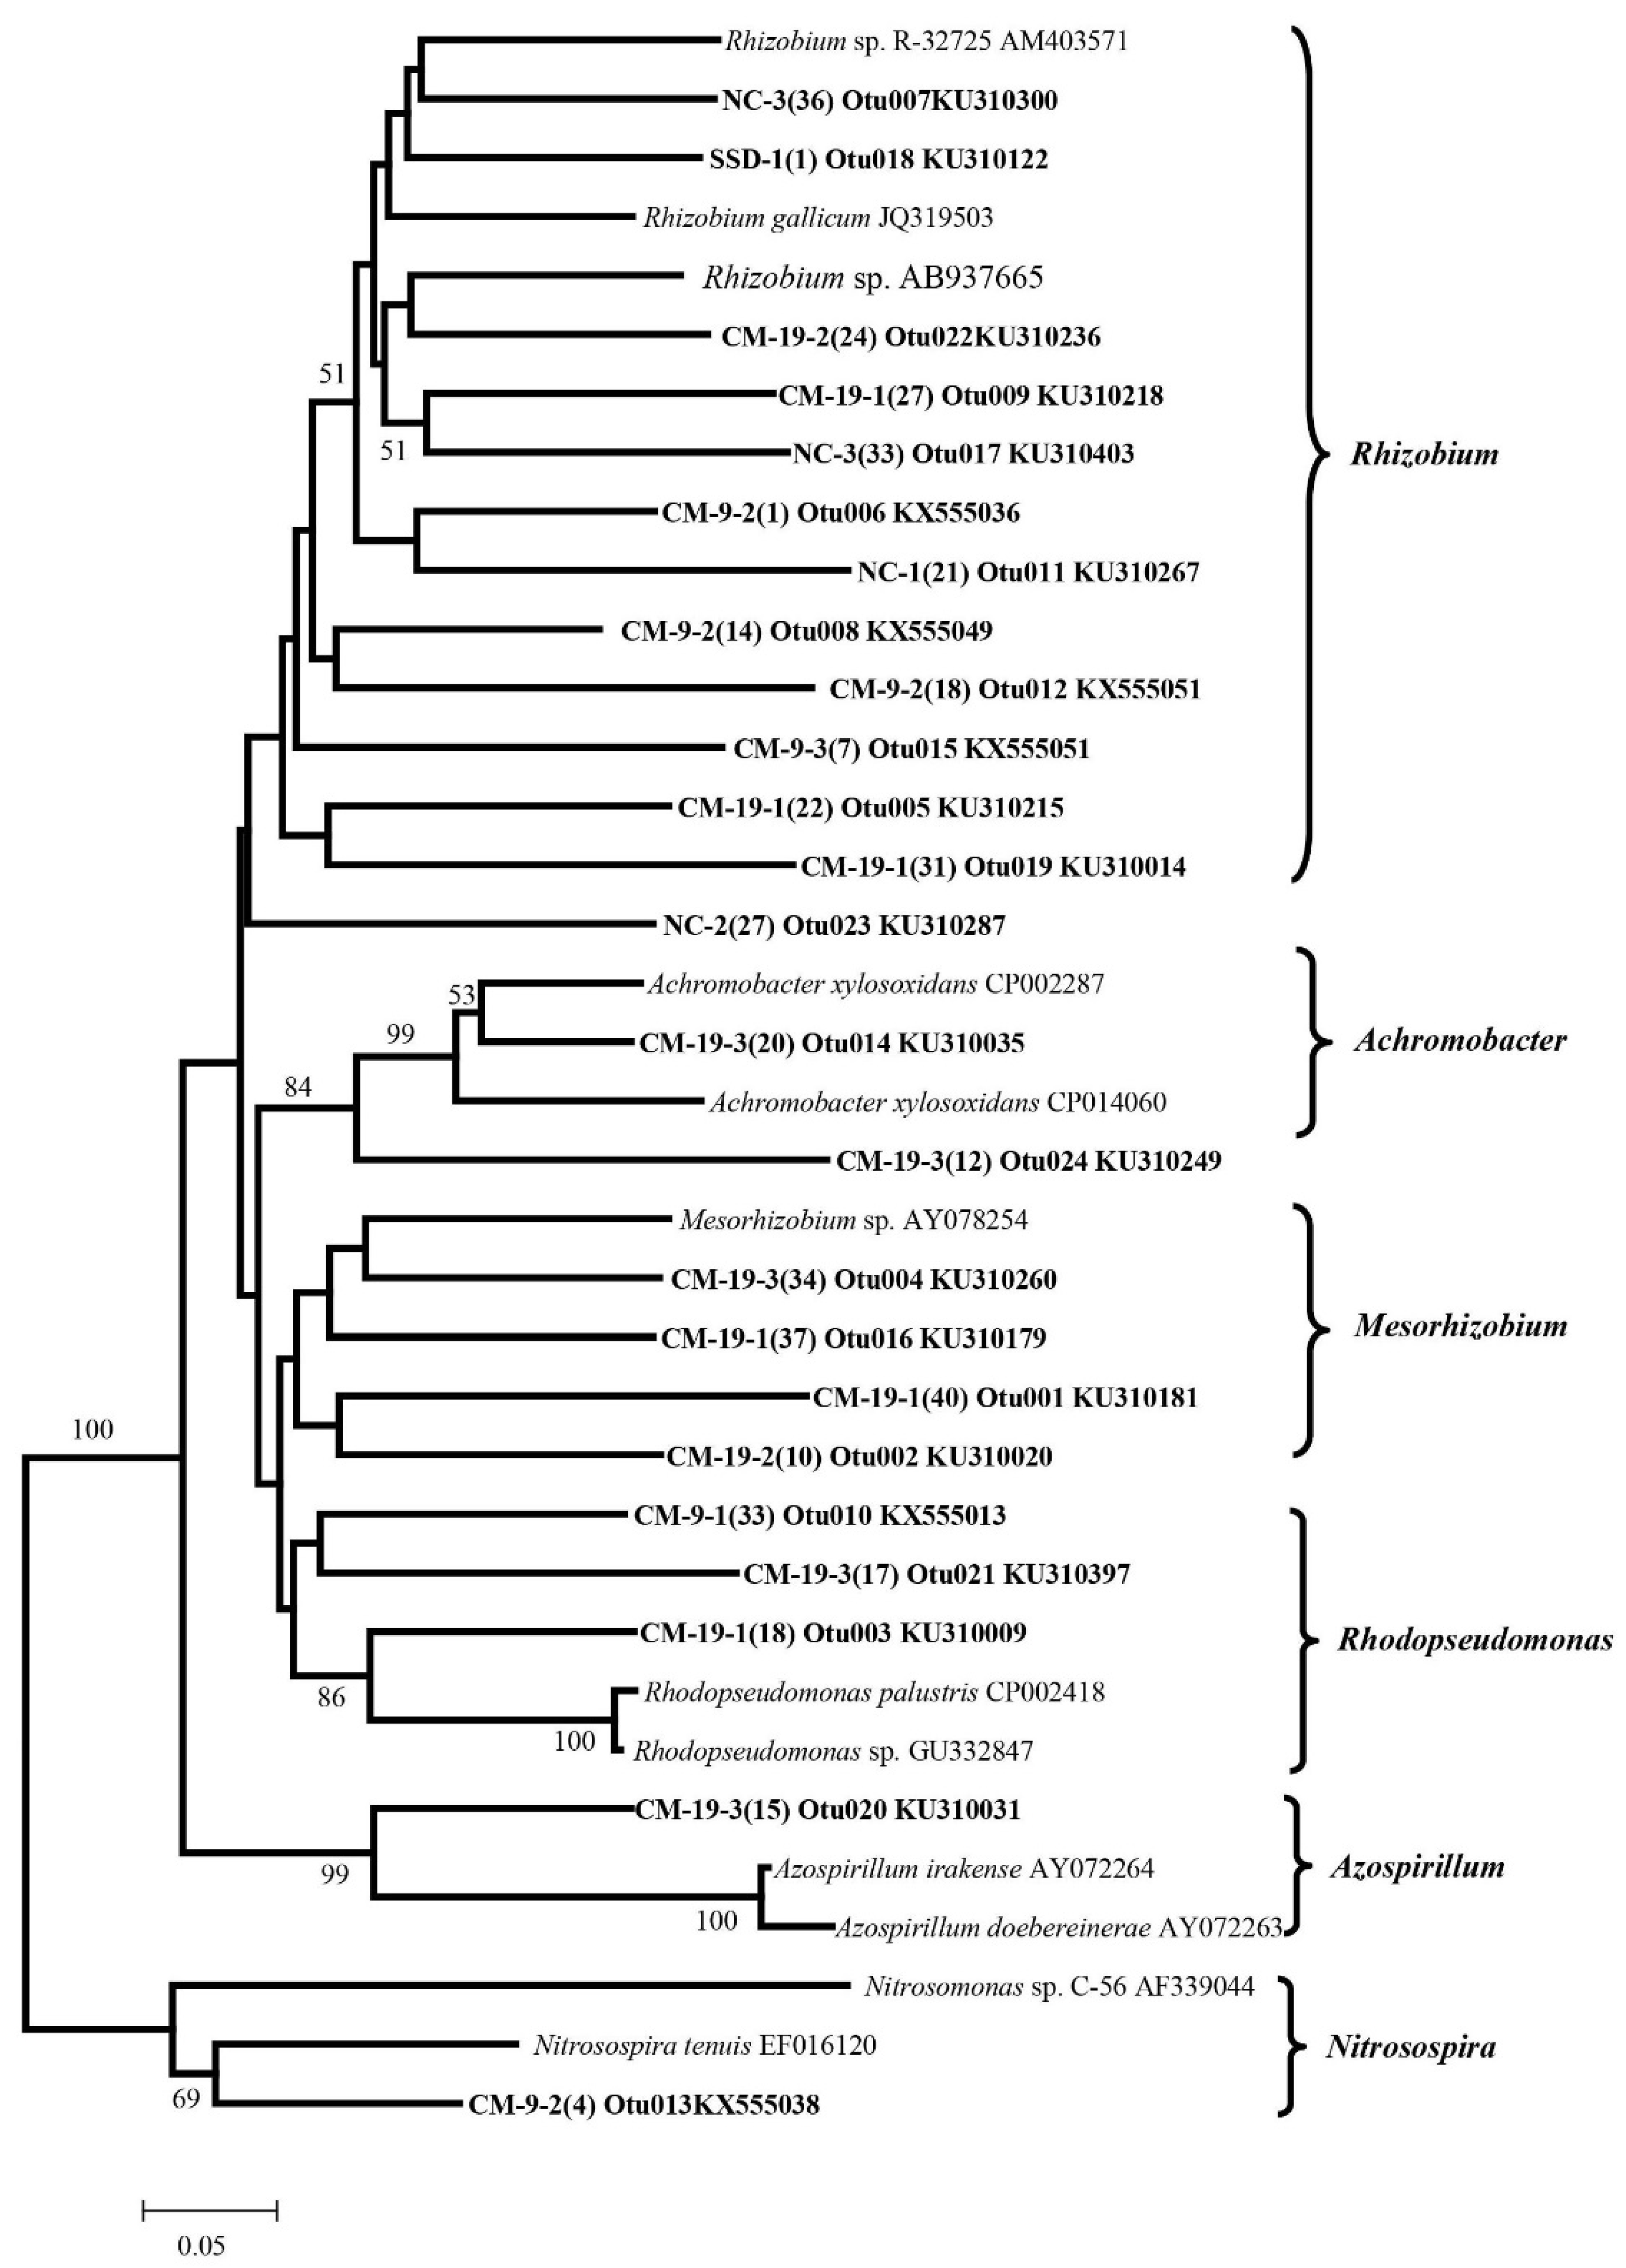
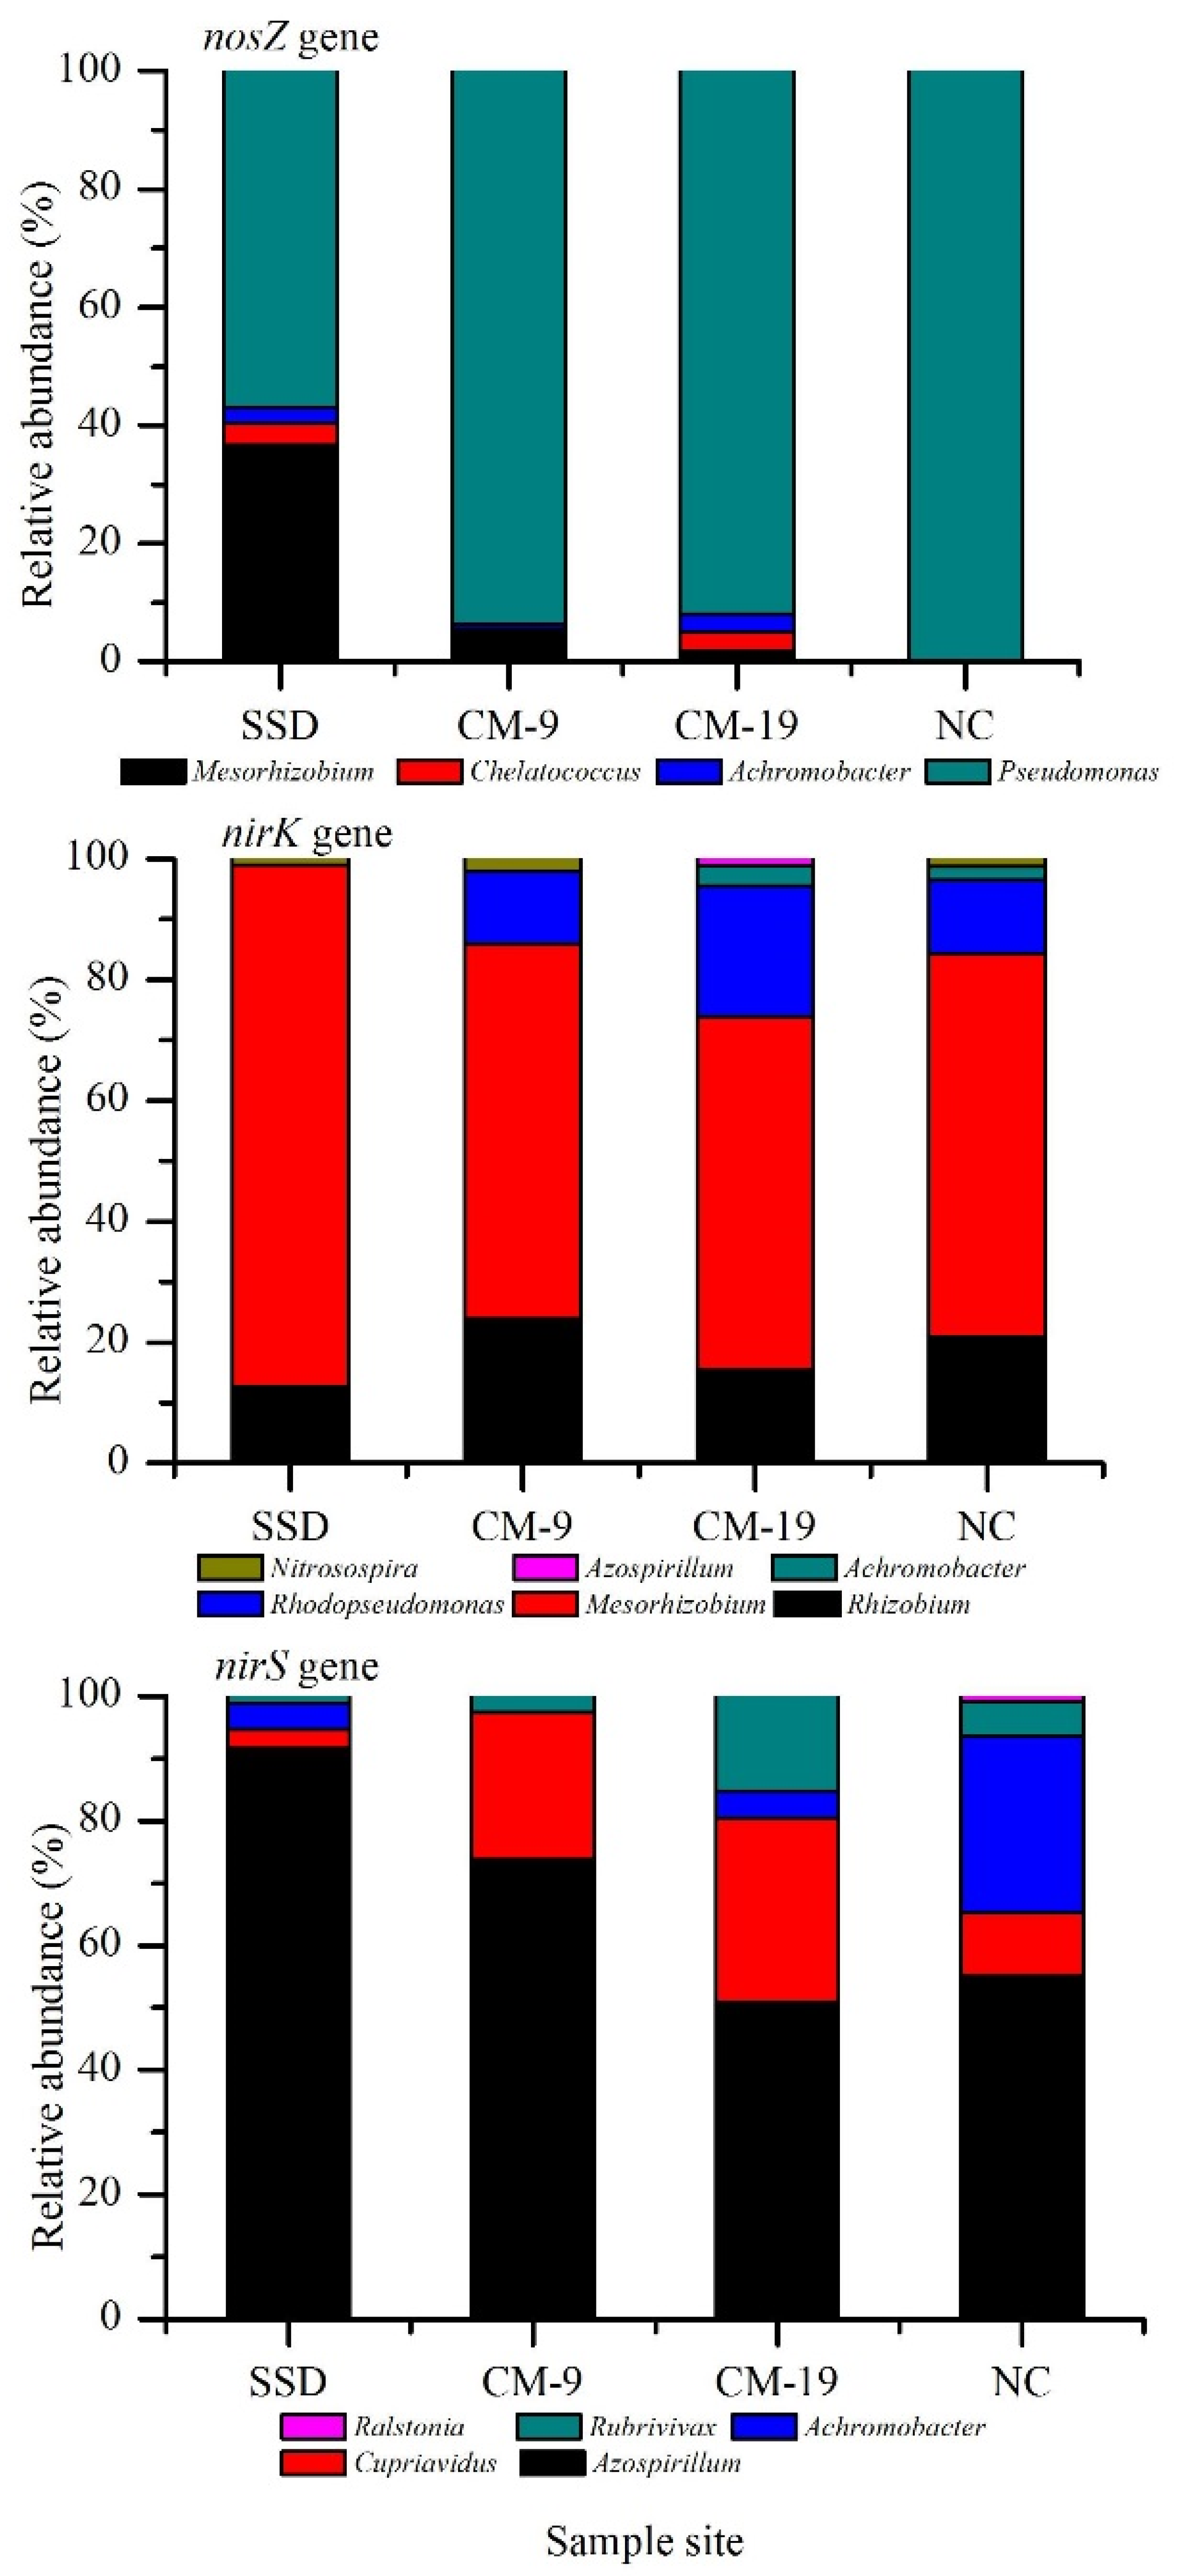
3.4. Detection of Denitrifying Bacterial Taxa

The phylogenetic trees of the representative OTUs of the three genes were obtained by using the neighbor-joining method (Figure 2, Figure 3 and Figure 4). The obtained nosZ, nirK, and nirS gene clones were spread throughout the respective trees. According to the phylogenetic trees, the nirK library can be divided into six clusters: Rhizobium, Achromobacter, Mesorhizobium, Rhodopseudomonas, Azospirillum, and Nitrosospira; the nirS library can be divided into five clusters: Cupriavidus, Azospirillum, Rubrivivax, Ralstonia, and Achromobacter, and the nosZ library can be classified into four clusters: Mesorhizobium, Chelatococcus, Achromobacter, and Pseudomonas.
The nosZ bacteria displayed a low diversity in sandy land. Pseudomonas was the dominant group of nosZ bacteria and the relative abundance in SSD, CM-9, CM-19, and NC were 56.91%, 94.60%, 92.00%, and 100%, respectively (Figure 5). Another dominant group in SSD was Mesorhizobium, with a relative abundance of 36.66%. While the relative abundance of Mesorhizobium in the plantation samples was all less than 5.48%. In the NC site, only Pseudomonas was observed, and the other nosZ taxa were absent. Several sequences related to Achromobacter in CM and Chelatococcus in SSD were also observed. Revegetation on shifting sand-dune significantly increased nosZ-carrying Pseudomonas and significantly decreased Mesorhizobium. The relative abundance of Pseudomonas in CM-9 was similar to that in NC. Six taxa were found in the nirK bacterial community, of which Mesorhizobium and Rhizobium were the dominant groups with relative abundance of 58.62%–87.13% and 9.9%–18.75%, respectively. Rhodopseudomonas, Nitrosospira, Achromobacter, and Azospirillum were absent in the SSD sample, and their relative abundance was fairly low in the vegetation-covered samples. Similar to nosZ, revegetation on shifting sand-dune induced decreases in the relative abundance of the Mesorhizobium, with 86.29%, 62.04%, 58.45%, and 63.38% in SSD, CM-9, CM-19, and NC, respectively. While Rhizobium increased in the vegetation-covered samples, and the relative abundance were 12.73%, 23.91%, 15.50%, and 20.99%, respectively. Rhodopseudomonas was not detected in SSD, and its abundance was similar to that of Rhizobium in vegetation-covered samples. Azospirillum was the dominant nirS bacteria in all the samples, particularly in SSD, with a relative abundance of 50.85–91.62%. Similarly, Cupriavidus in CMs and Achromobacter displayed high relative abundance. Ralstonia had the lowest relative abundance and was detected only in the NC sample.
Overall, vegetation-covered soils tended to have more diverse denitrifier, and revegetation on shifting sand dunes varied the relative abundance of dominant taxa. Only Mesorhizobium carrying the nirK and nosZ genes decreased after revegetation, while the other groups including Pseudomonas, Rhizobium, Rhodopseudomonas, Azospirillum, Cupriavidus, and Achromobacter showed increasing tendencies. The relative abundance of Rhizobium, Pseudomonas, Rhodopseudomonas and Mesorhizobium in CM-9 was already very close to that in NC.

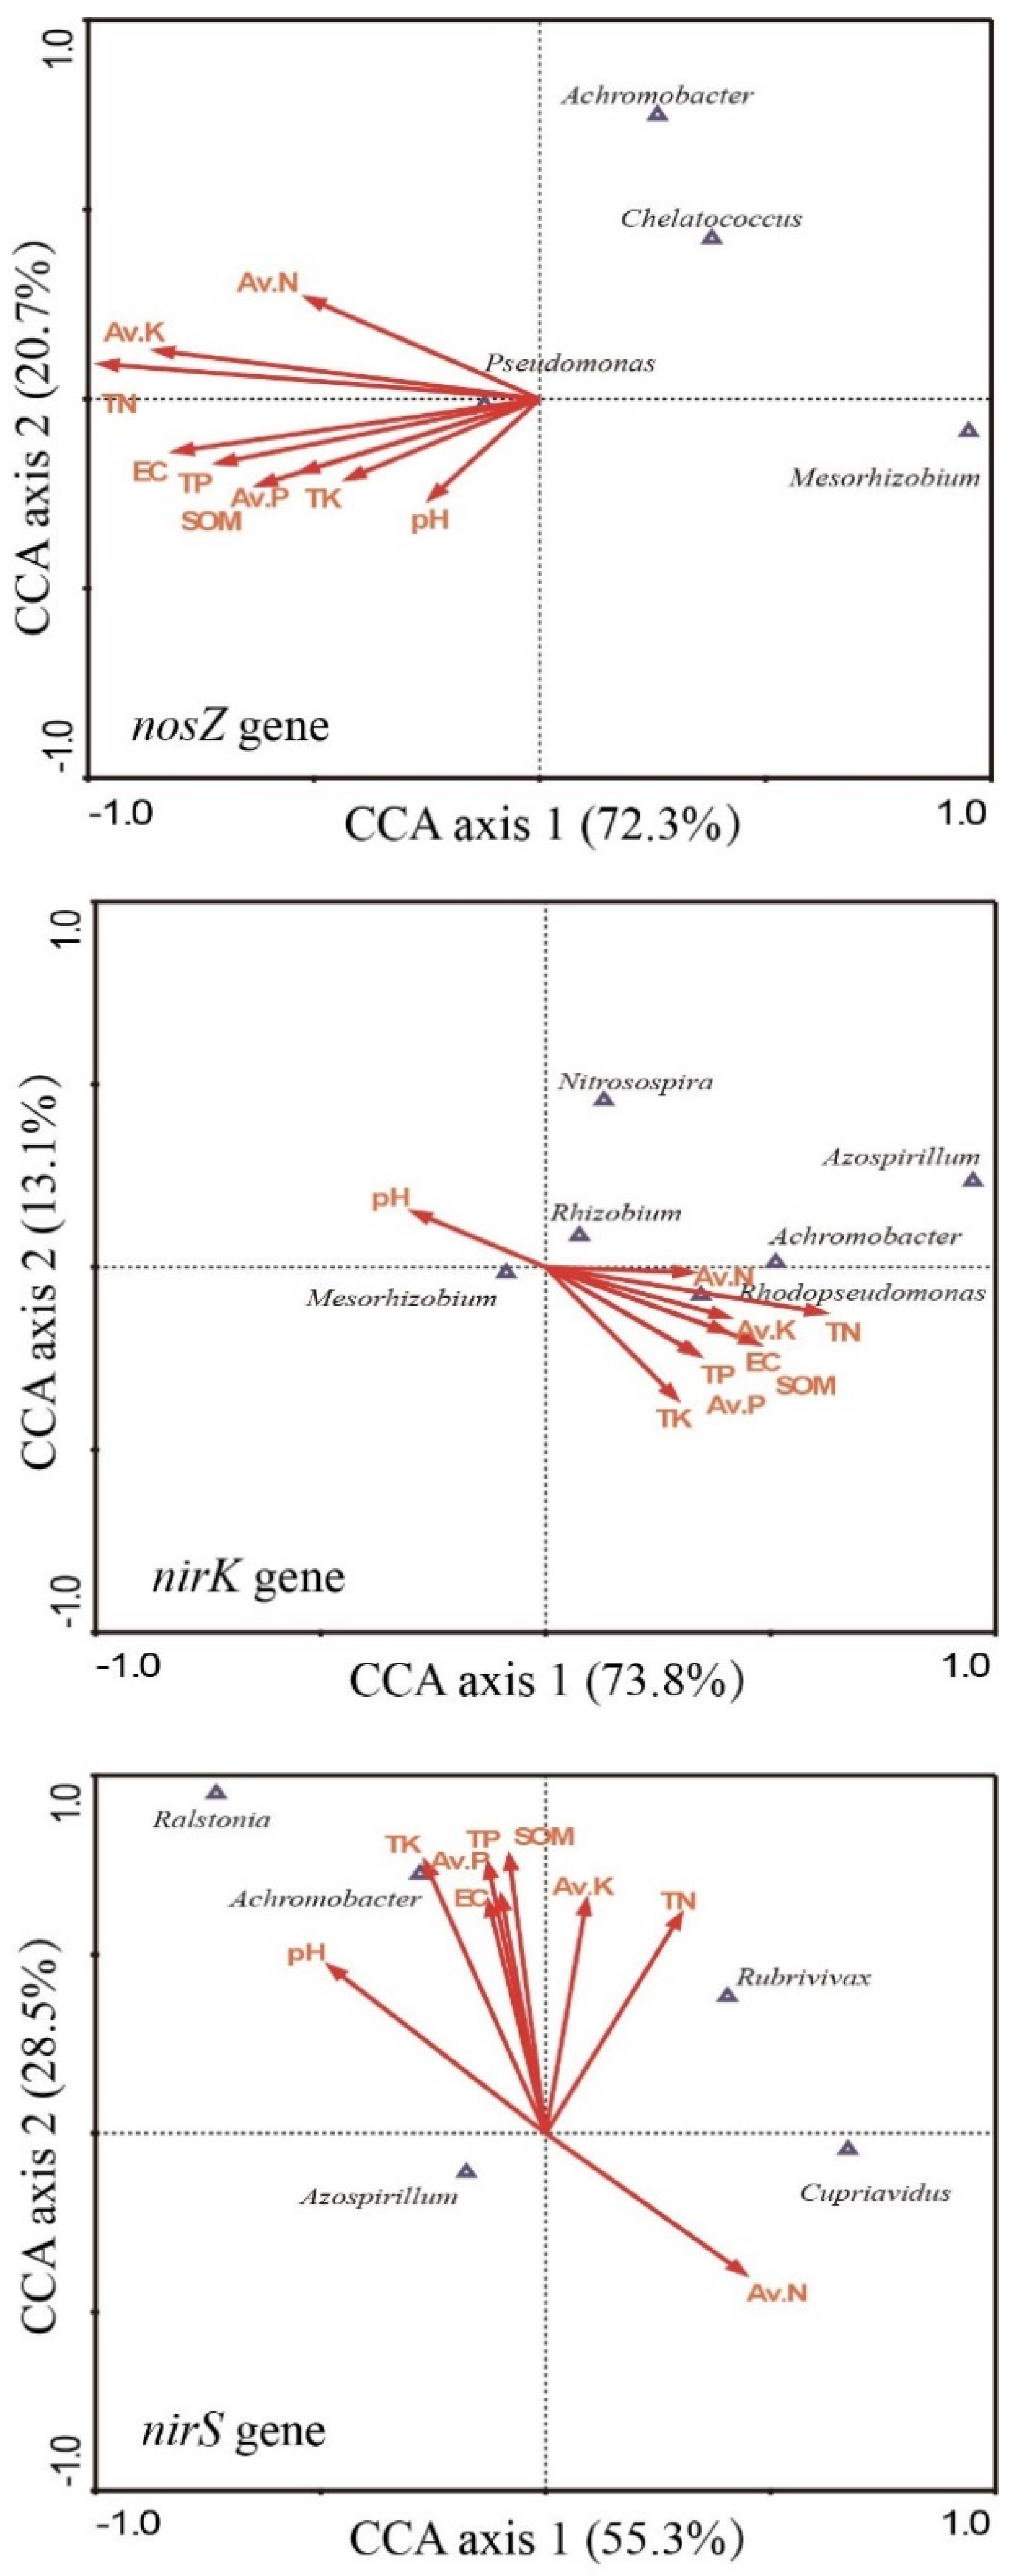
3.5. Relationship between the Composition of the Denitrifying Community and Soil Properties

CCA was carried out to examine the correlation between the dominant compositions of the nosZ, nirK, and nirS denitrifying communities and the selected variables of the soil samples. The results showed that CCA axis 1 and CCA axis 2 could explain 93.0 %, 86.9%, and 83.8% of the total variations in the structures of soil nosZ, nirK, and nirS communities, respectively (Figure 6). Soil pH, TN, and Av. N were most close to CCA axis 1, and correlated to the decrease in Mesorhizobium and increases in Rhizobium, Rhodopseudomonas, and Achromobacter in the nirK bacterial community. For nirS, soil pH and TN were two important variables determining the relative abundance of the nirS-carried genera. In the nosZ bacterial community, Pseudomonas was affected by all selected soil properties. On the whole, the relative abundance of the dominant nirK-, nirS-, and nosZ-carried taxa at the genera level were all affected by soil pH, TN, and Av. N.

4. Discussion

4.1. Improvement of Sand-Fixation Forest on Soil Nutrients

The restoration of soil nutrients via the establishment of sand-fixation plantation is a complicated ecological process that is simultaneously affected by many factors. The establishment of the plantation on shifting sand dunes can decrease the surface albedo and increase soil surface roughness, thereby affecting water-heat balance and wind regimes [34]. Surface soil improvement primarily resulted from the remarkable function of plantation against wind erosion [10]. The established C. microphylla forest can significantly reduce wind speed and intercept and deposit fine soil particles [1,10]. This phenomenon facilitates the accumulation of soil fine particles and increases soil nutrients. The biomass and litter of C. microphylla all increased with the plantation development; meanwhile, the rapid growth and death of herbs in the plantation increased the input of C, N, and other nutrients. N release via litter decomposition and microbial nitrogen fixation resulted in an increase in soil N. The improvement in SOM was mainly dependent on the increased litter and dead root inputs, reduced soil erosion, and low mineralization rate of soil organic carbon [1].

4.2. Effect of Revegetation on Soil-Denitrifying Communities

Different processes of soil N cycling are closely related to some microbial genes, which simultaneously regulate N cycles [33,35]. The denitrification is driven by different soil denitrifying communities. NirK, nirS and nosZ genes have been used as the molecular markers of denitrifying microbes [32,36], and their abundance shifts can reflect the dynamics of the soil denitrification activity. Molecular-scale investigations revealed that the denitrifying bacteria in shifting sand dune had lower species richness than that in natural community and C. microphylla plantations. This finding indicates that soil desertification decreased the diversity of the denitrifying bacteria, whereas revegetation can restore denitrifying communities. However, the dominant groups of denitrifying communities did not shift with the vegetation degradation and the development of C. microphylla plantations. The result suggests that the core components of denitrifying communities are relatively stable and are slightly affected by the vegetation and soil amelioration. However, the amount of soil bacteria significantly varied with vegetation cover, land-use change, and plantation age [9,37,38,39,40,41]. In this study, the three gene copies linearly increased with plantation age (Figure 2) probably due to the gradual improvement of soil nutrients after revegetation. The improved soil environment facilitated the growth and propagation of soil denitrifiers and increased the size of the denitrifying community.
The nirK genes had relatively higher diversities than that of the other two genes, which is consistent with the results of Yoshida et al. [42]. Most of the nosZ, nirK, and nirS clones were found to be related to known sequences. Many clones were closely related to nosZ-carrying Pseudomonas bacteria, nirK-carrying Mesorhizobium, Rhizobium, and Rhodopseudomonas bacteria, and nirS-carrying Azospirillum and Cupriavidus bacteria, which have been detected in different environments [27,42,43]. These results indicate that the denitrifiers harboring previously uncharacterized nosZ, nirK, and nirS genes were abundant in soil. In line with this finding, the three gene sequences were all observed in arable soil, sea sediment, forests, and wetland soils [27,36,43,44].
Compared with previous studies [27,42], the present study observed considerably fewer sequences and OTUs of the three genes, and only a number of dominant taxa can be detected in the community. For example, all nosZ sequences in the natural community sample belonged to Pseudomonas and no other taxa were observed. This phenomenon indicates that the denitrifying microbial community in arid sandy soil was simple in composition, prominent in dominant species, and relatively stable in structure. Barren sandy land is unsuitable for microbial survival due to its extremely poor nutrient and the severely arid soil status [10]. Thus, fewer members of soil denitrifiers would be expected. Although an arid environment is unfavorable for microbial existence, species with strong capability to utilize limited resources for growth can survive [10,45]. This phenomenon could lead to the predominance of some microbial populations and/or the disappearance of others because of interspecific competition [9]. Pseudomonas was abundant in sandy soil, which was consistent with the results of some studies [9,22]. This consistent finding is possibly because Pseudomonas can metabolize refractory detritus or xenobiotics as C, N, S, and P sources from sandy soil [46]. Additionally, the composition and the relative abundance of dominant taxa of the soil denitrifying community in 9-year-old plantation were already very close to that in the natural community sample; however, the plant diversity under the plantation was much lower than that in the natural community [5], which suggests the restorations of plant community and soil denitrifying community are asymmetric and the constituent recovery of the soil denitrifying community is faster than vegetation restoration, although a long time is still needed to restore the size of soil denitrifying community [47].
Soil environmental variation can significantly change the structure of a microbial community. Sun et al. [48] reported that the nirK bacterial community was influenced by nitrate, while pH and soil moisture were the key factors attributed to the shift of the nosZ bacterial community. Vegetation type indirectly affects soil denitrifying bacterial communities depending on the differences in microenvironment, quantity and quality of litter, root exudates, and the interaction with symbiotic bacteria [49]. Graham et al. [50] reported that pH was one of determinant of the all N-cycle. This study also suggested that the change in soil pH induced by revegetation is one of determinants for triggering the restoration of the denitrifying community. Meanwhile, the increased in TN and Av. N promoted the recovery of the soil denitrifying community, because N is limited nutrient for plant and microbial growth in arid and semi-arid soil. In addition, our results indicate that the soil properties influenced the nirK bacterial community more significantly than the other two communities, which is consistent with the report of Yoshida et al. [42].
Overall, the dominant taxa of nosZ, nirK, or nirS communities in forest samples remained almost unchanged compared with those in shifting sand dunes, suggesting the effects of revegetation on denitrifiers mainly depending on the quantitative change in dominant taxa. This phenomenon also indicated that the basic composition of the denitrifying community was mainly attributed to soil type or/and local climate rather than vegetation [38]. However, the quantities of denitrifying microbes in C. microphylla forests was much higher than that in shifting sand dunes. Moreover, the absolute copies of these genes linearly increased with the plantation age because improved soil nutrient and microenvironment could increase the quantity of soil microbes, including denitrifiers. Hence, the soil-denitrifying community structure was quantitatively influenced by the establishment of plantations.

5. Conclusions

The present study indicated that soil nirK, nirS, and nosZ denitrifying communities in shifting sand dunes can be restored by the establishment of native shrub plantation, and the recovery rate is faster than vegetation restoration. The copies of nosZ, nirK, and nirS genes all increased along forest development. Although revegetation had no significant influence on the dominant taxa of the denitrifying community, it facilitated the quantitative restoration because of the increase in soil nutrient. Soil pH, total N, and available N affected the structures of the denitrifying communities by altering the relative abundance of dominant genera.

Author Contributions

Conceptualization: C.C.; Methodology: C.C. and Y.Z.; investigation: Z.C.; Data curation: H.L., T.W. and Q.R.; Writing: C.C. All authors have read and agreed to the published version of the manuscript.

Funding

This research was funded by the National Natural Science Foundation of China (grand No. 41877536, No. 41371505, and No. 41403063).

Data Availability Statement

Datasets can be obtained from the corresponding author.

Acknowledgments

The authors thank the Wulanaodu Desertification Control Station under the Chinese Academy of Sciences for field work.

Conflicts of Interest

The authors declare no conflict of interest.

References

  1. Cao, C.Y.; Jiang, D.M.; Teng, X.H.; Jiang, Y.; Liang, W.J.; Cui, Z.B. Soil chemical and microbiological properties along a chronosequence of Caragana microphylla Lam. plantations in the Horqin Sandy Land of Northeast China. Appl. Soil Ecol. 2008, 40, 78–85. [Google Scholar] [CrossRef]
  2. Liu, X.M.; Zhao, H.L. Comprehensive Strategy for Eco-Environmental Control in Horqin Sand Land; Gansu Science and Technology Publishing House: Lanzhou, China, 1993. [Google Scholar]
  3. Jiang, F.Q.; Cao, C.Y.; Zeng, D.H. Degradation and Restoration of Ecosystems on Horqin Sand Land; Chinese Forestry Publishing House: Beijing, China, 2002. [Google Scholar]
  4. Cao, C.Y.; Jiang, S.Y.; Zhang, Y.; Zhang, F.X.; Han, X.S. Spatial variability of soil nutrients and microbiological properties after the establishment of leguminous shrub Caragana microphylla Lam. plantation on sand dune in the Horqin Sandy Land of Northeast China. Ecol. Eng. 2011, 37, 1467–1475. [Google Scholar] [CrossRef]
  5. Cao, C.Y.; Jiang, D.M.; Alamsa; Luo, Y.M.; Kou, Z.W. Ecological processes of vegetation restoration of Caragana mirophylla in the sand fixing area. Chin. J. Appl. Ecol. 2000, 11, 349–354. [Google Scholar]
  6. Guan, P.T.; Zhang, X.K.; Yu, J.; Ma, N.N.; Liang, W.J. Variation of soil nematode community composition with increasing sand-fixation year of Caragana microphylla: Bioindication for desertification restoration. Ecol. Eng. 2018, 81, 93–101. [Google Scholar] [CrossRef]
  7. Su, Y.Z.; Zhao, H.F. Soil properties and plant species in an age sequence of Caragana microphylla plantations in the Horqin Sandy Land, north China. Ecol. Eng. 2003, 20, 223–235. [Google Scholar] [CrossRef]
  8. Wang, L.; Zhao, G.L.; Sun, Y.J.; Yang, Y.; Zhou, H.J. Effects of Thinning on microbial community structure in the organic horizon of Chinese pine plantations in Badaling, Beijing, China. Forests 2019, 10, 828. [Google Scholar] [CrossRef] [Green Version]
  9. Cao, C.Y.; Zhang, Y.; Cui, Z.B.; Feng, S.W.; Wang, T.T.; Ren, Q. Soil bacterial community responses to revegetation of moving sand dune in semi-arid grassland. Appl. Microbiol. Biotechnol. 2017, 101, 6217–6228. [Google Scholar] [CrossRef] [PubMed]
  10. Jiang, D.M.; Cao, C.Y.; Zhang, Y.; Cui, Z.B.; Han, X.S. Plantations of native shrub species restore soil microbial diversity in the Horqin Sandy Land, northeastern China. J. Arid Land 2014, 6, 445–453. [Google Scholar] [CrossRef] [Green Version]
  11. Zhang, Y.; Cao, C.Y.; Peng, M.; Xu, X.J.; Zhang, P.; Yu, Q.J.; Sun, T. Diversity of nitrogen-fixing, ammonia-oxidizing, and denitrifying bacteria in biological soil crusts of a revegetation area in Horqin Sandy Land, Northeast China. Ecol. Eng. 2014, 41, 71–79. [Google Scholar] [CrossRef]
  12. Liu, L.C.; Liu, Y.B.; Hui, R.; Xie, M. Recovery of microbial community structure of biological soil crusts in successional stages of Shapotou desert revegetation, northwest China. Soil Biol. Biochem. 2017, 107, 125–128. [Google Scholar] [CrossRef]
  13. Zhelezova, A.; Chernov, T.; Tkhakakhova, A.; Xenofontova, N.; Semenov, M.; Kutovaya, O. Prokaryotic community shifts during soil formation on sands in the tundra zone. PLoS ONE 2019, 14, e0206777. [Google Scholar] [CrossRef] [PubMed] [Green Version]
  14. Zuo, X.A.; Zhao, H.L.; Zhao, X.Y.; Zhang, T.H.; Guo, Y.R.; Wang, S.K.; Drake, S. Spatial pattern and heterogeneity of soil properties in sand dunes under grazing and restoration in Horqin Sandy Land, Northern China. Soil Tillage Res. 2008, 99, 202–212. [Google Scholar] [CrossRef]
  15. Che, R.; Qin, J.; Tahmasbian, I.; Wang, F.; Zhou, S.; Xu, Z.; Cui, X.Y. Litter amendment rather than phosphorus can dramatically change inorganic nitrogen pools in a degraded grassland soil by affecting nitrogen-cycling microbes. Soil Biol. Biochem. 2018, 120, 145–152. [Google Scholar] [CrossRef]
  16. Zumft, W.G. Cell biology and molecular basis of denitrification. Microbiol. Mol. Biol. Rev. 1997, 61, 533–616. [Google Scholar] [CrossRef] [PubMed]
  17. Philippot, L.; Hojberg, O. Dissimilatory nitrate reductases in bacteria. Biochim. Et Biophys. Acta-Gene Struct. Expressopn 1999, 1446, 1–23. [Google Scholar] [CrossRef]
  18. Bru, D.; Sarr, A.; Philippot, L. Relative abundances of proteobacterial membrane-bound and periplasmic nitrate reductases in selected environments. Appl. Environ. Microbiol. 2007, 73, 5971–5974. [Google Scholar] [CrossRef] [PubMed] [Green Version]
  19. Henry, S.; Baudoin, E.; Lopez-Gutierrez, J.C.; Martin-Laurent, F.; Brauman, A.; Philippot, L. Quantification of denitrifying bacteria in soils by nirK gene targeted real-time PCR. J. Microbiol. Methods 2004, 59, 327–335. [Google Scholar] [CrossRef] [PubMed]
  20. Horn, M.A.; Drake, H.L.; Schramm, A. Nitrous oxide reductase genes (nosZ) of denitrifying microbial populations in soil and the earthworm gut are phylogenetically similar. Appl. Environ. Microbiol. 2006, 72, 1019–1026. [Google Scholar] [CrossRef] [PubMed] [Green Version]
  21. Sanchez, C.; Tortosa, G.; Granados, A.; Delgado, A.; Bedmar, E.J.; Delgado, M.J. Involvement of Bradyrhizobium japonicum denitrification in symbiotic nitrogen fixation by soybean plants subjected to flooding. Soil Biol. Biochem. 2011, 43, 212–217. [Google Scholar] [CrossRef]
  22. Li, H.L.; Zhang, Y.; Wang, T.T.; Feng, S.W.; Ren, Q.; Cui, Z.B.; Cao, C.Y. Responses of soil denitrifying bacterial communities carrying nirS, nirK, and nosZ genes to revegetation of moving sand dunes. Ecol. Indictors 2019, 107, 105541. [Google Scholar] [CrossRef]
  23. FAO. FAO/ IUSS Working Group WRB, World reference base for soil resources. In World Soil Resources Reports103; FAO: Rome, Italy, 2006. [Google Scholar]
  24. Nelson, D.W.; Sommers, L.E. Total Carbon, Organic Carbon and Organic Matter, Part 2. In Methods of Soil Analysis, 2nd ed.; Page, A.L., Miller, R.H., Keeney, D.R., Eds.; American Society of Agronomy: Madison, WI, USA, 1982; Volume 9, pp. 539–577. [Google Scholar]
  25. Institute of Soil Science, Chinese Academy of Sciences (ISSCAS). Physical and Chemical Analysis Methods of Soils; Shanghai Science Technology Press: Shanghai, China, 1978; pp. 7–59. [Google Scholar]
  26. Rich, J.J.; Heichen, R.S.; Bottomley, P.J.; Cromack, K.; Myrold, D.D. Community composition and functioning of denitrifying bacteria from adjacent meadow and forest soils. Appl. Environ. Microbiol. 2003, 69, 5974–5982. [Google Scholar] [CrossRef] [Green Version]
  27. Throbäck, I.N.; Enwall, K.; Jarvis, A.; Hallin, S. Reassessing PCR primers targeting nirS, nirK and nosZ genes for community surveys of denitrifying bacteria with DGGE. FEMS Microbiol. Ecol. 2004, 49, 401–417. [Google Scholar] [CrossRef]
  28. Tippmann, H.F. Analysis for free: Comparing programs for sequence analysis. Brief. Bioinform. 2004, 5, 82–87. [Google Scholar] [CrossRef]
  29. Han, M.Q.; Li, Z.Y.; Zhang, F.L. The ammonia oxidizing and denitrifying prokaryotes associated with sponges from different sea areas. Microb. Ecol. 2013, 66, 427–436. [Google Scholar] [CrossRef] [PubMed]
  30. Kumar, S.; Tamura, K.; Nei, M. MEGA3: Integrated software for molecular evolutionary genetics analysis and sequence alignment. Brief. Bioinform. 2004, 5, 150–163. [Google Scholar] [CrossRef] [Green Version]
  31. Henry, S.; Bru, D.; Stres, B.; Hallet, S.; Philippot, L. Quantitative detection of the nosZ gene, encoding nitrous oxide reductase, and comparison of the abundances of 16S rRNA, narG, nirK, and nosZ genes in soils. Appl. Environ. Microbiol. 2006, 72, 5181–5189. [Google Scholar] [CrossRef] [Green Version]
  32. Kandeler, E.; Deiglmayr, K.; Tscherko, D.; Bru, D.; Philippot, L. Abundance of narG, nirS, nirK, and nosZ genes of denitrifying bacteria during primary successions of a glacier foreland. Appl. Environ. Microbiol. 2006, 72, 5957–5962. [Google Scholar] [CrossRef] [PubMed] [Green Version]
  33. Schloss, P.D.; Westcott, S.L.; Ryabin, T.; Hall, J.R.; Hartmann, M.; Hollister, E.B.; Lesniewski, R.A.; Oakley, B.B.; Parks, D.H.; Robinson, C.J. Introducing mothur: Open-source, platform independent, community-supported software for describing and comparing microbial communities. Appl. Environ. Microbiol. 2009, 75, 7537–7541. [Google Scholar] [CrossRef] [PubMed] [Green Version]
  34. Li, S.G.; Harazono, Y.; Zhao, H.L.; He, Z.Y.; Chang, X.L.; Zhao, X.Y.; Zhang, T.H.; Oikawa, T. Micrometeorological changes following establishment of artificially established Artemisia vegetation on desertified sandy land in the Horqin sandy land, China and their implication on regional environmental change. J. Arid Environ. 2002, 52, 101–119. [Google Scholar] [CrossRef]
  35. Wang, H.L.; Deng, N.; Wu, D.Y.; Hu, S.; Kou, M. Long-term net transformation and quantitative molecular mechanisms of soil nitrogen during natural vegetation recovery of abandoned farmland on the Loess Plateau of China. Sci. Total Environ. 2017, 607, 152–159. [Google Scholar] [CrossRef] [PubMed]
  36. Ligi, T.; Truu, M.; Truu, J.; Nolvak, H.; Kaasik, A.; Mitsch, W.J.; Mander, U. Effects of soil chemical characteristics and water regime on denitrification genes (nirS, nirK, and nosZ) abundances in a created riverine wetland complex. Ecol. Eng. 2014, 42, 47–55. [Google Scholar] [CrossRef]
  37. Kara, O.; Bolat, I.; Cakiroglu, K.; Ozturk, M. Plant canopy effects on litter accumulation and soil microbial biomass in two temperate forests. Biol. Fertil. Soils 2008, 45, 193–198. [Google Scholar] [CrossRef]
  38. Jangid, K.; Williams, M.A.; Franzluebbers, A.J.; Schmidt, T.M.; Coleman, D.C.; Whitman, W.B. Land-use history has a stronger impact on soil microbial community composition than aboveground vegetation and soil properties. Soil Biol. Biochem. 2011, 43, 2184–2193. [Google Scholar] [CrossRef]
  39. Prescott, C.E.; Grayston, S.J. Tree species influence on microbial communities in litter and soil: Current knowledge and research needs. For. Ecol. Manag. 2013, 309, 19–27. [Google Scholar] [CrossRef]
  40. Liu, J.L.; Dang, P.; Gao, Y.; Zhu, H.L.; Zhu, H.N.; Zhao, F.; Zhao, Z. Effects of tree species and soil properties on the composition and diversity of the soil bacterial community following afforestation. For. Ecol. Manag. 2018, 427, 342–349. [Google Scholar] [CrossRef]
  41. Jurksiene, G.; Janusauskaite, D.; Baliuckas, V. Microbial community analysis of Nnative Pinus sylvestris L. and alien Pinus mugo L. on dune sands as determined by Ecoplates. Forests 2020, 11, 1202. [Google Scholar] [CrossRef]
  42. Yoshida, M.; Ishii, S.; Otsuka, S.; Senoo, K. Temporal shifts in diversity and quantity of nirS and nirK in a rice paddy field soil. Soil Biol. Biochem. 2009, 41, 2044–2051. [Google Scholar] [CrossRef]
  43. Katsuyama, C.; Kondo, N.; Suwa, Y.; Yamagishi, T.; Itoh, M.; Ohte, N.; Kimura, H.; Nagaosa, K.; Kato, K. Denitrification activity and relevant bacteria revealed by nitrite reductase gene fragments in soil of temperate mixed forest. Microbes Environ. 2008, 23, 337–345. [Google Scholar] [CrossRef] [PubMed] [Green Version]
  44. Priemé, A.; Braker, G.; Tiedje, J.M. Diversity of nitrite reductase (nirK and nirS) gene fragments in forested upland and wetland soils. Appl. Environ. Microbiol. 2002, 68, 1893–1900. [Google Scholar] [CrossRef] [PubMed] [Green Version]
  45. Zhang, Y.; Cao, C.Y.; Han, X.S.; Jiang, S.Y. Soil nutrient and microbiological property recoveries via native shrub and semi-shrub plantations on moving sand dunes in Northeast China. Ecol. Eng. 2013, 53, 1–5. [Google Scholar] [CrossRef]
  46. Molina, L.; Ramos, C.; Duque, E.; Ronchel, M.C.; Garcia, J.M.; Wyke, L.; Ramos, J.L. Survival of Pseudomonas putida KT2440 in soil and in the rhizosphere of plants under greenhouse and environmental conditions. Soil Biol. Biochem. 2000, 32, 315–321. [Google Scholar] [CrossRef]
  47. Zhang, Y.; Cao, C.Y.; Cui, Z.B.; Qian, W.; Liang, C.P.; Wang, C.M. Soil bacterial community restoration along a chronosequence of sand-fixing plantations on moving sand dunes in the Horqin sandy land in northeast China. J. Arid Environ. 2019, 165, 81–87. [Google Scholar] [CrossRef]
  48. Sun, Y.F.; Shen, J.P.; Zhang, C.J.; Zhang, L.M.; Bai, W.M.; Fang, Y.; He, J.Z. Responses of soil microbial community to nitrogen fertilizer and precipitation regimes in a semi-arid steppe. J. Soils Sediments 2018, 18, 762–774. [Google Scholar] [CrossRef]
  49. Urbanova, M.; Snajdr, J.; Baldrian, P. Composition of fungal and bacterial communities in forest litter and soil is largely determined by dominant trees. Soil Biol. Biochem. 2015, 84, 53–64. [Google Scholar] [CrossRef]
  50. Graham, E.B.; Wieder, W.R.; Leff, J.W.; Weintraub, S.R.; Townsend, A.R.; Cleveland, C.C.; Philippot, L.; Nemergut, D.R. Do we need to understand microbial communities to predict ecosystem function? A comparison of statistical models of nitrogen cycling processes. Soil Biol. Biochem. 2014, 68, 279–282. [Google Scholar] [CrossRef]
Figure 1. Quantifications of denitrifying genes and the regressions between the logarithm of the gene copies and forest age. SSD: shifting sand dune; CM-9: 9-year C. microphylla forest; CM-19: 19-year C. microphylla forest; NC: natural C. microphylla forest.
Forests 12 00354 g001
Figure 2. Phylogenetic distribution of 11 representative OTUs of the nosZ gene. Tree was constructed by the sequences obtained from sand dune sampling sites and additional their closely matched sequences from GenBank.
Forests 12 00354 g002
Figure 3. Phylogenetic distribution of 24 representative OTUs of the nirS gene. Tree was constructed by the sequences obtained from sand dune sampling sites and additional their closely matched sequences from GenBank.
Forests 12 00354 g003
Figure 4. Phylogenetic distribution of 24 representative OTUs of the nirK gene. Tree was constructed by the sequences obtained from sand dune sampling sites and additional their closely matched sequences from GenBank.
Forests 12 00354 g004
Figure 5. Relative abundance of different denitrifying genes. SSD: shifting sand dune; CM-9: 9-yr C. microphylla forest; CM-19: 19-yr C. microphylla forest; NC: natural C. microphylla forest.
Forests 12 00354 g005
Figure 6. Canonical correspondence analysis (CCA) of dominant genera of nosZ, nirK, and nirS communities and soil properties. SOM: soil organic matter; TP: total P; Av. P: available P; TN: Total N; Av. N: available N; TK: total K; Av. K: available K; EC: electrical conductivity.
Forests 12 00354 g006
Table 1. Morphological traits, soil pH, electrical conductivity (EC), and nutrients of C. microphylla sand-fixation forest.
ItemsSSDCM-9CM-19NCANOVA in Response to Age
Fregressionp
Vegetation coverage (%)<5557075
Crown diameter (cm × cm)70 × 7580 × 85140 × 155
Mean height (cm)81.2190.52130.21
Shoot number (N)18.5519.6240.54
pH6.70 ± 0.056.75 ± 0.056.63 ± 0.026.89 ± 0.079.1960.013
Electrical conductivity (µs·cm−1)23.90 ± 4.3640.78 ± 10.040.10 ± 3.1158.52 ± 2.0634.247<0.001
Organic matter (g·kg−1)0.05 ± 0.0020.26 ± 0.0150.29 ± 0.080.74 ± 0.03424.1090.001
Total N (g·kg−1)0.08 ± 0.0040.62 ± 0.0040.71 ± 0.0050.79 ± 0.00612.2430.006
Total P (g·kg−1)0.32 ± 0.0210.59 ± 0.0200.64 ± 0.1030.99 ± 0.19829.767<0.001
Total K (%)1.46 ± 0.051.49 ± 0.281.66 ± 0.112.22 ± 0.4716.6140.002
Available N (mg·kg−1)1.41 ± 0.223.49 ± 0.342.80 ± 0.391.86 ± 0.575.3460.030
Available P (mg·kg−1)5.09 ± 0.936.83 ± 2.127.30 ± 0.889.01 ± 1.2112.1650.006
Available K (mg·kg−1)425.3 ± 2.98444.5 ± 2.99447.9 ± 5.24459.6 ± 4.5030.817<0.001
Values are means + SD (n = 3). The response of the content of soil available N to age was evaluated by quadratic regression model, and those of the other indicators were evaluated by linear regression model. SSD: shifting sand dune; CM-9 and CM-19: 9-yr and 19-yr C. microphylla forests; NC: natural C. microphylla forest.
Table 2. Diversity indices of different gene clone libraries.
SiteSequencing ResultsDiversity Estimates
Total SequencesTotal OTUsACEChaoShannonSimpsonCoverage
nosZSSD1091517.3316.902.150.170.96
CM-91051548.9432.240.870.690.89
CM-191081930.2831.091.780.310.90
NC95811.327.610.650.680.97
nirKSSD1022550.2632.002.480.120.90
CM-91092948.4344.753.260.040.88
CM-1911661100.67111.673.400.070.82
NC9861151.99139.093.520.060.86
nirSSSD102916.6414.000.700.730.95
CM-91251935.1332.751.290.540.91
CM-199424164.2448.002.090.250.83
NC981359.9327.001.420.360.92
SSD: shifting sand dune; CM-9 and CM-19: 9-yr and 19-year C. microphylla forests; NC: natural C. microphylla forest.
Publisher’s Note: MDPI stays neutral with regard to jurisdictional claims in published maps and institutional affiliations.

