Article

Similarities and Differences among Soil Fungal Assemblages in Managed Forests and Formerly Managed Forest Reserves

Institute of Dendrology, Polish Academy of Sciences, Parkowa 5, 62-035 Kórnik, Poland
*
Author to whom correspondence should be addressed.
Forests 2021, 12(3), 353; https://doi.org/10.3390/f12030353
Submission received: 9 February 2021 / Revised: 9 March 2021 / Accepted: 12 March 2021 / Published: 17 March 2021
(This article belongs to the Section Forest Ecology and Management)

Abstract

:
Unlike the numerous works concerning the effect of management on the forest mycobiome, only a few studies have addressed how fungi from different trophic groups recover from natural and anthropogenic disturbances and develop structural features typical of unmanaged old-growth forests. Our objective is to compare the soil fungal assemblages represented by different functional/trophic groups in protected and managed stands located in European mixed forests dominated by Scots pine. Fungal communities were analyzed using high-throughput Illumina MiSeq sequencing of fungal internal transcribed spacer 1 (ITS1) amplicons. Formerly managed forest reserves (established around 50 years ago) and forests under standard forest management appeared to be similar in terms of total and mean species richness of all fungal operational taxonomic units (OTUs), as well as OTUs assigned to different functional trophic groups. Among the 599 recorded OTUs, 497 (83%) were shared between both management types, whereas 9.5% of taxa were unique to forest reserves and 7.5% were unique to managed stands. Ascomycota and Basidiomycota were the predominant phyla, comprising 88% of all identified fungi. The main functional components of soil fungal assemblages consisted of saprotrophic (42% fungal OTUs; 27% reads) and ectomycorrhizal fungi (16%; 47%). Two-way analysis of similarities (ANOSIM) revealed that both site and management strategy influenced the species composition of soil fungal communities, with site being a primary effect for saprotrophic and ectomycorrhizal fungi. Volume of coarse and very fine woody debris and soil pH significantly influenced the ectomycorrhizal fungal community, whereas saprotrophic fungi were influenced primarily by volume of coarse woody debris and soil nitrate concentration. Among the identified fungal OTUs, 18 red-listed fungal species were identified from both forest reserves and managed forests, comprising two ECM fungi and four saprotrophs from the category of endangered species. Our results suggest that the transformation of fungal diversity after cessation of forest management is rather slow, and that both forest reserves and managed forests help uphold fungal diversity.

1. Introduction

Fungi are an important and incredibly diverse component of microbial communities, and are widely recognized as fundamental components of biodiversity and ecosystems. The most likely estimates predict there are between 1.5 and 5 million species of fungi [1], but Larsen et al. (2017) [2] asserts that the number may be higher than 150 million. If these estimates are correct, then at present, less than 5% of existing fungi have been described and named [3], and the majority of global fungal diversity remains undocumented [4]. Furthermore, fungal communities and their structures remain poorly recognized in many ecosystems [5,6].
Forest ecosystems represent some of the largest and most important biomes on Earth, harboring a huge proportion of the global fungal diversity [7,8,9,10]. Fungal community assemblages in forest ecosystems are composed of functionally distinct trophic groups reflecting the living strategies of fungi and represented by symbiotrophic (mycorrhizal fungi, lichens, endophytes), pathotrophic, and saprotrophic fungi, all of which perform several essential ecological functions [6]. Mycorrhizal fungi, and particularly ectomycorrhizal (ECM) fungi, are some of the most important and prevalent functional groups of the soil fungal community assembly. These fungi, which interact with most forest trees, play an important role in tree nutrition and water acquisition, and enhance drought and disease resistance [6,11,12,13,14]. Pathogenic (PAT) fungi, by decreasing vitality and/or killing trees, can reduce or eliminate plant species, causing gaps in the forest canopy that may increase plant species diversity in the understory. Additionally, PAT fungi contribute to the accumulation of deadwood, thus influencing nutrient cycling and wildlife habitat [15,16]. As the primary forest decomposers, saprotrophic (SAP) fungi create wood and litter decay, contributing to the recycling of carbon, minerals, and nutrients for use by other organisms and ameliorating the soil matrix physical properties [17,18].
All trophic groups of fungi (mostly their aboveground fruiting-body structures, but also their below-ground mycelium) are important food sources for microbes and many different invertebrates and vertebrates [19]. Given these varied and important functions, the maintenance, protection, and strengthening of fungal species diversity and viability are essential to forest ecosystem functioning and remain an important dimension for forest policy and management. Until recently, however, fungi have received little attention in the field of conservation biology. On the Red List of Threatened Species compiled by the International Union for Conservation of Nature, only 56 species of fungi have had their conservation status documented, compared with 25,452 plants and 68,054 animals, clearly indicating that fungi remain in the shadows when compared to plants and animals [10].
Forest management involves modifications of abiotic and biotic conditions, both above and below ground, potentially influencing the diversity of soil fungi in different trophic groups [20,21]. Over the last two decades, this subject has been intensively studied and was recently thoroughly reviewed by Tomao et al. [22], with contrasting results about how forest management affects soil fungal communities. Heavy disturbances (e.g., clear-cutting, a forestry practice in which most or all trees in an area are uniformly cut down) have been shown to severely alter the soil fungal community composition [23,24], whereas less intensive disturbances (e.g., thinning, defoliation) have demonstrated more limited effects on belowground fungal communities [25,26]. Heavy disturbances often decrease the relative abundance of ECM fungi while increasing the relative abundance of SAP fungi [24].
Unlike the numerous works concerning the effect of management on the forest mycobiome, only a few studies have addressed how fungi from different trophic groups recover from natural and anthropogenic disturbances and develop structural features typical of unmanaged old-growth forests [27,28,29,30]. An excellent reservoir of fungal diversity for several fungal functional guilds, i.e., group of species that exploit the same class of environmental resources in a similar way, as well as valuable testing grounds for comparisons between traditionally managed and unmanaged forests, is found in such diversified forms of protection as national parks, landscape parks, the Natura 2000 network, and forest reserves. In the twenty-first century, the area of forest in Europe designated for biodiversity and landscape protection has increased by half a million hectares annually. Around 12.2% (or 29.9 million ha) of European forests are protected, with the primary objective of conserving biodiversity [31]. Worldwide, there is growing interest in devising new forest management strategies to encourage the development of forests with late-successional stand characteristics, including greater structural complexity and biodiversity [32,33]. An effective way to increase the area of forest that can support greater biodiversity is to set aside planted forests and allow them to gradually transform into old-growth forest [27,34], where large numbers of ECM fungal species can be hosted [35]. However, in beech- and spruce-dominated forests in Czechia, higher ECM sporocarp richness was found in managed stands compared to nonmanaged stands, a result that is inconsistent with the previously described old-growth transformation strategy [36]. In another study conducted by Goicoechea et al. [37], no difference was observed in the number of observed root ECM morphotypes between old-growth and clear-cut beech stands in Spain. When looking at SAP species, old-growth forests tend to have higher richness compared to managed stands [36,38,39], especially when wood-inhabiting fungi are considered. Since the total amount of deadwood is usually higher in unmanaged forests, many authors have argued that deadwood is crucial for preserving the diversity of wood-inhabiting fungi [30]. These varying results concerning fungal diversity between managed and unmanaged stands may be explained by the differences in the forest ecosystems investigated, differences in management regimes and histories of tested stands, or differences in survey methods [40]. In the past decades, significant progress has been made in the field of traditional, timber-oriented forestry, which has gradually transformed into wildlife-friendly forest management, targeting forestry activities in ecological, economic, and social contexts [41]. One crucial issue has been concern about preserving biodiversity, not only in reserves, but in managed forests as well [42]. Biodiversity-related and conservation-oriented forest policy objectives have also been introduced in Polish forest law and practice as key concerns of sustainable forest management [43].
In this study, we address how soil fungi from different trophic groups are structured with respect to the two management regimes (i.e., forest reserves and sustainably managed forests) in European mixed coniferous forests. This forest type, typically dominated by Scots pine stands but displaying an admixture of fir and spruce in more humid regions, is among the most widespread forest communities in Poland and represents a unique environment for the occurrence of multiple fungal species. For this study, three geographic locations were selected and a group of unmanaged stands (forest reserves under protection for 30–50 years) was compared with a group of independent, managed forest stands subjected to standard forest management, comprising sanitation or salvage cutting and commercial thinning
We hypothesized that:
  • The species richness of soil fungal communities (i.e., the total number of species present in an area or a habitat; quantitative structure) would not differ between forest reserves and managed forests.
  • The species composition and abundance of soil fungal communities (qualitative structure) would differ between forest reserves and managed forests owing to differences in local niches generated by each management strategy (host tree characteristics, soil characteristics, and local climatic constraints) which may influence fungal diversity.
The main goal of this study was to understand the diversity of soil fungi from different trophic groups and their potential drivers in mixed coniferous forest ecosystems. For this purpose, background environmental data were collected and included as factors in analyzing soil fungal diversity throughout our study sites.
We hypothesized that:
3
Different environmental factors (e.g., soil mineral and organic chemistry, tree species composition, dead wood volume) arising from different forest strategies (managed forests vs. reserves) will, in a distinctive way (beneficial or restrictive), influence ECM and SAP soil fungal assemblages.
Additionally, by separating the data into abundant core fungal species and rare satellite taxa, the red-listed species have also been considered in this study.
In recent years, massively parallel high-throughput sequencing relying on direct DNA extraction from the soil matrix has been employed to assess soil fungal diversity [6,29,44,45]. This methodological approach is increasingly replacing the existing methods like sporocarp or mycorrhizal assessments, allowing for a more comprehensive understanding of the soil fungal communities. Our study explores the use of high-throughput sequencing in characterizing the composition and diversity of fungi from different trophic groups in bulk soil of unmanaged forest reserves and traditionally managed stands of European mixed coniferous forests.

2. Materials and Methods

The current investigation is a continuation of a study conducted on these same experimental sites and reported by Leski et al. [26]. This previous study was focused only on a group of ECM fungi and analyzed by sporocarp surveying and Sanger sequencing of ectomycorrhizas. A summary of the study sites and the methods is given here; for a more detailed description, see Leski et al. [26]. Currently, we use metabarcoding to explore changes in soil fungal diversity to compare how soil fungal communities develop in conditions of forest management or conservation by abandonment.

2.1. Study Sites

This study was conducted in three different sites representing European mixed coniferous forests (Querco roboris-Pinetum (W.Mat. 1981) J.Mat. 1988); sites were situated across Poland and separated from one another by about 200 km (for the map of the study sites see Leski et al. [26]). In all sites, three pairs of forest stands characterized by different management regimes of standard forest management (M) or forest reserves (R) were established. The distance between management types at each site did not exceed 2 km. In each pair of stands (M and R), four plots were selected (400 m2, 8 × 50 m). In total, 24 plots were examined: 12 plots located in managed forests and 12 in forest reserves.
Mean abandonment time of the selected forest reserves was 54 years: “Bażantarnia” forest reserve (Forest District Przytok) was established in 1959; “Olbina” forest reserve (Forest District Kalisz) was established in 1958; and “Czaplowizna” forest reserve (Forest District Łochów) was established in 1980. Prior to establishment of the reserves, similar forest management practices were performed in both managed forests and forest reserves, corresponding to the forest practices prevalent in Poland at the time [46]. These practices comprised sanitation or salvage cutting and thinning. In the managed forest stands, standard thinning and salvage cuttings were conducted (as described in Leski et al. [26]). The last operations were performed between 2008 and 2014, depending on the site. In the forest reserves, only a portion of naturally wind-felled trees was removed, and no further standard management was applied. Forest stands were dominated by coniferous tree species: Scots pine (Pinus sylvestris L.) and Norway spruce (Picea abies (L.) H. Karst), which were the dominant tree species depending on the sites. Occasionally, other tree or shrub species were present, such as common beech (Fagus sylvatica L.), Weymouth pine (Pinus strobus L.), black locust (Robinia pseudoacacia L.), northern red oak (Quercus rubra L.), Norway maple (Acer platanoides L.), bird cherry (Prunus padus L.), alder buckthorn (Frangula alnus Mill), and common juniper (Juniperus communis L.). For more details see Supplementary Materials Table S1.

2.2. Sampling Processing and Background Data

A total of 240 soil samples were collected in September 2018. At all tested forest stands, soil samples were taken concurrently. Ten soil samples with a diameter of 2 cm and a depth of 5 cm were taken from a total of 24 plots after the removal of the upper undecomposed litter layer. The sampling points were randomly generated according to the same methodology as used previously for ectomycorrhizal analyzes (Leski et al., 2019) using RANDBETWEEN function in MS Excel (Microsoft Office 2016, Redmond, WA, USA). Soil samples were sealed in separate polyethylene bags, stored in an icebox, and transported to the laboratory. Soil samples taken from each plot were subsequently hand-mixed for 10 min in a new, sterile and closed zip-lock bag, resulting in one composite soil sample per plot. Composite samples were sieved at a sterile mesh size of 2 mm and stored at −20 °C. Additionally, a 50 g of soil was dried at 40 °C for use in soil analyses. The following soil variables were determined: pH, total and organic C, total N, bioavailable forms of N (N-NH4 and N-NO3,) and P. Details of the soil analysis procedures are presented in our previous paper [47]. Details of the analysis procedures for the other environmental measurements collected, such as humus layer thickness, tree and shrub density (number of individuals per 400 m2 determined by counting all trees and shrubs with a diameter at breast height [DBH at 130 cm] higher than 2 cm), a proxy for woody biomass-total tree basal area (TBA; m2 per plot), and volume of woody debris (including Coarse Woody Debris [CWD], Fine Woody Debris [FWD], and Very Fine Woody Debris [VFWD]) are presented in our previous paper [26].
Total fungal DNA from each composite soil sample was extracted from 250 mg of soil using the PowerSoil DNA Isolation Kit (MoBio Laboratories Inc., Carlsbad, CA, USA) according to the manufacturer’s instructions. The DNA concentration in individual soil samples was determined using a Qubit 4 Fluorometer (Thermo Fisher Scientific, Waltham, MA, USA) and adjusted to 1–10 ng/µL. DNA for metabarcoding was amplified using a PCR (2 repetitions per one sample/plot). The whole fungal community was assessed by amplifying the ITS1 region using the fungal-specific primer ITS1F [48] and ITS2 [49]. Each sample was marked using different tags, added by way of tagged primer in a PCR. The tagged PCR amplicons for each sample were purified with Q5 Hot Start High-Fidelity 2X Master Mix (New England Biolabs Inc., Ipswich, MA, USA). The PCR reactions were run using the following procedure: predenaturation at 98 °C for 1 min, 30 cycles of denaturation at 98 °C for 10 s, annealing at 50 °C for 30 s, and elongation at 72 °C for 30 s with a final extension at 72 °C for 5 min. PCR products were mixed in equimolar concentrations, and the resultant pooled library was sequenced with the Illumina MiSeq, using PE 2 × 250 platform, Miseq Reporter (MSR) v2.6 software (Illumina Inc., San Diego, CA, USA), and the v2 sequencing reagents.

2.3. Bioinformatics and Statistics

Sequence data were processed using QIIME (Quantitative Insights Into Microbial Ecology) v1.8.0 (http://qiime.org/ (accessed on 8 February 2021)) [50] with the following criteria: (I) minimum length of 300, and (II) quality score >20. All reads containing both tagged primers were extracted and trimmed from each sample dataset using Cutadapt software v1.9.1 [51]. Raw paired-end reads were merged using fastq-join algorithm [52]. Chimeric sequences were detected with the usearch61 algorithm using Usearch v7.0.1090 [53] and deleted. Sequences were clustered using the uclust algorithm implemented in UPARSE [53] at a 97% similarity level with reference to the UCHIME Unite database (version 8.0, 18.11.2018). The taxonomy of each operational taxonomic unit (OTU) was determined by blast alignment [54].
In the final step, summary tables were generated and OTUs were assigned to functional groups using the free annotation tool FUNGuild database (http://www.funguild.org (accessed on 8 February 2021)) [55]. The obtained results were classified into the five groups (ectomycorrhizal fungi, saprotrophic fungi, pathotrophic fungi, other symbiotrophic fungi, and other fungi). Due to the crucial role of ectomycorrhizal fungi in mixed coniferous forests, this functional group was separated from the FUNGuild functional group “symbiotrophs”. The remaining symbiotrophs, (i.e., lichenized, arbuscular mycorrhizal, and ericoid mycorrhizal fungi) were assigned to the group “other symbiotrophs”. To simplify data analysis, only the OTUs with a known trophic position were assigned to the ectomycorrhizal, saprotrophic, pathotrophic, and other symbiotrophic fungi functional groups. OTUs with an uncertain or unidentified trophic position were assigned to the group “other fungi”.
The Shannon diversity index, the fungal OTU richness, relative abundance, and frequency were calculated to describe the soil fungal community. The Shannon diversity index is widely used for comparing diversity between various sites, and assumes that individuals are randomly sampled from an independent large population, and all the species/taxa are represented in the sample [56]. Relative abundances of fungal OTUs were calculated for each plot separately as the number of reads of individual OTU divided by the total number of reads per plot and then averaged for all plots representing forest reserves or managed forests (n = 12). The frequency of each fungal OTU was calculated as the number of plots in which it was observed. Furthermore, to allow for comparisons to be made between managed forests and forest reserves, Jackknife1 richness estimator was calculated using the EstimateS program version 9.1.0 [57]. The diversity of soil fungal communities was evaluated via Shannon diversity using PAST 2.17c software [58]. A one-way analysis of variance (ANOVA) performed in PAST was used to test the differences in mean species richness and Shannon diversity between managed forest stands and forest reserves.
For both the total fungal community and individual fungal trophic groups, we evaluated differences in community composition between managed and unmanaged stands based on Jaccard’s similarity index in a two-way crossed analysis of similarity (ANOSIM). Jaccard similarity index is widely used for binary (presence/absence) data [59]. To visualize the differences (based on the Jaccard matrix) in the soil fungal community structure, nonmetric multidimensional scaling ordination (NMDS) was used. Both ANOSIM and NMDS analyses were performed in PAST 2.17c software [58]. A nonparametric Kruskal–Wallis test was used to check for significant differences in the relative abundance of trophic groups in managed forests compared to forest reserves. To assess the number of unique and shared fungal OTUs between managed forests and forest reserves, Venn diagrams were constructed using the Javascript library jvenn [60]. Furthermore, we tested Pearson’s correlation between taxa richness or Shannon diversity index and the log-transformed environmental variables. To determine technical reproducibility thresholds, we concluded that only OTUs with an abundance ≥0.5% in ≥3 samples (80 measurable OTUs) should be used for further analyses [61]. Differences in the relative abundance of these OTUs in the respective forest management types were evaluated for significance using the Kruskal–Wallis test. Relationships between these included OTUs and local environmental variables were analyzed with redundancy analysis (RDA) using the software R, v3.6.3 (https://cran.r-project.org/bin/windows/base/old/3.6.3/ (accessed on 8 February 2021)) [62].
In the following analyses, we focused on the relationship between environmental variables and ectomycorrhizal and saprotrophic species composition, as these were the main fungal guilds represented in our studied soil fungal community. To assess the impact of environmental variables on total and individual trophic group species composition using redundancy analysis (RDA), we employed the vegan::rda() function [61]. Before analysis, we transformed species abundance using Hellinger’s square-root transformation, included in the vegan::decostand() function [63]. We selected constraining environmental variables via Akaike information criterion (AIC) (using ordistep in the library vegan). Before these analyses, the multicollinearity between continuous regressor variables was determined by calculation of the variance inflation factor (VIF) using the vif() function of the usdm package (https://cran.r-project.org/web/packages/usdm/index.html (accessed on 8 February 2021)) [64]. We used the criterion VIF <10 to select suitable variables in the best multiple regression models and to remove strongly multicollinear variables [65].
Finally, red-listed species were determined according to the Red List of Macromycetes of Poland [66].

3. Results

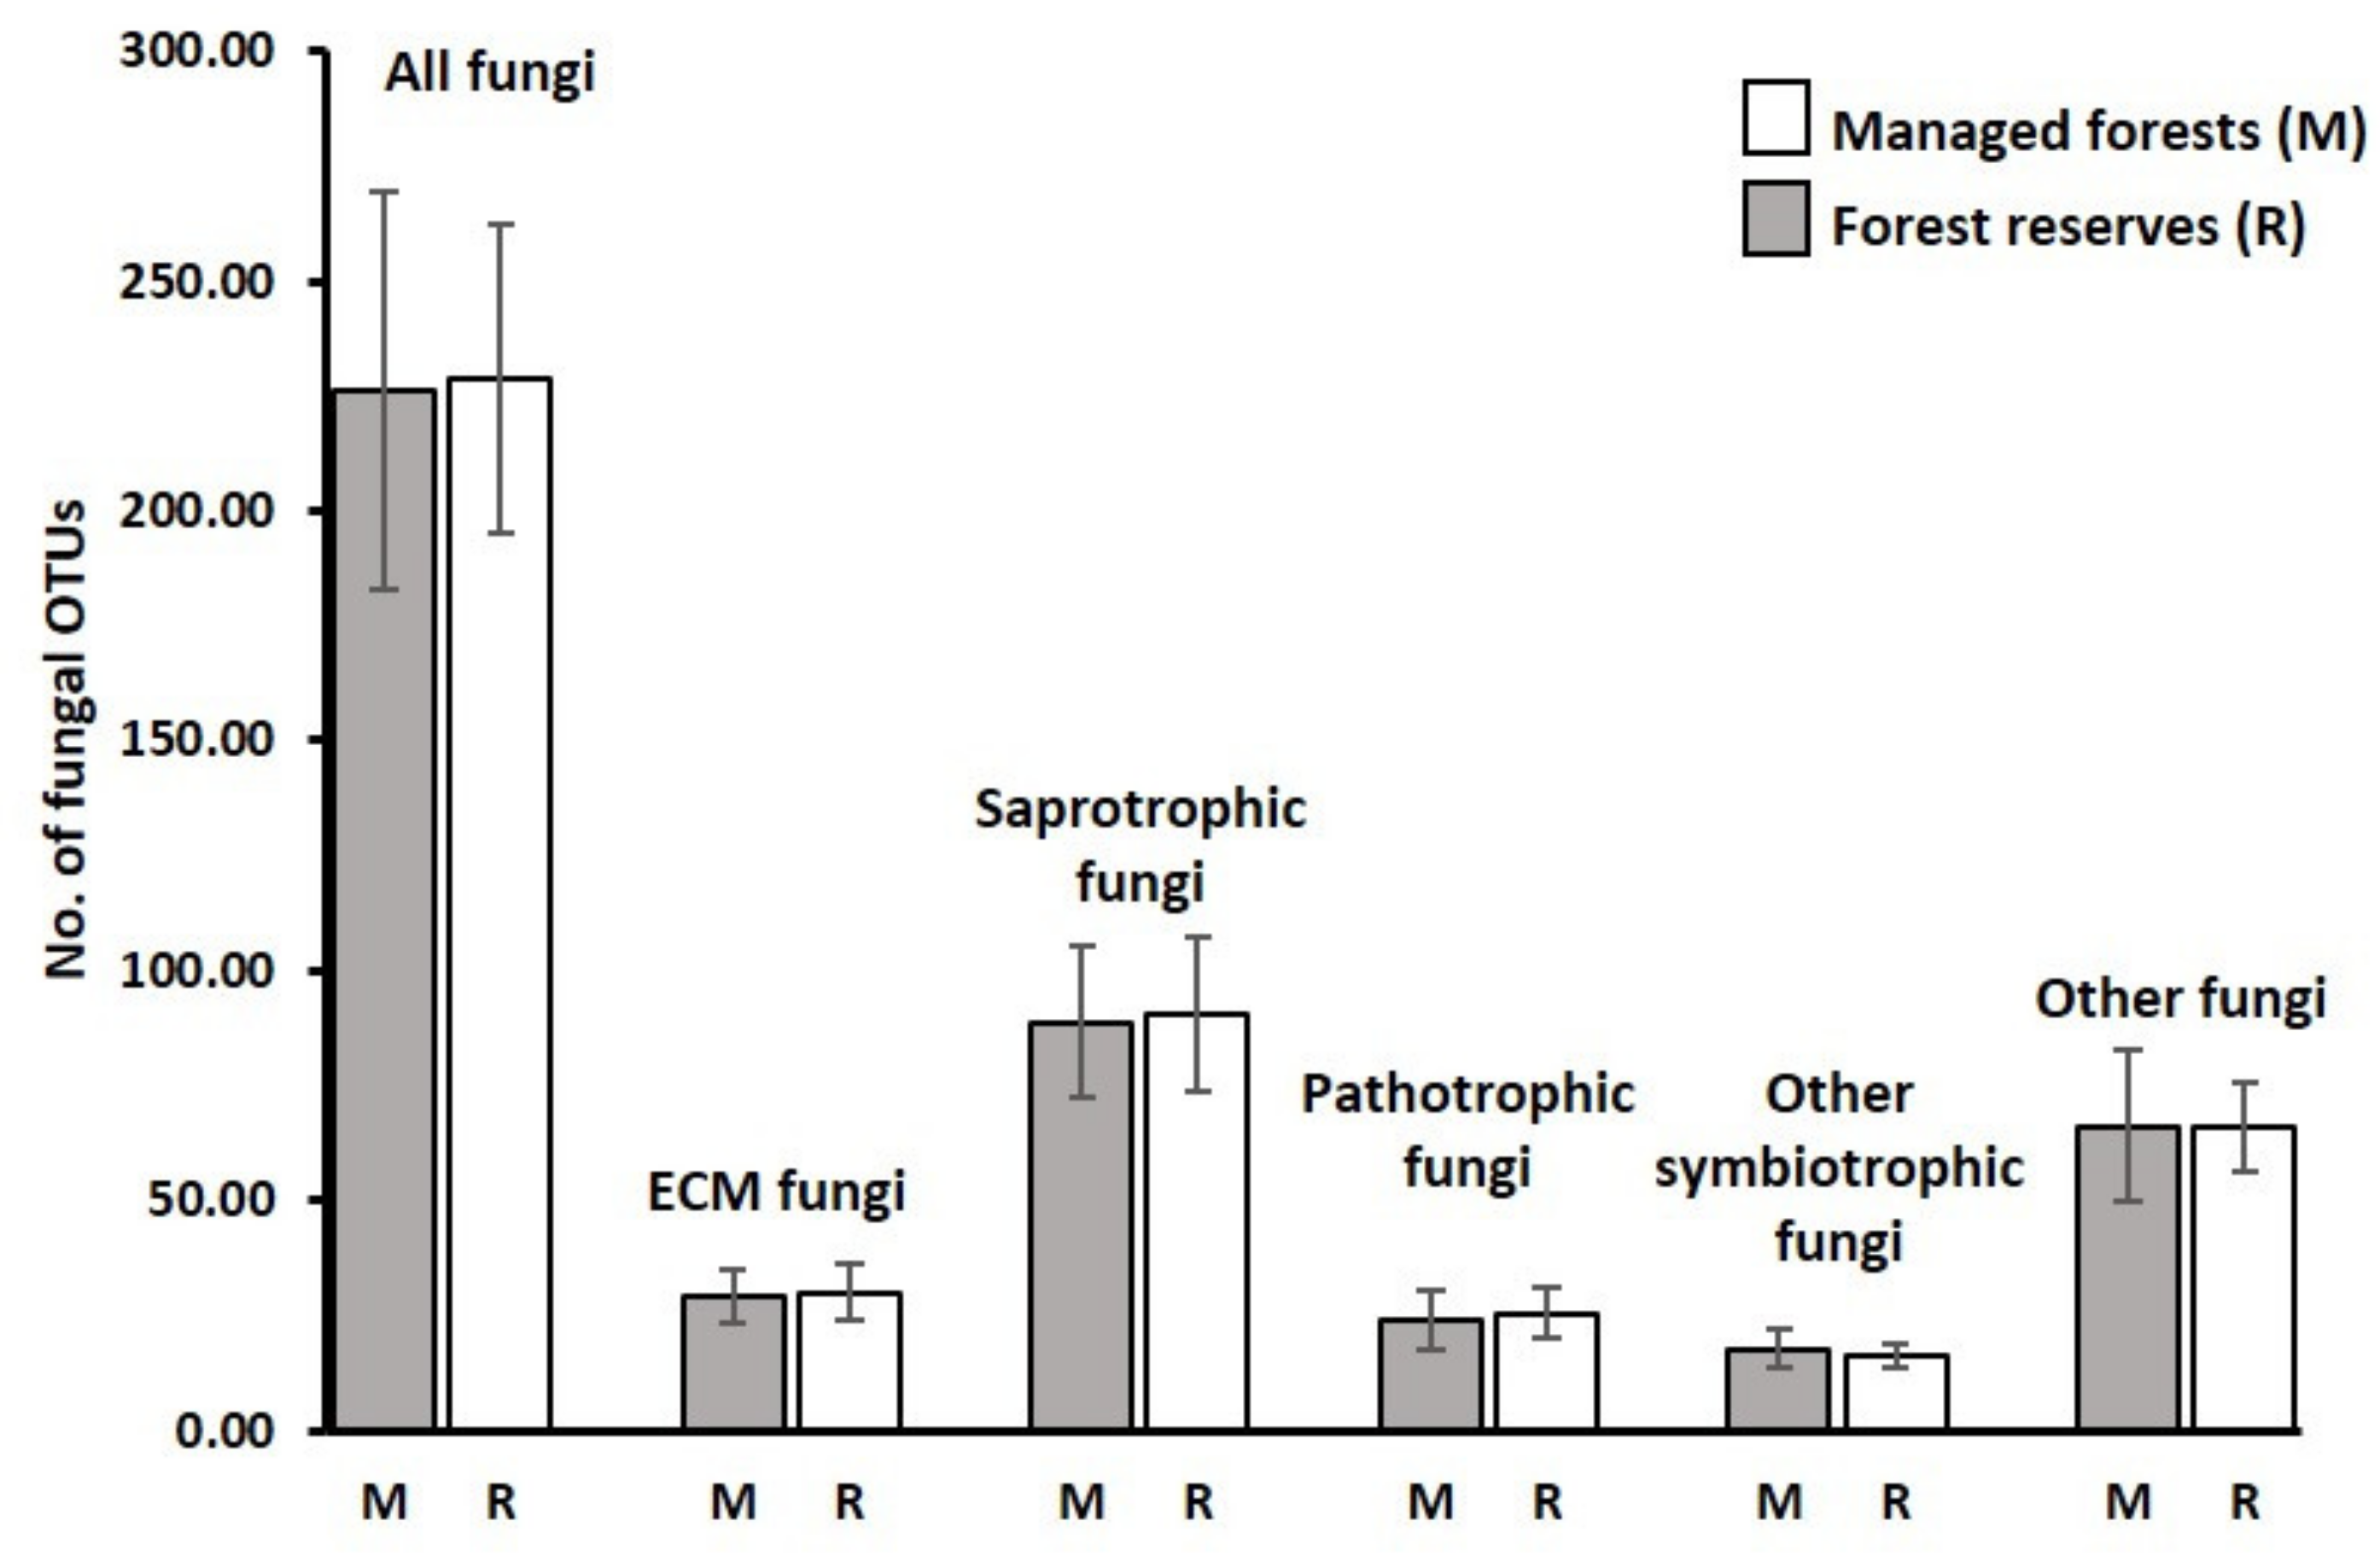
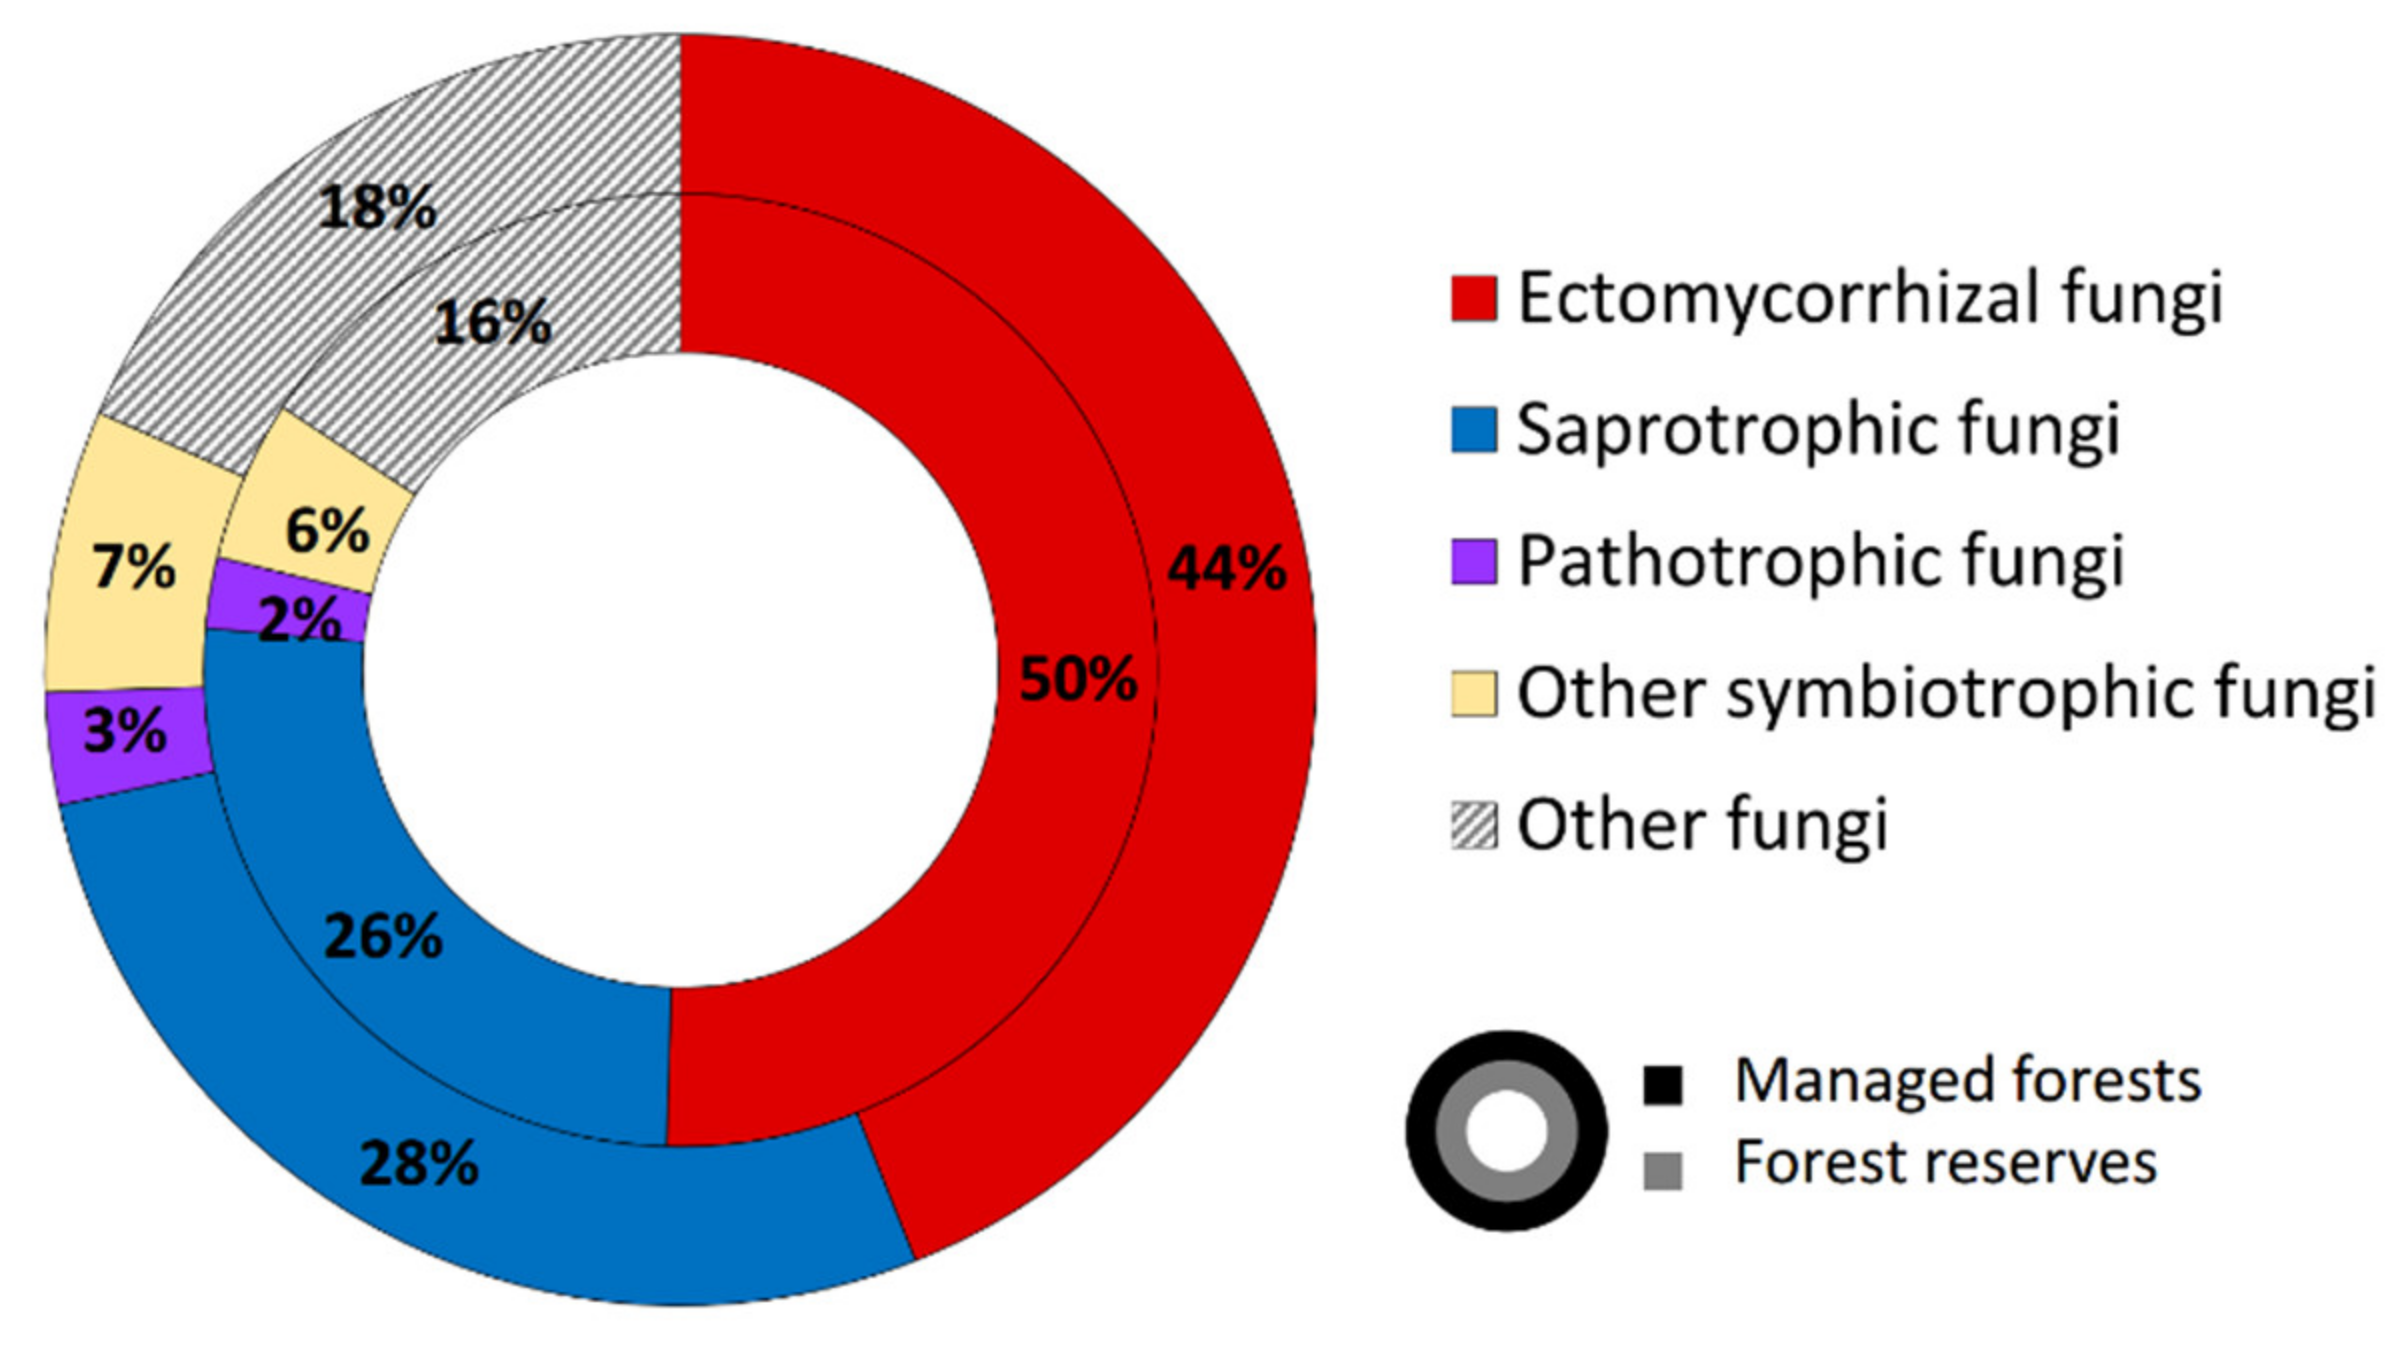
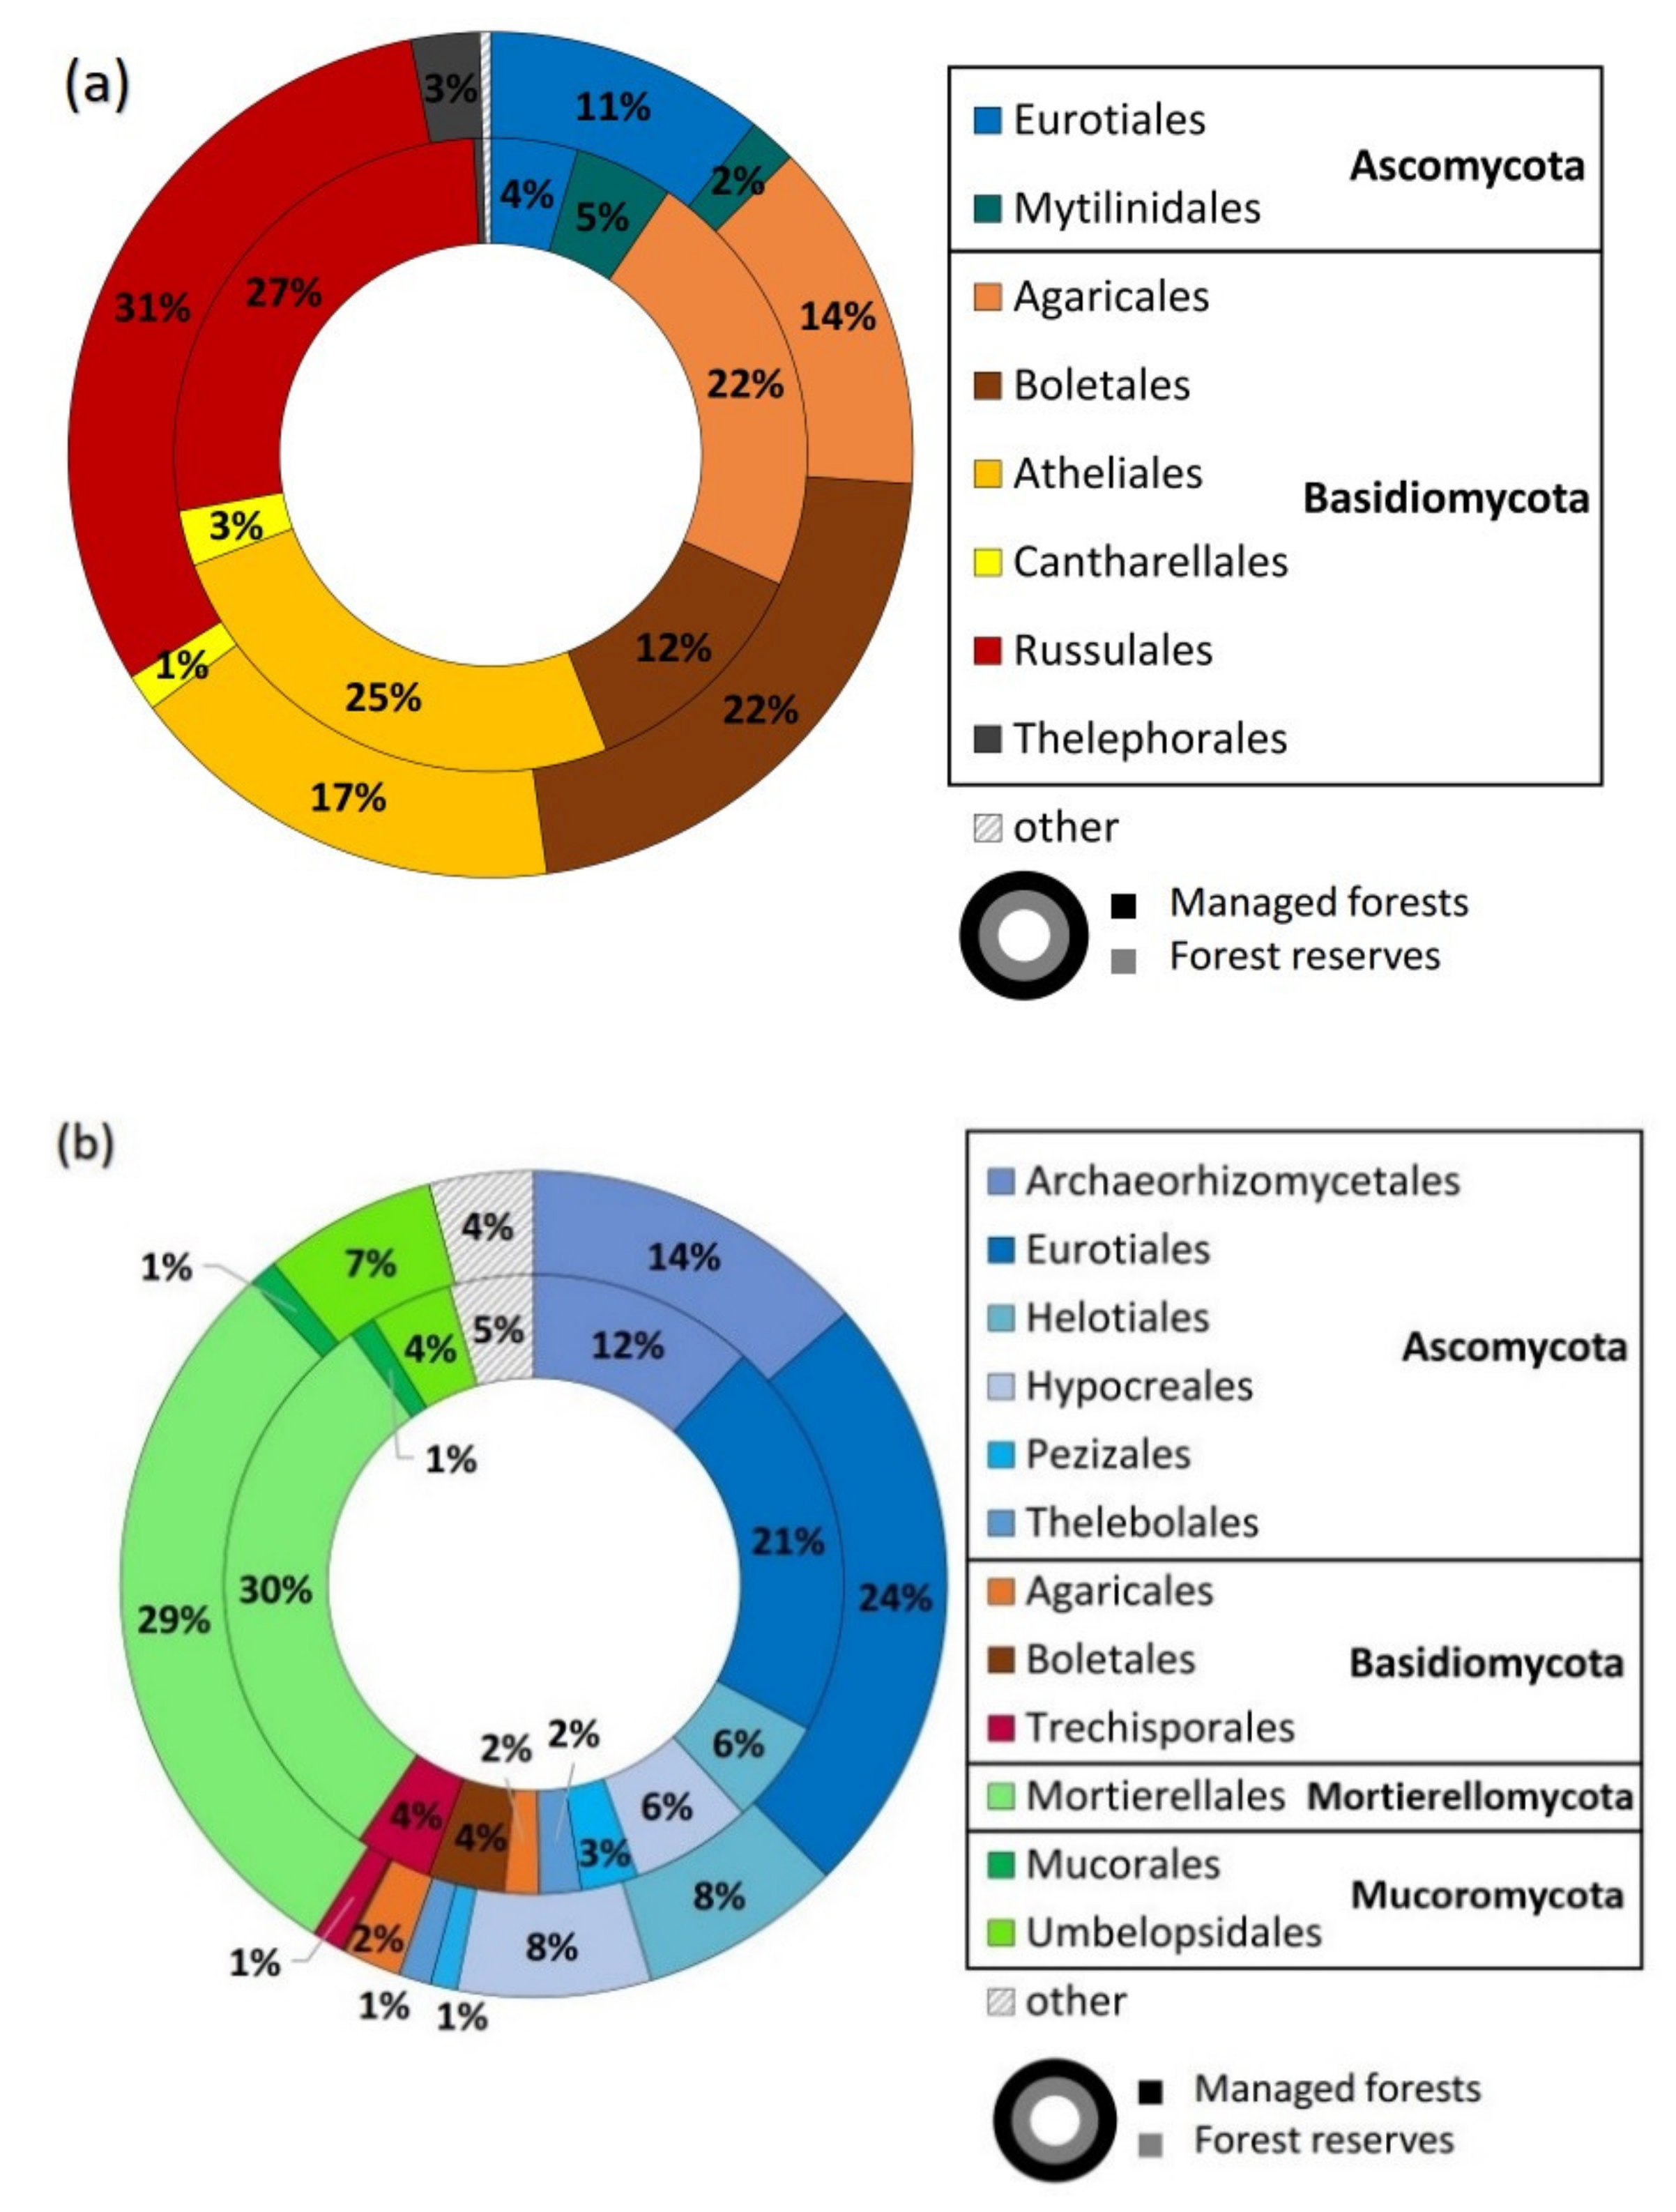
3.1. Sequencing Output and General Description of Soil Fungi

High-throughput sequencing of fungal ITS1 rDNA from 24 samples resulted in 3,836,092 reads, of which 3,049,101 were of high quality. These high-quality reads were pooled and clustered into 863 fungal operational taxonomic units (OTUs) at an identity threshold of 97%. To reduce errors due to PCR or sequencing, we adopted a conservative approach for further filtering the 863 fungal OTUs according to the following procedure: only OTUs >38 sequence reads were used for further diversity estimations (i.e., only those OTUs representing >0.001% of the total sequences). Finally, 599 nonsingleton OTUs from both managed forests and forest reserves were retained for downstream analyses.
Of the 599 OTUs obtained, 598 OTUs were assigned to 16 phyla and 43 classes, 568 were classified to the order level (83 orders), 543 to the family level (195 families), 506 to the genus level (302 genera), and 419 to the species level (70% of OTUs). One OTU was classified only to the Fungi kingdom level. Basidiomycota were the predominant phylum, with 50% of the abundance and 39% of OTUs. Ascomycota accounted for 39% of the abundance and 49% of OTUs across the entire data set, followed by Mucoromycota (4%) and the remaining phyla–Mortierellomycota, Rozellomycota, Glomeromycota, and Chytridiomycota–which together accounted for 7% of all abundance (Supplementary Materials Table S2).

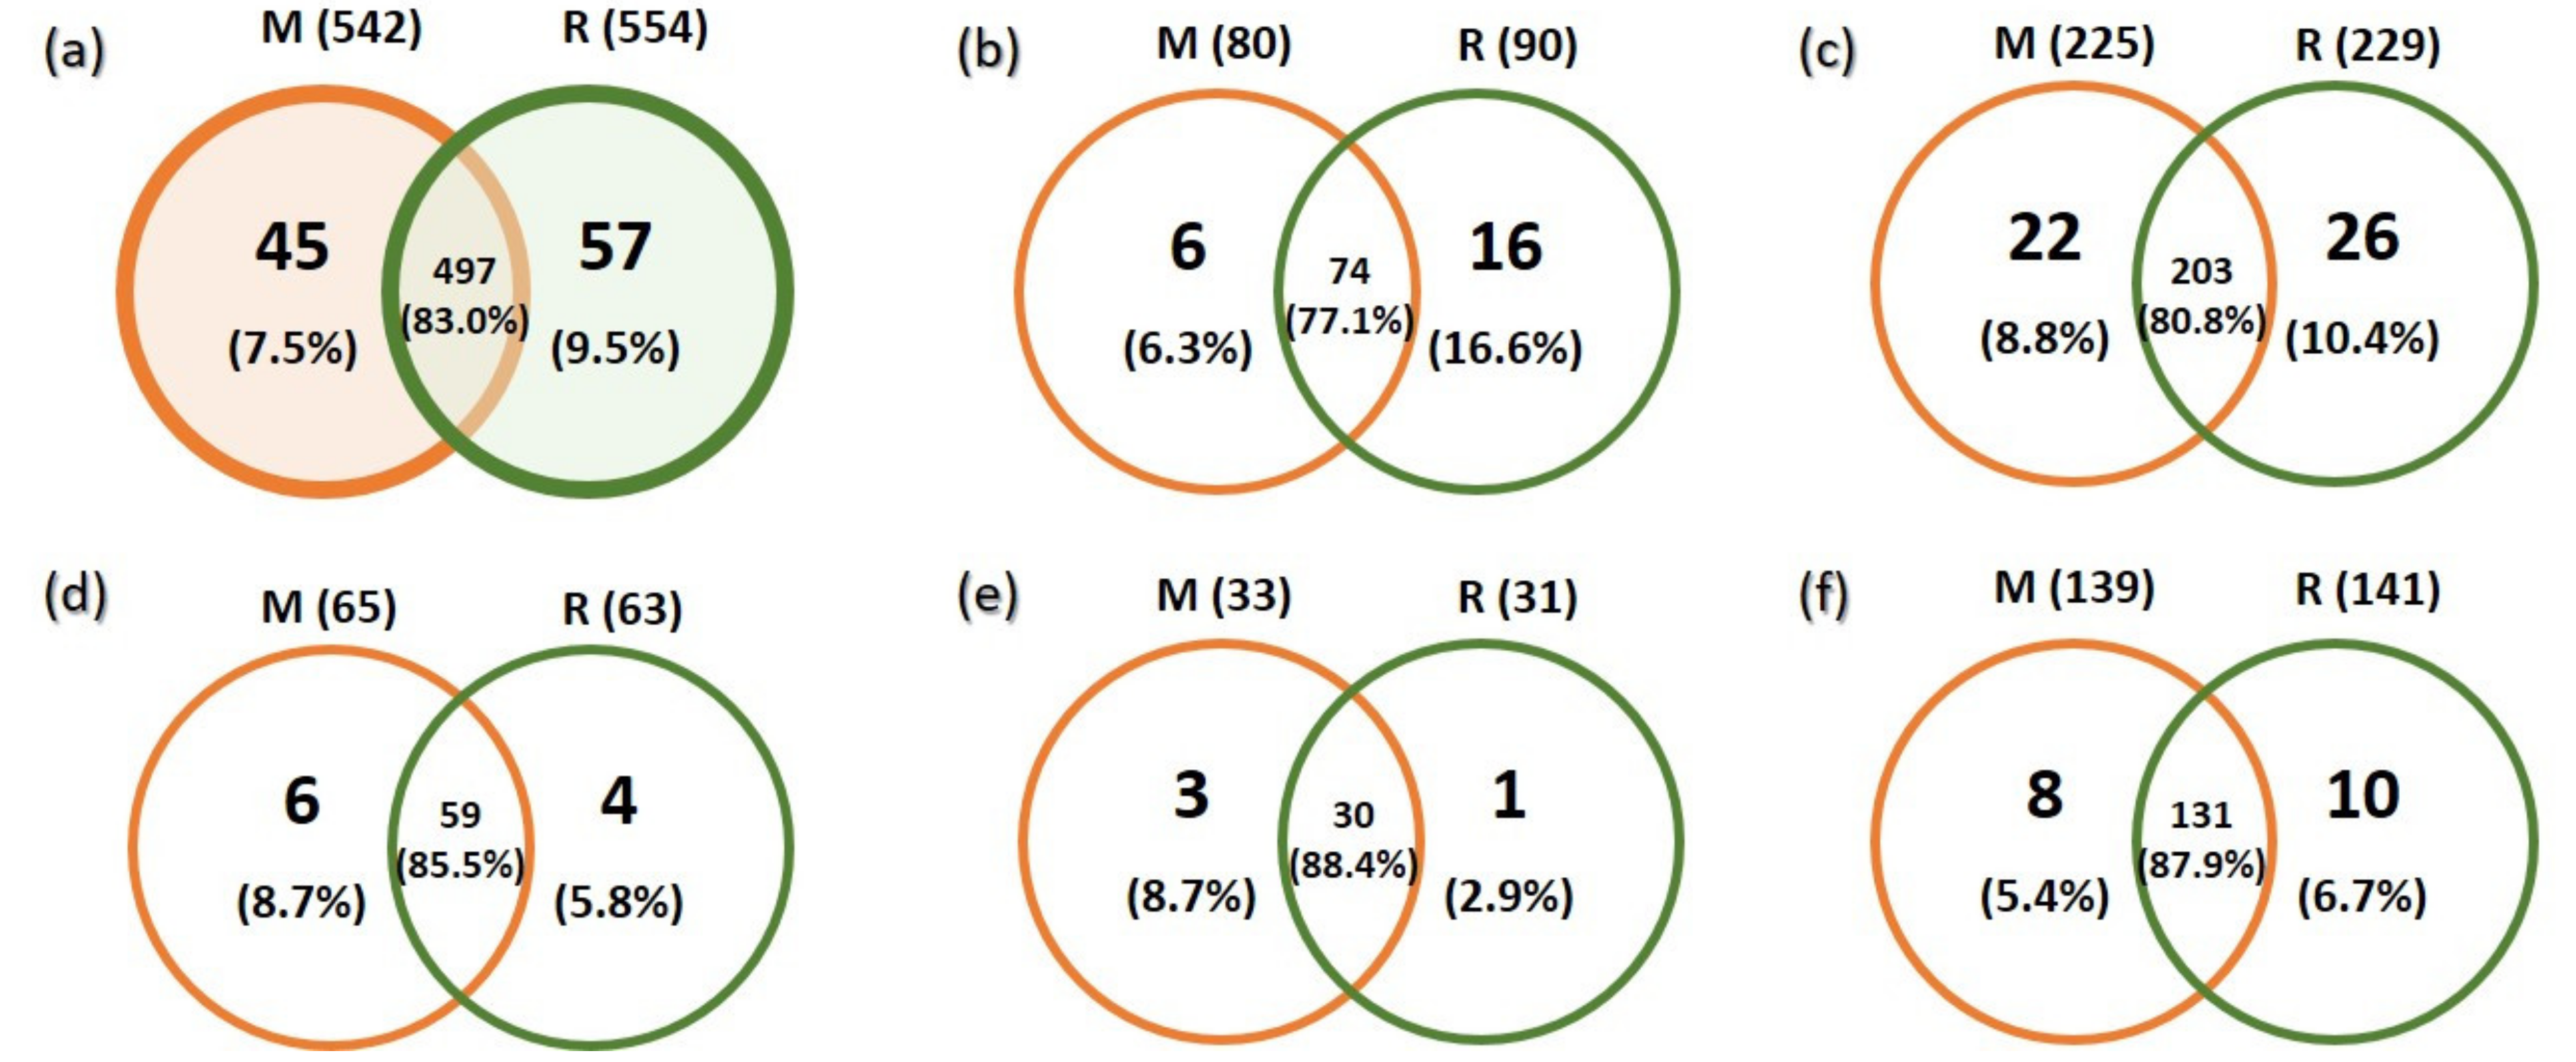
3.2. Richness and Species Composition of Soil Fungal OTUs

Soil fungal OTUs were assigned to groups reflecting their ecological functions: saprotrophic fungi (consisting of 251 OTUs), ectomycorrhizal fungi (96 OTUs), pathotrophic fungi (69 OTUs), and other symbiotrophic fungi (34 OTUs). Other symbiotrophic fungi were rarely detected and were represented by lichenized fungi (18 OTUs), arbuscular fungi (4 OTUs), fungi-forming ericoid mycorrhizas (10 OTUs), and other unidentified symbiotrophs (2 OTUs). The ecological functions of the remaining 149 OTUs (25%) were unable to be determined or not well determined; these OTUs were thus designated as a group of other fungi (Figure 1a–f).
The total richness of fungal taxa appeared to be similar in managed forests and forest reserves (542 and 554 OTUs, respectively); among these, 497 OTUs (83%) were shared between both management types. Fifty-seven OTUs were unique to forest reserves, compared to 45 unique OTUs in managed forests (Figure 1a). The Jackknife extrapolated fungal OTUs richness yielded 617 and 643 fungal OTUs within managed forests and forest reserves, respectively. The number of OTUs representing different trophic groups was also similar in managed forests and forest reserves, as was the number of shared and exclusive species within each trophic group (Figure 1b–f). A slightly higher number of exclusive ECM fungal OTUs was found (Figure 1b) in forest reserves versus managed forests (16 and 6 OTUs, respectively). No significant differences were found between managed forests and forest reserves when comparing mean OTU richness of total soil fungi or different trophic groups (Figure 2). ANOVA showed that the Shannon diversity coefficient (data not shown) did not differ significantly between managed forests and forest reserves (p = 0.949).
Sixty-six fungal OTUs were recorded in at least 21 out of 24 plots. Among them were 20 saprotrophic fungi, 6 ectomycorrhizal fungi, 9 other symbiotrophic fungi, 5 pathotrophic fungi, and 26 taxa designated to the group of other fungi (Supplementary Materials Table S3). The fungi found only in managed forests or forest reserves were usually present in one or two plots (Supplementary Materials Tables S4 and S5).
Based on the number of sequence reads, the most abundant trophic group was ectomycorrhizal fungi in both managed forests and forest reserves (44% and 50% abundance, respectively, p = 0.40, Kruskal–Wallis test) (Figure 3).
The relative abundance of Eurotiales, Boletales, and Russulales among ECM fungi was higher in managed forests than in forest reserves (Eurotiales: 11% and 4%, respectively, p = 0.20; Boletales: 22% and 12%, respectively, p = 0.62; Russulales: 22% and 12%, respectively, p = 0.37, Kruskal–Wallis test). In forest reserves, Agaricales and Atheliales were more abundant than in managed forests (Agaricales: 22% and 14%, respectively, p = 0.79; Atheliales: 25% and 17%, respectively, p = 0.79, Kruskal–Wallis test). All the values given above did not differ significantly between managed forests and forest reserves (p > 0.05, Kruskal–Wallis test). Among ECM fungi, the most species-rich genera were Russula (18 OTUs), Cortinarius (12 OTUs), and Amanita (9 OTUs). Among the most abundant and frequent ECM OTUs were Piloderma sphaerosporum, Imleria badia, UN Boletaceae, and Amanita fulva (Figure 4a, Supplementary Materials Tables S3 and S6).
The relative abundance of sequence reads representing saprotrophic fungi was marginally higher in managed forests than in forest reserves (28% and 26%, respectively, p = 0.04 Kruskal–Wallis test) (Figure 3). The most abundant and frequent saprotrophic orders were Mortierellales (29% and 30% in managed and forest reserves, respectively, p = 0.44) and Eurotiales (24% and 21% in managed and forest reserves, respectively, p = 0.33) (Figure 4b). The relative abundances of Helotiales (8% and 6%, respectively, p = 0.01, Kruskal–Wallis test) and Umbelopsidales were significantly higher in managed forests than in forest reserves (p = 0.02, Kruskal–Wallis test). The most abundant and frequent genera were Archaerhizomyces, Morierella, Trichoderma, and Umbelopsis (Supplementary Materials Tables S3 and S6).
The relative abundance of pathotrophic fungi was similar in managed forests and forest reserves (3% and 2%, respectively, p = 0.31) (Figure 3). The most abundant and frequent pathotrophic species were Verticillium leptobactrum and Pochonia bulbillosa (Supplementary Materials Tables S2 and S5). The relative abundance of other symbiotrophic fungi was similar in managed forests and forest reserves (7% and 6%, respectively) (Figure 3). Among other symbiotrophic fungi, the most abundant and frequent genus was Oidiodendron (8 fungal OTUs) (Supplementary Materials Tables S3 and S6).
The relative abundance of OTUs classified as other fungi was similar in managed forests and forest reserves (18% and 16% respectively, p = 0.30) (Figure 3). The most abundant and frequent order in this group of fungi was Helotiales (e.g., Meliniomyces bicolor, M. variabilis, and Phialocephala fortini) (Supplementary Materials Tables S3 and S6).
The composition of all identified fungal OTUs differed depending on both the site (R = 0.45, p = 0.0001) and management regime (R = 0.41, p = 0.001) (Figure 5a). Separately, nonmetric multidimensional scaling based on the Jaccard dissimilarities for each of the trophic groups showed that fungal OTU composition differed depending on the site and management type, with site being a primary effect (Figure 5b,c).

3.3. Impact of Environmental Variables on Soil Fungal Diversity
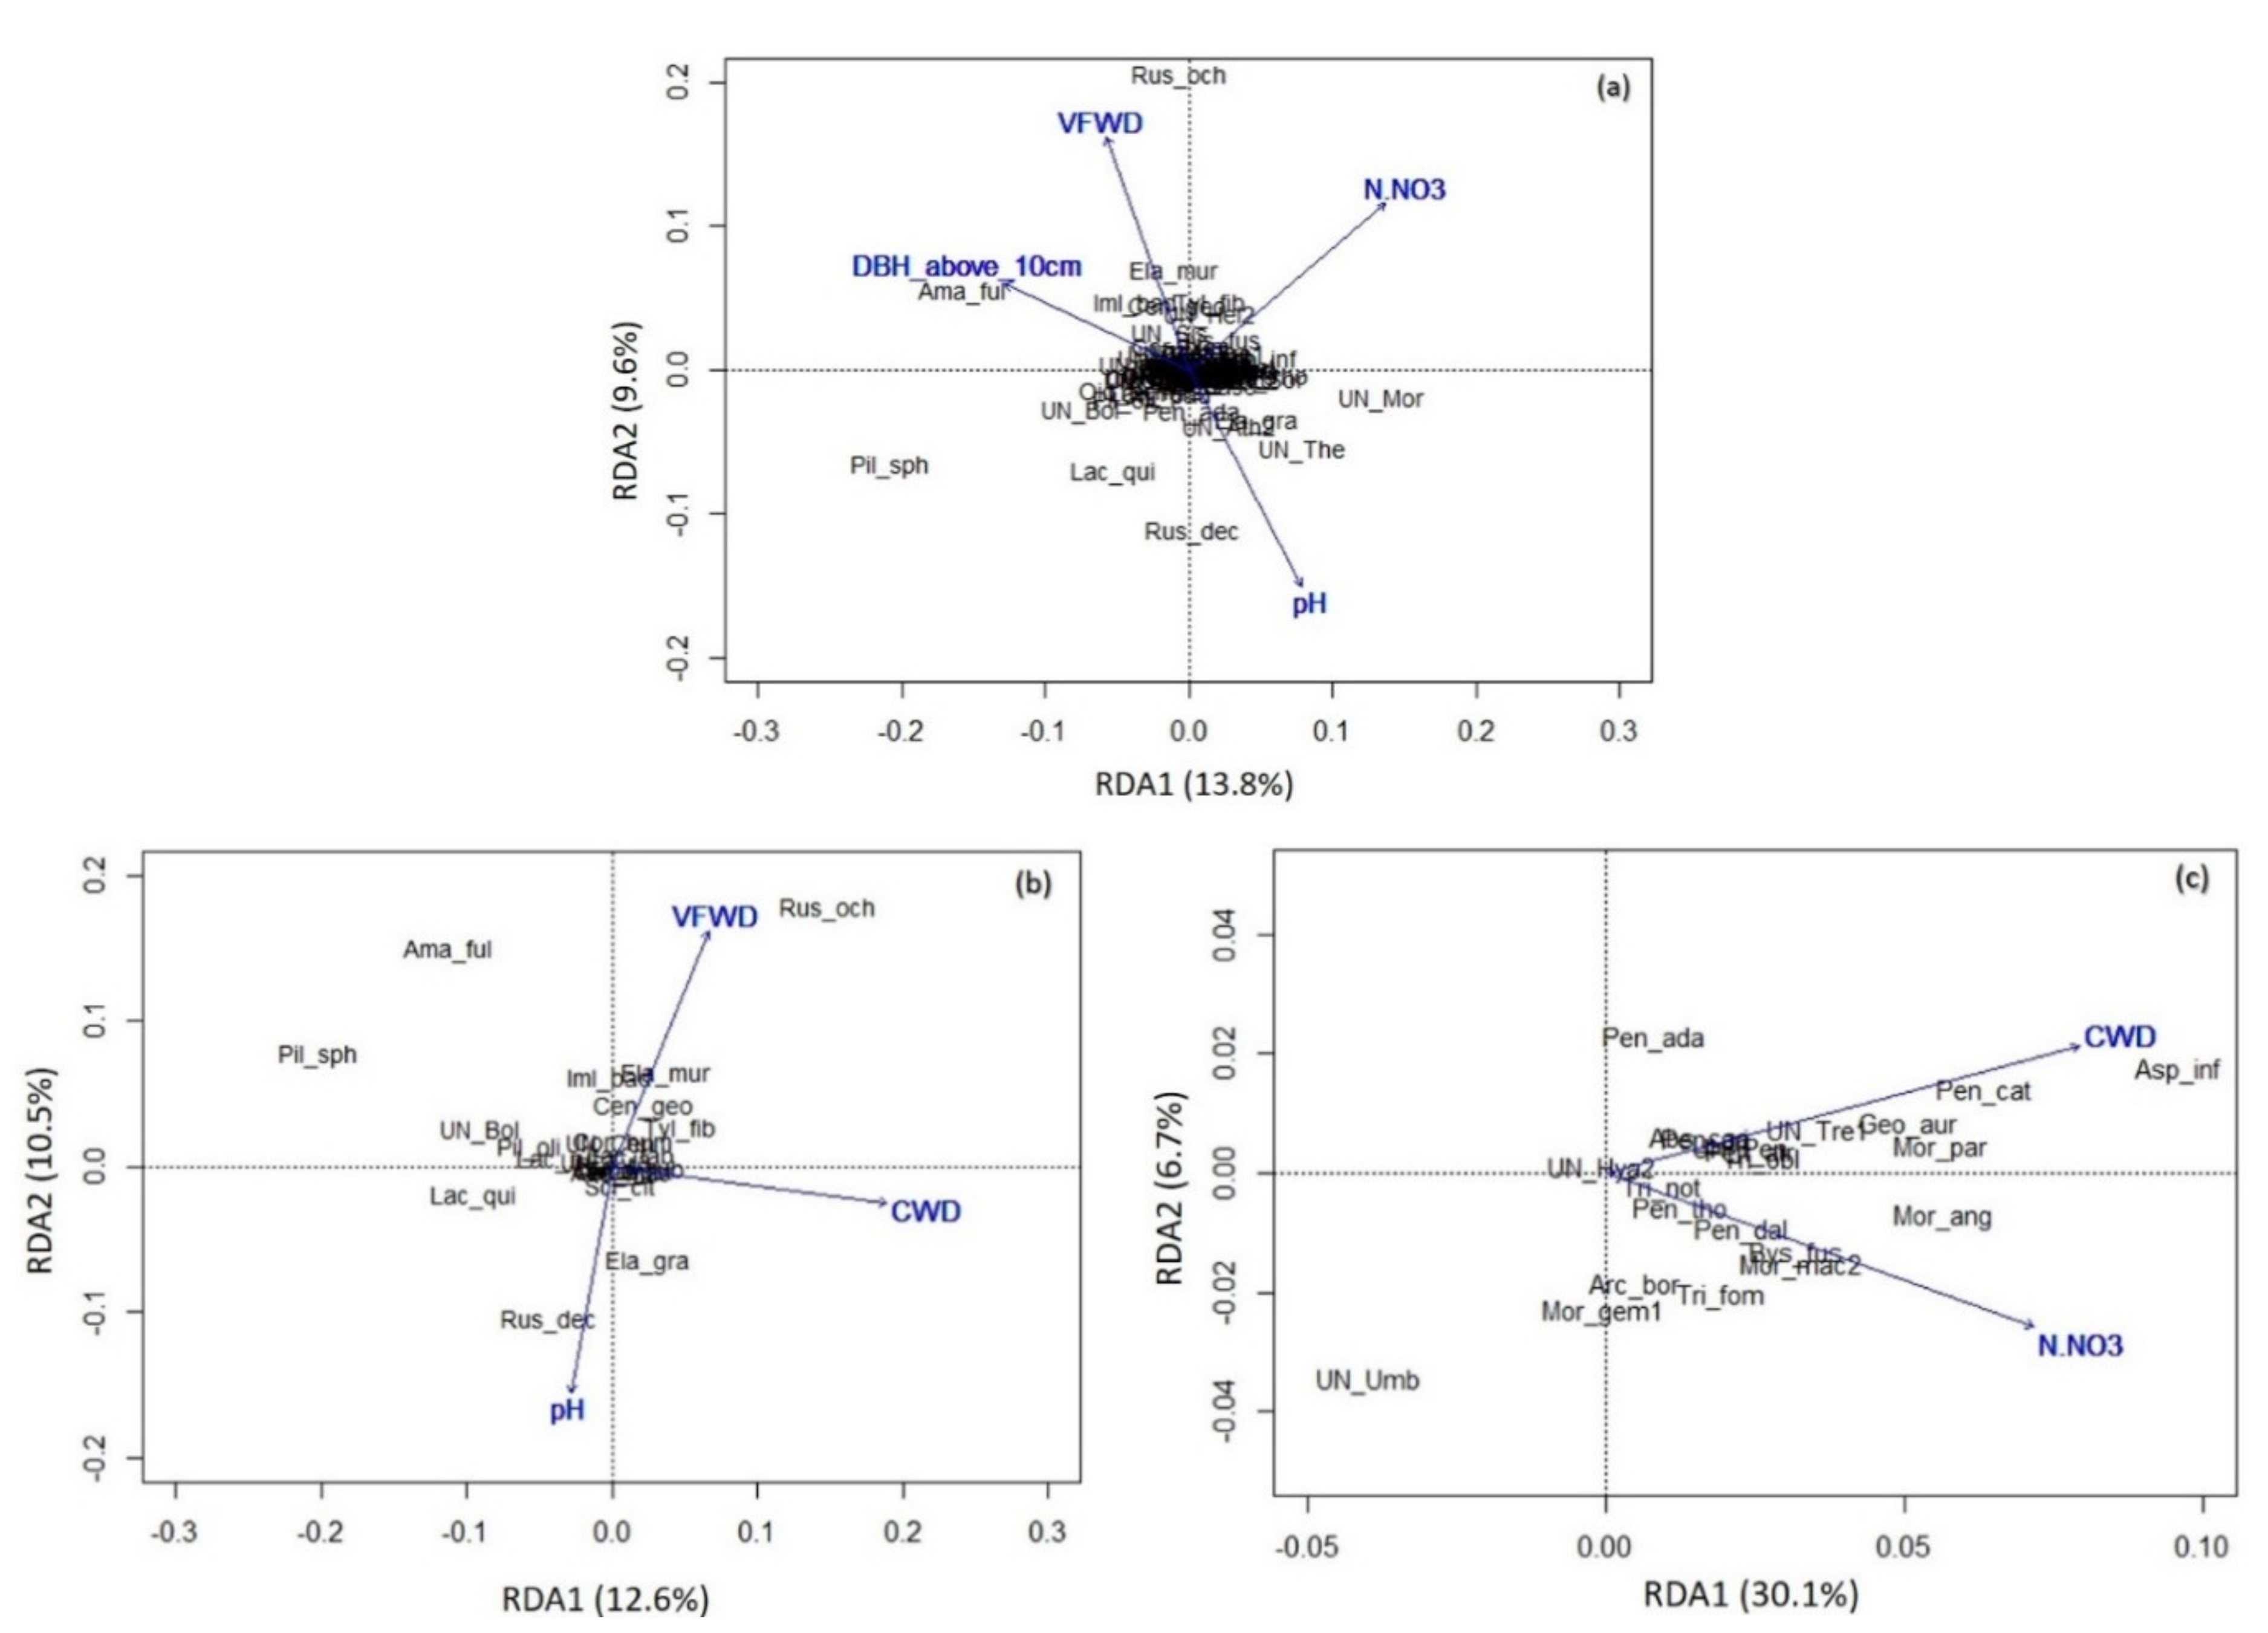
A correlation analysis revealed that the most important environmental factors shaping OTU richness of soil fungi were number of ECM tree species, number of trees with a DBH >10cm, and thickness of the organic layer. The best predictors of ECM fungal OTU richness were number of tree species, number of ECM tree species, and number of trees with a DBH <10 cm. The richness of saprotrophic OTUs was positively correlated with the number of ECM tree species and thickness of the organic layer.
The Shannon diversity index calculated for all fungal OTUs was positively correlated with total and organic C content, total N soil content, soil NO3, and NH4 concentration, whereas Shannon diversity of ECM fungi showed a positive correlation with total soil N content and both total and organic C content (Table 1).
The general fungal OTU composition of soil fungal communities was significantly correlated with soil nitrate (NO3) concentration (p < 0.001), volume of FVWD (p < 0.001), number of trees with a DBH >10 cm (p = 0.002), and soil pH (p = 0.030) (Table 2, Figure 6a). The ECM and SAP community compositions correlated with different environmental variables (Table 2, Figure 6b,c). Whereas volume of CWD (p < 0.001), soil pH (p = 0.018), and volume of FVWD (p = 0.023) explained the variability in the ECM fungal community, SAP fungi were influenced primarily by volume of CWD (p < 0.001) and soil nitrate (NO3) concentration (p = 0.026) (Table 2).
(a)
Total soil fungal community: The first axis explains 13.8% of the variability, the second explains 9.6% of the variability.
Abbreviations: Abs_caa—Absidia caatinguensis; Ace_mac—Acephala macrosclerotiorum; Ama_ful—Amanita fulva; Ama_por—Amanita porphyria; Ama_rub—Amanita rubescens; Arc_bor—Archaeorhizomyces borealis; Asp_inf—Aspergillus inflatus; Bys_fus—Byssonectria fusispora; Cen_geo—Cenococcum geophilum; Chl_pau—Chloridium paucisporum; Cor_aur—Cortinarius aurantiobasis; Cor_hum—Cortinarius humboldtensis; Ela_gra—Elaphomyces granulatus; Ela_mur—Elaphomyces muricatus; Geo_aur—Geomyces auratus; Iml_bad—Imleria badia; Lac_qui—Lactarius quietus; Lac_ruf—Lactarius rufus; Lac_tab—Lactarius tabidus; Mel_bic—Meliniomyces bicolor; Mel_var—Meliniomyces variabilis; Mel_vra—Meliniomyces vraolstadiae; Mor_ang—Mortierella angusta; Mor_gem1—Mortierella gemmifera; Mor_mac2—Mortierella macrocystis; Mor_par—Mortierella parvispora; Oid_chl—Oidiodendron chlamydosporicum; Oid_ech—Oidiodendron echinulatum; Oid_pil—Oidiodendron pilicola; Oid_rho—Oidiodendron rhodogenum; Pen_ada—Penicillium adametzii; Pen_ari—Penicillium arianeae; Pen_atr—Penicillium atrofulvum; Pen_cat—Penicillium catalonicum; Pen_dal—Penicillium daleae; Pen_tho—Penicillium thomii; Pez_eri—Pezoloma ericae; Pil_oli—Piloderma olivaceum; Pil_sph—Piloderma sphaerosporum; Poc_bul—Pochonia bulbillosa; Pse_tri—Pseudotomentella tristis; Rus_dec—Russula decolorans; Rus_och—Russula ochroleuca; Sai_pod—Saitozyma podzolica; Scl_cit—Scleroderma citrinum; Sol_ter—Solicoccozyma terricola; Tri_fom—Trichoderma fomiticola; Tri_not—Trichoderma nothescens; Tri_obl—Trichoderma oblongisporum; Tyl_fib—Tylospora fibrillosa; UN_Arc1—UN Archaeorhizomyces; UN_Asc1—UN Ascomycota 1; UN_Asc2—UN Ascomycota 2; UN_Ath2—UN Atheliaceae; UN_Bas3—UN Basidiomycota 3; UN_Bol—UN Boletaceae; UN_Can—UN Cantharellales; UN_Cen—UN Cenococcum; UN_Cha4—UN Chaetothyriales; UN_Fun—UN Fungi; UN_Fus—UN Fusarium; UN_Hel2—UN Helotiales; UN_Hya2—UN Hyaloscyphaceae; UN_Leu—UN Leucosporidiales; UN_Mel—UN Meliniomyces; UN_Mor—UN Mortierella; UN_Oid—UN Oidiodendron; UN_Pen—UN Penicillium; UN_Roz3—UN Rozellomycota 3; UN_Roz4—UN Rozellomycota 4; UN_Roz8—UN Rozellomycota 8; UN_Seb—UN Sebacinales; UN_Sis—UN Sistotrema; UN_Sor—UN Sordariales; UN_The—UN Thelephoraceae; UN_Tol—UN Tolypocladium; UN_Tre1—UN Trechispora; UN_Tyl3—UN Tylospora; UN_Umb—UN Umbelopsis; Ver_lep—Verticillium leptobactrum.
(b)
Ectomycorrhizal fungal communities: The first axis explains 12.6% of the variability, the second explains 10.5% of the variability.
Abbreviations: Ace_mac—Acephala macrosclerotiorum; Ama_ful—Amanita fulva; Ama_por—Amanita porphyria; Ama_rub—Amanita rubescens; Cen_geo—Cenococcum geophilum; Cor_aur—Cortinarius aurantiobasis; Cor_hum—Cortinarius humboldtensis; Ela_gra—Elaphomyces granulatus; Ela_mur—Elaphomyces muricatus; Iml_bad—Imleria badia; Lac_qui—Lactarius quietus; Lac_ruf—Lactarius rufus; Lac_tab—Lactarius tabidus; Pil_oli—Piloderma olivaceum; Pil_sph—Piloderma sphaerosporum; Pse_tri—Pseudotomentella tristis; Rus_dec—Russula decolorans; Rus_och—Russula ochroleuca; Scl_cit—Scleroderma citrinum; Tyl_fib—Tylospora fibrillosa; UN_Bol—UN Boletaceae; UN_Cen—UN Cenococcum; UN_The—UN Thelephoraceae; UN_Tyl3—UN Tylospora.
(c)
Saprotrophic fungal communities: The first axis explains 30.1% of the variability, the second explains 6.7% of variability
Abbreviations: Abs_caa—Absidia caatinguensis; Arc_bor—Archaeorhizomyces borealis; Asp_inf—Aspergillus inflatus; Bys_fus—Byssonectria fusispora; Geo_aur—Geomyces auratus; Mor_ang—Mortierella angusta; Mor_gem1—Mortierella gemmifera; Mor_mac2—Mortierella macrocystis; Mor_par—Mortierella parvispora; Pen_ada—Penicillium adametzii; Pen_ari—Penicillium arianeae; Pen_atr—Penicillium atrofulvum; Pen_cat—Penicillium catalonicum; Pen_dal—Penicillium daleae; Pen_tho—Penicillium thomii; Tri_fom—Trichoderma fomiticola; Tri_not—Trichoderma nothescens; Tri_obl—Trichoderma oblongisporum; UN_Arc1—UN Archaeorhizomyces; UN_Hya2—UN Hyaloscyphaceae; UN_Mor—UN Mortierella; UN_Pen—UN Penicillium; UN_Tre1—UN Trechispora; UN_Umb—UN Umbelopsis.
Within the OTUs dataset, we noted 5 ECM and 13 SAP fungal species of conservation concern listed in the Red List of Macromycetes of Poland [64]. Sixteen red-listed species were found in both forest reserves and managed forests. Only two species, Russula caerulea and Entoloma juncinum, have been considered characteristic of forest reserves or managed forest, respectively (Table 3).

4. Discussion

4.1. Overall Taxa Richness and Diversity of Trophic Groups

In total, 599 fungal OTUs (“taxa”) were recovered from the soils of the investigated European mixed coniferous forests located in West, Central, and East Poland, with 542 OTUs in managed forests and 554 OTUs in forest reserves (Figure 1), which reflects 88 to 86% of estimated taxa richness from managed forests (M) and forest reserves (R), respectively. Thus, we cannot exclude the possibility that a higher number of samples over larger spatial scales would yield higher taxa richness in analyzed mixed European coniferous forests. Recent molecular surveys in a variety of forest habitats indicated that fungal soil taxa richness is much higher than previously reported, ranging from 600 to over 2000 OTUs, depending on numerous environmental factors (e.g., age and type of forest site, composition of host tree species, bioclimatic zone, season, soil chemistry) and methodological approaches (e.g., number of plots and sites, sampling effort, type of NGS platform) [4,29,45,67]. These studies all stressed the necessity of further examining the issues that trigger fungal hyperdiversity, as previous research has thus far failed to reach saturated, comprehensive estimates of fungal diversity [4].
In our study, formerly managed forest reserves (established around 50 years ago) and forests under standard forest management appeared to be similar in terms of total and mean species richness of all fungal OTUs, as well as OTUs assigned to different functional trophic groups (Figure 1 and Figure 2). Thus, our results support our first hypothesis and corroborate the limited number of studies based on surveys of sporocarps or soil DNA analyses that revealed high similarity in fungal richness in formerly managed forest reserves compared to nonintensively managed forests [29,68,69,70]. However, the Jackknife extrapolated fungal OTU richness yielded slightly more fungal OTUs in forest reserves (643) than in corresponding managed forests (617). Furthermore, marginally higher total taxa richness of all fungi and functional groups of ectomycorrhizal fungi (ECM) was found in forest reserves, which may be the first sign of the influence of the cessation of forest management on fungal taxa richness in studied mixed coniferous forests. This was further suggested by the occurrence of 17% of taxa specific to only one management strategy (M or R). To what extent the incidence of these strategy-specific fungal taxa is driven by the particular conditions of each examined forest strategy, or is simply due to methodological bias, remains an open question. Long-term studies have shown that the relative abundance of root-associated communities (i.e., ectomycorrhizal and ericoid mycorrhizal fungi) increased 50 years after the cessation of logging, while saprotrophic communities decreased [71], suggesting that fungal diversity can be restored if stands remain unmanaged for long periods [24,72]. According to a meta-analysis by Spake et al. [35], ninety years was the average time for recovery of ECM fungal richness to old-growth values. In this context, our forest reserves that have remained under protection for about 50 years can be considered to be half way to recovery in terms of reaching old-growth forest attributes.
Of the 599 high-quality fungal OTUs obtained, Ascomycota and Basidiomycota were the predominant phyla, comprising 88% of all identified fungi (Supplementary Materials Table S2). This slight taxonomic dominance in favor of Basidio- or Ascomycota in soil fungi, depending on the forest type or season, corroborates previous studies investigating forest soils [6,21,28,45,73,74,75,76]. Ascomycota, the largest phylum of fungi [77], was also the most taxa-rich (49% OTUs) in our study, indicating its dominance in the studied mixed coniferous forest, with no differences observed between forest reserves and managed forests. In terms of abundance, however, Basidiomycota was the most diverse group of fungi, with a higher abundance observed in forest reserves than in managed forests (54% and 47%, respectively). The high abundance of Basidiomycota is not surprising, as basidiomycetous fungi appear to be an important component of both the ECM trophic group (Figure 4a) and the SAP fungi (Figure 4b). Among fungi that were characterized in forest reserves by higher richness and abundance, Mucoromycota and Mortierellomycota were detected, a group comprising many decomposers of plant material but also noted among mycorrhizal fungi, root endophytes, and plant pathogens [78]. Glomeromycota were not well represented in our soil samples, mostly due to low affinity of the primers used to this group of fungi [79,80], but also due to the predominance of ECM host trees versus arbuscular tree partners in mixed coniferous forests.
The main functional components of fungal assemblages in the soil of tested mixed coniferous forests consisted of SAP (42% fungal OTUs; 27% fungal sequences) and ECM fungi (16%; 47%), i.e., trophic groups involved in carbon and nutrient cycling at the root-soil interface [81,82]. Interestingly, no differences were observed in either richness or abundance of SAP fungi between forest reserves and managed stands. However, both OTU richness and sequence abundance of ECM fungi tended to be higher in the forest reserves, though not significantly. Our results indicate that in contrast to intensive management practices such as clear-cutting, which lead to the proliferation of SAP fungi and a decrease in ECM fungi [23,24], nonintensive forest management activities, as explored in our study, do not alter soil fungi diversity. Our former study [26], carried out in the same experimental area but based on analysis of ECM root tips and sporocarps, provided nonoverlapping results and revealed higher total ECM species richness in managed forests than in forest reserves. This inconsistency may have arisen from the different methodological approaches applied in these two studies, as the evaluation of sporocarps and mycorrhiza analysis spanned three years of observations [26], while metabarcoding research was restricted to only a single time series. Direct comparison of data obtained using different methods should always be interpreted with caution, given the biases inherent in any methodology [83]. The dissimilarity of results obtained using different methods was noted in previous studies and is suggested to be partly due to the patchiness of fungal distribution within the soil, even between spatially close soil samples, and/or the differential ability of fungi to occupy different ecological niches [82. Nevertheless, a recent comparison of different methods clearly showed that combining various data types is advisable to provide a comprehensive view of a fungal community [84,85].
Our studies indicate that both site and management strategy (M or R) influence species composition of soil fungal communities, confirming our second hypothesis (Figure 5a). It is worth noting that site appears to be a more influential driver of fungal composition than type of management for both ECM and SAP fungi. The results from ANOSIM analysis of ECM and SAP fungi (0.54 and 0.64, respectively) indicated the separation of the fungal communities of different sites (Figure 5b,c) [86]. The sites for this experiment were carefully selected for habitat similarity, but the surrounding landscape and some environmental factors not included in our study likely affected the composition of ECM and SAP fungal trophic groups within these sites. Additionally, site is widely accepted in other studies as an overriding factor in structuring fungal communities [87]. This aligns with the phenomenon known as distance decay, which suggests a general reduction in similarity of community composition with increasing geographical distance, and indicates that soil fungal community assembly may have a strong stochastic component [88,89,90]. The management strategy (M vs. R) affected the fungal composition to a lesser degree than site, and the R values of ANOSIM analysis for ECM and SAP (0.25 and 0.28, respectively) indicated highly overlapping fungal assemblies of managed forests and forest reserves. Likewise, in managed and unmanaged P. sylvestris stands located in Lithuanian national parks, similar diversity and composition of soil fungal communities were reported [29]. These results contrast with previously observed effects of intense management practices, such as clear-cutting, which usually lead to major losses of ECM species [24,91,92] or changes in ECM and/or overall soil fungal community composition [93,94,95], but support the study demonstrating that less severe forest intervention (e.g., forest thinning) does not significantly affect fungal species, guild composition, or fungal diversity [25]. Consequently, we found no clear compositional pattern in ECM, SAP, and PATO fungi for either management strategy (M or R), and communities of soil fungi from different trophic groups were similar in abundance and diversity overall.
Ectomycorrhizal fungal communities in both managed forests and forest reserves were dominated by Basidiomycota and Ascomycota fungi from the genera Elaphomyces, Cenococcum, Russula, Lactarius, Imleria, Piloderma, and Scleroderma (Supplementary Matrials Table S6). All these fungi are considered multi- and late-stage fungi, and were previously reported in several studies conducted in temperate and boreal forests [47,93,96,97]. Interestingly, one of the most dominant ECM fungal taxa in soil samples (UN Boletaceae) remained unidentified, thereby limiting our understanding of its importance and functional roles. Though on the order level, no significant relationships between identified fungi and management strategy were found, a Kruskal–Wallis test revealed that some species (Piloderma olivaceum, Pseudotomentella tristis) appeared to dominate in managed stands, whereas other species (Tylospora fibrilosa, Lactarius tabidus) dominated in reserve stands. It is interesting to note that some taxa commonly found in morphotyping studies in temperate forests (e.g., Cenococcum) [26,47] were not among the prominent ECM genera in our metagenomic soil analysis. Thus, with the help of high-throughput sequencing, we demonstrated that some species are less abundant as mycelium in soil than what might be expected from their occurrence as ectomycorrhizae. One should consider the data as yet another continuation point in filling the enormous gap in our knowledge on EM fungal communities [26].
Among saprotrophic fungi, taxa found within the ancient cryptic group of soil fungi termed Archaeorhizomycetes were both abundant and frequent; members of this group are described as having root endophytic properties and saprotrophic potential in the laboratory condition [98]. Archaeorhizomycetes are further noted to accompany roots of Pinus sylvestris and Picea abies [97,98,99], and their appearance in our stands was probably stimulated by the presence of these host trees. However, the precise environmental requirements and ecological roles of these fungi in terrestrial ecosystems remain unclear [100]. Recent data suggest that forest management can favor some taxa within Archaeorhizomycetes [29], but this was not confirmed by our study.
OTU richness of pathotrophic fungi was nearly the same in both forest reserves and managed forests, and though PAT fungi constituted more than 11% of all identified soil fungi, their abundance in soils of mixed coniferous forests was low (2–3%), i.e., similar to their abundance in other temperate forest ecosystems [101,102]. The pathogens were present without accompanying symptoms attributable to root disease on the trees or the understory vegetation, and we did not observe symptoms of tree decline in either managed or unmanaged forests. However, we cannot exclude the possibility that under suitable conditions (e.g., biotic or abiotic stress), identified soil pathogens may cause serious damage to forest ecosystems [103]. The most common pathotrophic fungus appeared to be Verticillium leptobactrum, a species commonly isolated from decaying wood and forest soils [104,105] but also found as a parasite of nematodes [106]. Recently, Verticillium species, along with the other genera of nonbasidiomycetous r-strategists (e.g., Aspergillus, Penicillium, Mortierella, Cladosporium), was found to play a role in the turnover of fungal biomass in forest litter [107]. It is worth noting that nematode and insect infecting species like V. leptobactrum and P. bulbillosa (the most abundant PAT in studied stands) would be unlikely to damage trees.

4.2. Environmental Drivers

Though some studies suggest that on a broad scale, soil fungal communities are highly influenced by stochastic processes [88,89], ample evidence suggests that on a local or regional scale, fungal communities are also shaped by soil and other environmental factors [21,80,87]. Our study found that the taxa richness and diversity (H’) of all soil fungi and ECM fungi were influenced by dissimilar sets of environmental factors. Taxa richness was highly correlated with environmental variables related to the biotic features of stands such as total number of tree species, number of ECM tree species, and number of trees with a DBH >10 cm, etc. Diversity, however, was affected by soil chemical properties (C and N; Table 1). These results agree with our previous studies [26], in which taxa richness of ECM fungi, as determined by molecular identification of ectomycorrhizas, was also positively correlated with total number of trees with a DBH >10 cm and number of tree species. These results may be due to the higher availability of resources provided by a higher number of trees, as well as a high density of fine roots that may be colonized by ectomycorrhizal fungi.
Abiotic and biotic factors are responsible not only for species richness of fungi, but may also significantly shape the qualitative structure of fungal communities [108,109,110,111]. In our study, redundancy analysis results indicated that soil pH significantly affects the composition of all soil fungi and ECM fungi, whereas N-NO3 is a driver of the composition of all soil fungi and SAP fungi, supporting our third hypothesis. The results concerning the effect of soil pH are consistent with previous studies indicating soil pH as the primary determinant of fungal community composition, as well as an important factor influencing the abundance of some fungal groups, both on a global scale and within individual localities [6,76,112].
High levels of nitrogen, particularly in mineral form, are well recognized as one of the key factors both negatively affecting ECM fungal richness and diversity and enriching fungal communities with a saprotrophic life strategy [113,114,115,116,117]. This was particularly evident in the case of fungi such as Mortierella, Penicillium, or Solicoccozyma, which doubled their relative abundances at sites with high nitrate levels in comparison to control conditions.
Volume of woody debris was another factor identified as an important driver of soil fungal community composition of all fungi, ECM fungi, and SAP fungi (Table 2; Figure 6). Deadwood is well recognized in many studies as an essential factor that significantly affects the presence and species composition of specialized wood-inhabiting fungi [30], and can also be an important habitat for many ECM fungi, i.e., mainly resupinate members of the ECM families Thelephorales and Atheliales (Amphinema, Piloderma, Tylospora, Tomentella, etc.) [118,119]. Considering this, it was surprising that RDA analysis showed a negative relationship between relative abundance of two Piloderma OTUs (P. sphaerosporum and P. olivaceum) and volume of woody debris. This puzzling result may be due to the relatively small amount of deadwood in our plots (maximum 25.5 m3 ha). The volume of woody debris necessary to detect changes in fungal community composition has been discussed in detail by Walker et al. [118].

4.3. The Red-Listed Species

Our work provides a wealth of data concerning the diversity of fungal communities in managed and abandoned stands of mixed coniferous forest in Poland, both expanding the list of species that are characteristic for this type of forest ecosystem [26] and providing new data points for some rare species. The possibility of the contribution of DNA metabarcoding to fungal conservation was previously mentioned [120]. From the fungal OTUs identified in the soil of forest reserves and managed forests, observed red-listed species belonging to the endangered species category comprised two ECM fungi (Tylospora fibrilosa and Hydnellum concrescens) and four saprotrophs (Astrodon ferruginosus, Boidinia furfuracea, Hygrocybe intermedia, and Lepiota grangei) (Table 3). Regarding ECM fungi, this list does not correspond well with our previous study based on ECM root-tips analyses and macrofungal inventory [26]. This is not surprising, as records from ectomycorrhizas and macrofungal surveys reflect the real expression (physical presence) of these fungal species, whereas results of soil analyses instead represent a potential pool of fungal taxa that will be able to enter in ECM symbiosis and, consequently, produce sporocarps only under appropriate microhabitat conditions. Among species from the red-list category, Russula caerulea was noted only in forest reserve soil, and Entoloma juncinum only in managed forest soil, but their low frequencies do not allow any conclusions to be drawn about the possible dependency of these taxa on certain management strategies. Moreover, our previous studies identified R. caerulea in both managed and reserve stands [26]. We show, with the help of high-throughput sequencing, that some species that form resupinate sporocarps (e.g., corticioid fungus Tylospora fibrilosa) are more abundant as mycelium in soil than what might be expected from their occurrence as sporocarps. This is often the case, as species with inconspicuous sporocarps are regularly shown to be much more diverse and abundant in soil and root samples than demonstrated in solely sporocarp-based diversity assessments [121,122]. Their fruiting structures are cryptic and tend to be ignored in surveys of sporocarps, thus contributing to the disparity between above- and below-ground species lists [123]. Furthermore, species with specialized resource requirements are rarely seen fruiting, often resulting in their red-listed classification [124].

5. Conclusions

To the authors’ knowledge, these results are the first detailed analysis of the soil fungal communities from different trophic groups in European mixed coniferous forests (Querco roboris-Pinetum). Established around 50 years ago, formerly managed forest reserves and forests under standard forest management appeared similar in terms of total and mean species richness of all fungal OTUs, as well as OTUs assigned to different functional trophic groups, but, to a certain degree, still taxonomically diverse. Both the site and stand type (management regime) influenced soil fungal communities, with the primary effect being the site. Our results indicate that the transformation of fungal diversity after cessation of forest management is rather slow. The consequences and/or benefits of setting up new forest reserves, outcomes which are crucial to understand in implementing effective conservation policy, may therefore take a long time to be detected. Future studies concerning multi-taxonomical diversity and conducted after a longer period following management and abandonment could complement the results of this work. Questions remain regarding how long soil fungi community and other taxonomic groups take to recover after disturbances such as forest management, whether they constitute a positive response strategy, and how the duration of abandonment and protection influence the forest ecosystem. Because our research shows that both forest reserves and managed forests contribute to maintaining soil fungal diversity, and each management regime provides a certain number of taxa not found in the other, we believe that both strategies are needed to ensure the greatest possible variety of fungi in the forest.
Despite the enormous capabilities of next-generation sequencing and the discovery of high fungal diversity in the soil of tested forests, not all fungi found by mycorrhizal root tips analysis and sporocarps surveys in our parallel studies were recovered [26]. Therefore, we agree with the conclusions of other authors, i.e., that to obtain a comprehensive and complete understanding of the diversity and functioning of soil mycobiota, varied methods should be applied [85]. Our future project based on sporocarp surveys of fungi from different trophic groups will add to the research regarding the appearance of fungi in mixed coniferous forest and confirm/supplement species occurrences that are currently based on soil sequence data.

Supplementary Materials

The following are available online at https://www.mdpi.com/1999-4907/12/3/353/s1, Table S1: The contribution of the main trees species with a specified age (y) in the managed forests (M) and forest reserves (R) at three study sites (P –Przytok, K - Kalisz, L – Łochów), Table S2: The share of the detected phyla in the managed forests (M) and forest reserves (R) based on the number of the identified operational taxonomic units (OTUs) and the number of sequence reads, Table S3: The most frequent soil fungal OTUs from all trophic groups found in the managed forests (M) and forest reserves (R); (only fungal OTUs with total frequency 21-24 plots are included), Table S4: Frequency of the soil fungal OTUs from different trophic groups found in the managed forests only, Table S5: Frequency of the soil fungal OTUs from different trophic groups found in forest reserves only, Table S6: List of the most abundant fungal OTUs.

Author Contributions

Conceptualization: M.B.K., M.R. and T.L.; Supervision: M.R. and T.L.; Investigation: M.B.K. and T.L.; Formal analysis: M.B.K. and R.W. Visualization: M.B.K. and R.W. Writing—original draft preparation M.B.K. Writing and editing: M.R. and T.L.; Funding acquisition: M.R. All authors have read and agreed to the published version of the manuscript.

Funding

The study was financed by National Science Centre, Poland, under the project no. 2014/13/B/NZ9/01992. The study was partially supported by the Institute of Dendrology, Polish Academy of Sciences.

Institutional Review Board Statement

Not applicable.

Informed Consent Statement

Not applicable.

Data Availability Statement

The data used in this study can be accessed by contacting the corresponding authors.

Acknowledgments

We are grateful to Mariola Matelska (Institute of Dendrology, Polish Academy of Sciences) for her technical assistance. We also thank Małgorzata Stasińska (University of Szczecin, Institute of Marine and Environmental Sciences) for helpful discussion.

Conflicts of Interest

The authors declare no conflict of interest.

References

  1. Hawksworth, D.L.; Lücking, R. Fungal Diversity Revisited: 2.2 to 3.8 Million Species. In The Fungal Kingdom; ASM Press: Washington, DC, USA, 2017; pp. 79–95. [Google Scholar]
  2. Larsen, B.B.; Miller, E.C.; Rhodes, M.K.; Wiens, J.J. Inordinate Fondness Multiplied and Redistributed: The Number of Species on Earth and the New Pie of Life. Q. Rev. Biol. 2017, 92, 229–265. [Google Scholar] [CrossRef] [Green Version]
  3. Mueller, G.M.; Schmit, J.P. Fungal biodiversity: What do we know? What can we predict? Biodivers. Conserv. 2007, 16, 1–5. [Google Scholar] [CrossRef]
  4. Taylor, D.L.; Hollingsworth, T.N.; McFarland, J.W.; Lennon, N.J.; Nusbaum, C.; Ruess, R.W. A first comprehensive census of fungi in soil reveals both hyperdiversity and fine-scale niche partitioning. Ecol. Monogr. 2014, 84, 3–20. [Google Scholar] [CrossRef]
  5. Anderson, I.C.; Genney, D.R.; Alexander, I.J. Fine-scale diversity and distribution of ectomycorrhizal fungal mycelium in a Scots pine forest. New Phytol. 2014, 201, 1423–1430. [Google Scholar] [CrossRef]
  6. Tedersoo, L.; Bahram, M.; Põlme, S.; Kõljalg, U.; Yorou, N.S.; Wijesundera, R.; Ruiz, L.V.; Vasco-Palacios, A.M.; Thu, P.Q.; Suija, A.; et al. Global diversity and geography of soil fungi. Science 2014, 346, 1256688. [Google Scholar] [CrossRef] [PubMed] [Green Version]
  7. Dahlberg, A.; Genney, D.R.; Heilmann-Clausen, J. Developing a comprehensive strategy for fungal conservation in Europe: Current status and future needs. Fungal Ecol. 2010, 3, 50–64. [Google Scholar] [CrossRef]
  8. Boddy, L.; Büntgen, U.; Egli, S.; Gange, A.C.; Heegaard, E.; Kirk, P.M.; Mohammad, A.; Kauserud, H. Climate variation effects on fungal fruiting. Fungal Ecol. 2014, 10, 20–33. [Google Scholar] [CrossRef]
  9. Heilmann-Clausen, J.; Barron, E.S.; Boddy, L.; Dahlberg, A.; Griffith, G.W.; Nordén, J.; Ovaskainen, O.; Perini, C.; Senn-Irlet, B.; Halme, P. A fungal perspective on conservation biology. Conserv. Biol. 2015, 29, 61–68. [Google Scholar] [CrossRef] [Green Version]
  10. Willis, K.J. State of the World’s Fungi 2018; Kew Publishing: Richmond, UK, 2018; ISBN 9781842466780. [Google Scholar]
  11. Tedersoo, L.; Smith, M.E. Lineages of ectomycorrhizal fungi revisited: Foraging strategies and novel lineages revealed by sequences from belowground. Fungal Biol. Rev. 2013, 27, 83–99. [Google Scholar] [CrossRef] [Green Version]
  12. Smith, S.; Read, D. Mycorrhizal Symbiosis, 3rd ed.; Academic Press (Elsevier): London, UK, 2008; ISBN 9780123705266. [Google Scholar]
  13. Courty, P.-E.; Buée, M.; Diedhiou, A.G.; Frey-Klett, P.; Le Tacon, F.; Rineau, F.; Turpault, M.-P.; Uroz, S.; Garbaye, J. The role of ectomycorrhizal communities in forest ecosystem processes: New perspectives and emerging concepts. Soil Biol. Biochem. 2010, 42, 679–698. [Google Scholar] [CrossRef]
  14. Dickie, I.A.; Alexander, I.; Lennon, S.; Öpik, M.; Selosse, M.-A.; van der Heijden, M.G.A.; Martin, F.M. Evolving insights to understanding mycorrhizas. New Phytol. 2015, 205, 1369–1374. [Google Scholar] [CrossRef]
  15. Holah, J.C.; Wilson, M.V.; Hansen, E.M. Effects of a native forest pathogen, Phellinus weirii, on Douglas-fir forest composition in western Oregon. Can. J. For. Res. 1993, 23, 2473–2480. [Google Scholar] [CrossRef]
  16. Hennon, P.E. Are heart rot fungi major factors of disturbance in gap-dynamic forests? Northwest. Sci. 1995, 69, 284–293. [Google Scholar]
  17. Baldrian, P.; Voříšková, J.; Dobiášová, P.; Merhautová, V.; Lisá, L.; Valášková, V. Production of extracellular enzymes and degradation of biopolymers by saprotrophic microfungi from the upper layers of forest soil. Plant. Soil 2011, 338, 111–125. [Google Scholar] [CrossRef]
  18. Lodge, D.J. Factors related to diversity of decomposer fungi in tropical forests. Biodivers. Conserv. 1997, 6, 681–688. [Google Scholar] [CrossRef]
  19. Vašutová, M.; Mleczko, P.; López-García, A.; Maček, I.; Boros, G.; Ševčík, J.; Fujii, S.; Hackenberger, D.; Tuf, I.H.; Hornung, E.; et al. Taxi drivers: The role of animals in transporting mycorrhizal fungi. Mycorrhiza 2019, 29, 413–434. [Google Scholar] [CrossRef] [PubMed]
  20. Paillet, Y.; Berges, L.; Hjältén, J.; Ódor, P.; Avon, C.; Bernhardt-Römermann, M.; Bijlsma, R.-J.; De Bruyn, L.; Fuhr, M.; Grandin, U.; et al. Biodiversity Differences between Managed and Unmanaged Forests: Meta-Analysis of Species Richness in Europe. Conserv. Biol. 2010, 24, 101–112. [Google Scholar] [CrossRef]
  21. Goldmann, K.; Schöning, I.; Buscot, F.; Wubet, T. Forest management type influences diversity and community composition of soil fungi across temperate forest ecosystems. Front. Microbiol. 2015, 6, 1–11. [Google Scholar] [CrossRef] [PubMed] [Green Version]
  22. Tomao, A.; Antonio Bonet, J.; Castaño, C.; De-Miguel, S. How does forest management affect fungal diversity and community composition? Current knowledge and future perspectives for the conservation of forest fungi. For. Ecol. Manag. 2020, 457, 117678. [Google Scholar] [CrossRef]
  23. Kyaschenko, J.; Clemmensen, K.E.; Hagenbo, A.; Karltun, E.; Lindahl, B.D. Shift in fungal communities and associated enzyme activities along an age gradient of managed Pinus sylvestris stands. ISME J. 2017, 11, 863–874. [Google Scholar] [CrossRef]
  24. Parladé, J.; Queralt, M.; Pera, J.; Bonet, J.A.; Castaño, C.; Martínez-Peña, F.; Piñol, J.; Senar, M.A.; De Miguel, A.M. Temporal dynamics of soil fungal communities after partial and total clear-cutting in a managed Pinus sylvestris stand. For. Ecol. Manag. 2019, 449, 117456. [Google Scholar] [CrossRef]
  25. Castaño, C.; Alday, J.G.; Lindahl, B.D.; Martínez de Aragón, J.; De-Miguel, S.; Colinas, C.; Parladé, J.; Pera, J.; Bonet, J.A. Lack of thinning effects over inter-annual changes in soil fungal community’ and diversity in a Mediterranean pine forest. For. Ecol. Manag. 2018, 424, 420–427. [Google Scholar] [CrossRef]
  26. Leski, T.; Rudawska, M.; Kujawska, M.; Stasińska, M.; Janowski, D.; Karliński, L.; Wilgan, R. Both forest reserves and managed forests help maintain ectomycorrhizal fungal diversity. Biol. Conserv. 2019, 238, 108206. [Google Scholar] [CrossRef]
  27. Spake, R.; van der Linde, S.; Newton, A.C.; Suz, L.M.; Bidartondo, M.I.; Doncaster, C.P. Similar biodiversity of ectomycorrhizal fungi in set-aside plantations and ancient old-growth broadleaved forests. Biol. Conserv. 2016, 194, 71–79. [Google Scholar] [CrossRef] [PubMed] [Green Version]
  28. Carron, A.I.; Garibaldi, L.A.; Marquez, S.; Fontenla, S. The soil fungal community of native woodland in Andean Patagonian forest: A case study considering experimental forest management and seasonal effects. For. Ecol. Manag. 2020, 461, 117955. [Google Scholar] [CrossRef]
  29. Lynikienė, J.; Marčiulynienė, D.; Marčiulynas, A.; Gedminas, A.; Vaičiukynė, M.; Menkis, A. Managed and Unmanaged Pinus sylvestris Forest Stands Harbour Similar Diversity and Composition of the Phyllosphere and Soil Fungi. Microorganisms 2020, 8, 259. [Google Scholar] [CrossRef] [Green Version]
  30. Heilmann-Clausen, J.; Adamčík, S.; Bässler, C.; Halme, P.; Krisai-Greilhuber, I.; Holec, J. State of the art and future directions for mycological research in old-growth forests. Fungal Ecol. 2017, 27, 141–144. [Google Scholar] [CrossRef]
  31. Forest Europe, 2015: State of Europe’s Forests 2015. Available online: https://foresteurope.org/state-europes-forests-2015-report/.2015 (accessed on 8 February 2021).
  32. Humphrey, J.W. Benefits to biodiversity from developing old-growth conditions in British upland spruce plantations: A review and recommendations. Forestry 2005, 78, 33–53. [Google Scholar] [CrossRef]
  33. Deal, R.L. Management strategies to increase stand structural diversity and enhance biodiversity in coastal rainforests of Alaska. Biol. Conserv. 2007, 137, 520–532. [Google Scholar] [CrossRef]
  34. Bauhus, J.; Puettmann, K.; Messier, C. Silviculture for old-growth attributes. For. Ecol. Manag. 2009, 258, 525–537. [Google Scholar] [CrossRef] [Green Version]
  35. Spake, R.; Ezard, T.H.G.; Martin, P.A.; Newton, A.C.; Doncaster, C.P. A meta-analysis of functional group responses to forest recovery outside of the tropics. Conserv. Biol. 2015, 29, 1695–1703. [Google Scholar] [CrossRef]
  36. Dvořák, D.; Vašutová, M.; Hofmeister, J.; Beran, M.; Hošek, J.; Běťák, J.; Burel, J.; Deckerová, H. Macrofungal diversity patterns in central European forests affirm the key importance of old-growth forests. Fungal Ecol. 2017, 27, 145–154. [Google Scholar] [CrossRef]
  37. Goicoechea, N.; Closa, I.; de Miguel, A.M. Ectomycorrhizal communities within beech (Fagus sylvatica L.) forests that naturally regenerate from clear-cutting in northern Spain. New For. 2009, 38, 157–175. [Google Scholar] [CrossRef]
  38. Abrego, N.; Salcedo, I. Variety of woody debris as the factor influencing wood-inhabiting fungal richness and assemblages: Is it a question of quantity or quality? For. Ecol. Manag. 2013, 291, 377–385. [Google Scholar] [CrossRef]
  39. Juutilainen, K.; Mönkkönen, M.; Kotiranta, H.; Halme, P. The effects of forest management on wood-inhabiting fungi occupying dead wood of different diameter fractions. For. Ecol. Manag. 2014, 313, 283–291. [Google Scholar] [CrossRef]
  40. Lelli, C.; Bruun, H.H.; Chiarucci, A.; Donati, D.; Frascaroli, F.; Fritz, Ö.; Goldberg, I.; Nascimbene, J.; Tøttrup, A.P.; Rahbek, C.; et al. Biodiversity response to forest structure and management: Comparing species richness, conservation relevant species and functional diversity as metrics in forest conservation. For. Ecol. Manag. 2019, 432, 707–717. [Google Scholar] [CrossRef]
  41. Aguirre-Calderón, O.A. Forest management in the XXI Century. Madera y Bosques 2015, 21, 17–28. [Google Scholar]
  42. Bengtsson, J.; Nilsson, S.G.; Franc, A.; Menozzi, P. Biodiversity, disturbances, ecosystem function and management of european forests. For. Ecol. Manag. 2000, 132, 39–50. [Google Scholar] [CrossRef]
  43. Bartniczak, B.; Raszkowski, A. Sustainable forest management in Poland. Manag. Environ. Qual. An. Int. J. 2018, 29, 666–677. [Google Scholar] [CrossRef]
  44. Gömöryová, E.; Ujházy, K.; Martinák, M.; Gömöry, D. Soil microbial community response to variation in vegetation and abiotic environment in a temperate old-growth forest. Appl. Soil Ecol. 2013, 68, 10–19. [Google Scholar] [CrossRef]
  45. Buée, M.; Reich, M.; Murat, C.; Morin, E.; Nilsson, R.H.; Uroz, S.; Martin, F. 454 Pyrosequencing analyses of forest soils reveal an unexpectedly high fungal diversity. New Phytol. 2009, 184, 449–456. [Google Scholar] [CrossRef]
  46. Rykowski, K. Forest biological diversity conservation as an element of sustainable forest management-policy and practice in Poland. Unasylva 2002, 53, 16–24. [Google Scholar]
  47. Rudawska, M.; Wilgan, R.; Janowski, D.; Iwański, M.; Leski, T. Shifts in taxonomical and functional structure of ectomycorrhizal fungal community of Scots pine (Pinus sylvestris L.) underpinned by partner tree ageing. Pedobiologia (Jena) 2018, 71, 20–30. [Google Scholar] [CrossRef]
  48. Gardes, M.; Bruns, T.D. ITS primers with enhanced specificity for basidiomycetes—application to the identification of mycorrhizae and rusts. Mol. Ecol. 1993, 2, 113–118. [Google Scholar] [CrossRef]
  49. White, T.J.; Bruns, T.D.; Lee, B.; Taylor, J.W. Amplification and direct sequencing of fungal ribosomal RNA genes for phylogenetics. In PCR-Protocols and Applications: A Laboratory Manual; Innis, M.A., Gelfand, H., Sninsky, J.S., White, T.J., Eds.; Academic Press: San Diego, CA, USA, 1990; pp. 315–322. [Google Scholar]
  50. Caporaso, J.G.; Kuczynski, J.; Stombaugh, J.; Bittinger, K.; Bushman, F.D.; Costello, E.K.; Fierer, N.; Peña, A.G.; Goodrich, J.K.; Gordon, J.I.; et al. QIIME allows analysis of high-throughput community sequencing data. Nat. Methods 2010, 7, 335–336. [Google Scholar] [CrossRef] [PubMed] [Green Version]
  51. Martin, M. Cutadapt removes adapter sequences from high-throughput sequencing reads. EMBnet J. 2011, 17, 10. [Google Scholar] [CrossRef]
  52. Aronesty, E. ea-utils: Command-Line Tools for Processing Biological Sequencing Data. Available online: https://expressionanalysis.github.io/ea-utils/ (accessed on 8 February 2021).
  53. Edgar, R.C. Search and clustering orders of magnitude faster than BLAST. Bioinformatics 2010, 26, 2460–2461. [Google Scholar] [CrossRef] [PubMed] [Green Version]
  54. Altschul, S. Basic Local Alignment Search Tool. J. Mol. Biol. 1990, 215, 403–410. [Google Scholar] [CrossRef]
  55. Nguyen, N.H.; Song, Z.; Bates, S.T.; Branco, S.; Tedersoo, L.; Menke, J.; Schilling, J.S.; Kennedy, P.G. FUNGuild: An open annotation tool for parsing fungal community datasets by ecological guild. Fungal Ecol. 2016, 20, 241–248. [Google Scholar] [CrossRef]
  56. Shannon, C.E. A mathematical theory of communication. Bell Syst. Tech. J. 1948, 27, 379–423. [Google Scholar] [CrossRef] [Green Version]
  57. Colwell, R.K.; EstimateS: Statistical Estimation of Species Richness and Shared Species from Samples. Version 9 and Earlier. User’s Guide and Application. 2013. Available online: http://purl.oclc.org/estimates (accessed on 8 February 2021).
  58. Hammer, O.; Harper, D.A.T.; Ryan, P.D. Past: Paleontological statistics software package for education and data analysis. Palaeontol. Electron. 2001, 4, 9. [Google Scholar]
  59. Magurran, A.E. Ecological Diversity and Its Measurement; Princeton University Press: Princeton, NJ, USA, 1988. [Google Scholar]
  60. Bardou, P.; Mariette, J.; Escudié, F.; Djemiel, C.; Klopp, C. jvenn: An interactive Venn diagram viewer. BMC Bioinform. 2014, 15, 293. [Google Scholar] [CrossRef] [PubMed] [Green Version]
  61. Lundberg, D.S.; Lebeis, S.L.; Paredes, S.H.; Yourstone, S.; Gehring, J.; Malfatti, S.; Tremblay, J.; Engelbrektson, A.; Kunin, V.; Del Rio, T.G.; et al. Defining the core Arabidopsis thaliana root microbiome. Nature 2012, 488, 86–90. [Google Scholar] [CrossRef] [Green Version]
  62. R Core Computing Team. R: A Language and Environment for Statistical Computing; R Found. Stat. Comput: Vienna, Austria, 2019. [Google Scholar]
  63. Oksanen, J.; Blanchet, F.G.; Friendly, M.; Kindt, R.; Legendre, P.; Mcglinn, D.; Minchin, P.R.; O’Hara, R.B.; Simpson, G.L.; Solymos, P.; et al. Vegan: Community Ecology Package; R Package Version 2.4-2, Community Ecol. Package. Available online: https://cran.r-project.org/web/packages/vegan/vegan.pdf (accessed on 8 February 2021).
  64. Naimi, B. Package “usdm” Uncertainty Analysis for Species Distribution Models. Available online: https://cran.r-project.org/web/packages/usdm/index.html (accessed on 8 February 2021).
  65. Graham, M.H. Confronting multicollinearity in ecological multiple regression. Ecology 2003, 84, 2809–2815. [Google Scholar] [CrossRef] [Green Version]
  66. Wojewoda, W.; Ławrynowicz, M. Red list of the macrofungi in Poland. In Red List of Plants and Fungi in Poland; Mirek, Z., Zarzycki, K., Wojewoda, W., Szeląg, Z., Eds.; W. Szafer Institute of Botany, Polish Academy of Sciences: Kraków, Poland, 2006; pp. 53–70. [Google Scholar]
  67. Vašutová, M.; Edwards-Jonášová, M.; Baldrian, P.; Čermák, M.; Cudlín, P. Distinct environmental variables drive the community composition of mycorrhizal and saprotrophic fungi at the alpine treeline ecotone. Fungal Ecol. 2017, 27, 116–124. [Google Scholar] [CrossRef]
  68. Bässler, C.; Ernst, R.; Cadotte, M.; Heibl, C.; Müller, J. Near-to-nature logging influences fungal community assembly processes in a temperate forest. J. Appl. Ecol. 2014, 51, 939–948. [Google Scholar] [CrossRef]
  69. Sitzia, T.; Campagnaro, T.; Dainese, M.; Cassol, M.; Cortivo, M.; Gatti, E.; Padovan, F.; Sommacal, M.; Nascimbene, J. Contrasting multi-taxa diversity patterns between abandoned and non-intensively managed forests in the southern Dolomites. iForest Biogeosci. For. 2017, 10, 845–850. [Google Scholar] [CrossRef] [Green Version]
  70. Leidinger, J.; Weisser, W.W.; Kienlein, S.; Blaschke, M.; Jung, K.; Kozak, J.; Fischer, A.; Mosandl, R.; Michler, B.; Ehrhardt, M.; et al. Formerly managed forest reserves complement integrative management for biodiversity conservation in temperate European forests. Biol. Conserv. 2020, 242, 108437. [Google Scholar] [CrossRef]
  71. Chen, J.; Xu, H.; He, D.; Li, Y.; Luo, T.; Yang, H.; Lin, M. Historical logging alters soil fungal community composition and network in a tropical rainforest. For. Ecol. Manag. 2019, 433, 228–239. [Google Scholar] [CrossRef]
  72. Paillet, Y.; Pernot, C.; Boulanger, V.; Debaive, N.; Fuhr, M.; Gilg, O.; Gosselin, F. Quantifying the recovery of old-growth attributes in forest reserves: A first reference for France. For. Ecol. Manag. 2015, 346, 51–64. [Google Scholar] [CrossRef]
  73. Vořiškova, J.; Brabcová, V.; Cajthaml, T.; Baldrian, P. Seasonal dynamics of fungal communities in a temperate oak forest soil. New Phytol. 2014, 201, 269–278. [Google Scholar] [CrossRef]
  74. Větrovský, T.; Kohout, P.; Kopecký, M.; Machac, A.; Man, M.; Bahnmann, B.D.; Brabcová, V.; Choi, J.; Meszárošová, L.; Human, Z.R.; et al. A meta-analysis of global fungal distribution reveals climate-driven patterns. Nat. Commun. 2019, 10, 1–9. [Google Scholar] [CrossRef] [PubMed] [Green Version]
  75. Wu, Y.T.; Wubet, T.; Trogisch, S.; Both, S.; Scholten, T.; Bruelheide, H.; Buscot, F. Forest Age and Plant Species Composition Determine the Soil Fungal Community Composition in a Chinese Subtropical Forest. PLoS ONE 2013, 8, 66829. [Google Scholar] [CrossRef] [PubMed] [Green Version]
  76. Wubet, T.; Christ, S.; Schöning, I.; Boch, S.; Gawlich, M.; Schnabel, B.; Fischer, M.; Buscot, F. Differences in Soil Fungal Communities between European Beech (Fagus sylvatica L.) Dominated Forests Are Related to Soil and Understory Vegetation. PLoS ONE 2012, 7, e47500. [Google Scholar] [CrossRef]
  77. James, T.Y.; Kauff, F.; Schoch, C.L.; Matheny, P.B.; Hofstetter, V.; Cox, C.J.; Celio, G.; Gueidan, C.; Fraker, E.; Miadlikowska, J.; et al. Reconstructing the early evolution of Fungi using a six-gene phylogeny. Nature 2006, 443, 818–822. [Google Scholar] [CrossRef]
  78. Bonfante, P.; Venice, F. Mucoromycota: Going to the roots of plant-interacting fungi. Fungal Biol. Rev. 2020, 34, 100–113. [Google Scholar] [CrossRef]
  79. Lindahl, B.D.; Nilsson, R.H.; Tedersoo, L.; Abarenkov, K.; Carlsen, T.; Kjøller, R.; Kõljalg, U.; Pennanen, T.; Rosendahl, S.; Stenlid, J.; et al. Fungal community analysis by high-throughput sequencing of amplified markers—a user’s guide. New Phytol. 2013, 199, 288–299. [Google Scholar] [CrossRef] [Green Version]
  80. Tedersoo, L.; Anslan, S.; Bahram, M.; Põlme, S.; Riit, T.; Liiv, I.; Kõljalg, U.; Kisand, V.; Nilsson, R.H.; Hildebrand, F.; et al. Shotgun metagenomes and multiple primer pair-barcode combinations of amplicons reveal biases in metabarcoding analyses of fungi. MycoKeys 2015, 10, 1–43. [Google Scholar] [CrossRef]
  81. Clemmensen, K.E.; Bahr, A.; Ovaskainen, O.; Dahlberg, A.; Ekblad, A.; Wallander, H.; Stenlid, J.; Finlay, R.D.; Wardle, D.A.; Lindahl, B.D. Roots and Associated Fungi Drive Long-Term Carbon Sequestration in Boreal Forest. Science 2013, 339, 1615–1618. [Google Scholar] [CrossRef]
  82. Talbot, J.M.; Martin, F.; Kohler, A.; Henrissat, B.; Peay, K.G. Functional guild classification predicts the enzymatic role of fungi in litter and soil biogeochemistry. Soil Biol. Biochem. 2015, 88, 441–456. [Google Scholar] [CrossRef] [Green Version]
  83. Peay, K.G.; Baraloto, C.; Fine, P.V.A. Strong coupling of plant and fungal community structure across western Amazonian rainforests. ISME J. 2013, 7, 1852–1861. [Google Scholar] [CrossRef]
  84. Baptista, P.; Reis, F.; Pereira, E.; Tavares, R.M.; Santos, P.M.; Richard, F.; Selosse, M.A.; Lino-Neto, T. Soil DNA pyrosequencing and fruitbody surveys reveal contrasting diversity for various fungal ecological guilds in chestnut orchards. Environ. Microbiol. Rep. 2015, 7, 946–954. [Google Scholar] [CrossRef] [Green Version]
  85. Jumpponen, A.; Brown, S.; Trappe, J.; Cázares, E.; Strömmer, R. Analyses of Sporocarps, Morphotyped Ectomycorrhizae, Environmental ITS and LSU Sequences Identify Common Genera that Occur at a Periglacial Site. J. Fungi 2015, 1, 76–93. [Google Scholar] [CrossRef] [PubMed]
  86. Ramette, A. Multivariate analyses in microbial ecology. FEMS Microbiol. Ecol. 2007, 62, 142–160. [Google Scholar] [CrossRef] [Green Version]
  87. Lauber, C.L.; Strickland, M.S.; Bradford, M.A.; Fierer, N. The influence of soil properties on the structure of bacterial and fungal communities across land-use types. Soil Biol. Biochem. 2008, 40, 2407–2415. [Google Scholar] [CrossRef]
  88. Goldmann, K.; Schröter, K.; Pena, R.; Schöning, I.; Schrumpf, M.; Buscot, F.; Polle, A.; Wubet, T. Divergent habitat filtering of root and soil fungal communities in temperate beech forests. Sci. Rep. 2016, 6, 31439. [Google Scholar] [CrossRef]
  89. Powell, J.R.; Karunaratne, S.; Campbell, C.D.; Yao, H.; Robinson, L.; Singh, B.K. Deterministic processes vary during community assembly for ecologically dissimilar taxa. Nat. Commun. 2015, 6, 8444. [Google Scholar] [CrossRef] [Green Version]
  90. Bauman, D.; Raspé, O.; Meerts, P.; Degreef, J.; Muledi, J.I.; Drouet, T. Multiscale assemblage of an ectomycorrhizal fungal community: The influence of host functional traits and soil properties in a 10-ha miombo forest. FEMS Microbiol. Ecol. 2016, 92, 1–14. [Google Scholar] [CrossRef] [Green Version]
  91. Parladé, J.; Martínez-Peña, F.; Pera, J. Effects of forest management and climatic variables on the mycelium dynamics and sporocarp production of the ectomycorrhizal fungus Boletus edulis. For. Ecol. Manag. 2017, 390, 73–79. [Google Scholar] [CrossRef]
  92. Kohout, P.; Charvátová, M.; Štursová, M.; Mašínová, T.; Tomšovský, M.; Baldrian, P. Clearcutting alters decomposition processes and initiates complex restructuring of fungal communities in soil and tree roots. ISME J. 2018, 12, 692–703. [Google Scholar] [CrossRef]
  93. Hartmann, M.; Howes, C.G.; VanInsberghe, D.; Yu, H.; Bachar, D.; Christen, R.; Henrik Nilsson, R.; Hallam, S.J.; Mohn, W.W. Significant and persistent impact of timber harvesting on soil microbial communities in Northern coniferous forests. ISME J. 2012, 6, 2199–2218. [Google Scholar] [CrossRef] [Green Version]
  94. Varenius, K.; Kårén, O.; Lindahl, B.; Dahlberg, A. Long-term effects of tree harvesting on ectomycorrhizal fungal communities in boreal Scots pine forests. For. Ecol. Manag. 2016, 380, 41–49. [Google Scholar] [CrossRef]
  95. Kyaschenko, J.; Clemmensen, K.E.; Karltun, E.; Lindahl, B.D. Below-ground organic matter accumulation along a boreal forest fertility gradient relates to guild interaction within fungal communities. Ecol. Lett. 2017, 20, 1546–1555. [Google Scholar] [CrossRef]
  96. Baldrian, P.; Merhautová, V.; Cajthaml, T.; Petránková, M.; Šnajdr, J. Small-scale distribution of extracellular enzymes, fungal, and bacterial biomass in Quercus petraea forest topsoil. Biol. Fertil. Soils 2010, 46, 717–726. [Google Scholar] [CrossRef]
  97. Rosling, A.; Timling, I.; Taylor, D.L. Archaeorhizomycetes: Patterns of Distribution and Abundance in Soil. In Genomics of Soil- and Plant-Associated Fungi. Soil Biology; Horwitz, B., Mukherjee, P., Mukherjee, M., Kubicek, C., Eds.; Springer: Berlin/Heidelberg, Germany, 2013; Volume 36, pp. 333–349. [Google Scholar]
  98. Rosling, A.; Cox, F.; Cruz-Martinez, K.; Ihrmark, K.; Grelet, G.A.; Lindahl, B.D.; Menkis, A.; James, T.Y. Archaeorhizomycetes: Unearthing an ancient class of ubiquitous soil fungi. Science 2011, 333, 876–879. [Google Scholar] [CrossRef]
  99. Menkis, A.; Urbina, H.; James, T.Y.; Rosling, A. Archaeorhizomyces borealis sp. nov. and a sequence-based classification of related soil fungal species. Fungal Biol. 2014, 118, 943–955. [Google Scholar] [CrossRef]
  100. Pinto-Figueroa, E.A.; Seddon, E.; Yashiro, E.; Buri, A.; Niculita-Hirzel, H.; van der Meer, J.R.; Guisan, A. Archaeorhizomycetes Spatial Distribution in Soils Along Wide Elevational and Environmental Gradients Reveal Co-abundance Patterns With Other Fungal Saprobes and Potential Weathering Capacities. Front. Microbiol. 2019, 10, 656. [Google Scholar] [CrossRef]
  101. Bahnmann, B.; Mašínová, T.; Halvorsen, R.; Davey, M.L.; Sedlák, P.; Tomšovský, M.; Baldrian, P. Effects of oak, beech and spruce on the distribution and community structure of fungi in litter and soils across a temperate forest. Soil Biol. Biochem. 2018, 119, 162–173. [Google Scholar] [CrossRef]
  102. Schröter, K.; Wemheuer, B.; Pena, R.; Schöning, I.; Ehbrecht, M.; Schall, P.; Ammer, C.; Daniel, R.; Polle, A. Assembly processes of trophic guilds in the root mycobiome of temperate forests. Mol. Ecol. 2019, 28, 348–364. [Google Scholar] [CrossRef]
  103. Jonsson, U.; Jung, T.; Sonesson, K.; Rosengren, U. Relationships between health of Quercus robur, occurrence of Phytophthora species and site conditions in southern Sweden. Plant. Pathol. 2005, 54, 502–511. [Google Scholar] [CrossRef]
  104. Anderson, I.C.; Campbell, C.D.; Prosser, J.I. Diversity of fungi in organic soils under a moorland—Scots pine (Pinus sylvestris L.) gradient. Environ. Microbiol. 2003, 5, 1121–1132. [Google Scholar] [CrossRef]
  105. Chavarriaga, D.; Bodles, W.J.A.; Leifert, C.; Belbahri, L.; Woodward, S. Phytophthora cinnamomi and other fine root pathogens in north temperate pine forests. FEMS Microbiol. Lett. 2007, 276, 67–74. [Google Scholar] [CrossRef] [Green Version]
  106. Stirling, G.R. Biological Control. of Plant.-Parasitic Nematodes: Soil Ecosystem Management in Sustainable Agriculture; Stirling, G.R., Ed.; CABI: Wallingford, UK, 2014; ISBN 9781780644158. [Google Scholar]
  107. Brabcová, V.; Nováková, M.; Davidová, A.; Baldrian, P. Dead fungal mycelium in forest soil represents a decomposition hotspot and a habitat for a specific microbial community. New Phytol. 2016, 210, 1369–1381. [Google Scholar] [CrossRef] [PubMed] [Green Version]
  108. Kivlin, S.N.; Hawkes, C.V.; Treseder, K.K. Global diversity and distribution of arbuscular mycorrhizal fungi. Soil Biol. Biochem. 2011, 43, 2294–2303. [Google Scholar] [CrossRef] [Green Version]
  109. Lilleskov, E.A.; Fahey, T.J.; Horton, T.R.; Lovett, G.M. Belowground ectomycorrhizal fungal community change over a nitrogen deposition gradient in Alaska. Ecology 2002, 83, 104–115. [Google Scholar] [CrossRef]
  110. Johnson, N.C.; Wilson, G.W.T.; Bowker, M. ssA.; Wilson, J.A.; Miller, R.M. Resource limitation is a driver of local adaptation in mycorrhizal symbioses. Proc. Natl. Acad. Sci. USA 2010, 107, 2093–2098. [Google Scholar] [CrossRef] [Green Version]
  111. Hawkes, C.V.; Kivlin, S.N.; Rocca, J.D.; Huguet, V.; Thomsen, M.A.; Suttle, K.B. Fungal community responses to precipitation. Glob. Chang. Biol. 2011, 17, 1637–1645. [Google Scholar] [CrossRef]
  112. Zhang, T.; Wang, N.-F.; Liu, H.-Y.; Zhang, Y.-Q.; Yu, L.-Y. Soil pH is a Key Determinant of Soil Fungal Community Composition in the Ny-Ålesund Region, Svalbard (High Arctic). Front. Microbiol. 2016, 7, 227. [Google Scholar] [CrossRef]
  113. Lilleskov, E.A.; Hobbie, E.A.; Horton, T.R. Conservation of ectomycorrhizal fungi: Exploring the linkages between functional and taxonomic responses to anthropogenic N deposition. Fungal Ecol. 2011, 4, 174–183. [Google Scholar] [CrossRef]
  114. Kjøller, R.; Nilsson, L.-O.; Hansen, K.; Schmidt, I.K.; Vesterdal, L.; Gundersen, P. Dramatic changes in ectomycorrhizal community composition, root tip abundance and mycelial production along a stand-scale nitrogen deposition gradient. New Phytol. 2012, 194, 278–286. [Google Scholar] [CrossRef]
  115. Choma, M.; Rappe-George, M.O.; Bárta, J.; Čapek, P.; Kaštovská, E.; Gärdenäs, A.I.; Šantrůčková, H. Recovery of the ectomycorrhizal community after termination of long-term nitrogen fertilisation of a boreal Norway spruce forest. Fungal Ecol. 2017, 29, 116–122. [Google Scholar] [CrossRef]
  116. Morrison, E.W.; Frey, S.D.; Sadowsky, J.J.; van Diepen, L.T.A.; Thomas, W.K.; Pringle, A. Chronic nitrogen additions fundamentally restructure the soil fungal community in a temperate forest. Fungal Ecol. 2016, 23, 48–57. [Google Scholar] [CrossRef]
  117. Tahovská, K.; Choma, M.; Kaštovská, E.; Oulehle, F.; Bárta, J.; Šantrůčková, H.; Moldan, F. Positive response of soil microbes to long-term nitrogen input in spruce forest: Results from Gårdsjön whole-catchment N-addition experiment. Soil Biol. Biochem. 2020, 143, 107732. [Google Scholar] [CrossRef]
  118. Walker, J.K.M.; Ward, V.; Paterson, C.; Jones, M.D. Coarse woody debris retention in subalpine clearcuts affects ectomycorrhizal root tip community structure within fifteen years of harvest. Appl. Soil Ecol. 2012, 60, 5–15. [Google Scholar] [CrossRef]
  119. Tedersoo, L.; Nilsson, R.H.; Abarenkov, K.; Jairus, T.; Sadam, A.; Saar, I.; Bahram, M.; Bechem, E.; Chuyong, G.; Kõljalg, U. 454 Pyrosequencing and Sanger sequencing of tropical mycorrhizal fungi provide similar results but reveal substantial methodological biases. New Phytol. 2010, 188, 291–301. [Google Scholar] [CrossRef]
  120. Geml, J.; Gravendeel, B.; van der Gaag, K.J.; Neilen, M.; Lammers, Y.; Raes, N.; Semenova, T.A.; de Knijff, P.; Noordeloos, M.E. The Contribution of DNA Metabarcoding to Fungal Conservation: Diversity Assessment, Habitat Partitioning and Mapping Red-Listed Fungi in Protected Coastal Salix repens Communities in the Netherlands. PLoS ONE 2014, 9, e99852. [Google Scholar] [CrossRef]
  121. Geml, J.; Timling, I.; Robinson, C.H.; Lennon, N.; Nusbaum, H.C.; Brochmann, C.; Noordeloos, M.E.; Taylor, D.L. An arctic community of symbiotic fungi assembled by long-distance dispersers: Phylogenetic diversity of ectomycorrhizal basidiomycetes in Svalbard based on soil and sporocarp DNA. J. Biogeogr. 2012, 39, 74–88. [Google Scholar] [CrossRef]
  122. Geml, J.; Pastor, N.; Fernandez, L.; Pacheco, S.; Semenova, T.A.; Becerra, A.G.; Wicaksono, C.Y.; Nouhra, E.R. Large-scale fungal diversity assessment in the Andean Yungas forests reveals strong community turnover among forest types along an altitudinal gradient. Mol. Ecol. 2014, 23, 2452–2472. [Google Scholar] [CrossRef]
  123. Horton, T.R.; Bruns, T.D. The molecular revolution in ectomycorrhizal ecology: Peeking into the black-box. Mol. Ecol. 2001, 10, 1855–1871. [Google Scholar] [CrossRef] [PubMed] [Green Version]
  124. Ovaskainen, O.; Schigel, D.; Ali-Kovero, H.; Auvinen, P.; Paulin, L.; Nordén, B.; Nordén, J. Combining high-throughput sequencing with fruit body surveys reveals contrasting life-history strategies in fungi. ISME J. 2013, 7, 1696–1709. [Google Scholar] [CrossRef]
Figure 1. Venn diagrams comparing the number of soil fungal operational taxonomic units (OTUs) in managed forests (M) and forest reserves (R): all fungi (a), ectomycorrhizal fungi (b), saprotrophic fungi (c), pathotrophic fungi (d), other symbiotrophic fungi (e), other fungi (f). Values in parentheses besides M and R indicate the total OTUs number.
Forests 12 00353 g001
Figure 2. Mean OTUs richness of soil fungi per plot, grouped according to all fungi and different trophic groups; (there is no statistically significant difference between managed forests (M) and forest reserves (R) within trophic groups as determined by one-way analysis of variance (ANOVA)).
Forests 12 00353 g002
Figure 3. The relative abundance of soil fungi from different trophic groups found in managed forests (outer donut chart) and forest reserves (inner donut chart), based on the number of sequence reads of the operational taxonomic units (OTUs).
Forests 12 00353 g003
Figure 4. The relative abundance of ectomycorrhizal fungi (a) and saprotrophic fungi (b) assigned to orders, found in managed forests (outer donut chart) and forest reserves (inner donut chart) based on the number of sequence reads of the operational taxonomic units (OTUs).
Forests 12 00353 g004
Figure 5. Nonmetric multidimensional scaling (NMDS) plot and results of two-way ANOSIM, based on Jaccard similarity index of soil fungi determined by OTUs composition in managed forests (M, yellow symbols) and forest reserves (R, green symbols) and located at three study sites (P—Przytok, K—Kalisz, L—Łochów). (a)—all fungi, (b)—ectomycorrhizal fungi, (c)—saprotrophic fungi.
Forests 12 00353 g005
Figure 6. Ordination diagram from redundancy analysis (RDA) of all fungi (a), ectomycorrhizal fungi (b) and saprotrophic fungi (c). Only environmental variables with significant effect are shown. Abbreviations: DBH_above_10 cm–number of trees with a diameter at breast height > 10 cm; VFWD—Very Fine Woody Debris (Ø≤5cm); CWD—Coarse Woody Debris (Ø >10 cm).
Forests 12 00353 g006
Table 1. Correlations between soil fungal operational taxonomic units (OTUs) richness and Shannon diversity index (for all fungi, ectomycorrhizal fungi and saprotrophic fungi) and environmental variables (data presented only for variables for which significant correlations were found).
Environmental VariablesAll FungiEctomycorrhizal FungiSaprotrophic Fungi
RpRpRp
OTU richnessTree coverNo. of tree species0.410.0480.510.0120.400.054
No. of ECM tree species0.430.0360.490.0160.420.041
No. of trees DBH < 10 cm *0.450.0260.470.0220.380.064
No. of trees DBH > 10 cm *0.250.2480.370.0760.070.745
TBA of Norway spruce (m2/400 m2)−0.450.026−0.490.0140.330.112
TBA of Scots pine (m2/400 m2)0.320.1300.210.3310.250.237
Forest floorOrganic layer thickness (cm) *0.460.0250.280.1930.480.018
Shannon IndexTree coverNo. of ECM tree species−0.140.5220.070.7470.210.330
TBA of Norway spruce (m2/400 m2)0.510.0120.170.430−0.100.644
Total tree basal area (m2/400 m2)0.260.2180.200.3540.330.111
Forest floorOrganic layer thickness (cm) *0.110.6230.130.5570.300.157
Volume of CWD (m3/400 m2)0.420.0420.290.1660.240.261
SoilTotal soil C content (%)0.590.0020.570.0040.210.317
Soil organic C content(%)0.590.0020.570.0040.210.317
Total soil N content (%)0.640.0010.600.0020.310.135
Soil NO3 content (mg/kg)0.520.0090.350.0970.310.140
Soil NH4 content (mg/kg)0.550.0050.330.1130.150.486
* Mean for 4 plots from individual stand. The values in bold indicate statistically significant correlations (p < 0.05). Abbreviations: ECM – ectomycorrhizal; DBH – Diameter at Breast Height; TBA – Tree Basal Area; CWD – Coarse Woody Debris (Ø >10cm).
Table 2. Effect of significant environmental variables on fungal OTU composition; results of RDA analyses.
Trophic GroupSignificant Environmental VariablesdfAICFPr(>F)VIF
All fungi N-NO3 (mg/kg)1−20.6103.37250.0017.608
Volume of VFWD (m3/400 m2)1−21.3042.49450.0017.317
No. of trees DBH > 10 cm1−21.8632.25000.0029.910
pH H201−21.9361.71410.0302.524
Ectomycorrhizal fungiVolume of CWD (m3/400 m2)1−14.0273.02910.0019.496
pH H201−14.2792.06610.0182.319
Volume of VFWD (m3/400 m2)1−14.4411.88590.0237.792
Saprotrophic fungiVolume of CWD (m3/400 m2)1−39.0145.59710.0019.216
N-NO3 (mg/kg)1−39.3222.12020.0267.633
Abbreviations: df—degrees of freedom. AIC—Akaike information criterion. F—empirical test statistic. Pr(>|F|)—p-value based on comparison of empiric and tabular F. VIF—Variance inflation factor.
Table 3. Soil fungal OTUs of conservation value found in managed forests (M) and forest reserves (R).
SpeciesRed-List Category *Trophic GroupFrequency
(No of Plots)
MR
Tylospora fibrillosaEECM37
Hydnellum concrescensEECM21
Asterodon ferruginosusESaprotroph13
Boidinia furfuraceaESaprotroph24
Hygrocybe intermediaESaprotroph48
Lepiota grangeiESaprotroph99
Cortinarius malachiusRECM13
Cortinarius biformisRECM46
Russula caeruleaRECM01
Entoloma rhodocylixRSaprotroph79
Postia ptychogasterRSaprotroph31
Serpula himantioidesRSaprotroph23
Botryobasidium obtusisporumRSaprotroph22
Chlorencoelia versiformisRSaprotroph43
Galerina sphagnorumRSaprotroph67
Hygrocybe coccineaRSaprotroph21
Hygrocybe quietaRSaprotroph23
Entoloma juncinumRSaprotroph20
* E—endangered, R—rare.
Publisher’s Note: MDPI stays neutral with regard to jurisdictional claims in published maps and institutional affiliations.

