Article

Soil Cover Improves Soil Quality in a Young Walnut Forest in the Sichuan Basin, China

1
National Forestry and Grassland Administration Key Laboratory of Forest Resources Conservation and Ecological Safety on the Upper Reaches of the Yangtze River, College of Forestry, Sichuan Agricultural University, Chengdu 611130, China
2
Sichuan Province Key Laboratory of Ecological Forestry Engineering on the Upper Reaches of the Yangtze River, College of Forestry, Sichuan Agricultural University, Chengdu 611130, China
3
CSIC, Global Ecology Unit CREAF-CSIC-UAB, Edifici C, Universitat Autònoma de Barcelona, Bellaterra, 08193 Barcelona, Spain
4
CREAF, Cerdanyola del Vallès, 08193 Barcelona, Spain
5
Forest Research Institution of Zhaoqing, Zhaoqing 526020, China
6
Natural Resources and Planning Bureau of Yanjiang District, Ziyang 641300, China
*
Author to whom correspondence should be addressed.
Forests 2021, 12(2), 236; https://doi.org/10.3390/f12020236
Submission received: 25 January 2021 / Revised: 14 February 2021 / Accepted: 15 February 2021 / Published: 18 February 2021

Abstract

:
The soil quality index (SQI) is based on several key indicators and is used to assess soil quality. More than 250,000 ha of walnut saplings (Juglans regia L.) were planted in previous cropland areas in the Sichuan Basin, China, using a range of soil cover types that may affect soil quality with effects that are unclear. We investigated the effects of white film (WF), black film (BF), shade netting (SN), and maize straw (MS) soil cover types and an uncovered control type (CK) on soil chemical and biological indicators and the SQI in the 0–15 cm soil layer in a young walnut forest in the Sichuan Basin over a 27-month study period. The results showed that all soil cover types increased the soil organic matter (SOM), total potassium (TK), and available potassium (AK) concentrations (p < 0.05), whereas the total nitrogen (TN) and available nitrogen (AN) concentrations were greater only in soils covered by MS than in CK (p < 0.05). The available phosphorus concentrations were 64.1 and 193.2% greater in soils covered by BF and MS treatments, respectively, than in the CK (p < 0.05). The numbers of soil faunal groups (N) were 45.7, 36.4, 37.2, and 101.5% higher in WF, BF, SN, and MS, respectively, than in CK (p < 0.05); the individual numbers (S) were 92.3, 36.2, 100.8, and 154.5% greater in WF, BF, SN, and MS, respectively, than in CK (p < 0.05). The microbial biomass carbon (MBC) was 15.5, 32.3, 45.0, and 77.1% greater in WF, BF, SN, and MS than in CK, respectively (p < 0.05). Redundancy discriminant analysis revealed strong positive interactions between biological indicators (MBC, N, and S) and SOM, AN, and AK concentrations. SOM, TN, AK, S, and MBC were the minimum required variables for the effective assessment of the SQI. All four soil cover types led to an improved SQI (p < 0.05), and MS had the greatest effect on SOM, TN, AN, AP, N, S, MBC, and SQI (p < 0.05). In conclusion, all four soil cover types increased the SOM levels, TK, AK, and MBC concentrations, soil faunal diversity, and SQI. The MS treatment was the most cost-effective and efficient measure to improve soil fertility, ecological function, and overall soil quality in the studied walnut forest.

1. Introduction

Soil quality, also known as soil health, is defined as the functional capacity of soil within an ecosystem or land-use boundary to sustain biological productivity, maintain environmental quality, and promote plant and animal health [1,2]. The soil quality index (SQI), which is based on a number of indicators of soil productivity and soil ecosystem function [3,4,5], is a composite descriptor of soil quality. The estimation of a single SQI is complex due to variations in the properties of the solid, liquid, and gaseous soil phases, thus the accuracies of contrasting soil quality evaluation methods have been compared [1,6,7]. The most effective approach is the multiparameter SQI using the static and dynamic properties of soil [4,6,8,9]. Globally, the soil organic matter (SOM), nitrogen (N), phosphorus (P), potassium (K), and soil pH were commonly used variables that largely reflect static soil properties [1,2]. Additionally, as dynamic soil properties, soil fauna and microorganisms are sensitive to changes in management and play central roles in soil function [10,11]. Therefore, soil nutrient, soil microorganisms, and soil fauna (such as nematodes and arthropods) are important in the assessment of SQIs [2,10]. However, the specific variables in the multiparameter SQI models differ with the study site [3,4,5,6,12,13], increasing the complexity of soil quality evaluation.
The global production of walnut (Juglans regia L.) ranks second among tree nut and fruit crops [14,15], and the fruit has high nutritional and economic value [16]. Walnut has become an important tree for the conversion of cropland to forest in the Sichuan Basin, which is characterized by hilly terrain [17], due to the optimal soil, temperature, light, and topographical conditions [16]. More than 250,000 ha of walnut forests have been planted in this region, much of which is on land previously managed for agriculture [16]. Traditionally, vegetation is removed prior to planting walnut trees, increasing the risks of soil erosion and soil nutrient leaching [18,19] and the likelihood of reduced soil quality in young walnut forests. In the last few years, the soil surface covered with white film, black film, shade netting, and maize straw have been widely used in newly planted walnut forests in the Sichuan Basin, which may have affected soil fertility, ecological function and overall soil quality [20,21]. However, the specific effects of soil cover on soil quality in these young walnut forests are not studied before and are still unclear.
In this study, we carried out a 27-month experiment in the region to examine the effects of soil cover on soil nutrient concentrations, microbial biomass carbon (MBC), the numbers of soil fauna groups (N) and individuals (S), and the SQI in the 0–15 cm soil layer. Most previous studies show that the maintenance of soil cover in forests can preserve soil moisture [5,22,23], increase soil nutrient concentrations [8], and improve soil biodiversity [24,25,26]. Thus, we hypothesized that (1) soil cover would increase soil fertility, soil faunal diversity, MBC, and the SQI in the studied young walnut forest. In addition, the responses of soil quality to soil cover usually vary with the types of cover [5,20], thus we also hypothesized that (2) different soil cover types would have different effects on soil fertility, soil faunal diversity, MBC, and the SQI in this forest. The objectives of this study are to improve the understanding of the effects of particular soil cover amendments on the soil quality of the young walnut forests of the Sichuan Basin to provide a reference for the management of walnut forests.

2. Materials and Methods
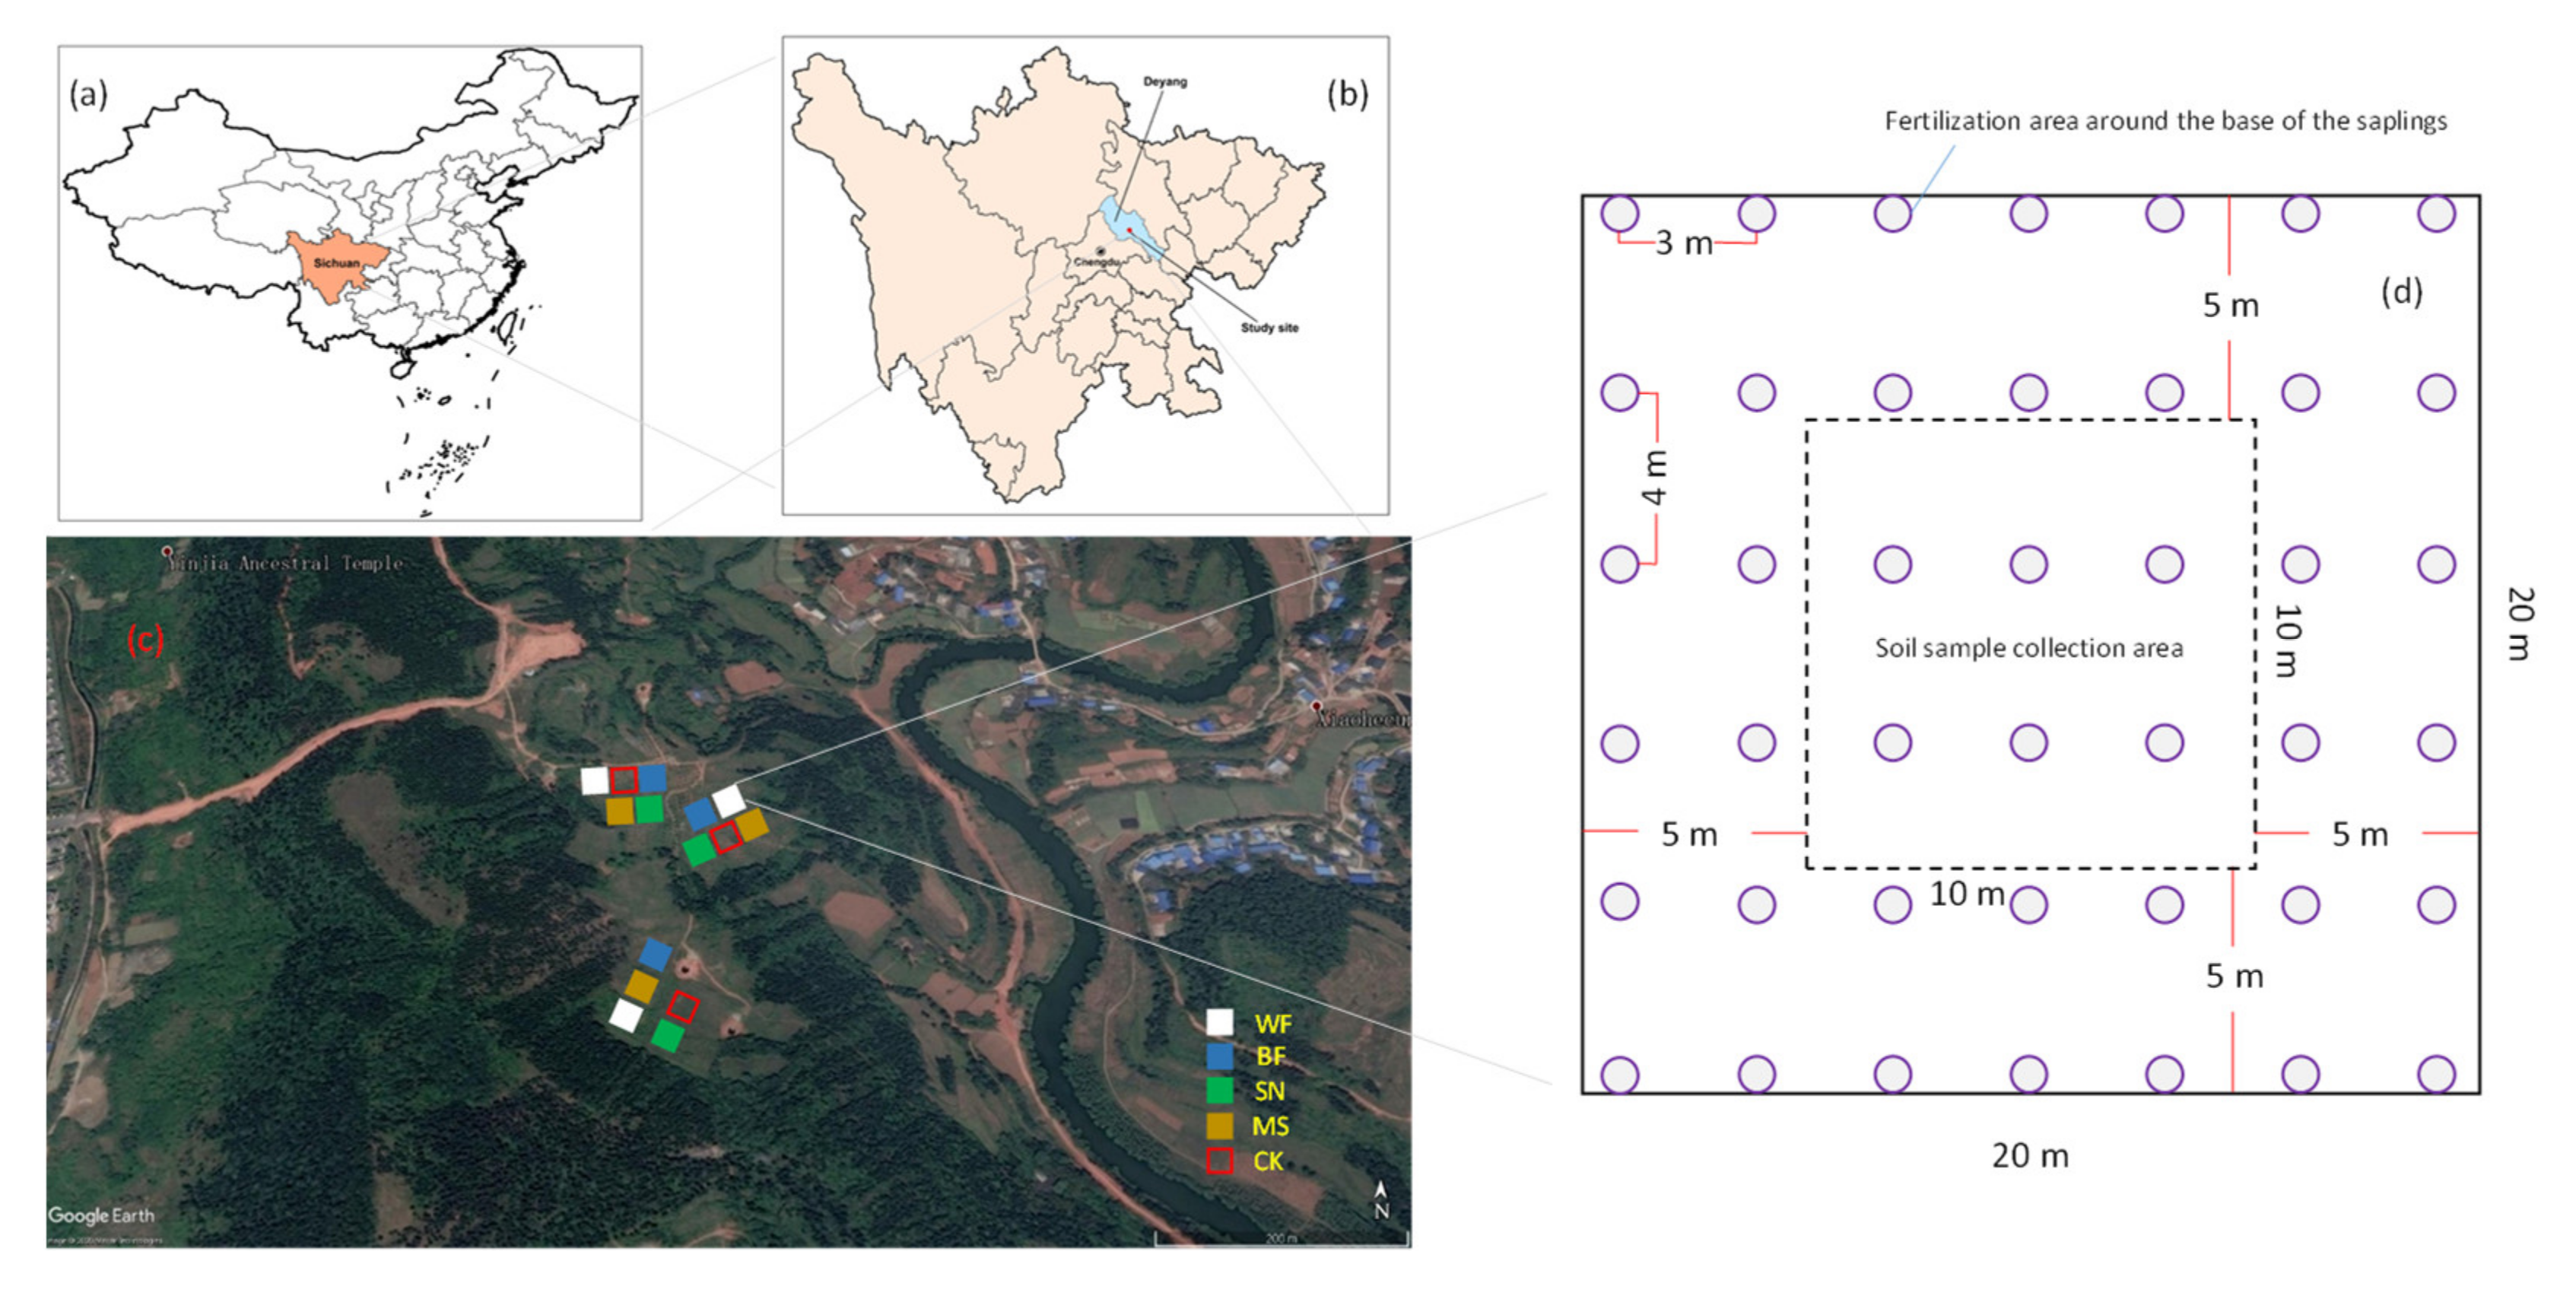
2.1. Study Site

The study site was located in the Sichuan Basin ecological zone, which covers an area of approximately 84,000 km2 in Southwest China, and where the altitude ranges from 250 to 600 m a.s.l. The mean annual temperature and rainfall are approximately 17.2 °C and 900 mm, respectively. The field experiment was located at the National Science and Technology Support Program site (31°4′31”N, 104°25′29”E; 400 m a.s.l.) at Deyang City, in the west of the Sichuan Basin (Figure 1a,b), which has a subtropical monsoon climate with distinct cool dry (December-February and March-May) and warm rainy (June-August and September-November) seasons. The annual occurrence of drought conditions in early spring since 1980 has been >60%. Over the 27 month experimental period, the average annual rainfall was 891 mm, with >90% occurring between May and October and <50 mm falling between November and April (Supplementary Material Figure S1). The average annual temperature of the surface soil layer (0–5 cm) was 17.9 °C, with the lowest and highest temperatures recorded in January (6.08 ± 1.06 °C) and August (29.4 ± 2.2 °C), respectively.
Prior to planting walnut saplings for the experiment, the study site was cultivated for agriculture for approximately 30 years. The purple soils at the study site are classified as Pup-Orthic Entisol (according to the Chinese Soil Taxonomy) or Red Entisol (according to the USDA Soil Taxonomy) [17], with an average depth to bedrock of approximately 80 cm. The upper soil layer contained (means ± SD) 15.2 ± 0.8 g kg−1 of C, 1.28 ± 0.06 g kg−1 of N, and 0.419 ± 0.056 g kg−1 of P, with a pH of 8.1 ± 0.05 (H2O extraction) and a soil bulk density of 1.73 ± 0.35 g−1 cm−3 at the beginning of this experiment.

2.2. Experimental Design

2.2.1. Walnut Planting and Management

In June 2012, walnut saplings were planted at spacing of 3 × 4 m2 in 40 × 40 × 40 cm3 holes atop 5 kg of air-dried cow dung (149 ± 4.2 g kg−1 organic matter) and 2 kg of chemical fertilizer (N, P, and K 40% w/w) that had been placed at the base of each hole. The planting holes were filled with weed-free, friable soil. From 2013 to 2015, 2 kg of air-dried cow dung (149 ± 4.2 g kg−1 organic matter) and 0.5 kg of chemical fertilizer (N, P, and K 40% w/w) were applied in March, and 0.5 kg of chemical fertilizer (N, P, and K 40% w/w) was applied in September to the 0–10 cm soil layer in a 80 cm diameter area around the base of the saplings.

2.2.2. Plot Design

At the end of March 2013, fifteen plots (20 × 20 m2) were established in the study forest (Figure 1c). We removed weeds from the plots and applied four soil cover types (white film: WF; black film: BF; shade netting: SN; and sundried maize straw: MS) to the soil surface and an uncovered control (CK), with three replicated plots of each treatment and control arranged as randomized blocks to reduce errors caused by slope, topography, and nutrient heterogeneity (Figure 1c,d). The mean basal diameter, height, and crown width of the walnut saplings at the beginning of the experiment were 28.2 mm, 149.9 cm, and 1.2 × 1.1 m2, respectively. The white and black films comprised 0.01 mm thick biodegradable polyethylene; white film shading rate was approximately 15%; black film shading rate was approximately 95%; shade netting was black with a shading rate of approximately 80%; and maize straw (5 t ha−1 with 182 ± 7.2 g kg−1 of organic matter) was applied in a thickness of 2–4 cm. To avoid herbicidal effects, weeds were removed four times per year throughout the duration of the experiment (27 months) using hoes. The white and black films were replaced with new ones in December 2013 and October 2014, whereas the original shade netting and maize straw remained in situ for the duration of the experiment. The economic costs of the WF, BF, SN, and MS treatments were approximately 360, 360, 320, and 200 USD ha−1 year−1, respectively.

2.3. Soil Sampling and Analysis

Soil samples were collected in June, September, and December 2013; March, June, September, and December 2014; and March and June 2015. The samples were collected from the central 10 × 10 m2 area of the plots to reduce the impact of field management activities (Figure 1d).

2.3.1. Soil Chemical Indicators and MBC

Before soil sampling, moss and leaf litter were removed from the soil surface. Five samples of the 0–15 cm soil layer were collected at random from each plot (avoiding the fertilized area around the base of the saplings) using a 5-cm diameter soil auger [27,28] and then mixed to form a single composite sample. In the laboratory, roots, gravel, and impurities were removed from the soil using forceps before the samples were homogenized and divided into two subsamples. One subsample was passed through a 2-mm sieve and stored at 4 °C prior to measuring the MBC contents within one week, while the second subsample was air-dried and passed through 2- and 0.149-mm sieves prior to measuring the SOM, total nitrogen (TN), total phosphorus (TP), total potassium (TK), available nitrogen (AN), available phosphorus (AP), and available potassium (AK) contents and pH.
The SOM content was determined using the dichromate oxidation-ferrous sulfate titration method [28], and TN and AN contents were determined using the Kjeldahl method [27] and the alkaline hydrolysis–diffusion method [27,28], respectively. The TP and AP contents were determined using the molybdenum colorimetric method [27], where samples for TP determination were heated with NaOH at 750 °C for 15 min and samples for AP determination were extracted with double acid (0.05 mol L−1 hydrochloric acid and 0.025 mol L−1 sulfuric acid) for 5 min. The TP and AP contents were determined at 700 nm using a spectrophotometer (Hitachi U-1800, Tokyo, Japan). The TK and AK contents were determined using the flame photometry method [27], where samples for TK determination were heated with NaOH at 750 °C for 15 min and samples for AK determination were extracted using acetic acid (1.0 mol L−1) for 30 min. The TK and AK contents were determined using an atomic absorption spectrophotometer (Analytik Jena AG AAS nov AA 400, Jena, Germany). We determined soil pH using H2O extraction, where CO2 was removed by boiling [28]. The MBC was determined using the chloroform fumigation method [29], where samples were extracted in K2SO4 (0.5 mol L−1); the MBC content was determined using an automatic total organic C analyzer (Elementar Vario TOC, Langenselbold, Germany).

2.3.2. Soil Fauna

Soil was sampled at three depths (0–5, 5–10, and 10–15 cm) from six randomly selected points in each plot using a 5-cm diameter soil auger fitted with a 15-cm long plastic tube insert [28]. Soil cores were cut into equal 5-cm lengths using a knife and were individually placed into black nylon bags. Three samples per plot were randomly selected for nematode or arthropod extraction using wet (Baermann) and dry (Tullgren) funnel methods, respectively [28]. Soil samples were cut to a thickness of approximately 3 cm and the water content was maintained at 80% prior to extraction using 60-W electric lamps to accelerate the process. The numbers of soil faunal groups (N, identified minimum unit) and individuals (S) were recorded every 4 h until no further individuals had been extracted within the previous 8 h period. Nematodes were identified in classes, and arthropods were identified in families (Table S1), according to previous studies [30].

2.4. Calculation of the SQI

We used principal component analysis (PCA) to select the most appropriate variables for inclusion in the SQI [5,31,32], and positive matrix factor analysis was then used to determine the weight for each variable to be used for the SQI calculation [4,12]. We ran the initial PCA with the eight soil chemical indicators (SOM, TN, TP, TK, AN, AP, AK, and pH) and three biological indicators (N, S, and MBC), and then we selected those with the largest eigenvectors (>90% of the maximum) from each of the first three principal components (PCs) [12]. As a result, we selected three soil chemical (SOM, TN, and AK) and three biological (N, S, and MBC) indicators (Table S2). This selection criterion did not guarantee that the variables were uncorrelated. Therefore, we carried out a second PCA using only the set of variables previously selected to identify and remove those that were strongly correlated. We retained the variables with Pearson’s correlation coefficient (r) values < 0.750 as the minimum required soil variables (SOM, TN, AK, S, and MBC; Table S3) to assess the SQI [4]. We standardized these variables (Table S4) and then used positive matrix factor analysis, with the PC as the extraction method, to obtain the weights for the variables on the first two PCs. The analysis was corrected using three iterations of the Caesar maximum rotation method.
The additive index of the ith PC (PCzi) was calculated by multiplying the component weights by the standardized variables (Equation (1)), and the PCSi (SQI of the ith PC) was calculated by multiplying PCzi by the variance explained (%) by the ith PC (Equation (2)); the PCSi values were then added to calculate the SQI (Equation (3)) [4,12]:
P C z i = z = 1 5 w z i × y z
P C S i = W i × P C z i
SQI = i = 1 2 P C S i
where wzi is the component weight of the standardized variable (yz) of the ith PC from the factor analysis, z is the number of selected variables for each component, and Wi is the variance explained (%) by the ith PC. A greater SQI value indicates a higher soil quality and vice versa.

2.5. Statistical Analyses

We used linear mixed-effects models, using restricted maximum likelihood estimations, to test for the effects of soil cover type on the SOM, TN, TP, TK, AN, AP, AK, and MBC concentrations, pH, N, S, and SQI during the 27-month experimental period, where we included treatment and sampling time as fixed factors and blocks and plots nested in blocks as random factors. Then, Bonferroni adjustments were applied to the confidence intervals and significance values to account for multiple comparisons. Statistical analyses, at p < 0.05, were performed using SPSS 25.0 for Windows (SPSS Inc., Chicago, IL, USA).
We used redundancy discriminant analysis (RDA) in Canoco 5.0 (Microcomputer Power, New York, NY, USA) to analyze the relationships between soil biological indicators (MBC, N, and S) and soil chemical indicators (SOM, TN, TP, TK, AN, AP, AK, and pH).

3. Results

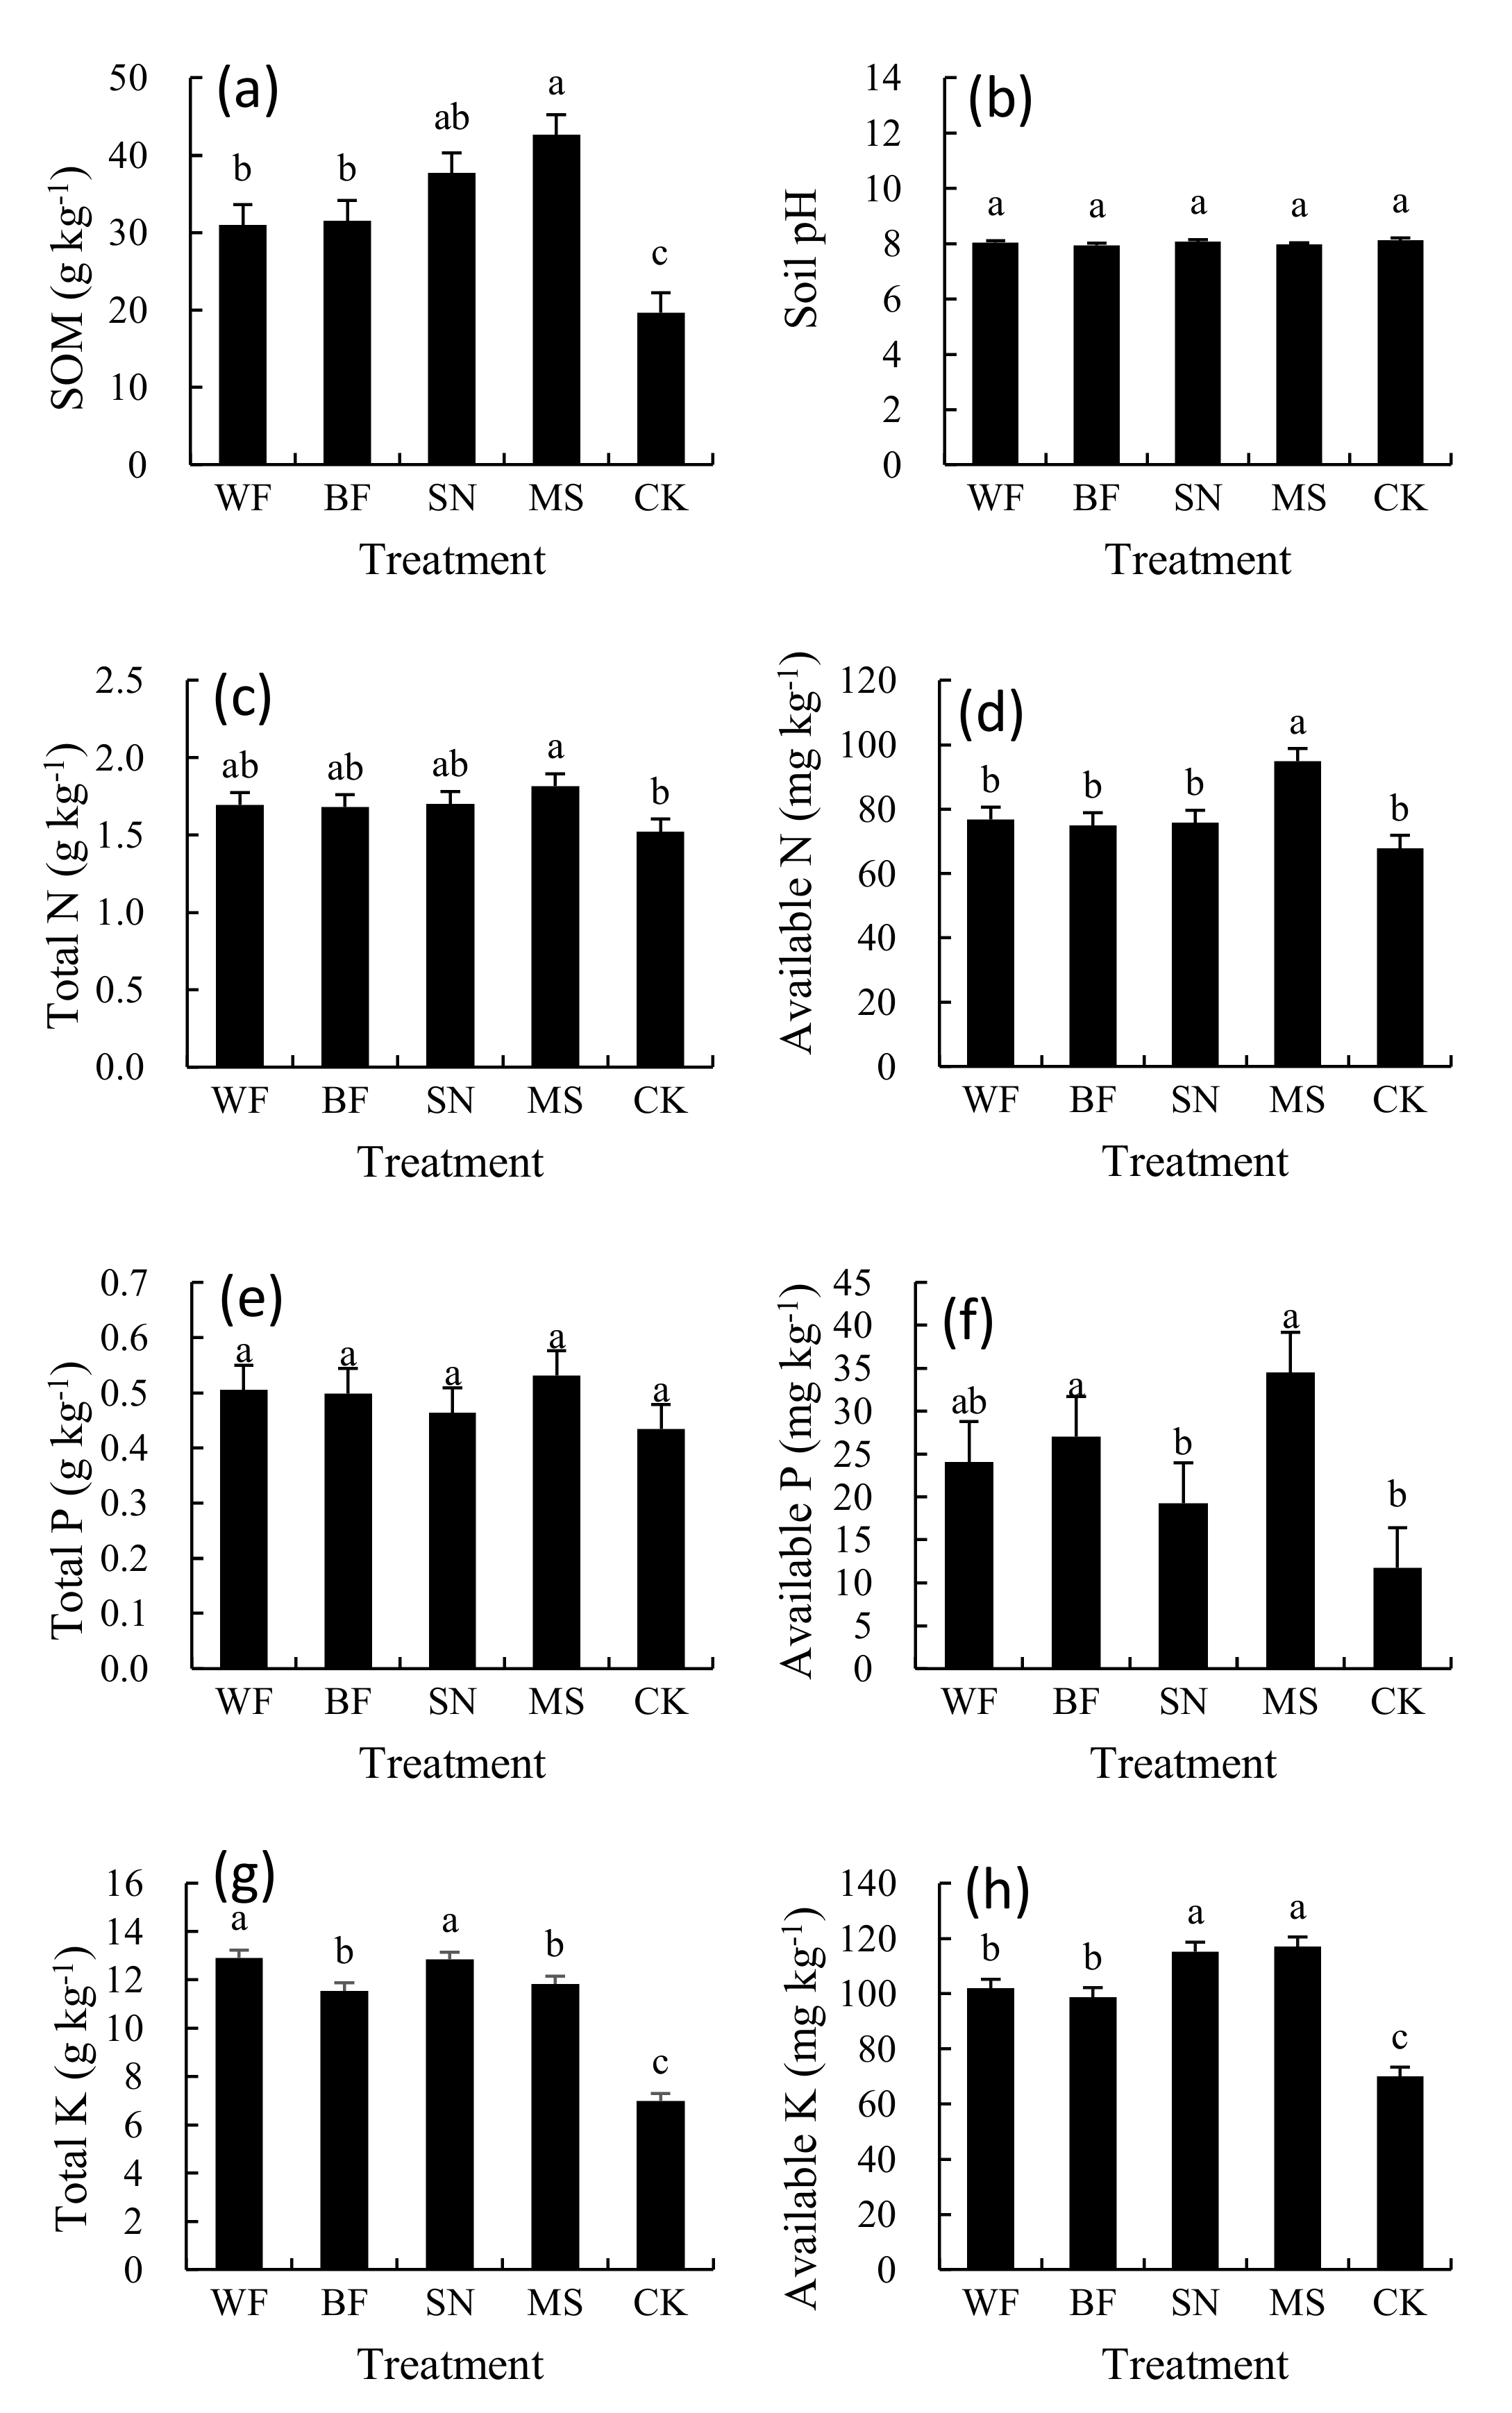
3.1. Effect of Soil Cover on Soil Chemical Indicators

The main effects of soil cover, sampling time, and their interactions on SOM, AN, AP, TK, and AK were significant (p < 0.05; Figure S2). The effects of all soil cover type on the pH and the TP concentration were not significant (p > 0.05; Figure 2b,e), but all cover types increased the SOM, TK, and AK concentrations during the study period (p < 0.05; Figure 2a,g,h). The concentrations of TN and AN were 19.3 and 39.8% greater, respectively, only with maize straw as a cover (MS) than CK (p < 0.05; Figure 2c–d). The AP concentration was 64.1 and 193.2% greater in soils covered with BF and MS, respectively, than in CK during the study period (p < 0.05; Figure 2f).

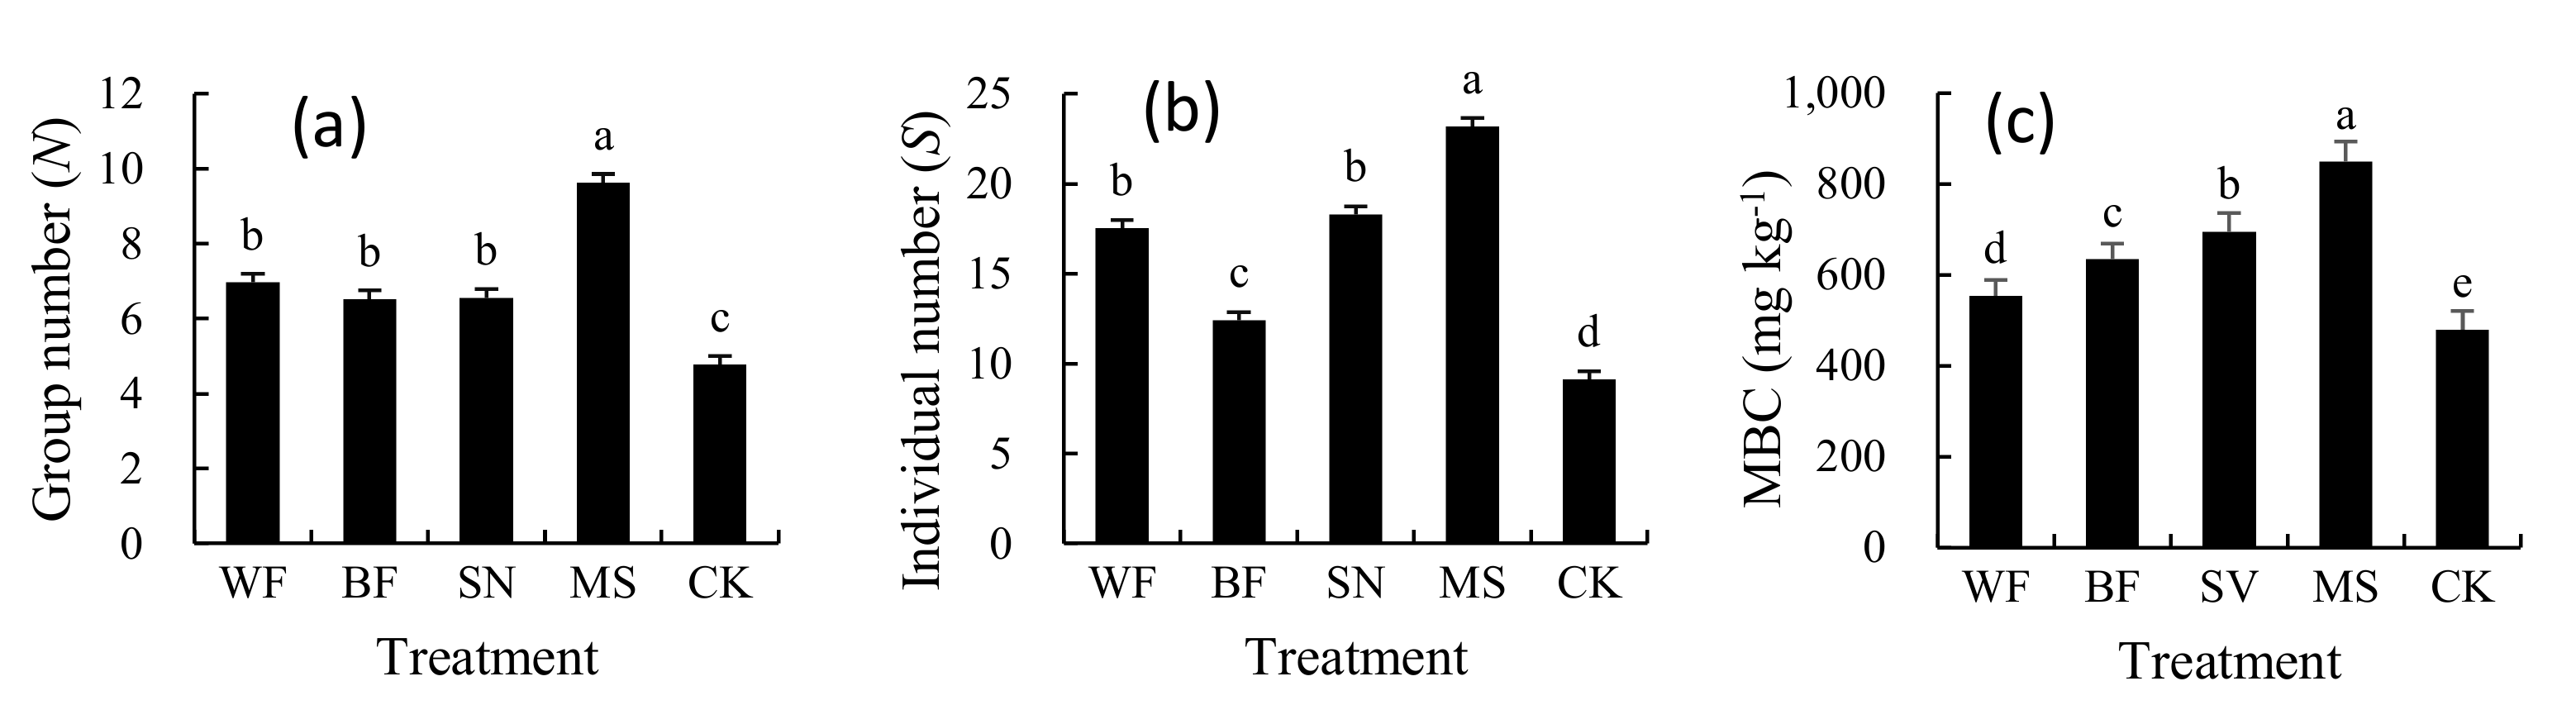
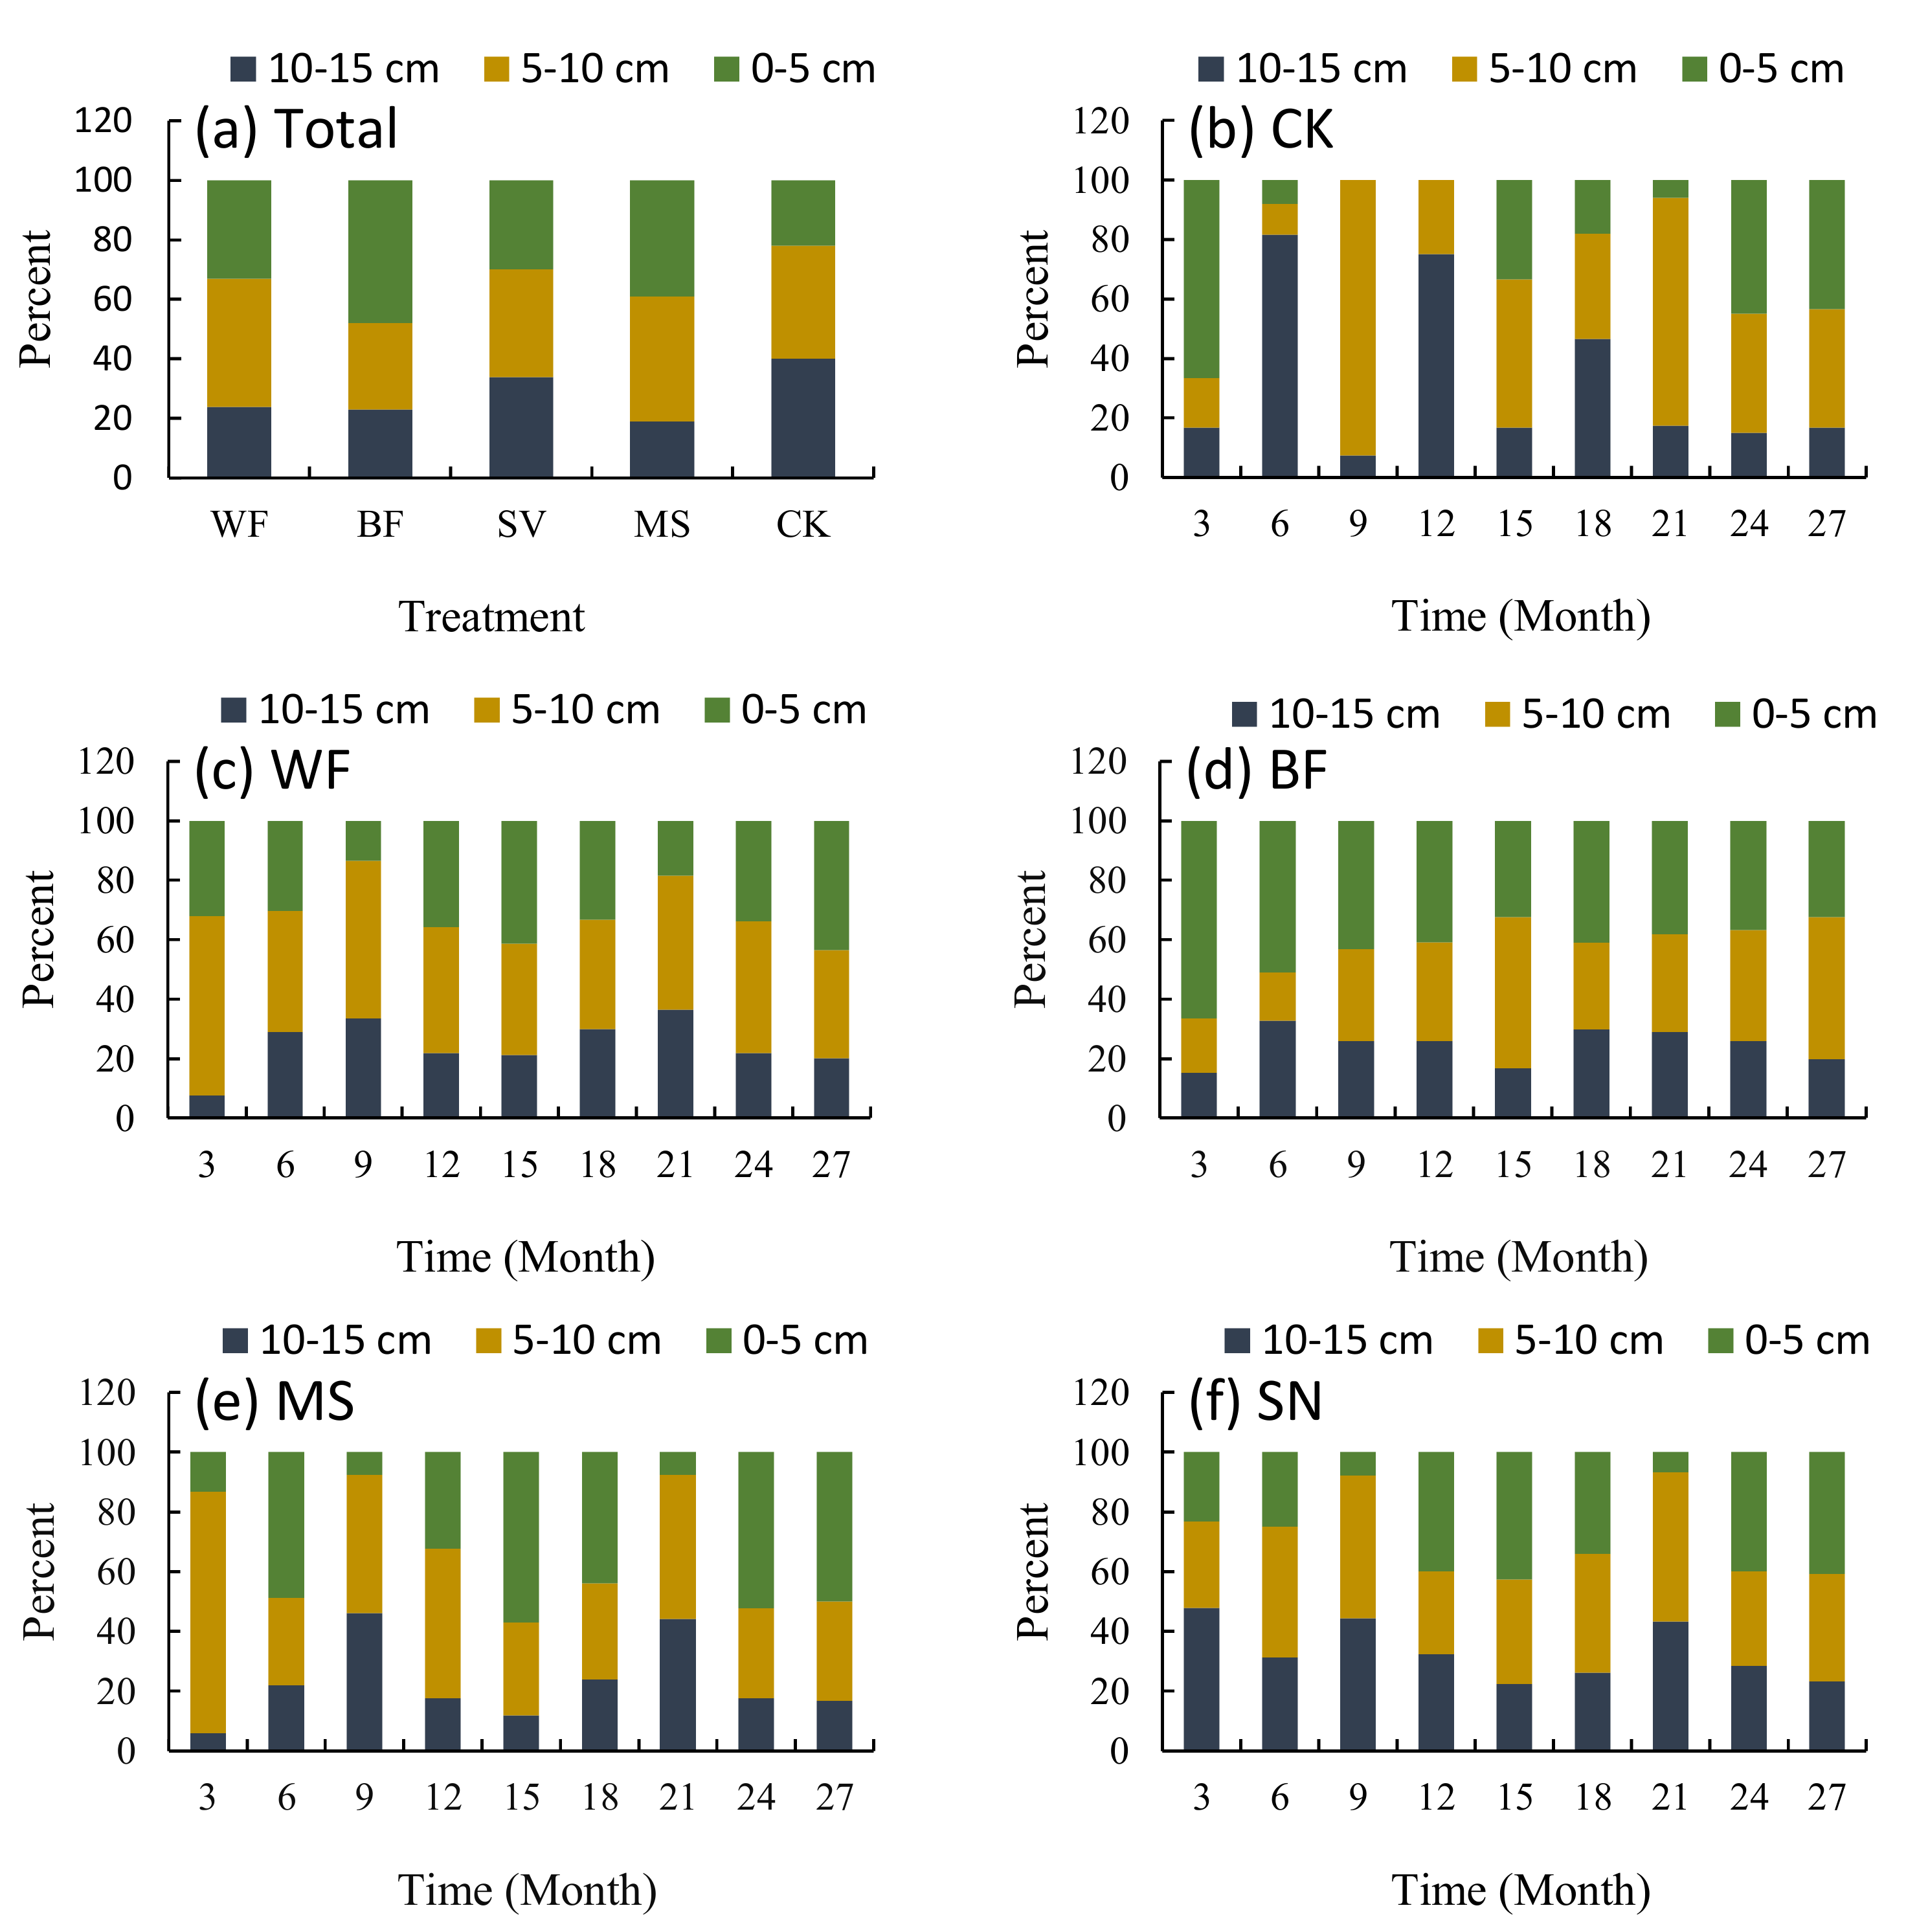
3.2. Effect of Soil Cover on Soil Fauna

The main effects of soil cover, sampling time, and their interactions on N and S were significant (p < 0.05; Figure S3a,b). The values of N in soils covered with WF, BF, SN, and MS were 45.7, 36.4, 37.2, and 101.5% greater than in CK during the study period, respectively (p < 0.05; Figure 3a), and similarly, the values of S were 92.3, 36.2, 100.8, and 154.5% greater in soils covered with WF, BF, SN, and MS than in CK (p < 0.05; Figure 3b). Across soil cover types, N and S were greatest in soils covered with MS (p < 0.05; Figure 3a,b).
During the study period, the soil fauna mainly gathered in the 5–15 cm soil layer in CK (78.2%; Figure 4a) and in the 0–10 cm soil layer in soils covered with WF, BF, and MS (75.8, 77.3, and 81.1%, respectively). The fauna in the soils covered with SN was found in 33.8, 35.9, and 30.3% in the 0–5, 5–10, and 10–15 cm soil layers, respectively. The vertical distribution of soil fauna was different in different sampling months (Figure 4b–f).

3.3. Effect of Soil Cover on Soil MBC

The main effects of soil cover, sampling time, and their interactions on soil MBC were significant (p < 0.05; Figure S3c). The MBC was 15.5, 32.3, 45.0, and 77.1% greater in soils covered with WF, BF, SN, and MS, respectively, than in CK during the study period (p < 0.05; Figure 3c). Across all cover types, the MBC was greatest in soils covered with MS (p < 0.05).

3.4. Effect of Soil Cover on SQI Value

The minimum required soil variables for the assessment of the SQI comprised SOM, TN, AK, S, and MBC (Table 1). The weights of the five variables on the two PCs ranged from −0.743 to 0.890. The equations for the first and second PCs were PCz1 = 0.848SOM + 0.133TN + 0.161AK + 0.890S + 0.867MBC and PCz2 = 0.038SOM − 0.743TN + 0.740AK + 0.161S − 0.159MBC, respectively. The first PC was mainly represented by soil biological indicators (S and MBC), and the second PC was represented by soil nutrient indicators (TN and AK). The first and second PCs explained 46.1 and 23.1% of the total variance, respectively.
The SQI was greater in soils covered by WF, BF, SV, and MS than in CK (p < 0.05; Table 2). Among the different cover types, the SQI was greatest in the soils covered with MS (p < 0.05). The SQI was greater in PCS1 and PCS2 in soils covered with WF, SV, and MS than in CK (p < 0.05) and greater in PCS1 in soils covered by BF than in CK (p < 0.05). The S and MBC explained 21.1 and 44.1% of the variation in SQI, respectively.

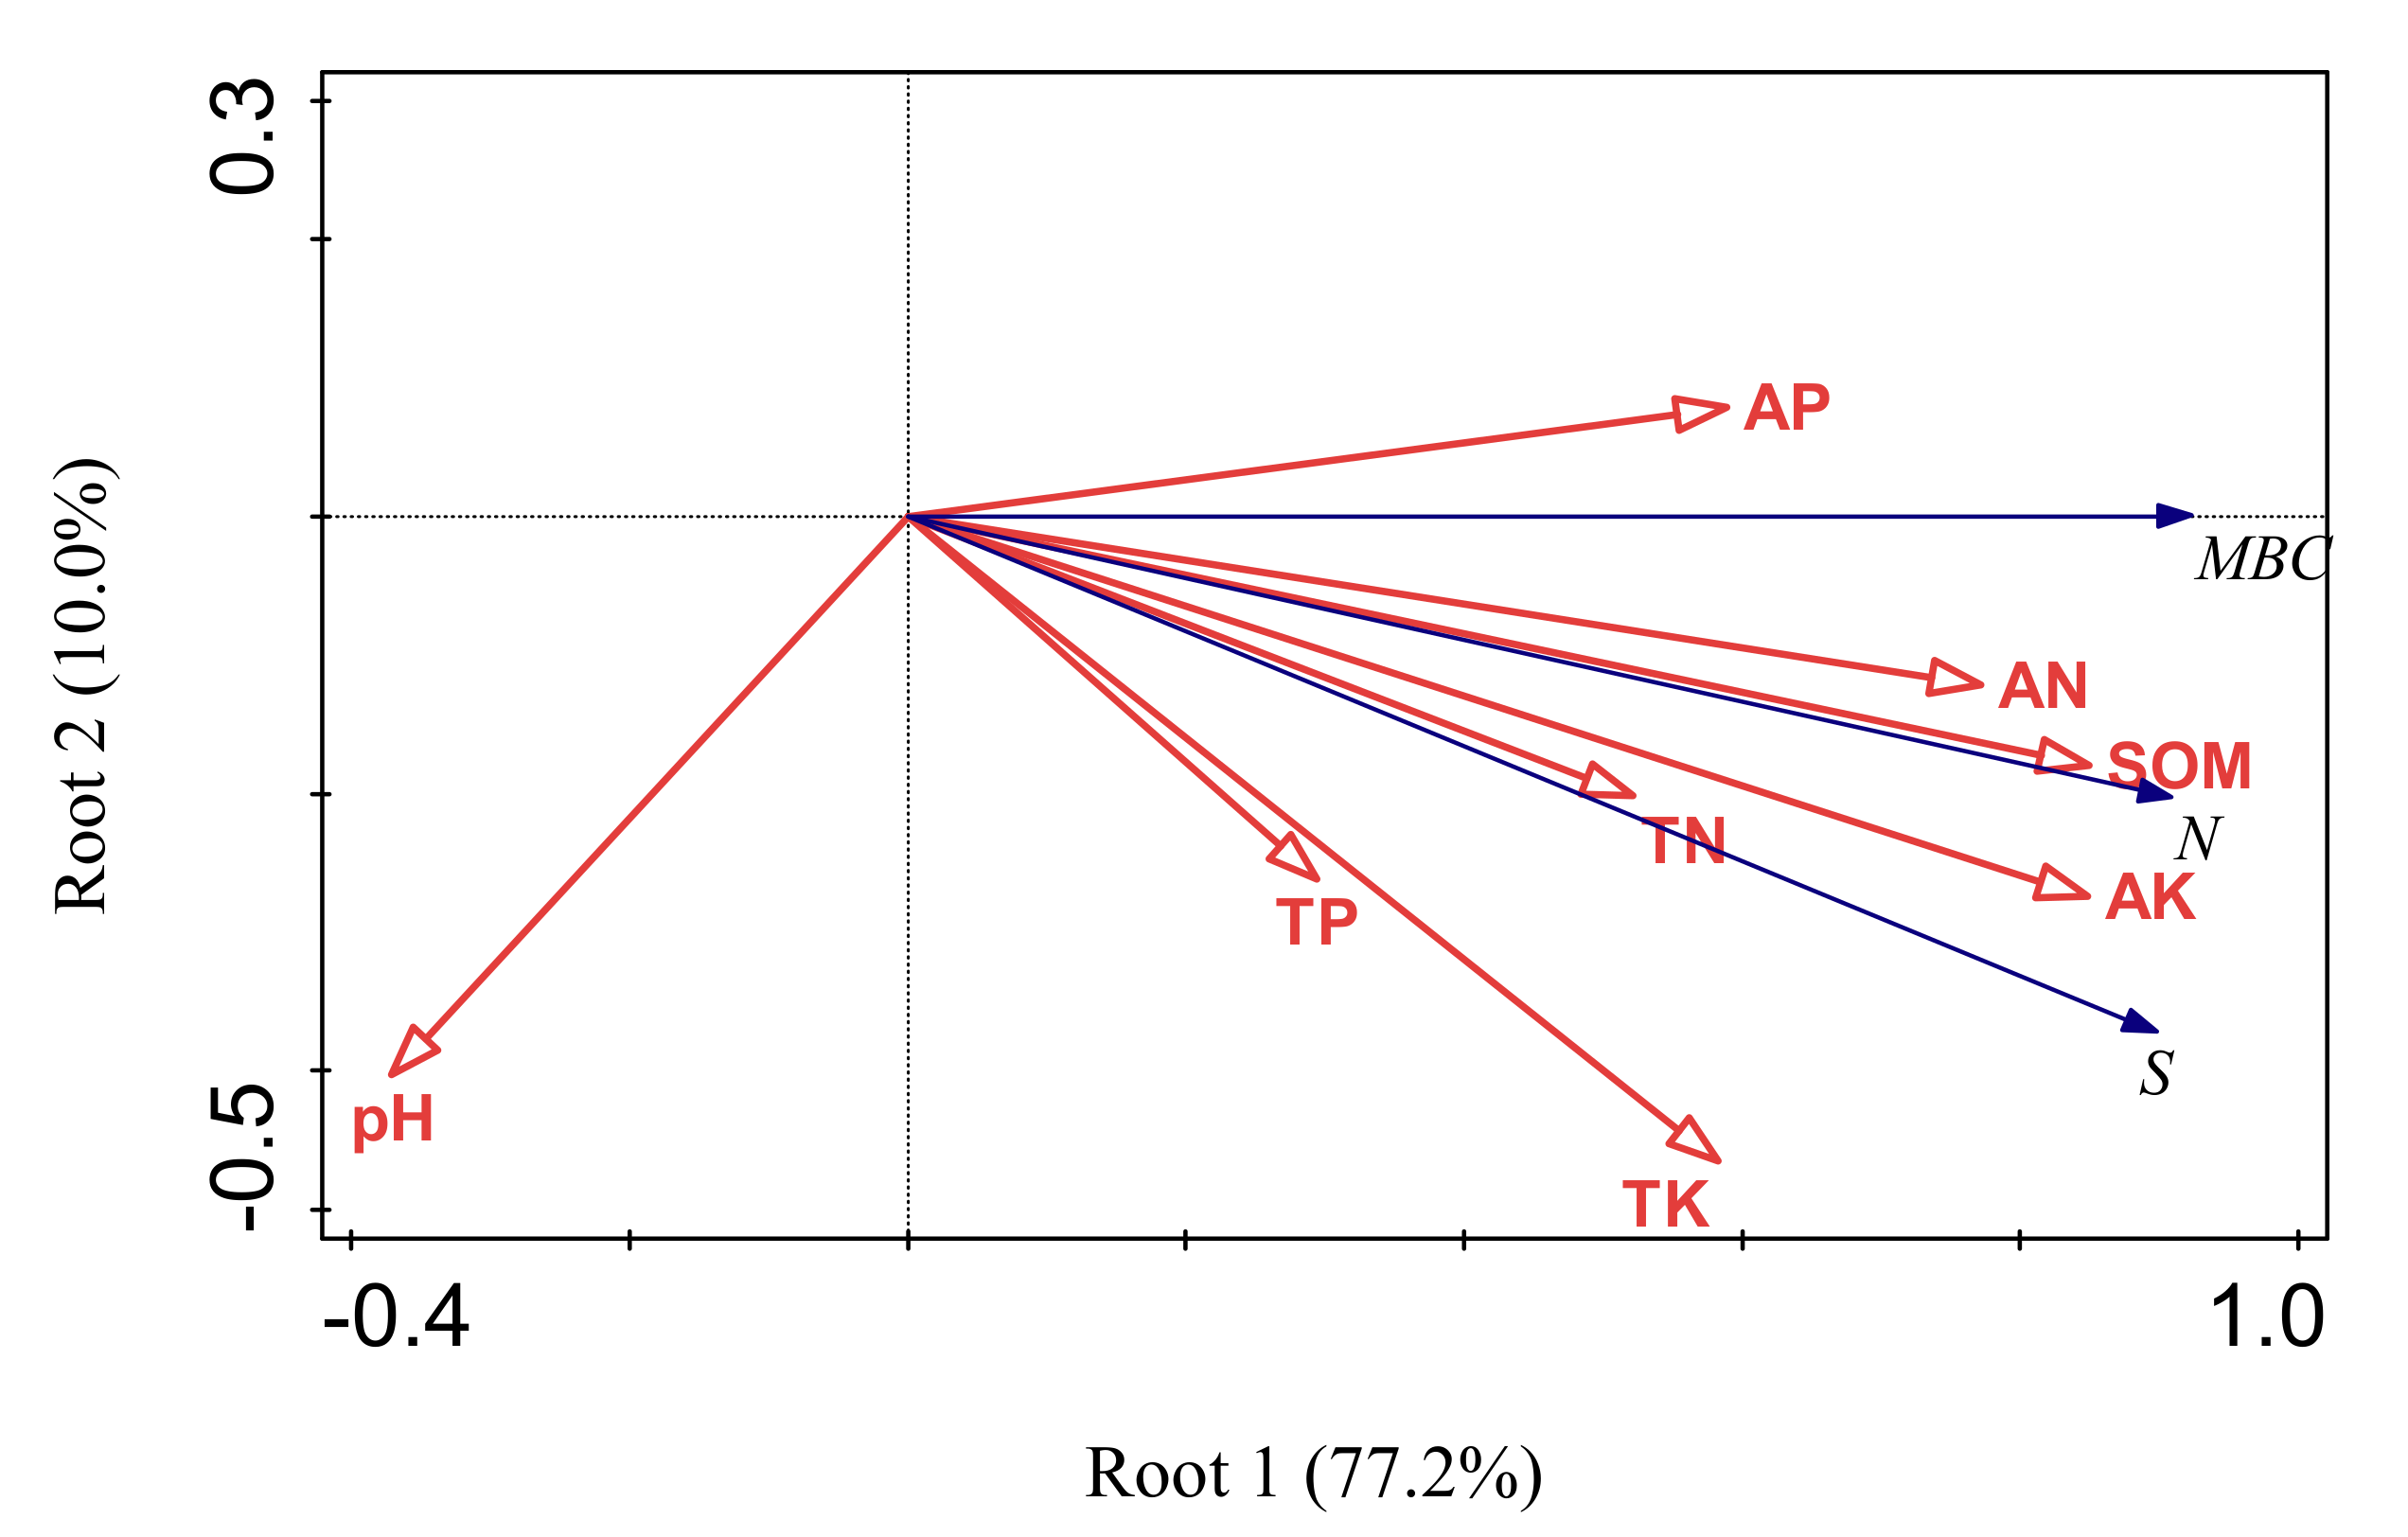
3.5. Relationships between Soil Biological Indicators and Soil Chemical Indicators

RDA showed that two roots explained 87.2% of the total variance in soil biological indicators and soil chemical indicators (Figure 5). The main explanatory variables in Roots 1 and 2 comprised MBC, N, S, SOM, AK, and AN; and soil pH and TK, respectively. There were strong positive interactions among MBC and the AN, SOM, AK, and AP concentrations; N and the SOM, AK, and AN concentrations; and S and the SOM, AK, AN, and TK concentrations, while there were strong negative interactions among soil pH and MBC, S, and N. SOM, TN, AN, and pH were the main variables that explained the effects of soil cover type on biological indicators.

4. Discussion

4.1. Soil Cover Altered Soil Nutrient Concentrations

In our study, each of the four soil cover types increased the SOM, TK, and AK concentrations overall, supporting the first hypothesis predicting that soil cover would increase soil fertility in the studied forest. This result agreed with most of the previous studies [10,21]. Two explanations can account for the phenomenon. First, soil temperature and moisture are considered to be two of the most important environmental factors that control soil nutrient cycling [20,33]. From December to April, total rainfall of <50 mm and a mean temperature of the surface soil layer (0–5 cm) of 8.8 °C (Figure S1) have led to drought conditions and reduced soil nutrient cycling in the surface soil layer in the study forest [5,22,23]. The soil cover can maintain a milder soil temperature, improve soil moisture retention [20], and promote the return of resources from plant to soil [21], resulting in higher soil fertility. Second, frequent and high levels of rainfall (>800 mm) from May to October increased the risk of soil nutrient leaching [17,34]. The soil cover usually reduces the levels of rainwater-mediated soil erosion and soil nutrient leaching [34], thus resulting in higher SOM, TK, and AK concentrations than in CK in the studied forest.
The TN and AN concentrations were increased in soils covered by maize straw but were unaffected by the other three cover types, which was in agreement with our second hypothesis positing that different soil cover types would have different effects on soil fertility. The decomposition of litter is a pivotal link between material cycling and energy flow and is essential in the plant–soil biogeochemical cycle [35], where the feedback of soil nutrients creates an important soil N resource [11,36]. The maize straw is rich in N-containing organic substances [36], such as crude protein, which was released back to the soil through maize straw decomposition [11], thereby increasing soil N concentration; whereas it did not exist under the other soil cover treatments. However, da Silva et al. [20] reported that the soils covered by plastic film and maize straw did not have altered TN concentrations in a tropical Smallanthus sonchifolius where the soil is Red-Yellow Latosol, which was inconsistent with our result. First, the large differences in soil types in the experiment site studied by da Silva et al. [20] (Red-Yellow Latosol) and our site (Red Entisol) can account for the inconsistent result between the two studies. Second, the time of soil cover was considerably different between the study of da Silva et al. [20] (210 days) and our study (27 months), which can also explain the different results between the two studies. Third, the climatic type in the da Silva et al. [20] study was a tropical climate whereas the climate at our study site was subtropical, resulting in the different responses of soil TN concentration to soil cover between the two studies. Taken together, the effect of soil cover on the soil N concentration may be related to not only the cover materials but also the cover time, climatic condition, and soil type. Therefore, more contributors, e.g., soil type, should be considered in the future to further improve the understanding of how soil cover affects soil N concentration in the studied forest area.
In this study, the soil cover, regardless of type, did not affect the soil TP concentrations, which was consistent with previous studies [37,38]. The rates of P cycling in soils tend to be slow because soil P is mainly derived from natural weathering of rock [38], resulting in relatively stable soil TP concentrations that are largely unaffected by external environmental conditions [37]. In contrast, we found that BF and MS treatments led to increases in soil AP concentrations, which indicated that the rate of soil P cycling was accelerated [37,38].
Furthermore, soil N, P, and K are essential elements for plant growth and development [6,39], and soil AN, AP, and AP, which can be directly absorbed by plants, are often used as predictors of crop yields [9,21]. Thus, the increases in soil AN, AP, and AK under soil cover treatments, especially the MS cover type, in our study indicated that soil cover may benefit the growth and development of walnut saplings.

4.2. Soil Cover Increased Soil MBC and Faunal Diversity

As expected from the first hypothesis, all four soil cover types increased the faunal total individual number and diversity and MBC, which may link to the increased SOM, TK, and AK concentrations. Soil microorganisms and fauna require soil nutrients for growth, and growth rates tend to be positively related to soil nutrient concentrations [40,41,42]. Thus, increases in soil nutrient concentrations (SOM, TK, and AK; Figure 2) can lead to rapid increases in microorganisms and associated increased densities of fauna in the covered soils [40,41,42]. Moreover, the greatest increases in N, S, and MBC were observed in soils covered with maize straw, supporting our second hypothesis. The result may be related to the higher AN concentrations in soils covered with maize straw than in the other cover treatments (Figure 2 and Figure 5), because soil N availability usually limits the growth of soil fauna and microorganisms [43].
We found that soil cover type affected the vertical distribution of soil fauna. For example, soil fauna mainly gathered in the 0–10 cm soil layer in soils covered by WF, BF, and MS. In contrast, soil fauna mainly gathered in the 5–15 cm soil layer in the CK. Moreover, the fauna in soils covered by shade netting were evenly distributed throughout the 0–15 cm soil layer. These phenomena may be related to the fact that soil water concentrations, nutrient availabilities, and oxygen levels tend to vary by soil layer and are affected by soil cover [5,22,23]. This result, however, should be further studied. In summary, soil cover types overall increased the soil faunal diversity in 0–15 cm soil layer, but the impacts differed among 0–5, 5–10, and 10–15 cm layers.

4.3. Soil Cover Improved the SQI

Soil biotas are important indicators of soil quality due to their sensitivity to changes in environment conditions [1,2,32]. However, these indicators tend to be absent from soil quality assessments [1,2]. Our study showed that SOM, TN, AK, S, and MBC comprised the minimum required soil variables for the effective evaluation of the SQI in the studied walnut sapling forest. Additionally, more than 65% of the variation in SQI was explained by MBC and S. These results indicated that soil biological indicators were the most sensitive and were essential for the assessment of the SQI of young walnut forests in the Sichuan Basin.
Moreover, SOM, TN, and AK are indicators of soil fertility [1,2] and S and MBC are indicators of soil ecological function [6,31,32]. In our study, S and MBC were the main variables of the first PC of the SQI, indicating that soil quality was principally associated with soil ecological function, whereas the strong associations of TN and AK with the second PC indicated the low contribution of the soil fertility status to soil quality. We found that soils covered by WF, SN, and MS increased SQIs in the first two PCs, while covering soils with BF only increased the SQI in the first PC. These increases in SQI indicated that soils covered by WF, SN, and MS improved the soil quality, including soil fertility and ecological function, supporting our first hypothesis. Additionally, the positive effects of MS on soil quality were greater than those of the other soil cover types, which supported the second hypothesis. Therefore, soil covering with maize straw should be a strongly suggested management measure to improve the soil quality in the studied forest area.

5. Conclusions

The results highlighted that SOM, TN, AK, S, and MBC were the minimum required soil variables for the effective assessment of the SQI in the 0–15 cm soil layer in the studied young walnut forest. All four types of soil cover increased the concentrations of SOM, TK, AK, MBC, N, and S and the SQI, indicating that soil cover improved soil fertility, ecological function, and soil quality. Additionally, maize straw cover, which had the lowest economic cost, led to the greatest increases in soil fertility, soil microbial biomass, soil faunal diversity, and the SQI. Thus, we recommend the soil surface covering with maize straw in newly planted walnut forests to improve the ecological function and productivity of soils in the Sichuan Basin. Soil cover types affected the vertical distribution of soil fauna, so the impacts among 0–5, 5–10, and 10–15 cm may be different. Finally, the soil MBC and soil faunal diversity were the most important indicators assessing the SQI in this forest, thus soil microorganisms and fauna should be considered as key indicators to evaluate the soil quality of young walnut forests in the Sichuan Basin.

Supplementary Materials

The following are available online at https://www.mdpi.com/1999-4907/12/2/236/s1, Table S1: Composition (%) of the number of soil faunal individuals in the soil cover treatments, Table S2: Eigenvalues, variance explained, and eigenvectors from the first three principal components (PC1, PC2, and PC3) of a principal component analysis (PCA) based on the full set of variables during the 27-month study period, Table S3: Association between principal component analysis eigenvectors of the six selected variables (Pearson’s r) during the 27-month study period, Table S4: Summary statistics during the 27-month study period for the minimum number of soil variables required for soil quality assessment, Figure S1: Rainfall (bars) and soil temperature (line plot) in the 0–5 cm soil layer from May 2013 to April 2015, Figure S2: Dynamics of the soil nutrient contents and pH in the control and soil cover treatments at each sampling time, Figure S3: Dynamics of the number of faunal groups (a) and individuals (b) and microbial biomass carbon (c) in the control and soil cover treatments at each sampling time.

Author Contributions

Data curation, L.T., W.B. and M.F.; Formal analysis, L.T., W.B., M.F., D.H., T.W. and W.L.; Funding acquisition, M.F.; Project administration, M.F.; Software, L.T. and W.B.; Writing—original draft, L.T., J.P., J.S. and M.F.; Writing—review and editing, L.T., J.P., J.S., M.F. and C.H. All authors have read and agreed to the published version of the manuscript.

Funding

This work was funded by the National Science and Technology Support Program [2011BAC09B05], German Government Loans for Sichuan Forestry Sustainable Management [G1403083], the IMBALANCE-P Grant of European Research Council Synergy [ERC-SyG-2013-610028], and the China Scholarship Council [201906910006].

Institutional Review Board Statement

Not applicable.

Informed Consent Statement

Not applicable.

Data Availability Statement

The data presented in this study are available on request from the corresponding author. The data are not publicly available due to the key roles of data in the series of studies.

Acknowledgments

The authors thank Yingzi Li, Pei He, Ling Wang, and Taifen Li for providing data analysis assistance.

Conflicts of Interest

The authors declare no conflict of interest.

References

  1. Bastida, F.; Zsolnay, A.; Hernandez, T.; Garcia, C. Past, present and future of soil quality indices: A biological perspective. Geoderma 2008, 147, 159–171. [Google Scholar] [CrossRef]
  2. Bunemann, E.K.; Bongiorno, G.; Bai, Z.G.; Creamer, R.E.; De Deyn, G.; de Goede, R.; Fleskens, L.; Geissen, V.; Kuyper, T.W.; Mader, P.; et al. Soil quality—A critical review. Soil Biol. Biochem. 2018, 120, 105–125. [Google Scholar] [CrossRef]
  3. Chaer, G.M.; Myrold, D.D.; Bottomley, P.J. A soil quality index based on the equilibrium between soil organic matter and biochemical properties of undisturbed coniferous forest soils of the Pacific Northwest. Soil Biol. Biochem. 2009, 41, 822–830. [Google Scholar] [CrossRef]
  4. Duraisamy, V.; Singh, S.; Ray, S.; Duraisami, V.; Tiwary, P.; Chandran, P.; Nimkar, A.; Anantwar, S. Soil quality index (SQI) as a tool to evaluate crop productivity in semi-arid Deccan plateau, India. Geoderma 2016, 282, 70–79. [Google Scholar] [CrossRef]
  5. Ngo-Mbogba, M.; Yemefack, M.; Nyeck, B. Assessing soil quality under different land cover types within shifting agriculture in South Cameroon. Soil Tillage Res. 2015, 150, 124–131. [Google Scholar] [CrossRef]
  6. Andrews, S.S.; Karlen, D.L.; Mitchell, J.P. A comparison of soil quality indexing methods for vegetable production systems in Northern California. Agric. Ecosyst. Environ. 2002, 90, 25–45. [Google Scholar] [CrossRef]
  7. Gil-Sotres, F.; Trasar-Cepeda, C.; Leiros, M.C.; Seoane, S. Different approaches to evaluating soil quality using biochemical properties. Soil Biol. Biochem. 2005, 37, 877–887. [Google Scholar] [CrossRef]
  8. Chahal, I.; Van Eerd, L.L. Quantifying soil quality in a horticultural-cover cropping system. Geoderma 2019, 352, 38–48. [Google Scholar] [CrossRef]
  9. D’Hose, T.; Cougnon, M.; De Vliegher, A.; Vandecasteele, B.; Viaene, N.; Cornelis, W.; Van Bockstaele, E.; Reheul, D. The positive relationship between soil quality and crop production: A case study on the effect of farm compost application. Appl. Soil Ecol. 2014, 75, 189–198. [Google Scholar] [CrossRef]
  10. Agegnehu, G.; Srivastava, A.K.; Bird, M.I. The role of biochar and biochar-compost in improving soil quality and crop performance: A review. Appl. Soil Ecol. 2017, 119, 156–170. [Google Scholar] [CrossRef]
  11. Birkhofer, K.; Bezemer, T.M.; Bloem, J.; Bonkowski, M.; Christensen, S.; Dubois, D.; Ekelund, F.; Fliessbach, A.; Gunst, L.; Hedlund, K.; et al. Long-term organic farming fosters below and aboveground biota: Implications for soil quality, biological control and productivity. Soil Biol. Biochem. 2008, 40, 2297–2308. [Google Scholar] [CrossRef]
  12. Andres-Abellan, M.; Wic-Baena, C.; Lopez-Serrano, F.R.; Garcia-Morote, F.A.; Martinez-Garcia, E.; Picazo, M.I.; Rubio, E.; Moreno-Ortego, J.L.; Bastida-Lopez, F.; Garcia-Izquierdo, C. A soil-quality index for soil from Mediterranean forests. Eur. J. Soil Sci. 2019, 70, 1001–1011. [Google Scholar] [CrossRef]
  13. Gong, L.; Ran, Q.Y.; He, G.X.; Tiyip, T. A soil quality assessment under different land use types in Keriya river basin, Southern Xinjiang, China. Soil Tillage Res. 2015, 146, 223–229. [Google Scholar] [CrossRef]
  14. Anderson, K.J.; Teuber, S.S.; Gobeille, A.; Cremin, P.; Waterhouse, A.L.; Steinberg, F.M. Walnut polyphenolics inhibit in vitro human plasma and LDL oxidation. J. Nutr. 2001, 131, 2837–2842. [Google Scholar] [CrossRef]
  15. Ros, E.; Nunez, I.; Perez-Heras, A.; Serra, M.; Gilabert, R.; Casals, E.; Deulofeu, R. A walnut diet improves endothelial function in hypercholesterolemic subjects—A randomized crossover trial. Circulation 2004, 109, 1609–1614. [Google Scholar] [CrossRef] [Green Version]
  16. Feng, X.J.; Zhou, H.J.; Zulfiqar, S.; Luo, X.; Hu, Y.H.; Feng, L.; Malvolti, M.E.; Woeste, K.; Zhao, P. The phytogeographic history of common walnut in China. Front. Plant Sci. 2018, 9. [Google Scholar] [CrossRef] [PubMed] [Green Version]
  17. Zhu, B.; Wang, T.; Kuang, F.H.; Luo, Z.X.; Tang, J.L.; Xu, T.P. Measurements of nitrate leaching from a hillslope cropland in the central Sichuan Basin, China. Soil Sci. Soc. Am. J. 2009, 73, 1419–1426. [Google Scholar] [CrossRef]
  18. Tie, L.; Bai, W.; Feng, M.; Wu, T.; Li, W.; Han, D. Effects of five low-benefit Cupressus funebris recovery measures on soil fauna and physical and chemical properties. Chin. J. Appl. Environ. Biol. 2019, 25, 1053–1060. [Google Scholar]
  19. Tie, L.; Bai, W.; Feng, M.; Wu, T.; Li, W.; Han, D.; Zhang, Z. Effects of reforming low- efficient cypress forest on meso-and micro- soil faunal community. J. Ecol. Rural Environ. 2016, 32, 767–773. [Google Scholar]
  20. Da Silva, D.M.N.; Venturim, C.H.P.; Capucho, M.; de Oliveira, F.L.; Mendonca, E.D. Impact of soil cover systems on soil quality and organic production of yacon. Sci. Hortic. 2018, 235, 407–412. [Google Scholar] [CrossRef]
  21. Neuweiler, R.; Bertschinger, L.; Stamp, P.; Feil, B. The impact of ground cover management on soil nitrogen levels, parameters of vegetative crop development, yield and fruit quality of strawberries. Eur. J. Hortic. Sci. 2003, 68, 183–191. [Google Scholar]
  22. Dabney, S.M.; Delgado, J.A.; Reeves, D.W. Using winter cover crops to improve soil and water quality. Commun. Soil Sci. Plant. Anal. 2001, 32, 1221–1250. [Google Scholar] [CrossRef]
  23. Navas, M.; Benito, M.; Rodriguez, I.; Masaguer, A. Effect of five forage legume covers on soil quality at the Eastern plains of Venezuela. Appl. Soil Ecol. 2011, 49, 242–249. [Google Scholar] [CrossRef]
  24. DuPont, S.T.; Ferris, H.; Van Horn, M. Effects of cover crop quality and quantity on nematode-based soil food webs and nutrient cycling. Appl. Soil Ecol. 2009, 41, 157–167. [Google Scholar] [CrossRef]
  25. Marinari, S.; Mancinelli, R.; Brunetti, P.; Campiglia, E. Soil quality, microbial functions and tomato yield under cover crop mulching in the Mediterranean environment. Soil Tillage Res. 2015, 145, 20–28. [Google Scholar] [CrossRef]
  26. Tie, L.; Bai, W.; Feng, M.; Wu, T.; Li, W.; Han, D.; Huang, Y.; Zhang, Z. Effects of forest-grass modes on the meso-and micro- soil faunal community structure in transforming low-benefit Cupressus funebris Endl. forest. Chin. J. Ecol. 2016, 35, 346–353. [Google Scholar]
  27. Allen, S.E.; Grimshaw, H.M.; Parkinson, J.A.; Quarmby, C. Chemical Analysis of Ecological Materials; Blackwell Scientific Publications: Oxford, UK; London, UK, 1974. [Google Scholar]
  28. Schinner, F.; Ohlinger, R.; Kandeler, E.; Margesin, R. Methods in Soil Biology; Springer: Berlin, Germany, 1996. [Google Scholar]
  29. Joergensen, R.G.; Mueller, T. The fumigation-extraction method to estimate soil microbial biomass: Calibration of the kEN value. Soil Biol. Biochem. 1996, 28, 33–37. [Google Scholar] [CrossRef]
  30. Yin, W. Pictorial Keys to Soil Fauna of China; Science Press: Beijing, China, 1998. [Google Scholar]
  31. Andrews, S.S.; Carroll, C.R. Designing a soil quality assessment tool for sustainable agroecosystem management. Ecol. Appl. 2001, 11, 1573–1585. [Google Scholar] [CrossRef]
  32. Karlen, D.L.; Ditzler, C.A.; Andrews, S.S. Soil quality: Why and how? Geoderma 2003, 114, 145–156. [Google Scholar] [CrossRef]
  33. Liao, S.; Ni, X.Y.; Yang, W.Q.; Li, H.; Wang, B.; Fu, C.K.; Xu, Z.F.; Tan, B.; Wu, F.Z. Water, rather than temperature, dominantly impacts how soil fauna affect dissolved carbon and nitrogen release from fresh litter during early litter decomposition. Forests 2016, 7, 249. [Google Scholar] [CrossRef] [Green Version]
  34. Alfaro, M.A.; Jarvis, S.C.; Gregory, P.J. Factors affecting potassium leaching in different soils. Soil Use Manag. 2004, 20, 182–189. [Google Scholar] [CrossRef]
  35. Tie, L.; Fu, R.; Peñuelas, J.; Sardans, J.; Zhang, S.; Zhou, S.; Hu, J.; Huang, C. The additions of nitrogen and sulfur synergistically decrease the release of carbon and nitrogen from litter in a subtropical forest. Forests 2020, 11, 1280. [Google Scholar] [CrossRef]
  36. Freschet, G.T.; Cornwell, W.K.; Wardle, D.A.; Elumeeva, T.G.; Liu, W.D.; Jackson, B.G.; Onipchenko, V.G.; Soudzilovskaia, N.A.; Tao, J.P.; Cornelissen, J.H.C. Linking litter decomposition of above- and below-ground organs to plant-soil feedbacks worldwide. J. Ecol. 2013, 101, 943–952. [Google Scholar] [CrossRef]
  37. Peñuelas, J.; Sardans, J.; Rivas-Ubach, A.; Janssens, I.A. The human-induced imbalance between C, N and P in earth’s life system. Glob. Change Biol. 2012, 18, 3–6. [Google Scholar] [CrossRef]
  38. Penuelas, J.; Poulter, B.; Sardans, J.; Ciais, P.; van der Velde, M.; Bopp, L.; Boucher, O.; Godderis, Y.; Hinsinger, P.; Llusia, J.; et al. Human-induced nitrogen-phosphorus imbalances alter natural and managed ecosystems across the globe. Nat. Commun. 2013, 4, 2934. [Google Scholar] [CrossRef] [PubMed] [Green Version]
  39. Armitage, H.F.; Britton, A.J.; van der Wal, R.; Pearce, I.S.K.; Thompson, D.B.A.; Woodin, S.J. Nitrogen deposition enhances moss growth, but leads to an overall decline in habitat condition of mountain moss-sedge heath. Glob. Change Biol. 2012, 18, 290–300. [Google Scholar] [CrossRef]
  40. Bending, G.D.; Putland, C.; Rayns, F. Changes in microbial community metabolism and labile organic matter fractions as early indicators of the impact of management on soil biological quality. Biol. Fertil. Soils 2000, 31, 78–84. [Google Scholar] [CrossRef]
  41. Kaschuk, G.; Alberton, O.; Hungria, M. Three decades of soil microbial biomass studies in Brazilian ecosystems: Lessons learned about soil quality and indications for improving sustainability. Soil Biol. Biochem. 2010, 42, 1–13. [Google Scholar] [CrossRef]
  42. Mbuthia, L.W.; Acosta-Martinez, V.; DeBruyn, J.; Schaeffer, S.; Tyler, D.; Odoi, E.; Mpheshea, M.; Walker, F.; Eash, N. Long term tillage, cover crop, and fertilization effects on microbial community structure, activity: Implications for soil quality. Soil Biol. Biochem. 2015, 89, 24–34. [Google Scholar] [CrossRef]
  43. Zhang, H.; Liu, Y.H.; Zhou, Z.Y.; Zhang, Y.Y. Inorganic nitrogen addition affects soil respiration and belowground organic carbon fraction for a Pinus Tabuliformis forest. Forests 2019, 10, 369. [Google Scholar] [CrossRef] [Green Version]
Figure 1. Location of study site in Deyang City, Sichuan province, China, and the schematic design of soil cover. (a): Sichuan province in China; (b): Deyang City in Sichuan province; (c): blocks distribution; (d): plot diagram.
Forests 12 00236 g001
Figure 2. Effects of soil cover type on SOM (a), total N (c), available N (d), total P (e), available P (f), total K (g), available K (h) concentrations and pH (b) during the 27-month study period. Different lowercase letters denote treatment differences at p < 0.05. SOM: soil organic matter; WF: white film; BF: black film; SN: shade netting; MS: maize straw; and CK: uncovered control. Values are the averages of three plot replicates ± SD; n = 1080.
Forests 12 00236 g002
Figure 3. Effects of soil cover type on the number of faunal groups (a) and individuals (b) and on microbial biomass carbon (c) during the 27-month study period. Different lowercase letters denote treatment differences at p < 0.05. MBC: microbial biomass carbon; WF: white film; BF: black film; SN: shade netting; MS: maize straw; and CK: uncovered control. Values are the averages of three plot replicates ± SD; n = 405.
Forests 12 00236 g003
Figure 4. Proportional (percent of the number of individuals) vertical distribution of soil fauna in the soil cover type treatments during the 27-month study period (a) and at each sampling occasion (bf). WF: white film; BF: black film; SN: shade netting; MS: maize straw; and CK: uncovered control. n = 405.
Forests 12 00236 g004
Figure 5. Redundancy discriminant analysis root plot of soil organic matter (SOM), total nitrogen (TN), total phosphorus (TP), total potassium (TK), available nitrogen (AN), available phosphorus (AP), available potassium (AK), acidity (pH), number of soil faunal groups (N) and individuals (S), and microbial biomass carbon (MBC). Blue and red arrows indicate biological and environmental variables, respectively. Data are means during the 27-month study period. n = 165.
Forests 12 00236 g005
Table 1. Eigenvalues, variance explained, and rotated component weight matrix for the soil variables of the first two principal components (PC1 and PC2) using a factor analysis based on the minimum number of required soil variables with the Caesar normalized maximum variance method (rotation converged in three iterations). SOM: soil organic matter; total N: total nitrogen; available K: available potassium; S: number of soil fauna individuals; and MBC: microbial biomass carbon. Analysis was conducted during the 27-month study period; n = 675.
VariablePC1PC2
SOM (g kg−1)0.8480.038
Total N (g kg−1)0.133−0.743
Available K (mg kg−1)0.1610.740
S0.8900.161
MBC (mg kg−1)0.867−0.159
Eigenvalue2.311.15
Variance explained (%)46.123.1
Table 2. Effects of soil cover type on the soil quality index (SQI). Different lowercase letters denote treatment differences at p < 0.05. PCz1 and PCz2: additive indices of the first and second principal components, respectively; PCS1 and PCS2: SQI of the first and second principal components, respectively, calculated as PCz × variance explained (%) for the respective PCs. WF: white film; BF: black film; SN: shade netting; MS: maize straw; CK: uncovered control. Values are the averages of three plot replicates ± SD; analysis was conducted during the 27-month study period; n = 675.
TreatmentPCz1PCz2PCS1PCS2SQI
WF−0.266 ± 0.197 c0.087 ± 0.086 a0.123 ± 0.0.091 c0.02 ± 0.020 ab0.103 ± 0.096 c
BF0.445 ± 0.207 c0.091 ± 0.088 b0.205 ± 0.096 c0.021 ± 0.016 bc0.226 ± 0.133 c
SN0.745 ± 0.241 b0.274 ± 0.152 a0.344 ± 0.111 b0.063 ± 0.041 a0.407 ± 0.097 b
MS2.09 ± 0.131 a0.088 ± 0.030 a0.966 ± 0.060 a0.02 ± 0.007 ab0.986 ± 0.068 a
CK2.13 ± 0.090 d0.359 ± 0.099 b0.982 ± 0.042 d0.083 ± 0.046 c1.06 ± 0.049 d
Publisher’s Note: MDPI stays neutral with regard to jurisdictional claims in published maps and institutional affiliations.

