1. Introduction
Dry dipterocarp forest (DDF) or broadleaf deciduous forest (BDF) is a typical forest of Southeast Asian countries dominated by humid tropical climate with a rainy and a severe dry season. Generally speaking, BDFs are distributed in Laos, Cambodia, Thailand, Indonesia, Malaysia, Philippines, and some other South Asian countries. In Vietnam, BDFs are dominated by Dipterocarpaceae with deciduous season in the dry season. BDFs play an important role in the life of flora and fauna in the Central Highlands, Vietnam. In recent years, BDFs have been gradually replaced by industrial trees that are expected to generate higher economic values [
1]. Nevertheless, it has been found that both natural and human-made disturbances could deteriorate the ecosystems. For instance, it has been found that Asia’s ecoenvironment is very vulnerable to massive changes in the land use and land cover [
2]. It is thus suggested that environmental protection is crucial by controlling the access to forestry, limiting agricultural activities, and enhancing green industry to improve environmental facilities and restore ecological values [
3]. Evidently, observation and classification of forest phenology provide valuable information for the improved forest management to achieve environmental sustainability. Forest phenology is the first-order control on terrestrial carbon and energy budgets, while Earth observations are usually utilized to derive parameters of the seasonal vegetation dynamics in ecosystem models.
Vegetation phenology is defined as the study of a plant’s life cycles influenced by the environmental seasonality [
4]. The long-term in situ observations have been used to demonstrate the plant phenology at the species level [
5], while satellite-based observations have been used to analyze ecosystems’ leaf phenology at global scale [
6]. For the long-term timespan over large-scale areas, Landsat time-series data and the Moderate Resolution Imaging Spectroradiometer (MODIS) are valuable sources of datasets to support forest mapping and studies [
7,
8,
9]. At global scale, MODIS products were designed to consistently provide spatiotemporal global vegetation conditions to assist change detection and phenological and biophysical interpretations [
10,
11]. In contrast, at smaller scale, Landsat data are used for studying forest phenology. The Landsat satellite is an instrument for monitoring and identifying patterns of forest land cover and land use change. In the past, the use of Landsat data to derive forest information significantly contributed to the global system database for further investigating environmental issues [
12,
13,
14,
15,
16,
17]. Analysis of the plant phenology using remote sensing data is based on the seasonal trajectory of vegetation indices, such as the normalized difference vegetation index (NDVI) or enhanced vegetation index (EVI) [
18,
19,
20,
21,
22]. Moreover, the timing of phenological transition was determined by the vegetation index threshold [
23,
24].
Many studies have been proposed to discriminate tree species and crops based on multitemporal optical data [
25,
26], hyperspectral data [
27,
28], and radar data [
29,
30]. The information of the species is mainly extracted based on the correlation between the phenology of plants and spectral reflection or backscatter signal in satellite images. The multitemporal Sentinel-1A data have been useful in monitoring phenology and classifying deciduous forests [
29,
31]. Marius et al. [
29] utilized multitemporal Sentinel-1A to monitor phenology and classify two forest types as deciduous and coniferous forests in northern Switzerland with classification accuracy of 86%. To improve accuracy, simultaneous use of optical and radar images, either multitemporal optical images or a single SAR image [
32], or multitemporal SAR images and a single optical image [
33], is adopted. Using Advanced Land Observation Satellite (ALOS) Phased Array type L-band Synthetic Aperture Radar (PALSAR) combined with Sentinel-2A data to determine forest cover and biomass variation has been presented in the literature [
34,
35,
36]. The classification methods as pixel-based and object-based methods were used for vegetation species classification [
25,
28,
29,
37]. An object-based method is applied for image classification or land cover and forest mapping using a time series of satellite images.
According to the Global Forest Report [
38], Vietnam is one of the top leading countries in forest cover loss, although various forest protection and reforestation programs have been implemented. It is estimated that from 2001 to 2007, Vietnam lost 2.42 Mha of tree cover, equivalent to a 15% decrease since 2000 and 256 Mha of CO
2 emissions [
38]. Therefore, there is a need to have a better forest management solution with detailed observation of forest tree species to assist forest officials and local authorities in advancing forest management and restoration.
This research proposes an object-based classification method to identify BDFs by integrating multitemporal Sentinel-1A images with a spatial resolution of 10 m and Landsat 8 OLI images with a spatial resolution of 30 m. Yok Don National Park, located in Central Highlands, Vietnam, is selected as the study site. Since it is characterized by a rich ecosystem of dry open dipterocarp forest mixed with broadleaved tropical evergreen forests with high plant diversity in high mountainous areas, the intersection and mixing of diverse forest species result in challenges for forest monitoring and management. It is the first time the integration of multitemporal Sentinel-1A and Landsat images is adopted to identify dominant deciduous forest species in the Central Highlands and tropical region based on the correlation between backscatter values of multitemporal Sentinel-1A images and the phenological difference in leaf regeneration periods of dipterocarp trees. The outcomes of this study will contribute to further applications of combining freely accessible optical and radar satellite images in studying forest tree species in tropical regions.
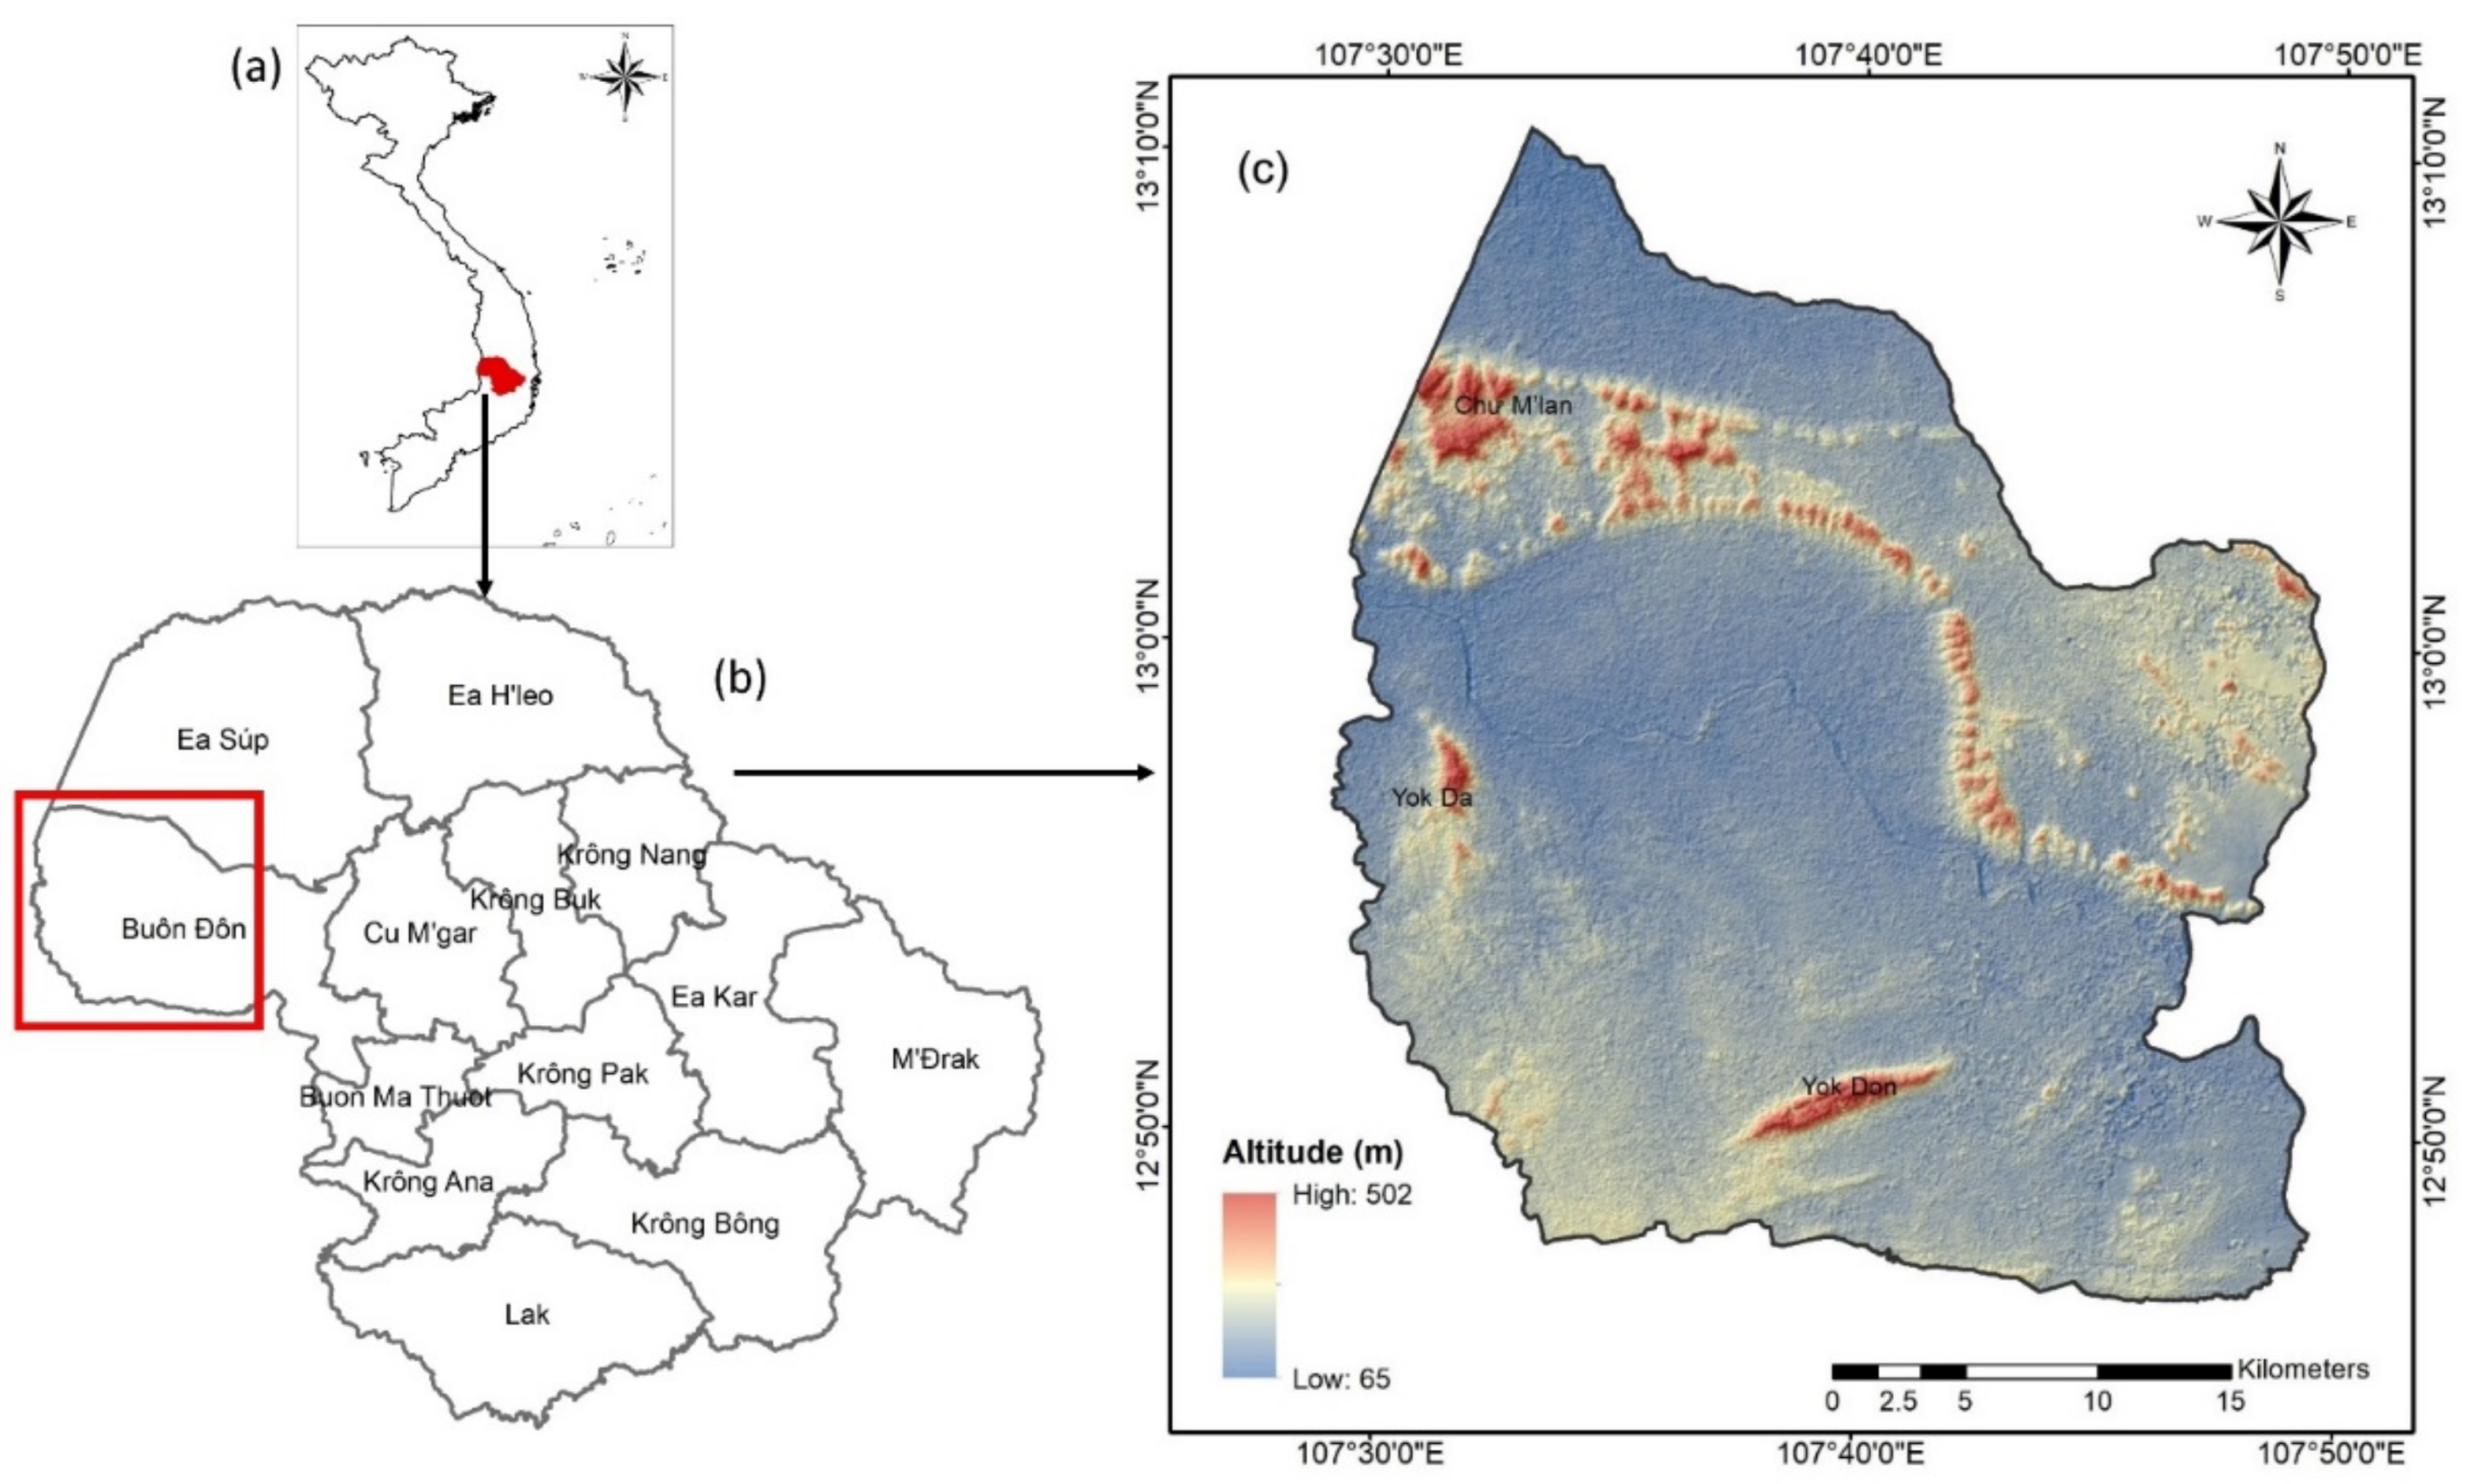
2. Study Site
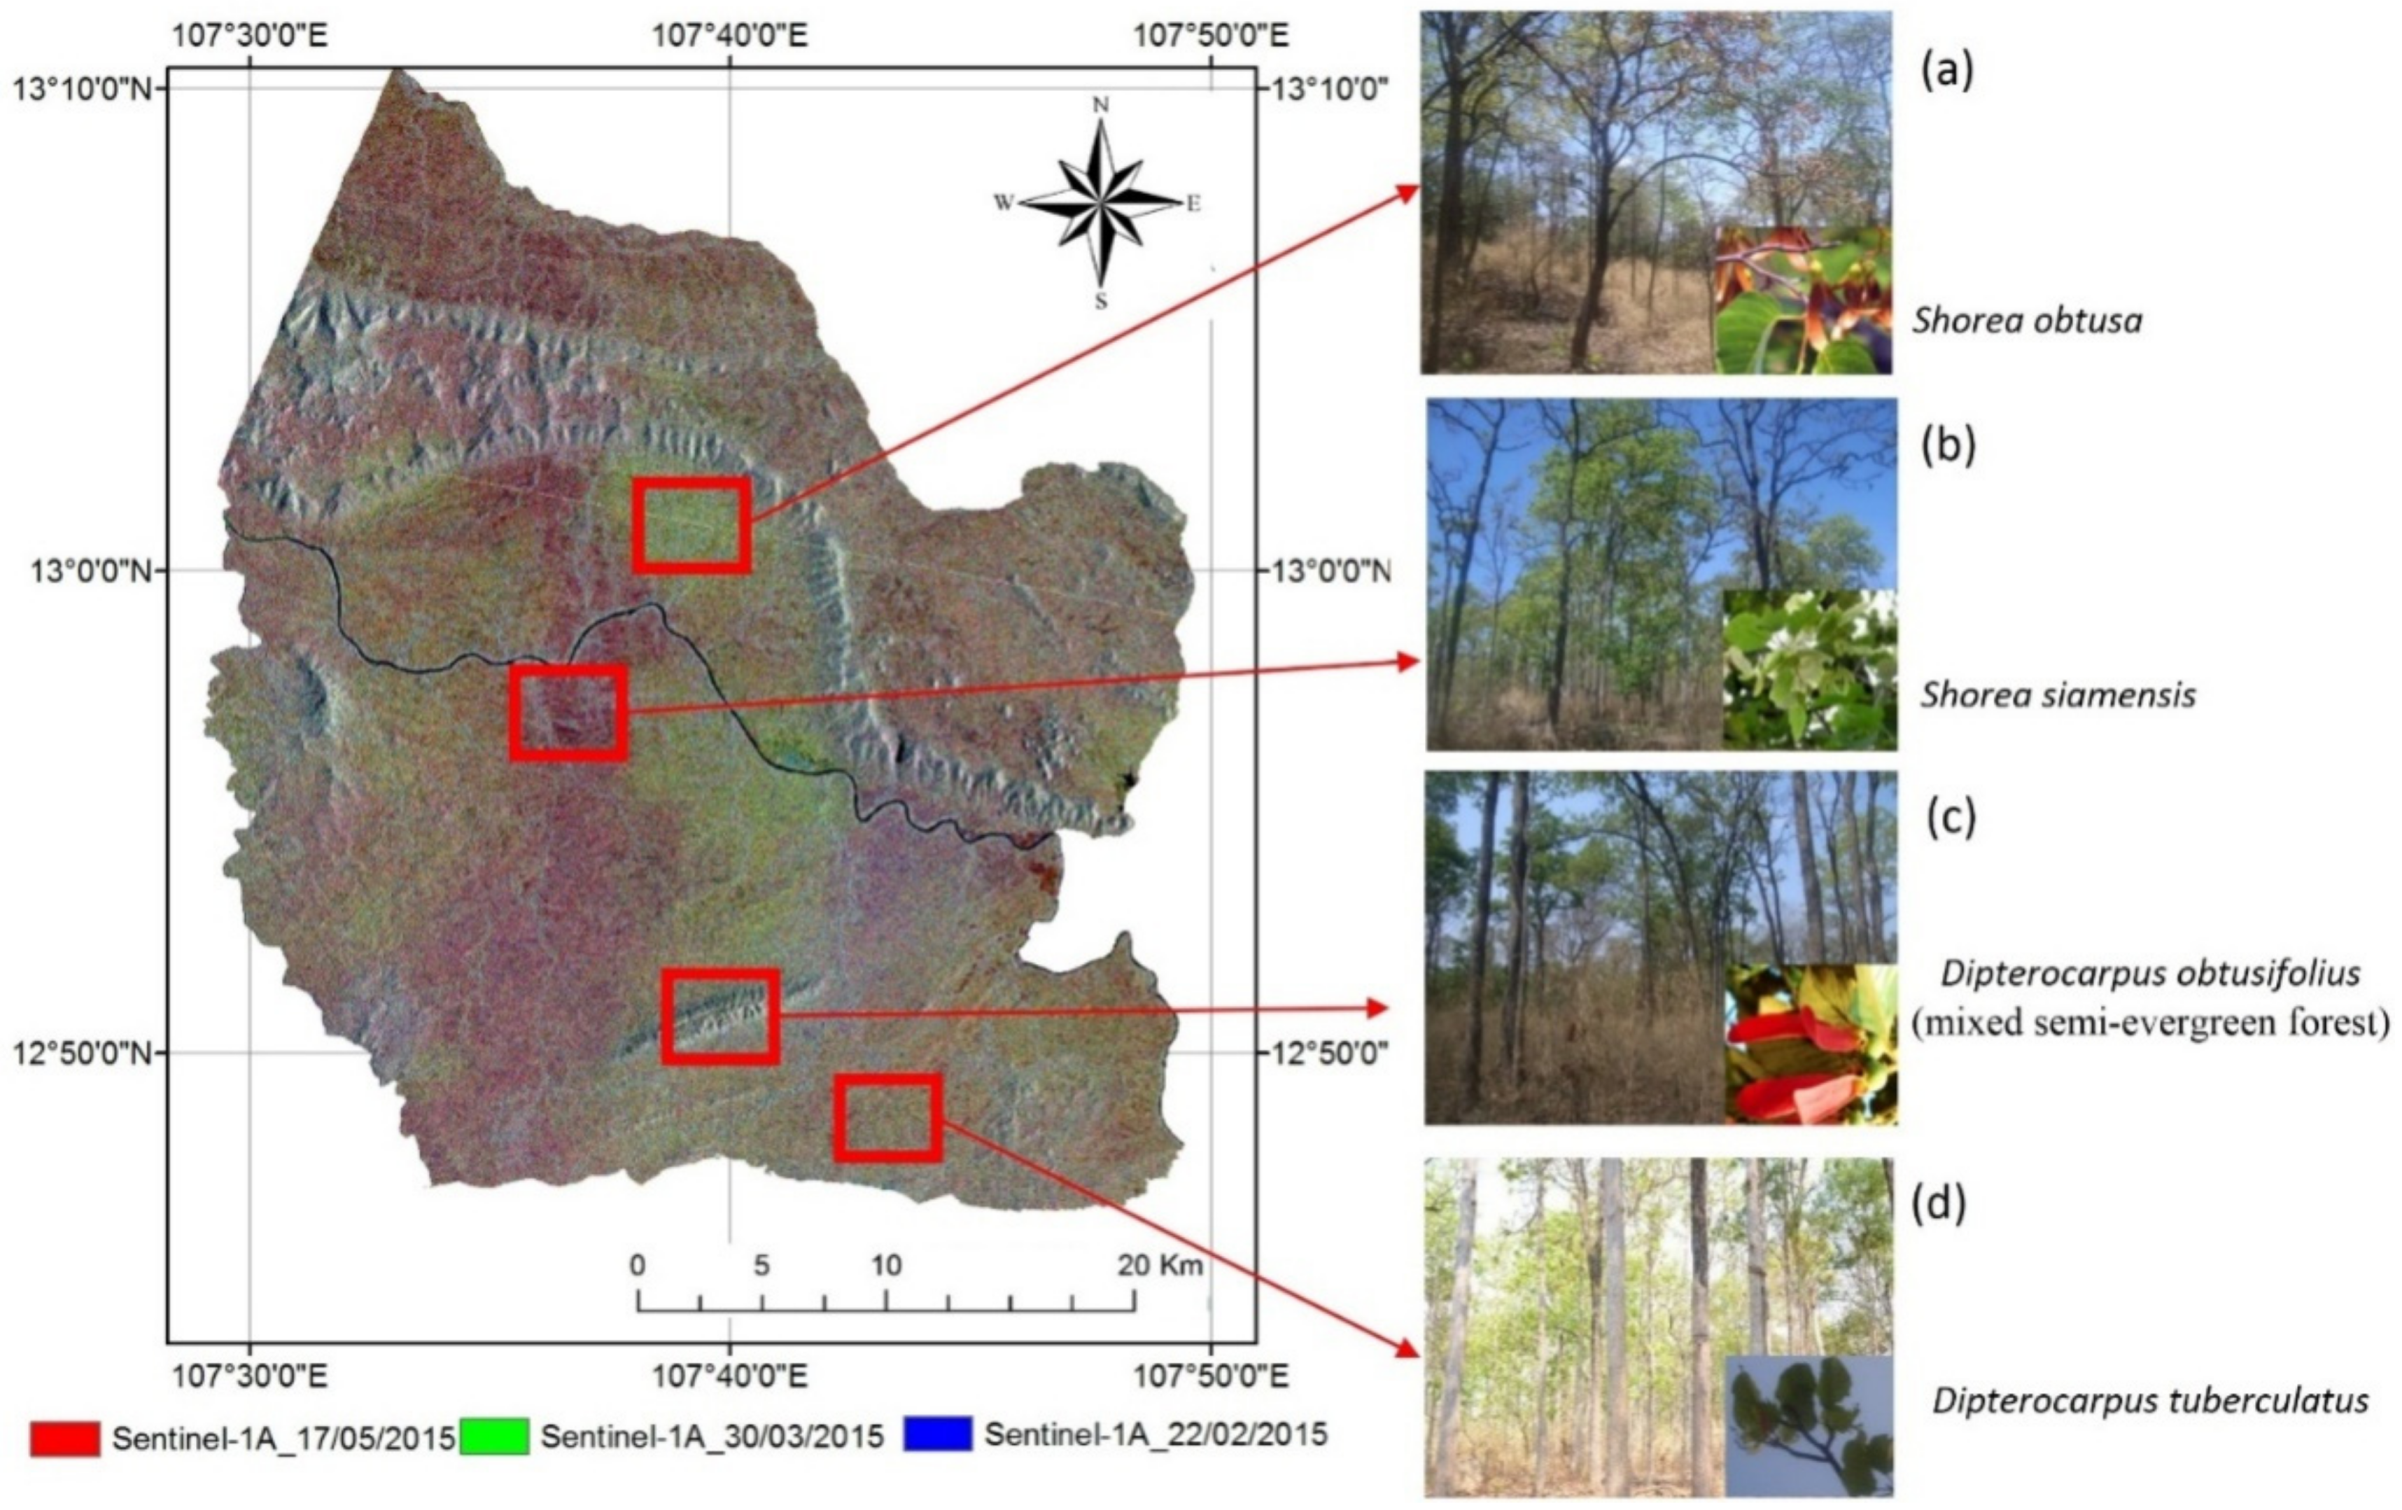
Yok Don National Park is one of the largest protected areas, situated in the Dak Lak and Dak Nong provinces, Central Highlands, Vietnam. It lies between latitudes 12°45′ and 13°10′ N, and longitudes 107°29′30′′ and 107°48′30′′ E (
Figure 1).
The total area is 115,545 ha, divided into three zones, including strict protection zone of 80,947 ha, ecological restoration zone of 30,426 ha, and administrative service zone of 4172 ha. The buffer zone covers an area of 133,890 ha, including the communes surrounding the national park. The terrain is relatively flat with an average elevation of about 200 m above sea level. In the study area, there are three peaks, including Chư M’lan (502 m), Yok Don (482 m), and Yok Da (466 m) mountains (
Figure 1). The average annual rainfall of the study area is less than 1600 mm. The climate in Yok Don is divided into two seasons, i.e., the rainy season from May to October and the dry season from November to April. The annual average temperature is about 24.5 °C with the highest temperature of the year about 37.5 °C and the lowest temperature at about 11 °C. The highest average temperature occurs typically in April and the lowest average temperature usually appears in January.
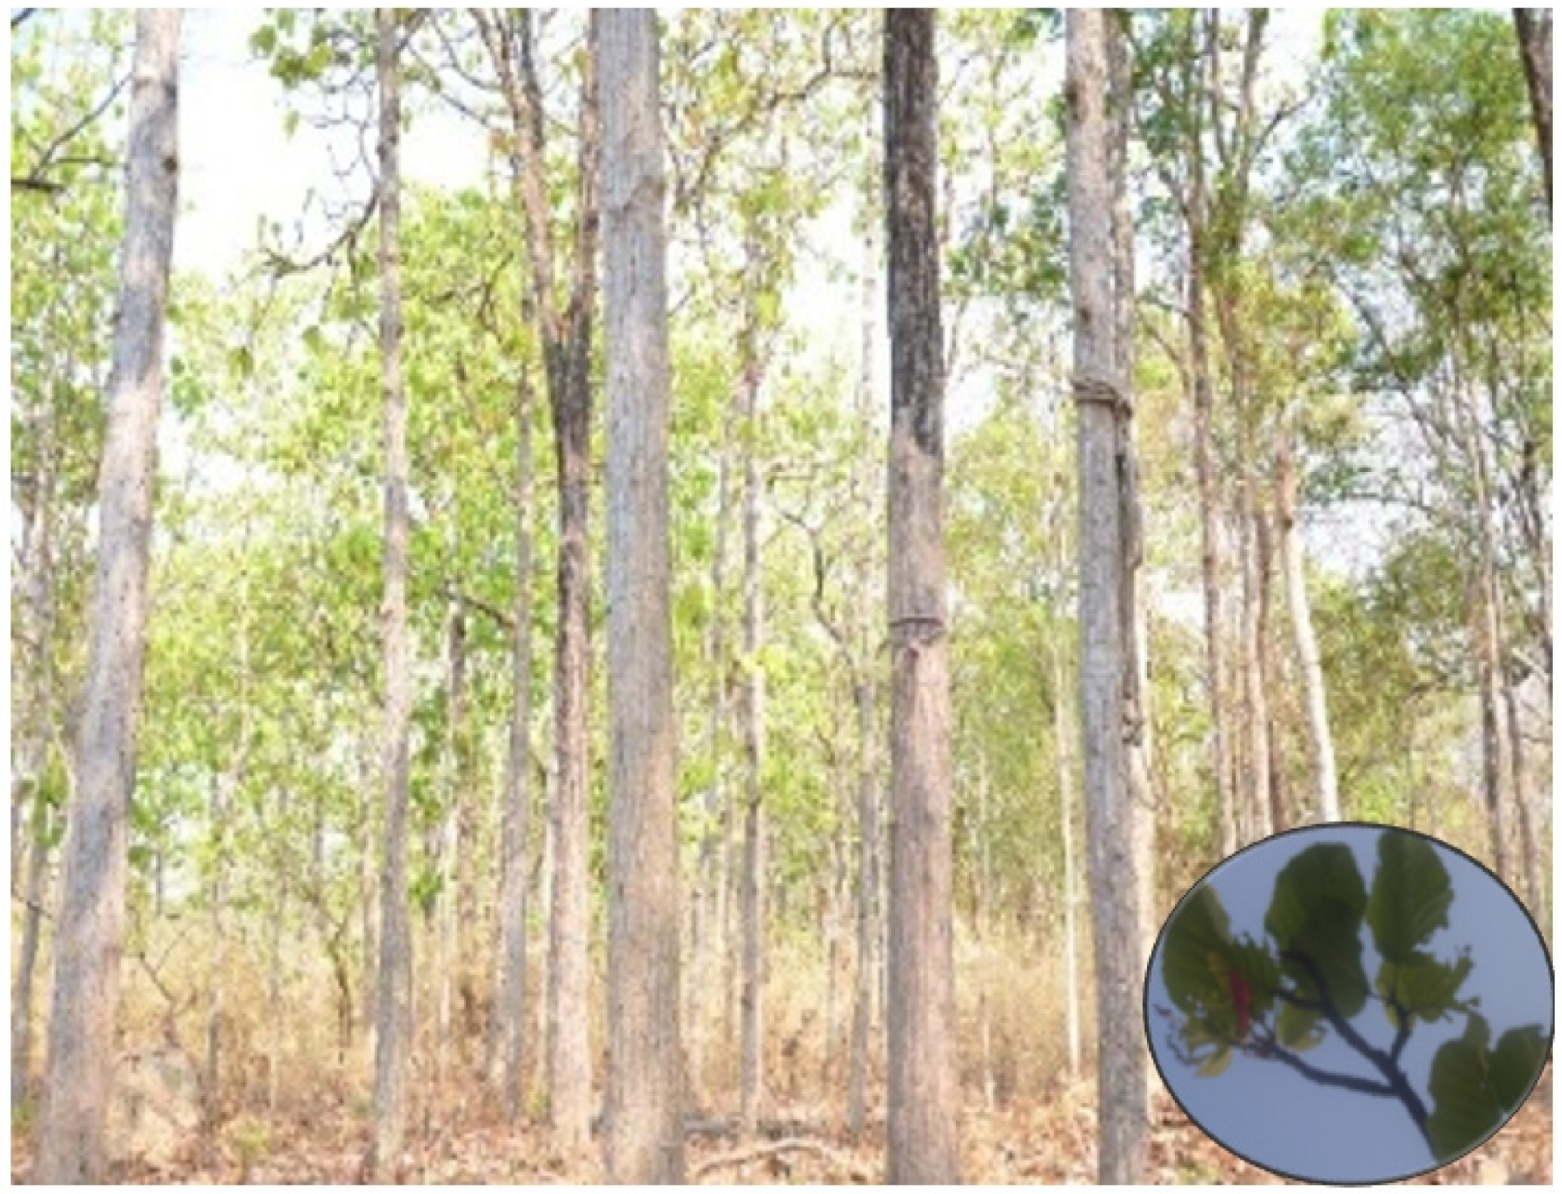
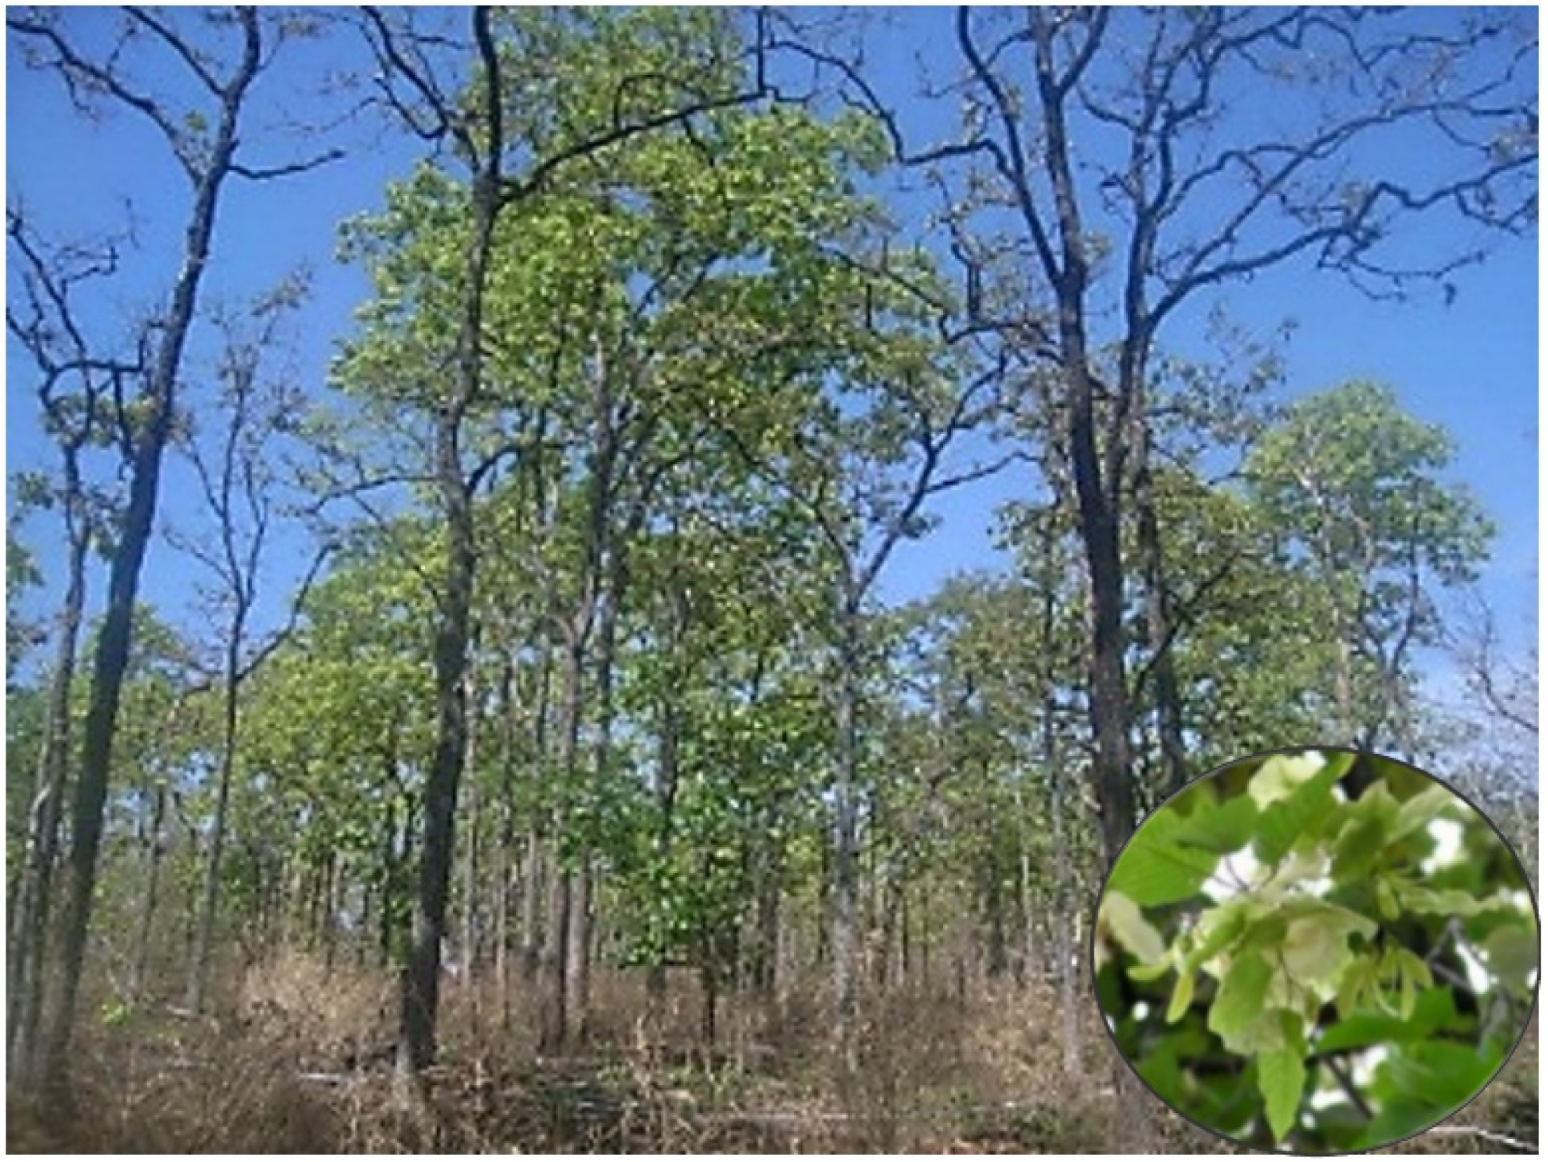
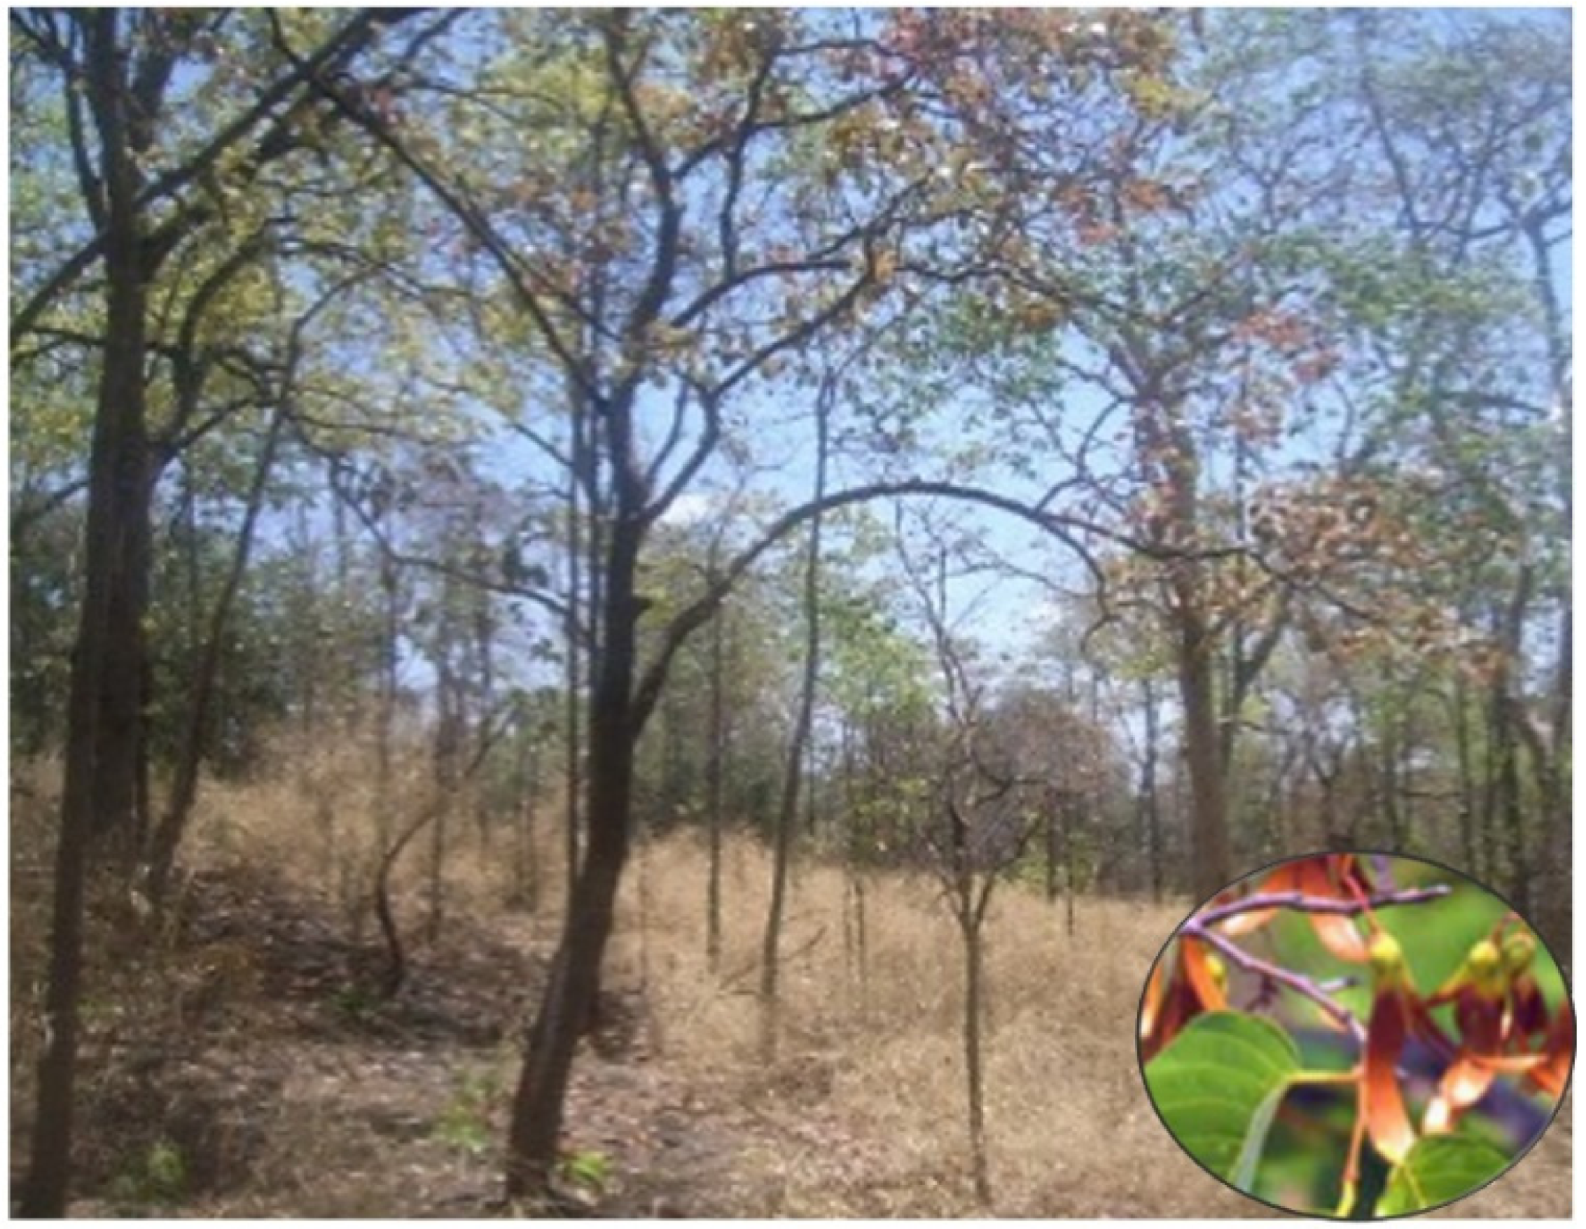
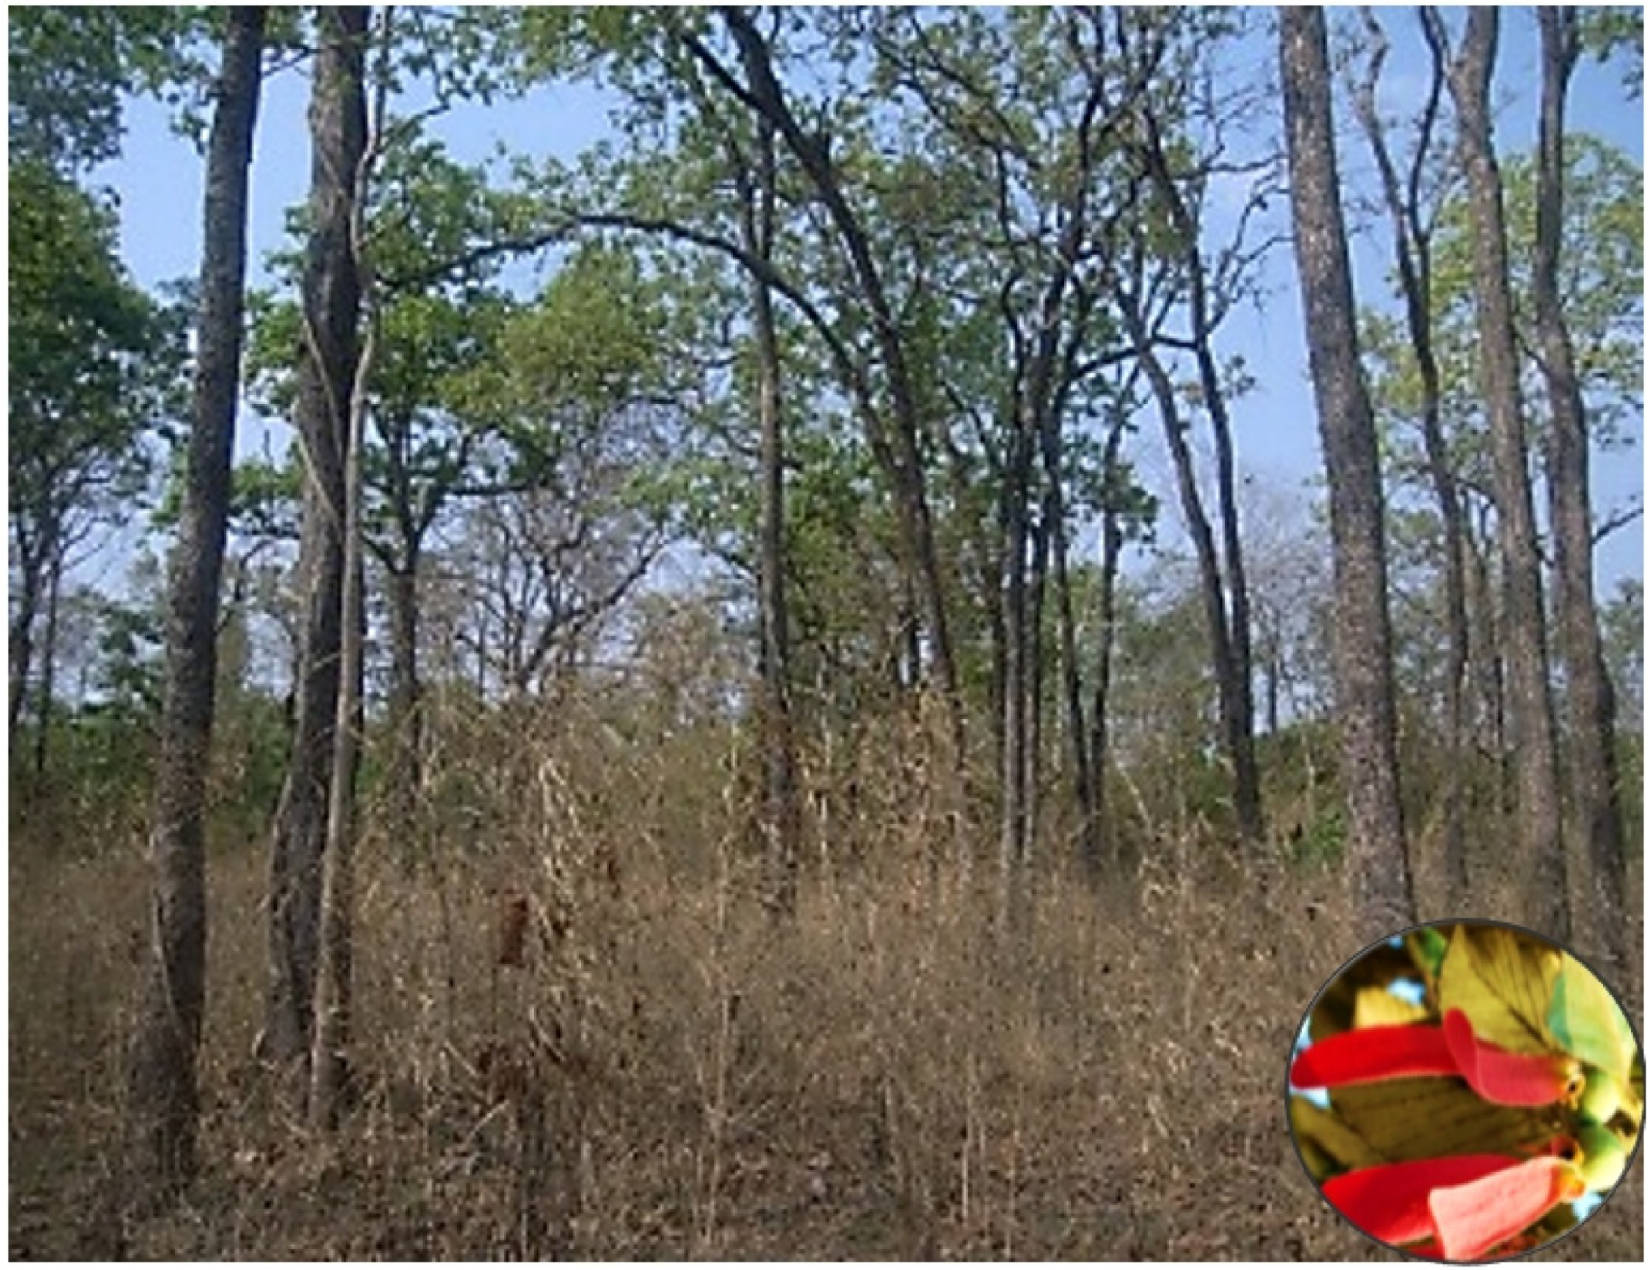
Yok Don National Park was selected as a test site with typical and conserved BDFs. Primary forest accounts for over 90% of the total area of the park, an ideal habitat for plant and animal species. Especially, Yok Don is the only area in Vietnam that preserves the forest type of dipterocarp forest (
http://yokdonnationalpark.vn). BDFs have large valuable timber species and nontimber forest products, such as oil and medicinal herbs, and they are habitats for animal groups. They play a crucial role in the livelihoods of many local ethnic minority communities. Yok Don National Park is one of the places to preserve the biodiversity of deciduous forests so that dominant species are relatively homogeneous and less affected by human activities and ecological succession, mainly based on natural habitats. Hence, it is a good site for testing multitemporal remote sensing data for studying the deciduous forest.
The vegetation within Yok Don National Park is mainly a combination of BDFs, semi-evergreen forests with a smaller evergreen forest area, which grows mainly on hills and along with watercourses. The BDFs primarily consist of members of the family Dipterocarpaceae, including
Dipterocarpus tuberculatus, Shorea siamensis, Shorea obtuse, and
Dipterocarpus obtusifolius Teijsm. ex Miq. [
39].
3. Materials and Methods
3.1. Satellite Data and Image Preprocessing
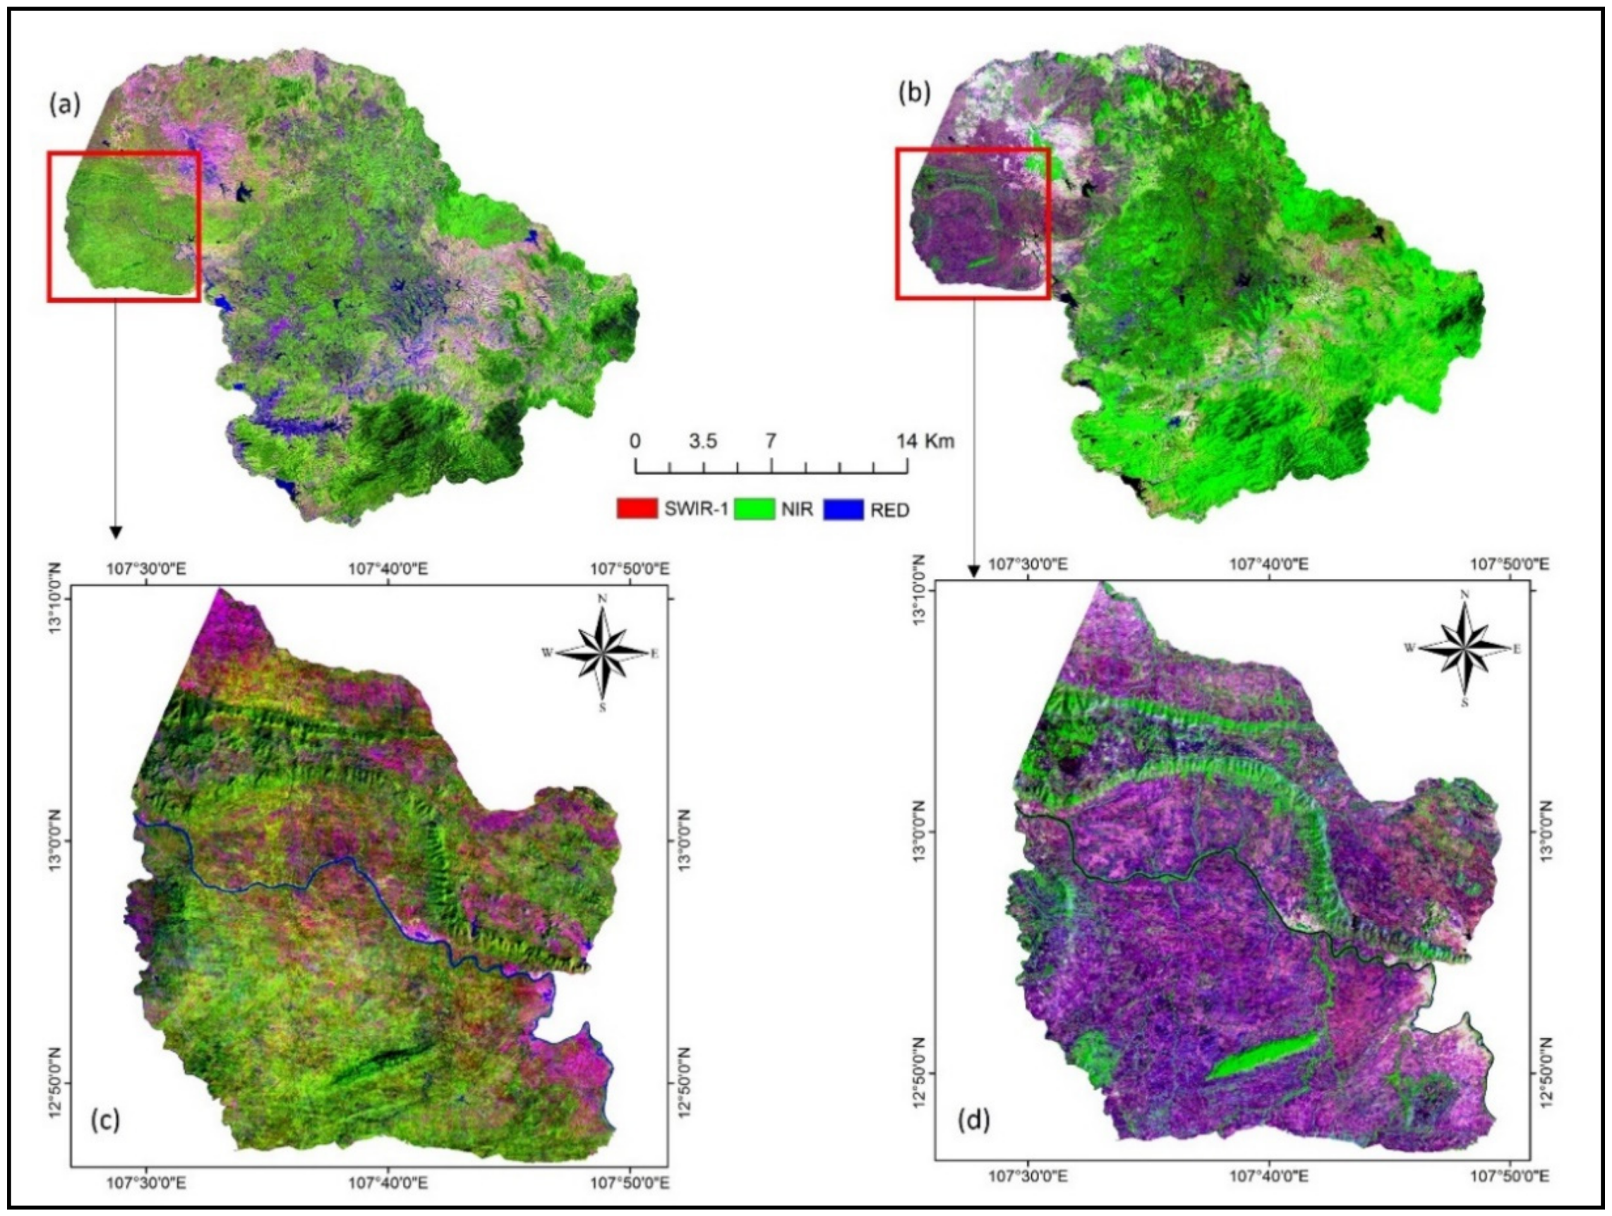
Due to the climatic and topographical features of Yok Don in the rainy season, clouds often occur and cause difficulties in obtaining cloudless images. Hence, we collected six scenes of Landsat 8 images in the dry season during the timeframe from January to March 2015 and 12 scenes of Landsat 8 images in the rainy season from June to October 2015 and from June to August 2016, as shown in
Table 1, to create a Landsat 8 cloud-free composite image for each season. The Yok Don National Park’s forest status was unchanged during 2015–2016 since it is strictly protected and forests have steadily grown.
The Landsat 8 images were preprocessed by using the Google Earth Engine (GEE) platform. The main processing steps include (i) acquisition of the surface reflectance product from the USGS, (ii) selection of the input target scene and reference scenes, (iii) detection of clouds and masking their shadow areas on the images, and (iv) replacing the cloud and cloud-shadow pixels on the target image with cloudless pixels from the reference image corresponding to their coordinates, which ensured that the output composite images were filled by cloud-free pixels to serve for image classification.
Figure 2 shows the result of the output composite images (red = SWIR1 band, green = NIR band, blue = RED band) of Landsat 8 over the study area.
Sentinel-1A provides active microwave data that are not affected by weather conditions, day and night. The repeat cycle of Sentinel-1A is 12 days. To classify the forest species, we selected nine scenes of Sentinel-1A monthly from February to December in 2015, as seen in
Table 2.
The Sentinel-1A dataset was used to classify deciduous forests based on differential backscatter values (dB) corresponding to the phenology of dominant deciduous species. Thus, it is necessary to have satellite images at the right time of the season to analyze seasonal variation of phenology and differences in forest species’ leaf regeneration. Therefore, we selected multiple scenes and chose one scene for each month. However, Sentinel-1A data in Dak Lak Province, Vietnam, were missing for some months, namely January, April, and June.
The multitemporal Sentinel-1A images are preprocessed by the Sentinel Application Platform (SNAP) toolbox provided by the European Space Agency (ESA). The preprocessing consists of the following steps: (i) calibrating data to sigma naught value (σ0), (ii) performing terrain correction by using the Shuttle Radar Topography Mission (SRTM) Digital Elevation Model (DEM), (iii) performing dB value conversion, and (iv) implementing multitemporal speckle filtering. In order to integrate the data for further analysis, all the images need to be in the same resolution and projection, so that all images were setup in the the WGS-84 UTM Zone 49N projection, and the Landsat images were resampled to be 10 m resolution, the same as the resolution of Sentinel-1A data.
In general, the study area’s terrain is relatively flat, so that we used the SRTM DEM with 30 m resolution for geometric distortion correction. It was found that only some hilly areas and mountains were affected by foreshortened slopes in the SAR image, which caused the brightness reflectance features on the image. Therefore, we had difficulties distinguishing the vegetation in the high mountains with Sentinel-1A. In contrast, the vegetation in the high mountains can be classified by using optical satellite images. We chose to classify the vegetation species in these mountainous regions by Landsat 8 OLI images to solve this difficulty.
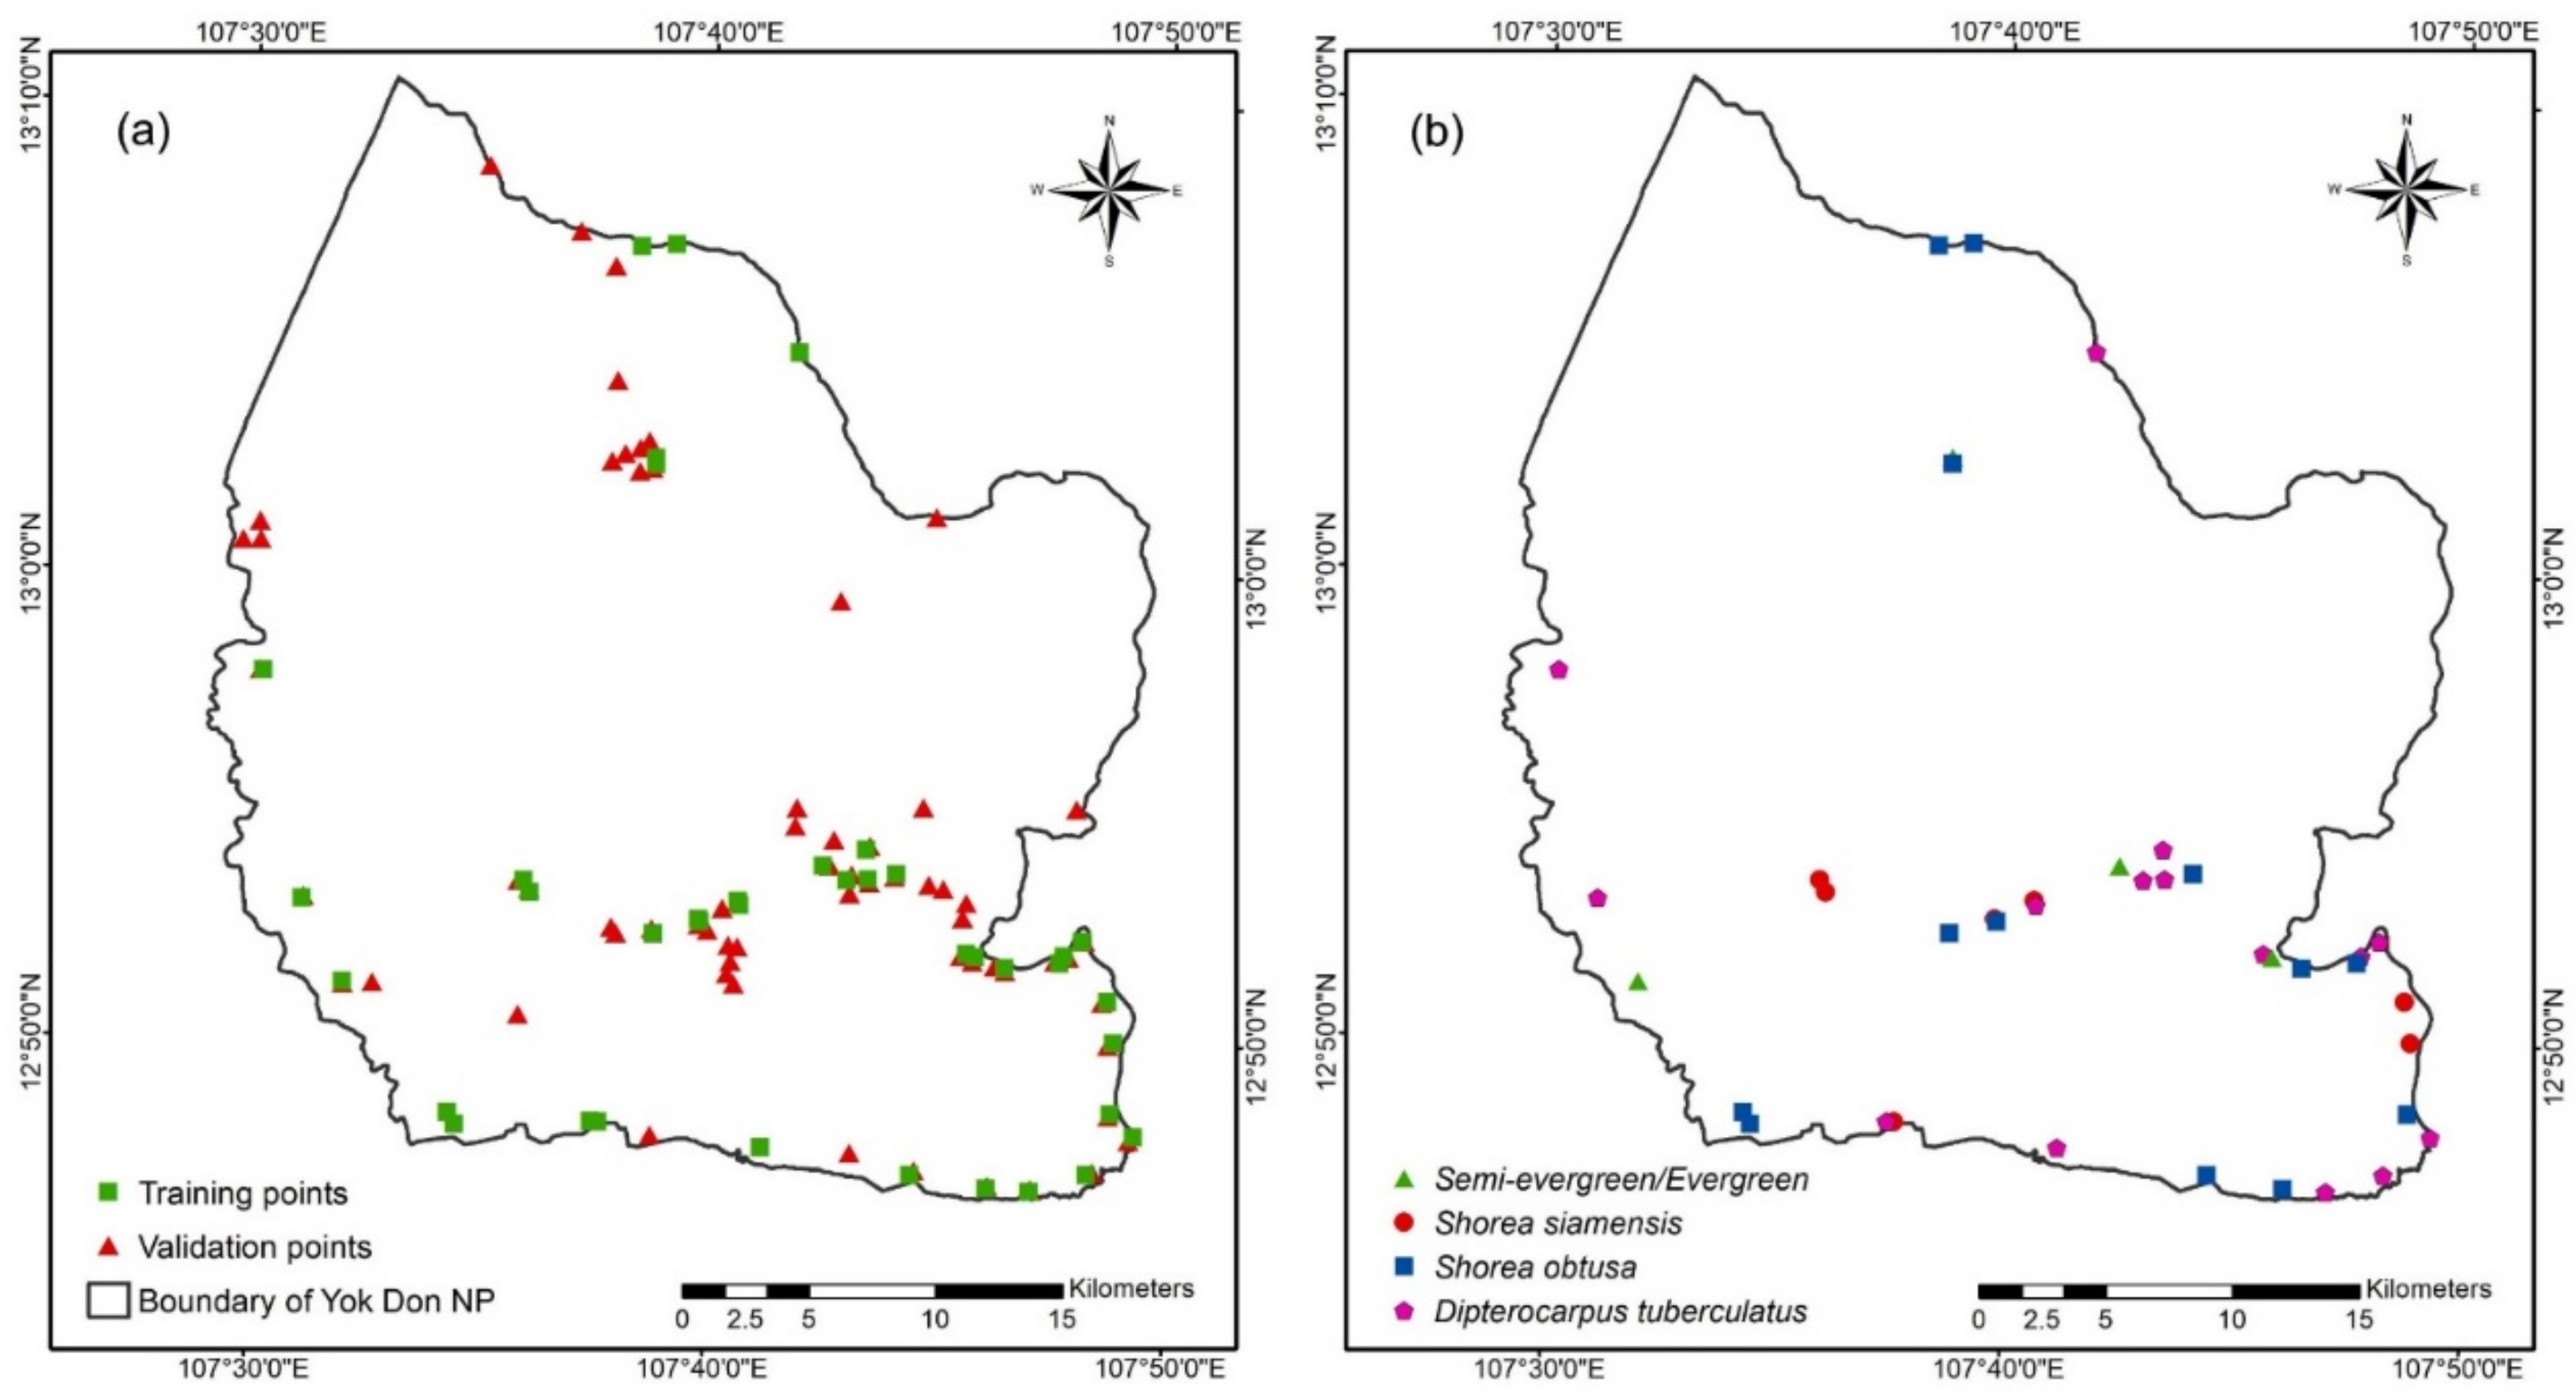
3.2. Field Survey Data
The surveying data collected at Yok Don National Park, Dak Lak Province, in April 2015 in the dry season were used for finding the dominant species of broadleaf deciduous forest and validating the result. One hundred and five plots (12 plots of semi-evergreen/evergreen forest, 15 plots of
Shorea siamensis, 36 plots of
Shorea obtusa, and 42 plots of
Dipterocarpus tuberculatus) were selected as shown in
Figure 3. Among them, 39 plots (four plots of semi-evergreen forest, 8 plots of
S. siamensis, 13 plots of
S. obtusa, and 14 plots of
D. tuberculatus) were used for training and 66 plots were used for validation of the classification result. Each plot size covers an area of 20 m × 20 m. In each sample plot, we collected parameters, including specimen, tree height, tree diameter at breast height, vegetation type, number of individuals and cover that represent the main dominant species (or broadleaf deciduous forest) plots, and their coordinates. The selected plots had to represent the main dominant species, spatial distribution, density, and structure. The distance between plots was usually chosen to be at least 200 m and the location at least 100 m close to the other dominant species.
In order to determine certain forest states in which species are dominant in a plot, the basal area was applied for this study [
40]. The basal area is one of the chief characteristics determining dominance and nature of the community. It refers to the ground actually penetrated by the stems. Basal area can be measured through:
where
BA is basal area and
RBA is relative basal area. Thus, in plots, the species with the largest
RBA will be the dominant species.
3.3. Methodology
3.3.1. NDVI Images
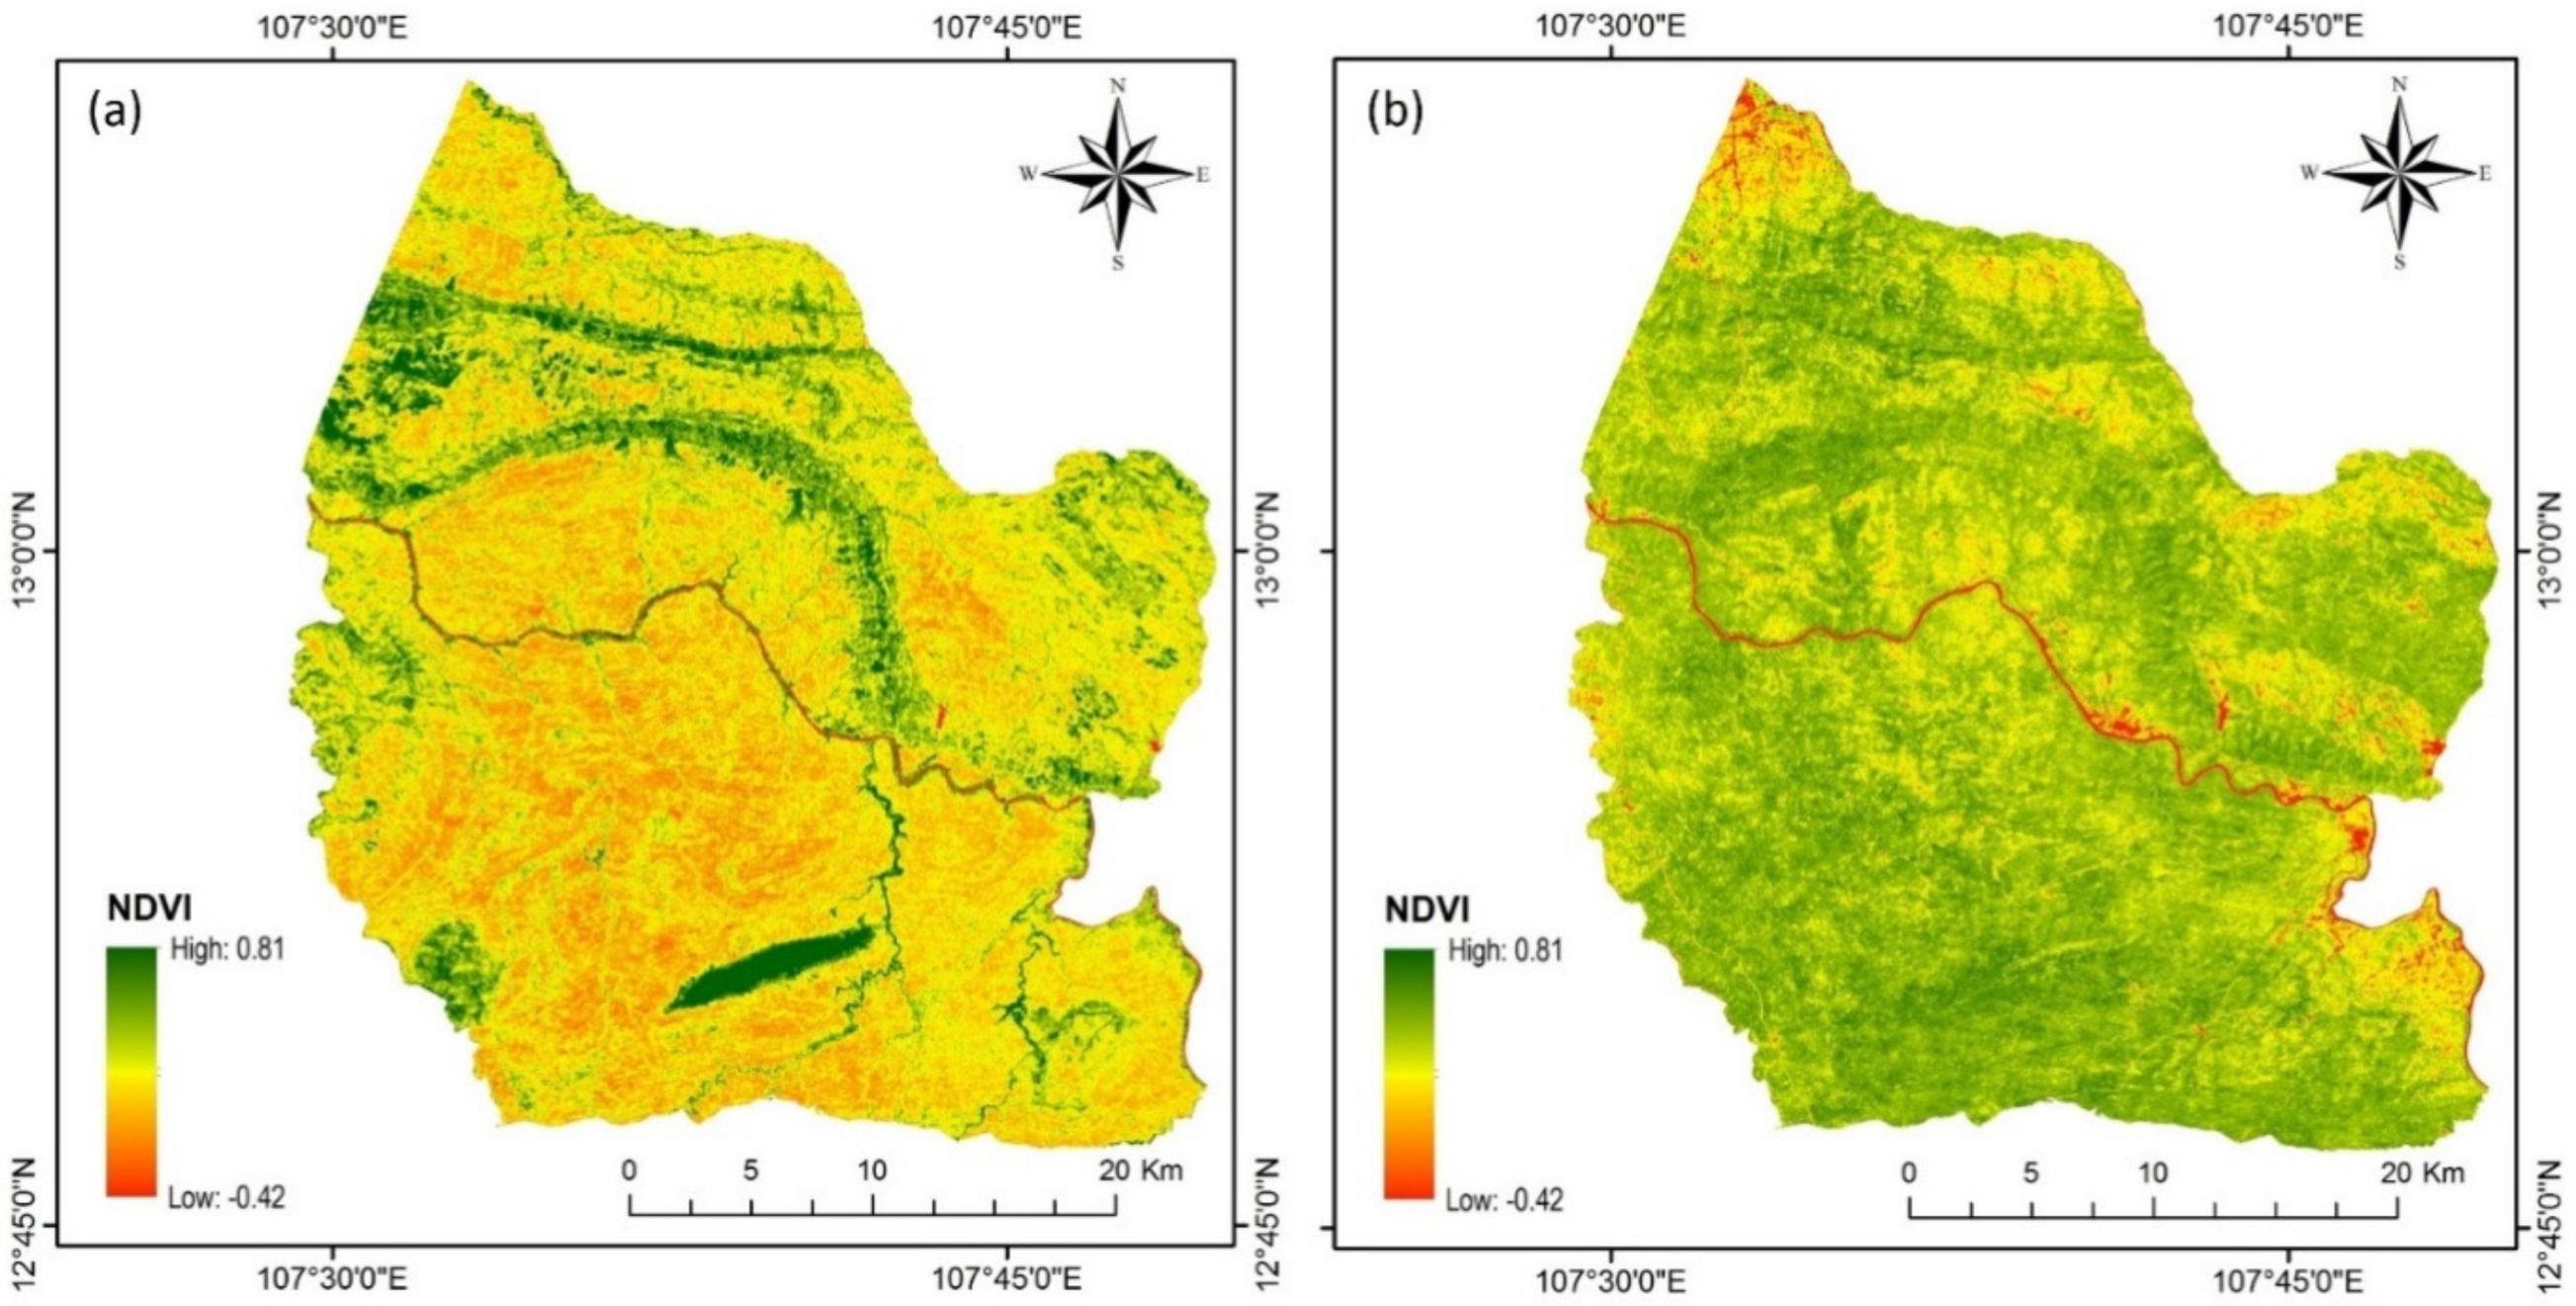
NDVI images were generated from Landsat 8 cloud-free composite images for the dry and rainy seasons, as shown in
Figure 4. The formula for determining NDVI is shown in Equation (3):
where
is the surface reflectance value of the near-infrared band and
is the surface reflectance value of the red band of Landsat images.
NDVI is one of the widely used indices for image classification, monitoring, and rapid assessment of forest quality [
5,
10,
18,
20,
21,
28]. The highest NDVI values correspond to dense vegetation, such as evergreen forests, deciduous trees in the rainy season, or crops at their peak growth stage. Based on the characteristics of the growth, deciduous forest and evergreen forest can be extracted by the difference in NDVI values between the dry and rainy seasons.
Figure 4 shows NDVI values significantly vary between two phenology periods. In the study area, the dry season starts in November and ends in April of the next year, while the rainy season starts in May and ends in October. The time of significant leaf regeneration is from June to October of the year. The NDVI image can discriminate between evergreen and semi-evergreen forests in the dry season because the NDVI values of evergreen forests are much higher than those of the BDFs and the other vegetation types. Evergreen and semi-evergreen forests are typically distributed in the mountains, on steep slopes, and next to streams or rivers crossing the national park. However, BDFs can be easily mixed with barren land, shrubs, and dried water surface. Thus, it is infeasible to classify them even if only the NDVI image in the dry season is used. On the other hand, NDVI values of vegetation in the rainy season are significantly high and can be easily identified from the other land cover types, such as water and other bare lands. Nevertheless, it is challenging to discriminate between evergreen forests and semi-evergreen forests with BDFs because all types of vegetation in this season grow healthy. Therefore, the combination of NDVIs in the dry and rainy seasons is proposed to resolve the difficulties. Then, the evergreen and semi-evergreen forests, BDFs, and water can be classified by optical images.
3.3.2. Determining the Dominant Species of Broadleaf Deciduous Forest Using Multitemporal SAR Images
The dominant species of DBFs were defined on Sentinel-1A color composite image (where red = images acquired on 17 May 2015, green = images acquired on 30 March 2015, blue = images acquired on 22 February 2015), as shown in
Figure 5. February and March is the timeframe for BDF leaves falling, while May is the time for them to revive. The difference in leaf cover of the dominant species during this time period led to the change in the backscatter values on SAR images and the color of the composite image. Analysis of unchanged areas indicates that the combination color is white or black, corresponding to semi-evergreen or evergreen forest and water. Semi-evergreen or evergreen forest is mainly distributed in high mountains or near the Srepok River. In contrast, the locations of deciduous forests are colorful.
Figure 5 shows the main dominant species in Yok Don, which appear in different colors on the composite image.
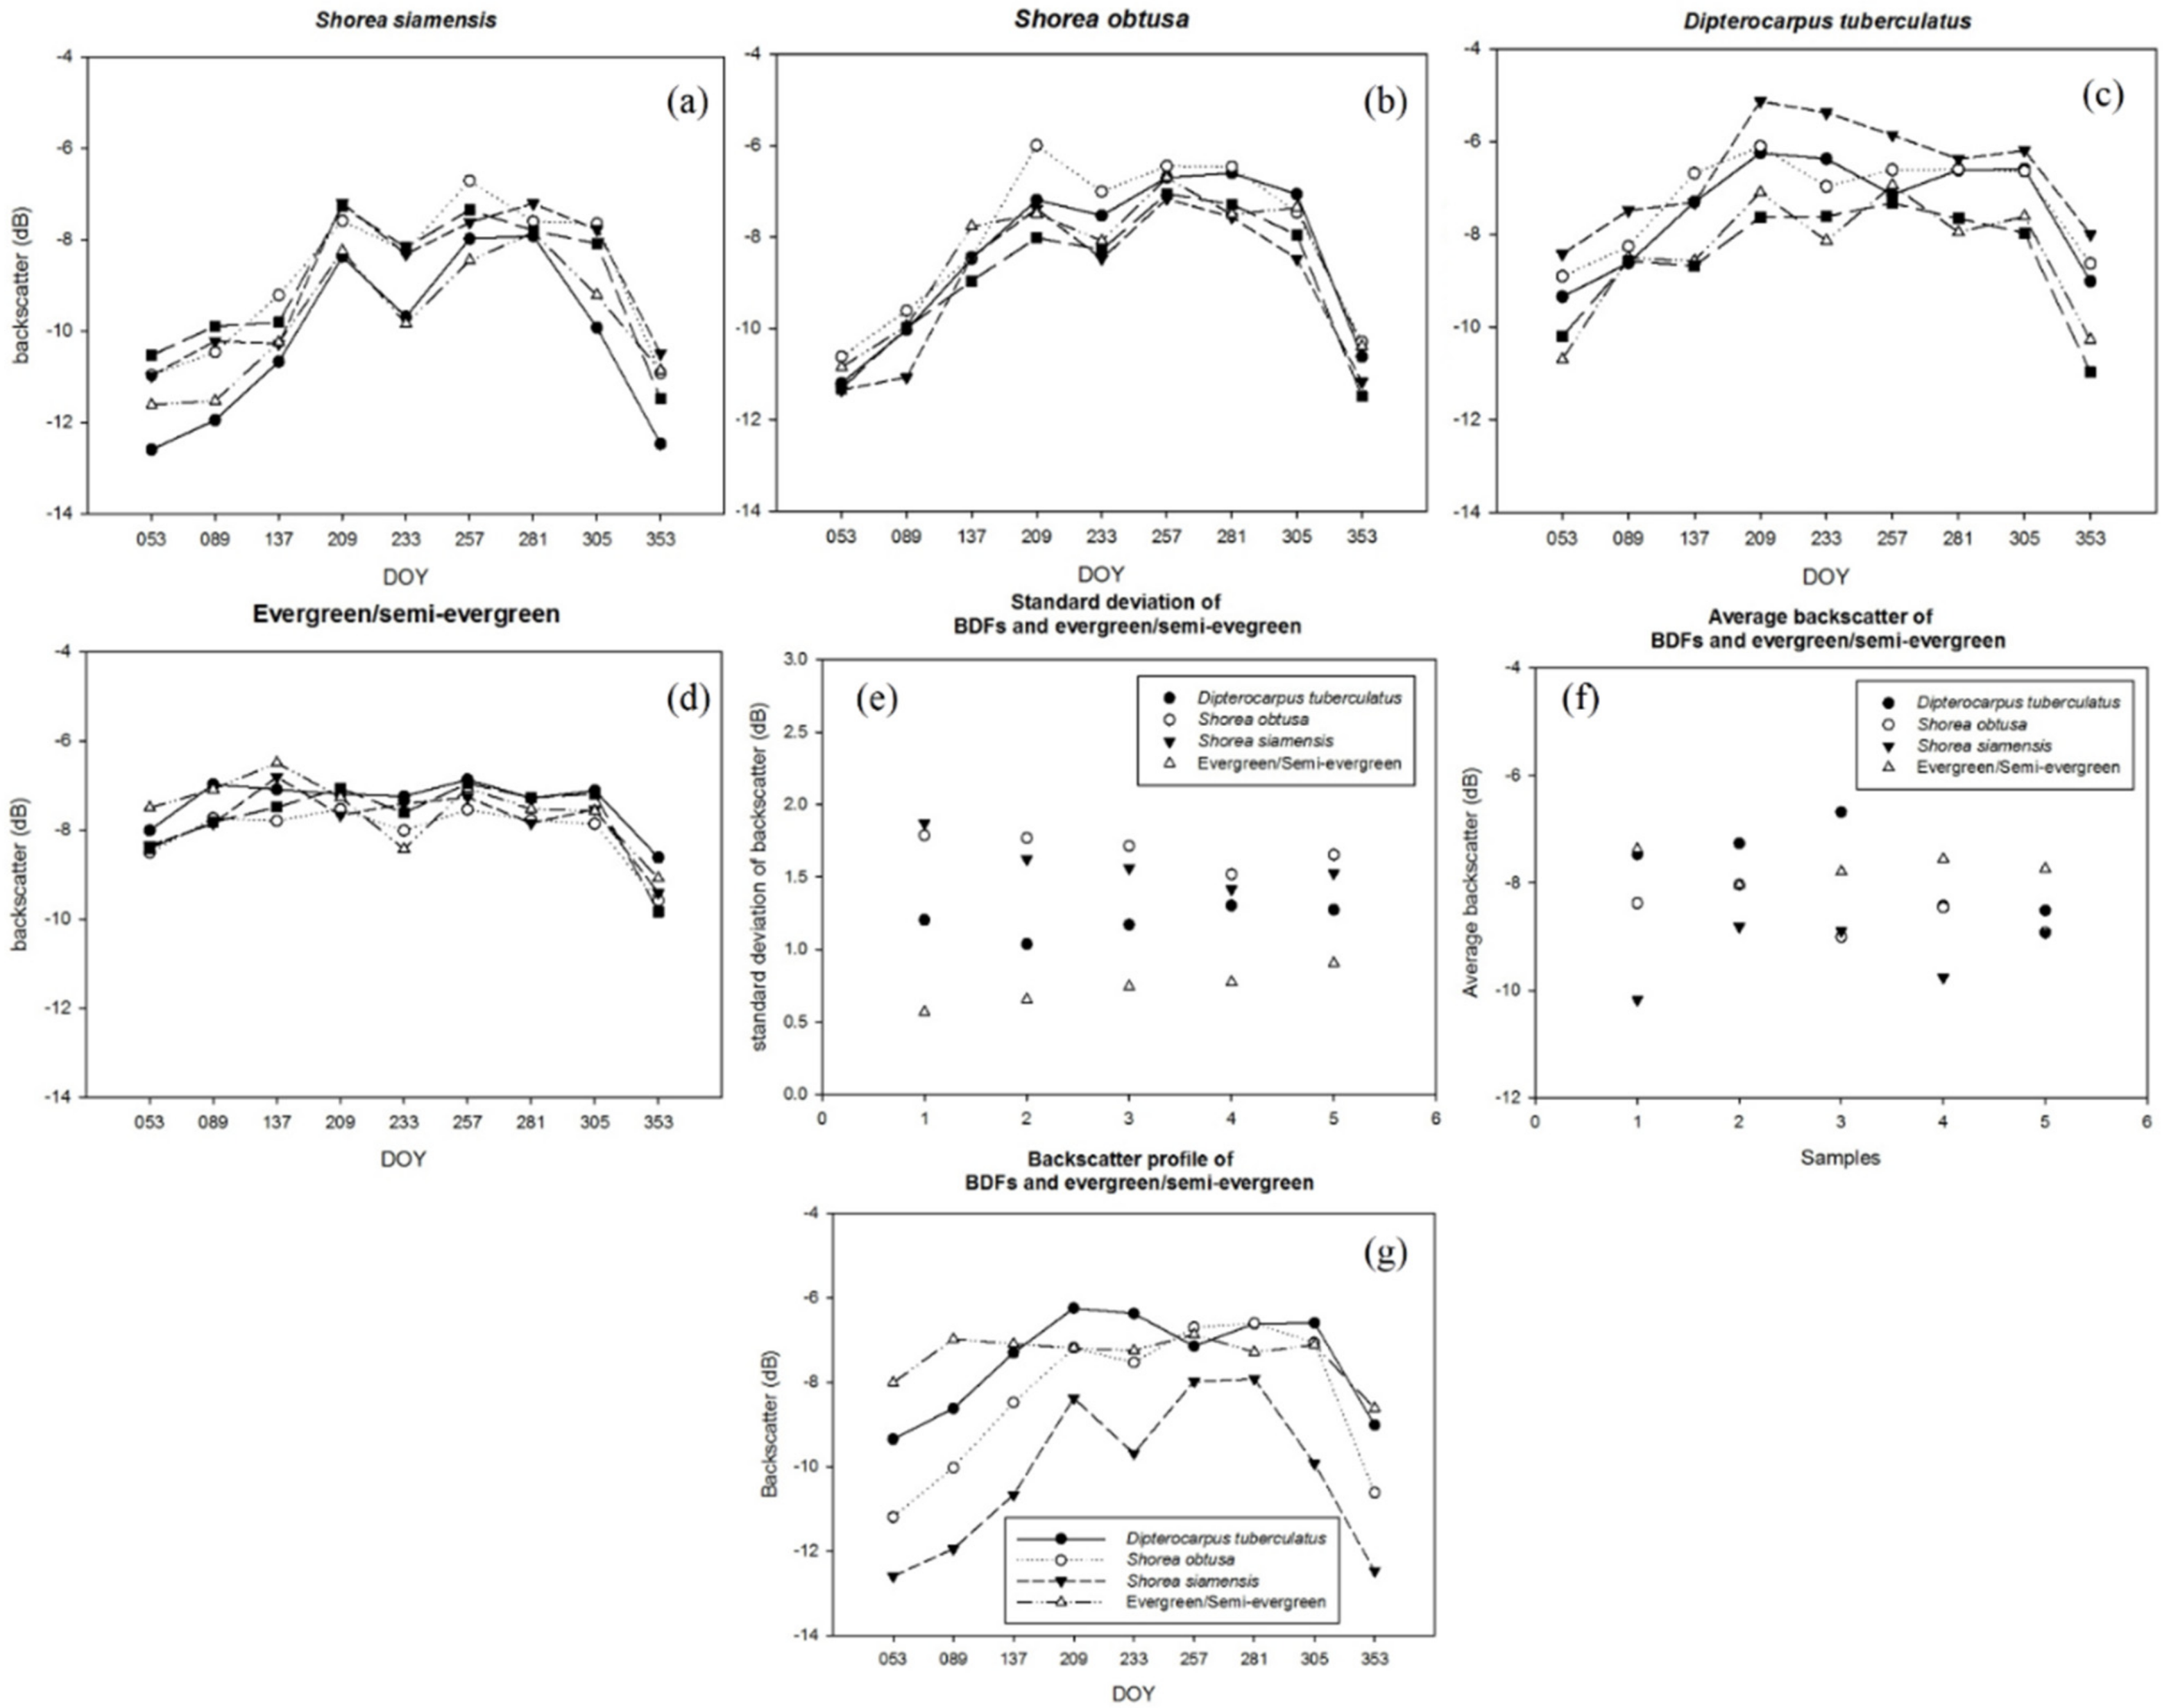
Backscatter values correspond to the growth process at appropriate locations of the deciduous species on multitemporal SAR images, as shown in
Figure 6. It can be clearly seen that
Figure 6a–c show the low peak backscattering values in the interval of Date of the Year (DOY) 233 (Day Of the Year of the Julian calendar), the middle of August, and the heaviest rainy time of the year, while
Figure 6f,g exhibit the differences in standard deviation and average backscatter values of BDF and semi-evergreen forest. The standard deviation of semi-evergreen was lower than that of BDF species because there was no change in the backscatter value of semi-evergreen in the period. As a result, the color in the composite multitemporal SAR images of the semi-evergreen area is gray (
Figure 6c). In contrast, standard deviations of BDF species were higher, and the average values were lower than semi-evergreen because backscatter signals in SAR image depend on the phenology of trees, ground moisture, and stand structure.
Semi-evergreen forest and deciduous forest can be interpreted by standard deviation and composite RGB of multitemporal Sentinel-1A images. Features of BDF species were classified based on the field surveying data and the correlation between backscatter values of BDF patterns on multitemporal SAR images and the phenology of deciduous species in Yok Don National Park within the deciduous forest classified area. Because of elevation in this area,
Dipterocarpus obtusifolius is mixed with semi-evergreen or evergreen. BDF1, BDF2, and BDF3 are assigned as
Shorea siamensis,
Shorea obtusa, and
Dipterocarpus tuberculatus, respectively.
Figure 6g shows the growth of deciduous species with the low peaks of backscatter values in fall leaves in February, March, and December because flora status at this time is mainly grass and shrubs. May and July are the times of deciduous tree leaves to bud, with leaves reaching a peak in September. Accordingly, the backscatter signal increases in May and reaches its peak in July to September.
In
Figure 6g,
S. siamensis has the lowest backscatter value compared with the other deciduous species because
S. siamensis grows in dry land and sparse shrubs.
S. obtusa has a similar phenology with
S. siamensis, as shown in
Figure 6g. Nevertheless, average backscatter values were higher for
S. obtusa than
S. siamensis. As a result, the mean backscatter value in May was a condition to distinguish
S. siamensis and
S. obtusa.
Figure 6c shows that
D. tuberculatus is heterogeneous with many differences among plant species.
D. tuberculatus, which distributes near the bottom of the mountains, has a high density so that the backscatter values are higher than those of the others. Therefore,
D. tuberculatus was classified by average backscatter values of February and March (
Figure 6g).
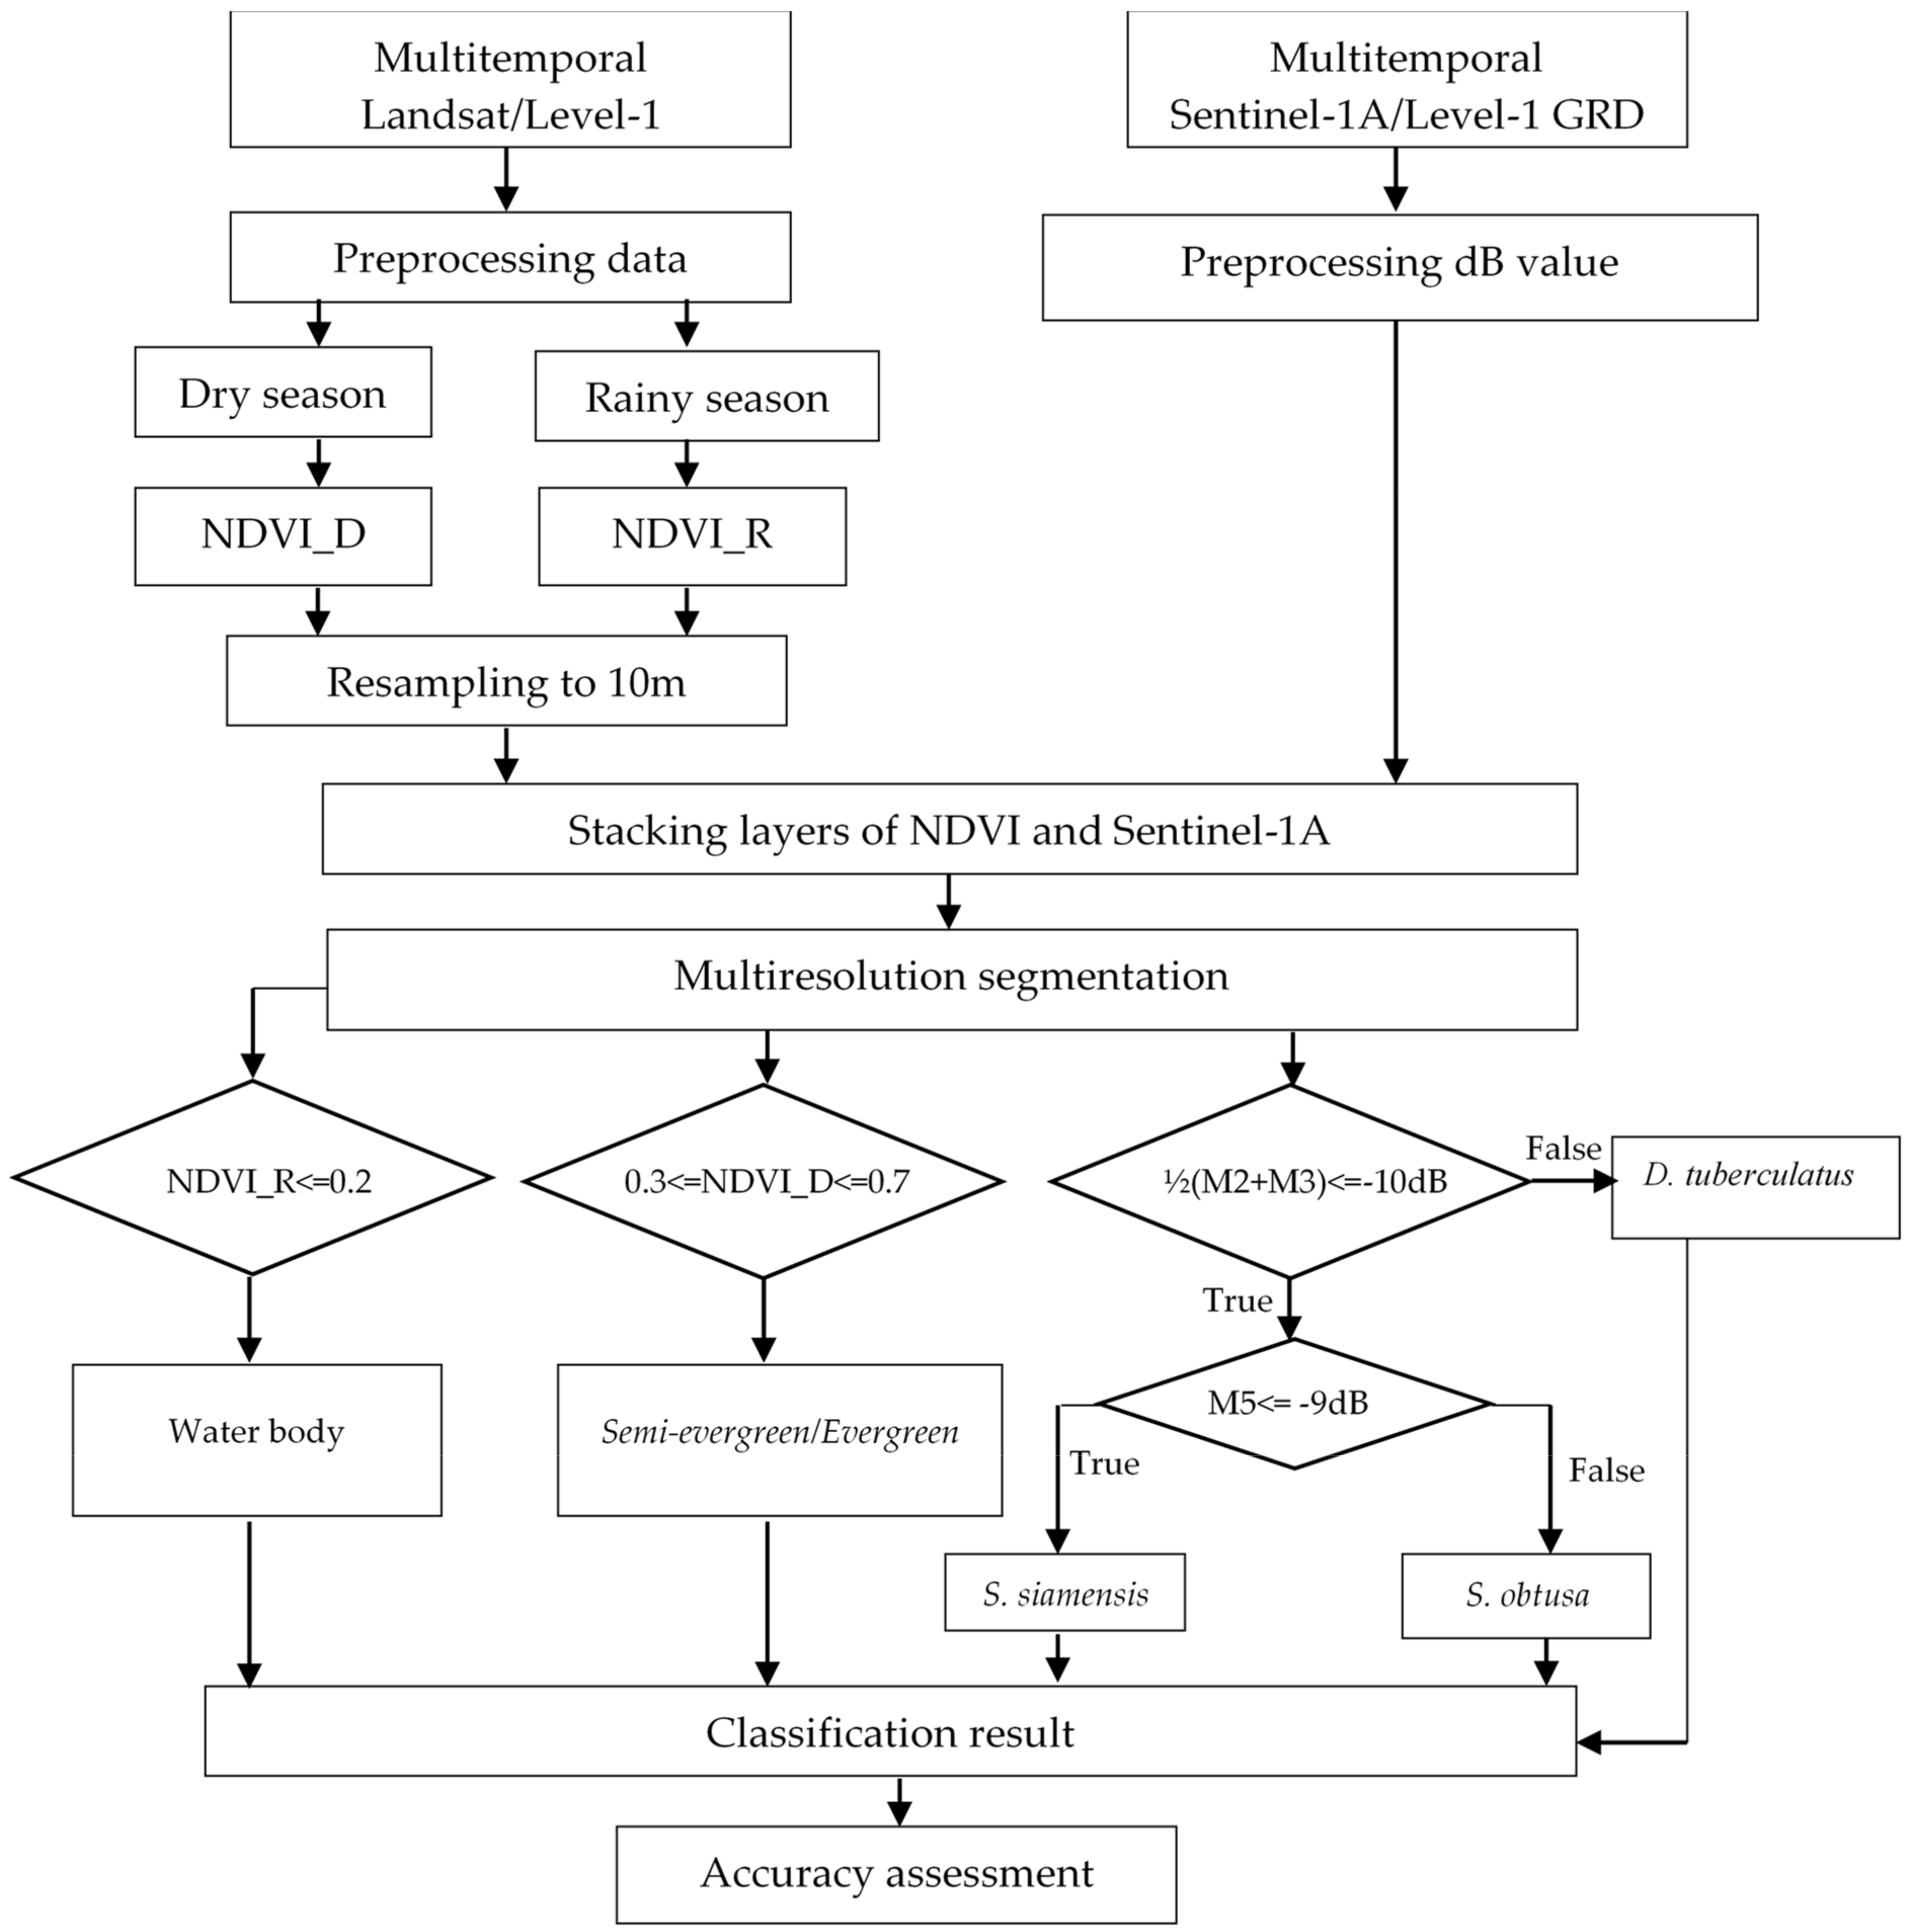
3.3.3. Proposed Method
Based on the difference in NDVI values between dry and rainy seasons and the correlation between backscatter values of multitemporal SAR images and family
Dipterocarpaceae growth, we propose an object-based classification scheme as shown in the flowchart given in
Figure 7.
The classification process was conducted through two main steps: (i) segmentation of 11 bands (including two bands of NDVI images and nine bands of Sentinel-1A images) to define the homogenous objects based on their spectral properties, and (ii) using the threshold of mean values of each homogeneous pattern to classify each object.
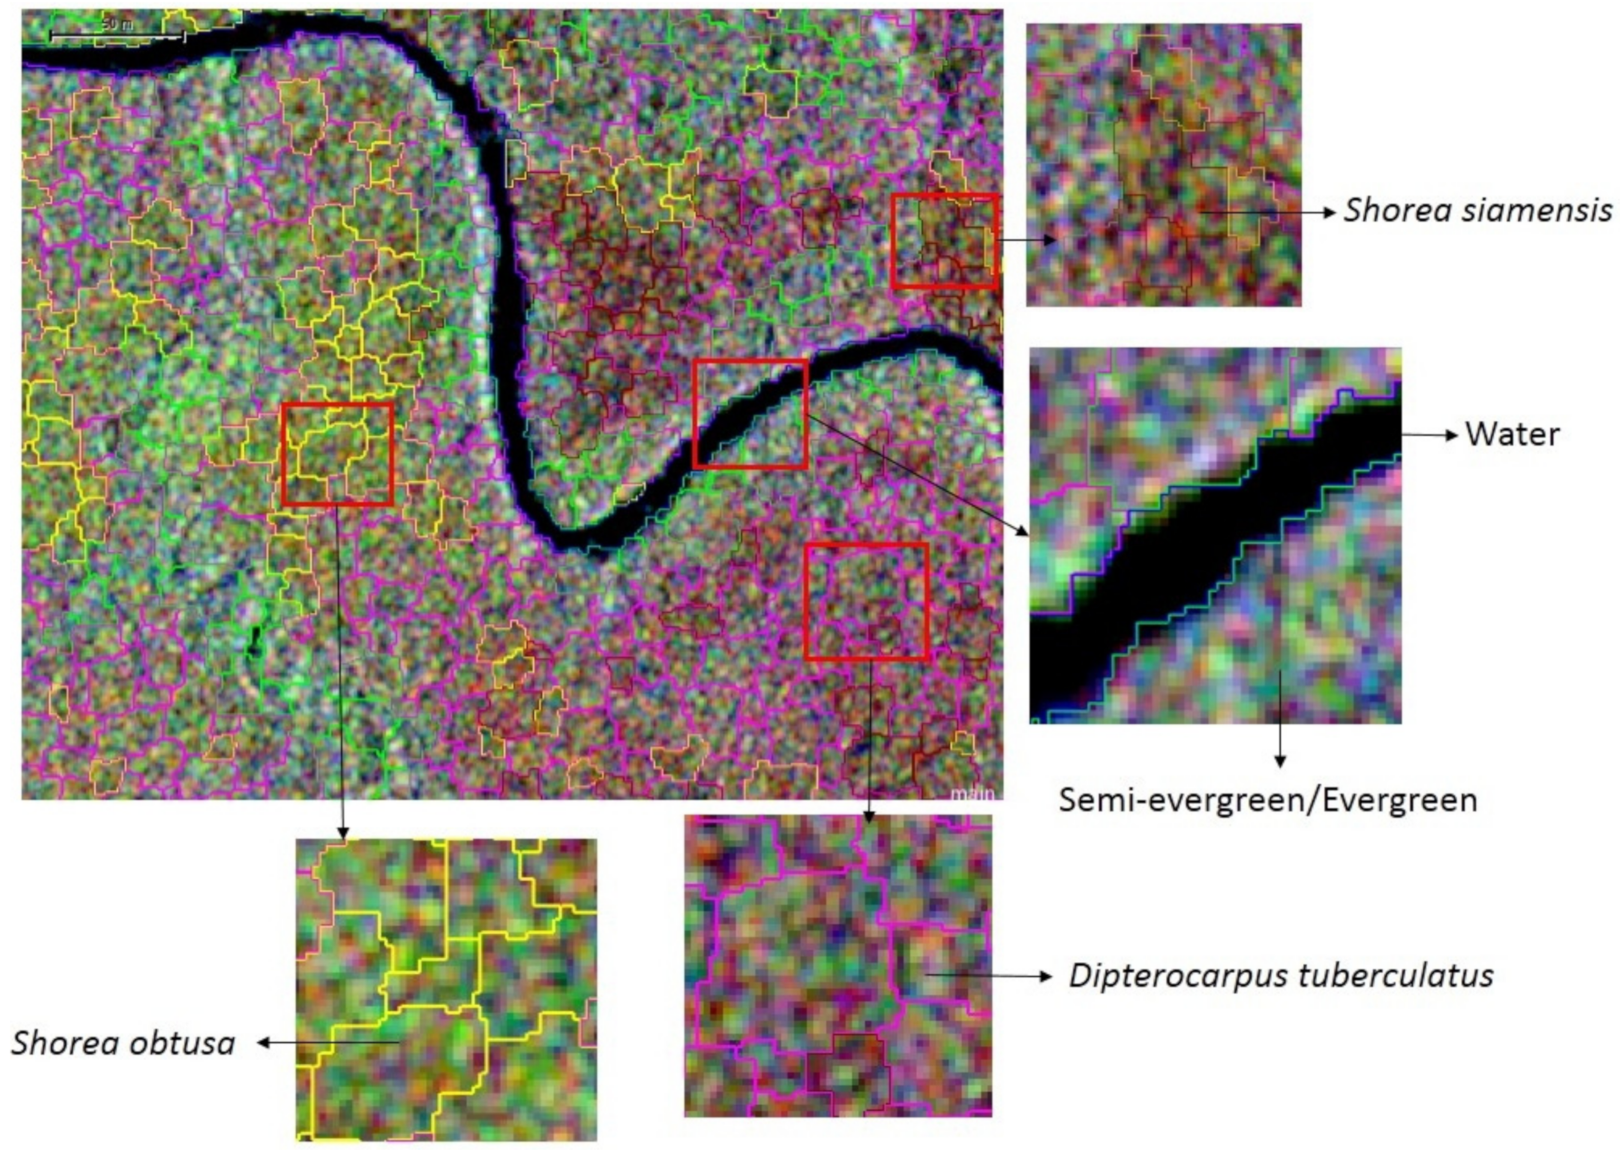
First, we tried to identify homogeneous patterns using multiresolution segmentation algorithms based on NDVI images and time-series Sentinel-1A images. Numerous experiments were conducted with different segmentation parameters in the multiresolution segmentation algorithm: (i) keep the same weight of all bands, (ii) scale the parameter to be 10 corresponding to the 10 m spatial resolution of the experimental materials, (iii) change the shape and compactness parameters. Numerous scripts were applied to determine the parameters of the multiresolution segmentation algorithm. Results were compared with reference data and expert knowledge. Final parameters of the multiresolution segmentation algorithm were selected: scale parameter, 10; shape, 0.4; compactness, 0.8; and the same weighted image channels. The homogeneous pattern’s segmentation is shown in
Figure 8.
Water, semi-evergreen forest, and evergreen forest were classified by comparison of NDVI values for both dry and rainy seasons. BDFs were classified by the differences between average of backscatter values of multitemporal Sentinel-1A images in February, March, and May. February and March have extremely dry weather and are the time of family Dipterocarpaceae leaves falling. May is the time of regeneration of the family Dipterocarpaceae. It can be seen from
Figure 6a–c from July onwards that the BDF leaves strongly regenerate, and the BDFs in this time look like evergreen forests because of higher backscatter values of BDFs, which are similar to backscatter values of evergreen forests. Therefore, we choose the three most typical moments of deciduous trees, including the time of entirely deciduous (February and March) and when the trees start to regenerate leaves (May) to distinguish the three dominant BDF species. The threshold values are shown in
Figure 7.
Broadleaf deciduous forests in Yok Don are also known as Dipterocarpaceae family by low density. Their canopies do not intersect. During the dry season, the leaf falling duration of BDF species lasts from 2 to 4 months. The density of trees is about 260–1100 per ha with a diameter of 20 cm. It usually has only one wood canopy with a height from 7 to 25 m. The carpet is not dense. Characteristics of some dominant species in the national park are given in
Appendix A.
4. Result and Discussion
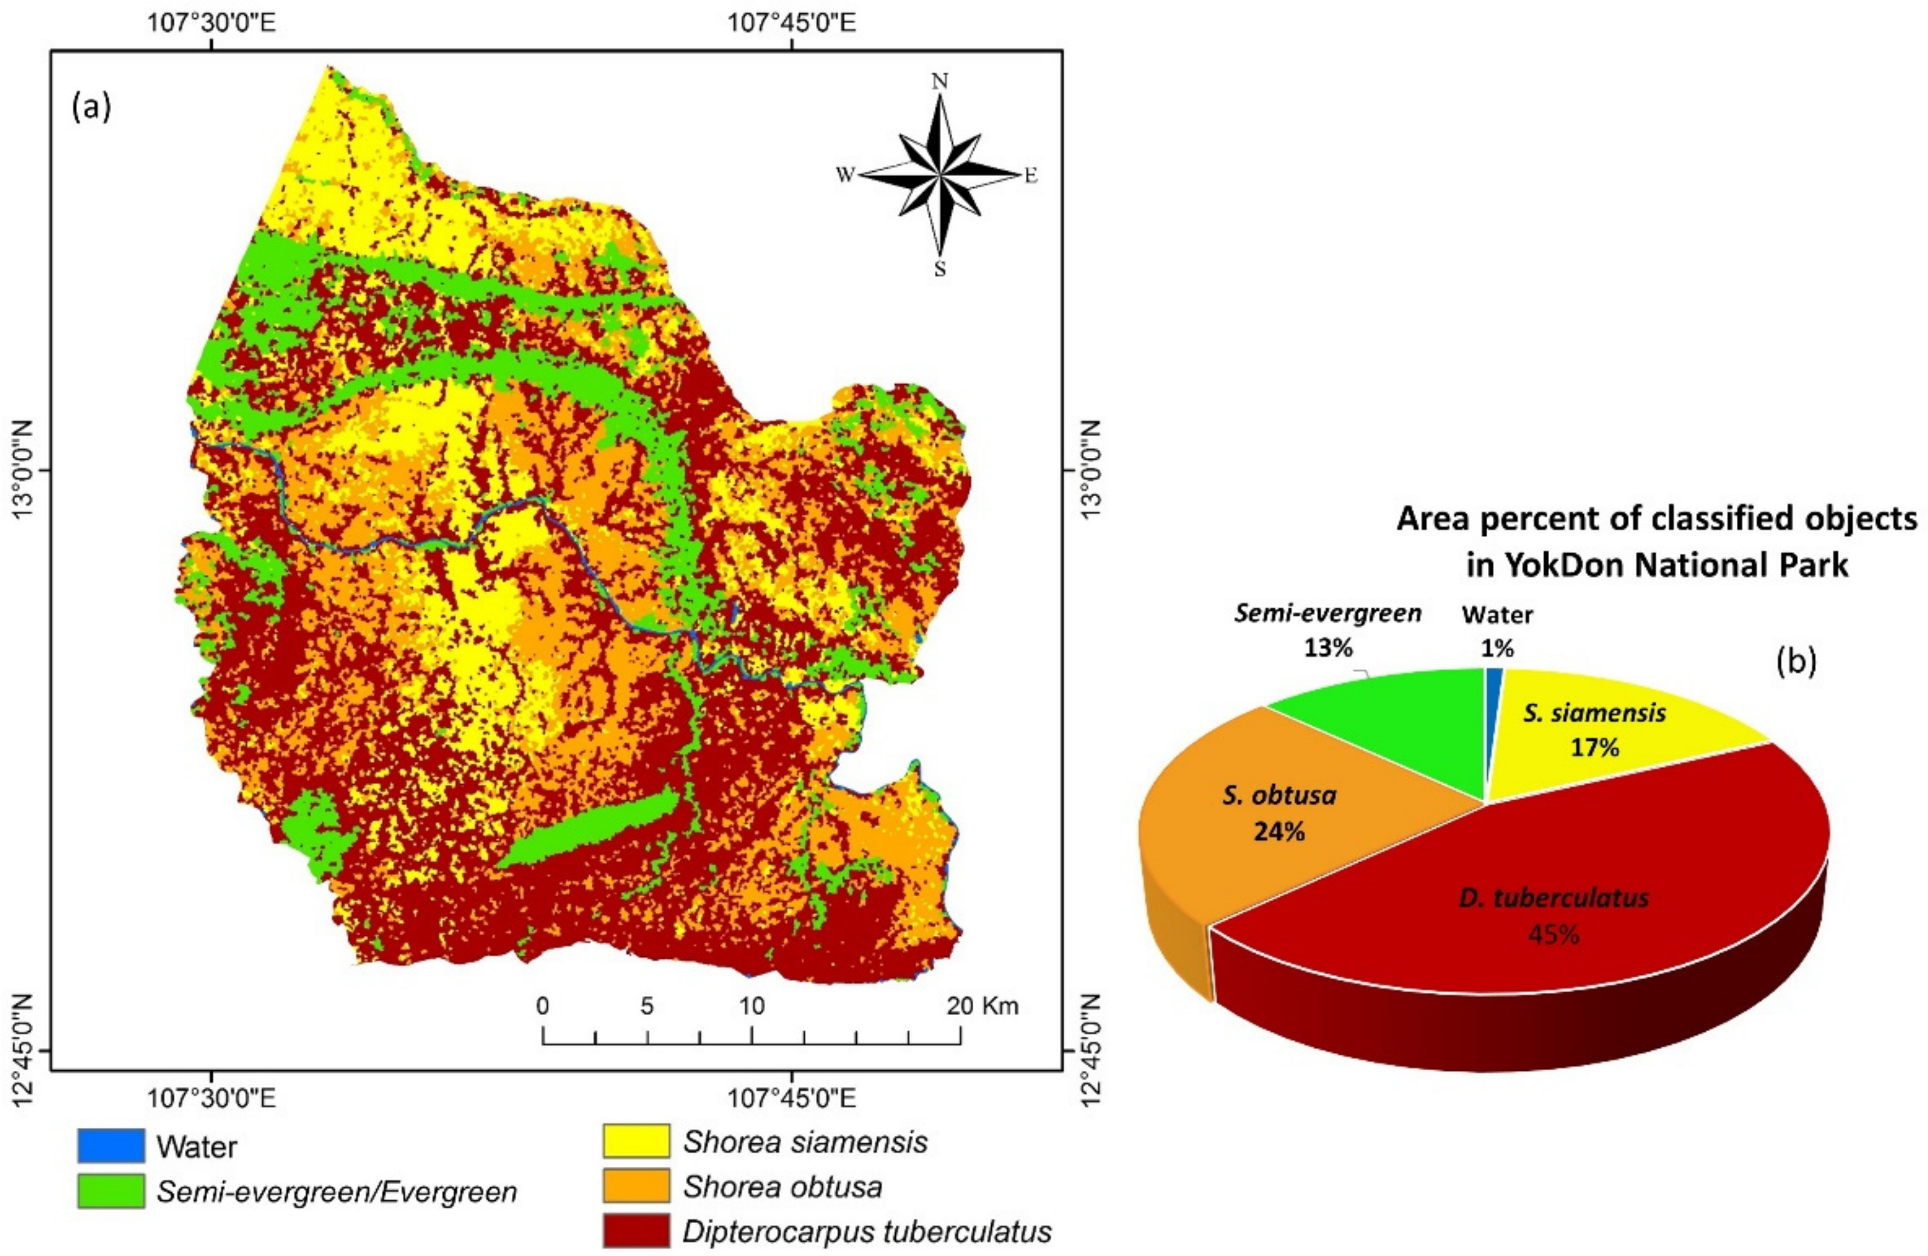
4.1. Broadleaf Deciduous Forest Map
Figure 9 shows the classification result and statistics of some BDF types in Yok Don National Park. The spatial distribution of deciduous forest consists of 24% (of the national park’s total area)
S. obtusa, 45%
D. tuberculatus, 17%
S. siamensis, 13%
semi-evergreen/evergreen, and 1% water.
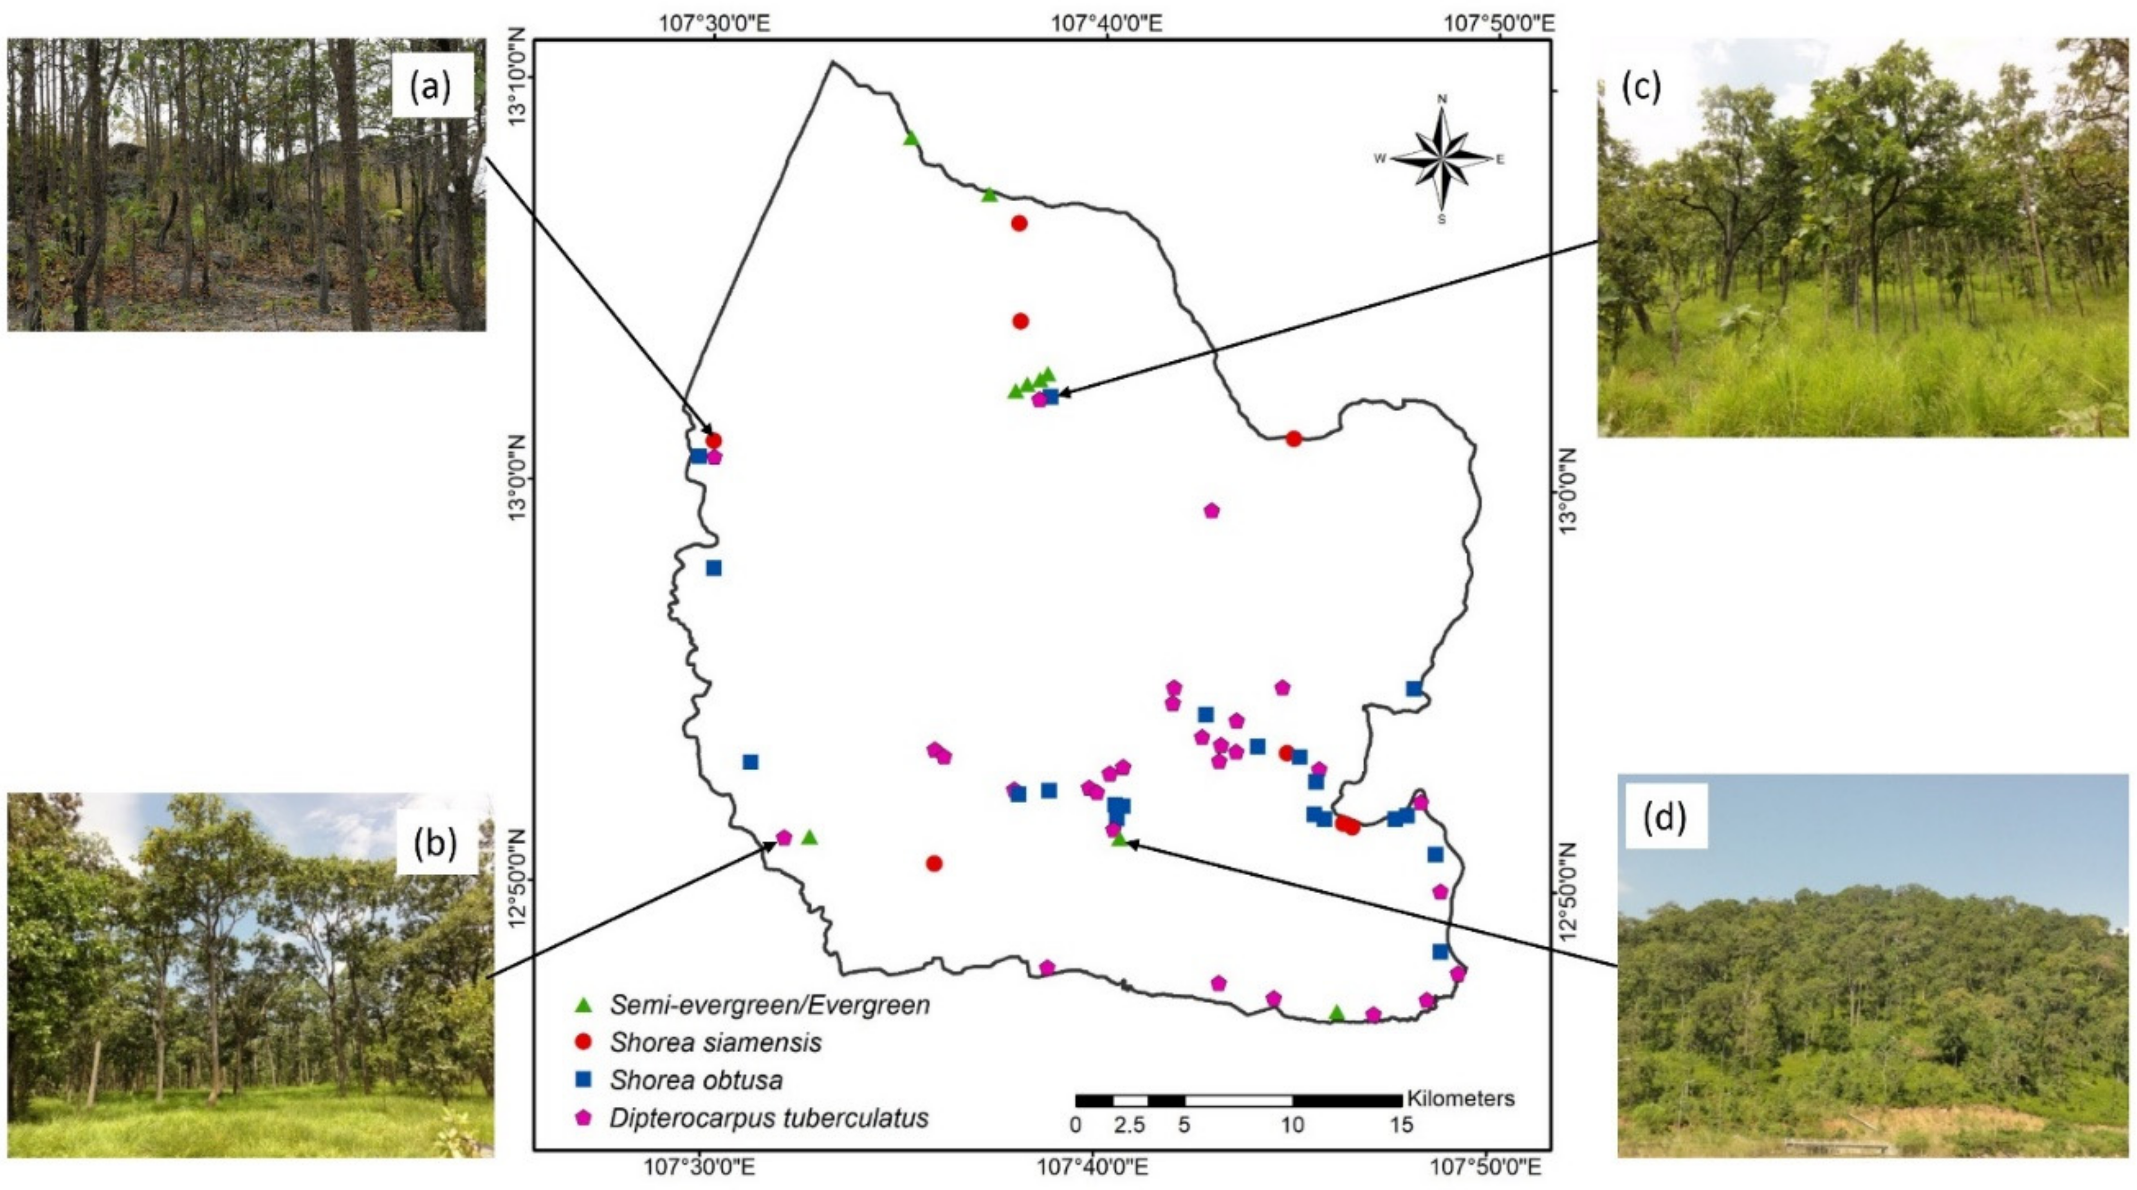
4.2. Accuracy Assessment
Accuracy assessment was performed by comparing the classified BDFs with statistical BDFs from the checking plots of field surveying data. In the study area, the dominant deciduous species, such as
S. obtusa, D. tuberculatus, and
S. siamensis, were analyzed in the sample plots. We used 66 field survey plots to evaluate the classification accuracy results. The location of the validation points and field photos are shown in
Figure 10. Among the 66 validation points, there were 8 semi-evergreen/evergreen plots, 7
S. siamensis plots, 23
S. obtusa plots, and 28
D. tuberculatus plots.
A confusion matrix of broadleaf deciduous forest classification with the user accuracy and producer accuracy per class is shown in
Table 3. Results show that 14 plots are misclassified, accounting for 21%.
S. obtusa has the most misclassification points with seven points. These misclassifications often have many broadleaf deciduous species in a plot with
values of 50% to 60%. The overall accuracy of the classification is 79% with a kappa coefficient of 0.7.
4.3. Discussion
We utilized different techniques, including Google Earth Engine, optical imagery, and SAR imagery to derive seasonal composite NDVI imagery. An object-based classification method was applied for the BDF classification. The Landsat images were used to classify broadleaf deciduous forests (BDFs), semi-evergreen/evergreen forest, and water. Optical images are affected by clouds, resulting in infeasibility of generating monthly composite images to observe seasonal variation in phenology. Therefore, multitemporal radar Sentinel-1A images were employed to resolve this problem. Conversely, using radar images alone will face difficulties, such as speckle noise and foreshortening, layover, and shadow distortion in mountainous areas. Thus, the combined optical and radar images effectively improve broadleaf deciduous forest classification in the study area.
The proposed method was the combination of optical and SAR images for BDF classification. It took advantage of the two types of images. The relation of backscattering profiles from time-series SAR images and phenological features of the broadleaf deciduous forest provides us more detailed information about dominant species composition and its evolution. However, foreshortening and layover on a radar image cause misclassification with semi-evergreen/evergreen forests in the mountainous areas. The semi-evergreen/evergreen forest is usually distributed in the high mountain belts and near a water source. In addition, the wetland in the study area changed in the dry season. Hence, Landsat 8 data were used to classify water and semi-evergreen/evergreen forest.
NDVI images of dry and rainy seasons were resampled to 10 m resolution to be integrated with Sentinel-1A images and compared with sample plots (size 20 m × 20 m). The combination of optical images and multitemporal SAR image was used as input data for the object-based classification method’s multiresolution segmentation algorithm to create the segmented homogeneous patterns. Each dominant species has a different time of leaves falling and this characteristic corresponds to backscatter signals. The broadleaf deciduous forest species were identified by taking an average value of segments in each Sentinel-1A image in February, March, and May. The relation of backscatter values of multitemporal Sentinel-1A images and the growth of BDFs were analyzed. The semi-evergreen forest has stable intensity and low standard deviation values, while the dominant species of BDFs have much fluctuation between the dry and rainy seasons. Backscatter values in the interval of DOY 233 (middle of August—the heaviest rainy time of the year) are lower than those in July and September, likely because the BDFs exhibit healthy growth in this period. Backscattering values derived from the SAR images are influenced by humidity and heavy rain.
The accuracy of classification significantly depends on the homogeneity of deciduous species in the checking plots. Classification results were compared with the BDFs in field surveying data with the assumption of homogeneous species at the checking plots. It is necessary to examine the homogeneous level in the plot sites. Thus, we were able to determine the homogeneous level of BDF species by about 70% in the checking plots. The misclassification only appeared in checking plots with numerous BDF species, and the homogeneous level is less than 50%. Besides, there are exceptional mixed classes.
Table 3 shows that the highest accuracy is 84.2% for
S. obtusa and the lowest accuracy is about 70.0% for semi-evergreen/evergreen forest because of mixed deciduous forests. Based on the field survey data,
S. obtusa and
D. tuberculatus are the major BDF species in Yok Don National Park.
This study has further demonstrated that time-series Sentinel-1A imagery can classify deciduous forest species in tropical regions. It indicates a definite relationship between backscattering on Sentinel-1A images and the phenology of deciduous forest species. Marius et al. [
9] proved that use of time-series Sentinel-1A images is able to classify deciduous and coniferous forests in northern Switzerland with an accuracy of 86% and kappa coefficient of 0.73. Overall accuracy for individual vegetation species in the study area was 72% with a kappa coefficient of 0.58. Notably, the forest features in northern Switzerland are more homogeneous (80%) compared with that in a tropical forest (homogeneity in our study area is about 50%), which has many layers with the mutual intersection, resulting in misclassification. Thus, it is of more challenge to obtain very high accuracy in forest classification in the tropical region in a deciduous forest. In addition, as far as we know, there is no study in Vietnam using Sentinel-1A for dry dipterocarp forest classification; for other countries in Asia, we searched and found limited references on this same issue.
Our study contributes to enriching the guidance and materials for forest management in Vietnam, which have never been found in the literature since only limited traditional inventory data are currently used [
41,
42,
43,
44]. Our classification map of deciduous forest in Dak Lak, Central Highlands of Vietnam, and the proposed classification scheme using Sentinel-1A imagery can be applied to the other regions of interest to achieve reliable information and reduce the human workforce.
5. Conclusions
Forest phenology observation and classification is commonly viewed as a vital diagnostic of climate variation, and it is also the first-order control on biosphere–atmosphere interaction. Consequently, Earth observation data have been instrumental in monitoring and mapping the forest phenology over the past decades. Since most efforts are attempted on single data or at larger scales, local-scale investigations with tropical forests are still rare. In this paper, we proposed integrating the multitemporal Sentinel-1A and Landsat 8 images using object-based classification methods to classify the broadleaf deciduous forests with the aid of Google Earth Engine. Then, dominant species in Yok Don National Park can be identified and used for improved management and conservation of the deciduous forest ecosystem in the Central Highlands, Vietnam.
In summary, three key points can be concluded: (i) Experimental results show that reliable classification between water, deciduous forest, and nondeciduous forest can be achieved by using NDVI images of dry and rainy seasons, based on multitemporal SAR images classified for BDF species based on backscatter values. (ii) The proposed method results are compared with field survey data, showing a 79% overall accuracy. (iii) The accuracy of the proposed classification method depends on the level of homogeneity of the species in the study area with the representaive species in the checking plots. We rely on NDVI and backscattering values derived from time-series optical and SAR images, respectively, to enhance the accuracy of forest species identification in the tropical region. However, to best utilize the available data and further advance the classification schemes, some aspects of efforts should be considered or implemented in the future studies, such as using Sentinel-2 data and analysis of the texture, assessment of canopy water availability [
45], calculation the mean spectral band values, and utilization of principal component analysis or machine learning methods, together with the acquisition of knowledge about the vegetation’s biophysical characteristics, such as tree height, tree density, and biomass.


 ,
, 


