Article

Aboveground Biomass Allocation of Boreal Shrubs and Short-Stature Trees in Northwestern Canada

Department of Geography and Environment, University of Lethbridge, 4401 University Drive West, Lethbridge, AB T1K3M4, Canada
*
Author to whom correspondence should be addressed.
Forests 2021, 12(2), 234; https://doi.org/10.3390/f12020234
Submission received: 19 January 2021 / Revised: 15 February 2021 / Accepted: 16 February 2021 / Published: 18 February 2021
(This article belongs to the Special Issue Forest Biomass and Carbon Estimation)

Abstract

:
In this follow-on study on aboveground biomass of shrubs and short-stature trees, we provide plant component aboveground biomass (herein ‘AGB’) as well as plant component AGB allometric models for five common boreal shrub and four common boreal short-stature tree genera/species. The analyzed plant components consist of stem, branch, and leaf organs. We found similar ratios of component biomass to total AGB for stems, branches, and leaves amongst shrubs and deciduous tree genera/species across the southern Northwest Territories, while the evergreen Picea genus differed in the biomass allocation to aboveground plant organs compared to the deciduous genera/species. Shrub component AGB allometric models were derived using the three-dimensional variable volume as predictor, determined as the sum of line-intercept cover, upper foliage width, and maximum height above ground. Tree component AGB was modeled using the cross-sectional area of the stem diameter as predictor variable, measured at 0.30 m along the stem length. For shrub component AGB, we achieved better model fits for stem biomass (60.33 g ≤ RMSE ≤ 163.59 g; 0.651 ≤ R2 ≤ 0.885) compared to leaf biomass (12.62 g ≤ RMSE ≤ 35.04 g; 0.380 ≤ R2 ≤ 0.735), as has been reported by others. For short-stature trees, leaf biomass predictions resulted in similar model fits (18.21 g ≤ RMSE ≤ 70.0 g; 0.702 ≤ R2 ≤ 0.882) compared to branch biomass (6.88 g ≤ RMSE ≤ 45.08 g; 0.736 ≤ R2 ≤ 0.923) and only slightly better model fits for stem biomass (30.87 g ≤ RMSE ≤ 11.72 g; 0.887 ≤ R2 ≤ 0.960), which suggests that leaf AGB of short-stature trees (<4.5 m) can be more accurately predicted using cross-sectional area as opposed to diameter at breast height for tall-stature trees. Our multi-species shrub and short-stature tree allometric models showed promising results for predicting plant component AGB, which can be utilized for remote sensing applications where plant functional types cannot always be distinguished. This study provides critical information on plant AGB allocation as well as component AGB modeling, required for understanding boreal AGB and aboveground carbon pools within the dynamic and rapidly changing Taiga Plains and Taiga Shield ecozones. In addition, the structural information and component AGB equations are important for integrating shrubs and short-stature tree AGB into carbon accounting strategies in order to improve our understanding of the rapidly changing boreal ecosystem function.

1. Introduction

Boreal ecosystems of northwestern Canada store approximately 2.1% of the global terrestrial carbon (C) on 0.3% of the global land surface area [1]. Therefore, the global atmospheric climate-C cycle is tightly coupled to the changing C dynamics of northern boreal ecosystems [2]. For effective emissions targets and mitigation strategies, it is essential to reduce the high uncertainties of the C balance of unmanaged boreal ecosystems [2,3]. However, C accounting of unmanaged boreal ecosystems is challenging because these ecosystems are changing at unknown rates due to (1) the cumulative impacts of interacting climate-mediated and anthropogenic disturbances [4,5,6,7,8] and (2) the enhanced frequency, intensity, duration, and timing of these disturbances. For example, in boreal ecosystems of northwestern Canada the vegetation structure and composition has changed significantly towards increased abundance of shrubs [9,10] and short-stature low productive or juvenile trees. This is in particular the case where ecosystems were set back to an early successional stage post wildland fire disturbance [11] or in the rapidly changing transition zones between elevated forests and adjacent peatlands due to permafrost thaw [8]. This in turn has significant effects on ecosystem function and ecosystem-atmosphere interactions at local to regional scales [8,11] as well as at national to global scales [12,13]. For example, prominent shrub and broadleaf tree growth in, e.g., post-fire vegetation succession is likely the explaining factor for returning production levels to an annual net C uptake within 10 to 15 years post burn (e.g., [12,14,15]). However, boreal shrubs and short-stature trees are not integrated into C accounting strategies. This is because of a lack of available spatially explicit structural and quantitative information on boreal shrub and short-stature tree species, as discussed in our related study [16]. Therefore, aboveground biomass (AGB) allocation data for shrubs and short-stature trees are necessary to better understand the contributions of different plant components to the standing stocks of AGB and aboveground C in this region, while plant component AGB allometric equations for shrubs and short-stature trees provide a means to improve modeling of AGB and aboveground C pools.
Consequently, the first objective of this paper was to describe and discuss the proportion of plant component AGB for boreal shrub and short-stature tree species. Plant components were separated into stems, branches, and leaves. The second objective was to provide allometric equations for estimating aboveground biomass of plant components of shrubs and short-stature trees. This paper is a follow-on study on shrub and short-stature tree total AGB allometric equations [16]. While in the previous study [16] we focused on total AGB allometric equations using 1D, 2D, and 3D predictor variables, in this study we analyze the AGB allocation to different plant components and provide plant component-specific allometric equations leveraging the same field data as described by Flade et al. [16]. The plant component data provided in this study is a crucial next step towards improved C pool partitioning required for improved C accounting strategies for unmanaged boreal ecosystems of northwestern Canada [3].

2. Materials and Methods

2.1. Study Area

Plant component AGB was derived from shrubs and short-stature trees growing in the mid-boreal Taiga Plains and high-boreal Taiga Shield ecoregions of the Northwest Territories (Figure 1). The climate in this region is characterized by cold mean annual air temperatures, ranging from −2.5 °C near Fort Simpson (Taiga Plains) to −3/−4 °C near Yellowknife (Taiga Shield). The area receives between 360 mm (Yellowknife) and 390 mm (Fort Simpson) cumulative annual precipitation. The genera and species sampled are Alnus spp., Betula spp., Dasiphora fruticosa, Salix spp., and Shepherdia canadensis, which represent common boreal shrub genera/species in this study area. Common boreal tree genera/species sampled are Betula papyrifera, Picea glauca and mariana (combined to Picea spp.), Populus balsamifera, and Populus tremuloides [17,18].

2.2. Plant Destructive Sampling

A total of 206 shrub and 105 tree individuals were measured and destructively sampled at 65 different peatland and forest sites. In order to capture the various stages of boreal ecosystem succession in our field data, field sampling locations were situated in late successional sites and in sites disturbed by wildland fire within the last 50 years. For a detailed field sampling plan, we refer to our previous study [16]. Trees were sampled within the last two weeks in July 2019, while shrubs were harvested during the late July/early August period of 2018 and 2019. Therefore, shrub foliage might show higher variability compared to tree foliage due to the potential influences of changes in phenology. Shrubs and short-stature trees were destructively sampled from the understory and open areas across different height ranges determined in intervals of 0.5 m up to ≤4.5 m. A plant individual was selected for harvest when it was alive and mostly free of foliage disturbance/mortality and stem blemishes. Following measurements in situ [16], plants were clipped directly above the soil surface and stored in paper bags for further processing. Dead stems were not harvested. In the laboratory, harvested plants were air dried for up to 4 months and separated into stems, branches, and leaves. All plant components were oven dried at 60 °C for a minimum of 48 hrs. Constant mass was confirmed by weighing the largest plant individuals at multiple times post drying. Twigs and fruits were counted to the leaf component, while bark was included as part of the stem. For trees, branches were cut off directly at the stem. Shrubs did not develop distinctive branches and were separated into leave and stem components only. The total AGB for shrubs and trees was determined as dry weight (g) by weighing each plant component and summing the dry weight of all components per individual plant. In this study, we present measured plant component AGB as a percentage of the total AGB per plant genus/species.

2.3. In Situ Measurements and Plant Component Aboveground Biomass Allometric Equations

We derived AGB allometric equations for each plant component per plant genus/species as well as all shrub genera/species (multi-species shrubs) and tree genera/species (multi-species trees) combined. The methods follow the same procedures used to determine total AGB in [16]. The in situ structural measurements of harvested shrubs and trees used to determine the most accurate AGB predictions were volume for shrubs and cross-sectional area for trees [16]. Volume was derived by measuring the extent of the upper-most foliage layer perpendicular to the transect (herein ‘width’ [m]) and parallel to the transect (herein ‘line-intercept cover’ [m]) using a tape measure. The 3D shrub volume [m3] was then calculated as
Volume [m3] = maximum height [m] × line-intercept cover [m] × width [m].
For short-stature trees, cross-sectional area [cm2] was derived from the measured stem diameters. Stem diameters were measured at 0.30 m along the stem length starting from the average ground surface surrounding the tree [16].
Highest model fits were derived using iterative non-linear least squares regression (herein ‘NLS’) via a power function:
y = β x α + ε
where y is the dependent variable, x is the independent in situ variable (volume for shrubs and cross-sectional area for trees), α and β are the regression coefficients, and ε is an additive error term, as discussed by Flade et al. [16]. Because our AGB data showed uniform variances on arithmetic scales for most species as well as on logarithmic scales for all species, we did not apply weights to our models. In order to address potential heteroscedasticity in shrub and short-stature AGB data, we also developed ABG allometric equations using linear logarithmic regression with correction (herein ‘LLRC’):
l n ( y ) = l n ( β ) + α × l n ( x ) + l n ( ε )
y = β x α × ε
ε = e ( M S E 2 )
where ε represents a multiplicative correction factor (CF) of the back-transformed arithmetic values, derived with M S E as the mean square error of the regression [16,19,20].
The modeled biomass results were evaluated using root mean square error (RMSE), coefficient of determination (R2), and regression residual analysis. Residual analysis was performed using visual inspection of the relationships between dependent and independent variables. Regression coefficients are reported with standard errors.

3. Results and Discussion

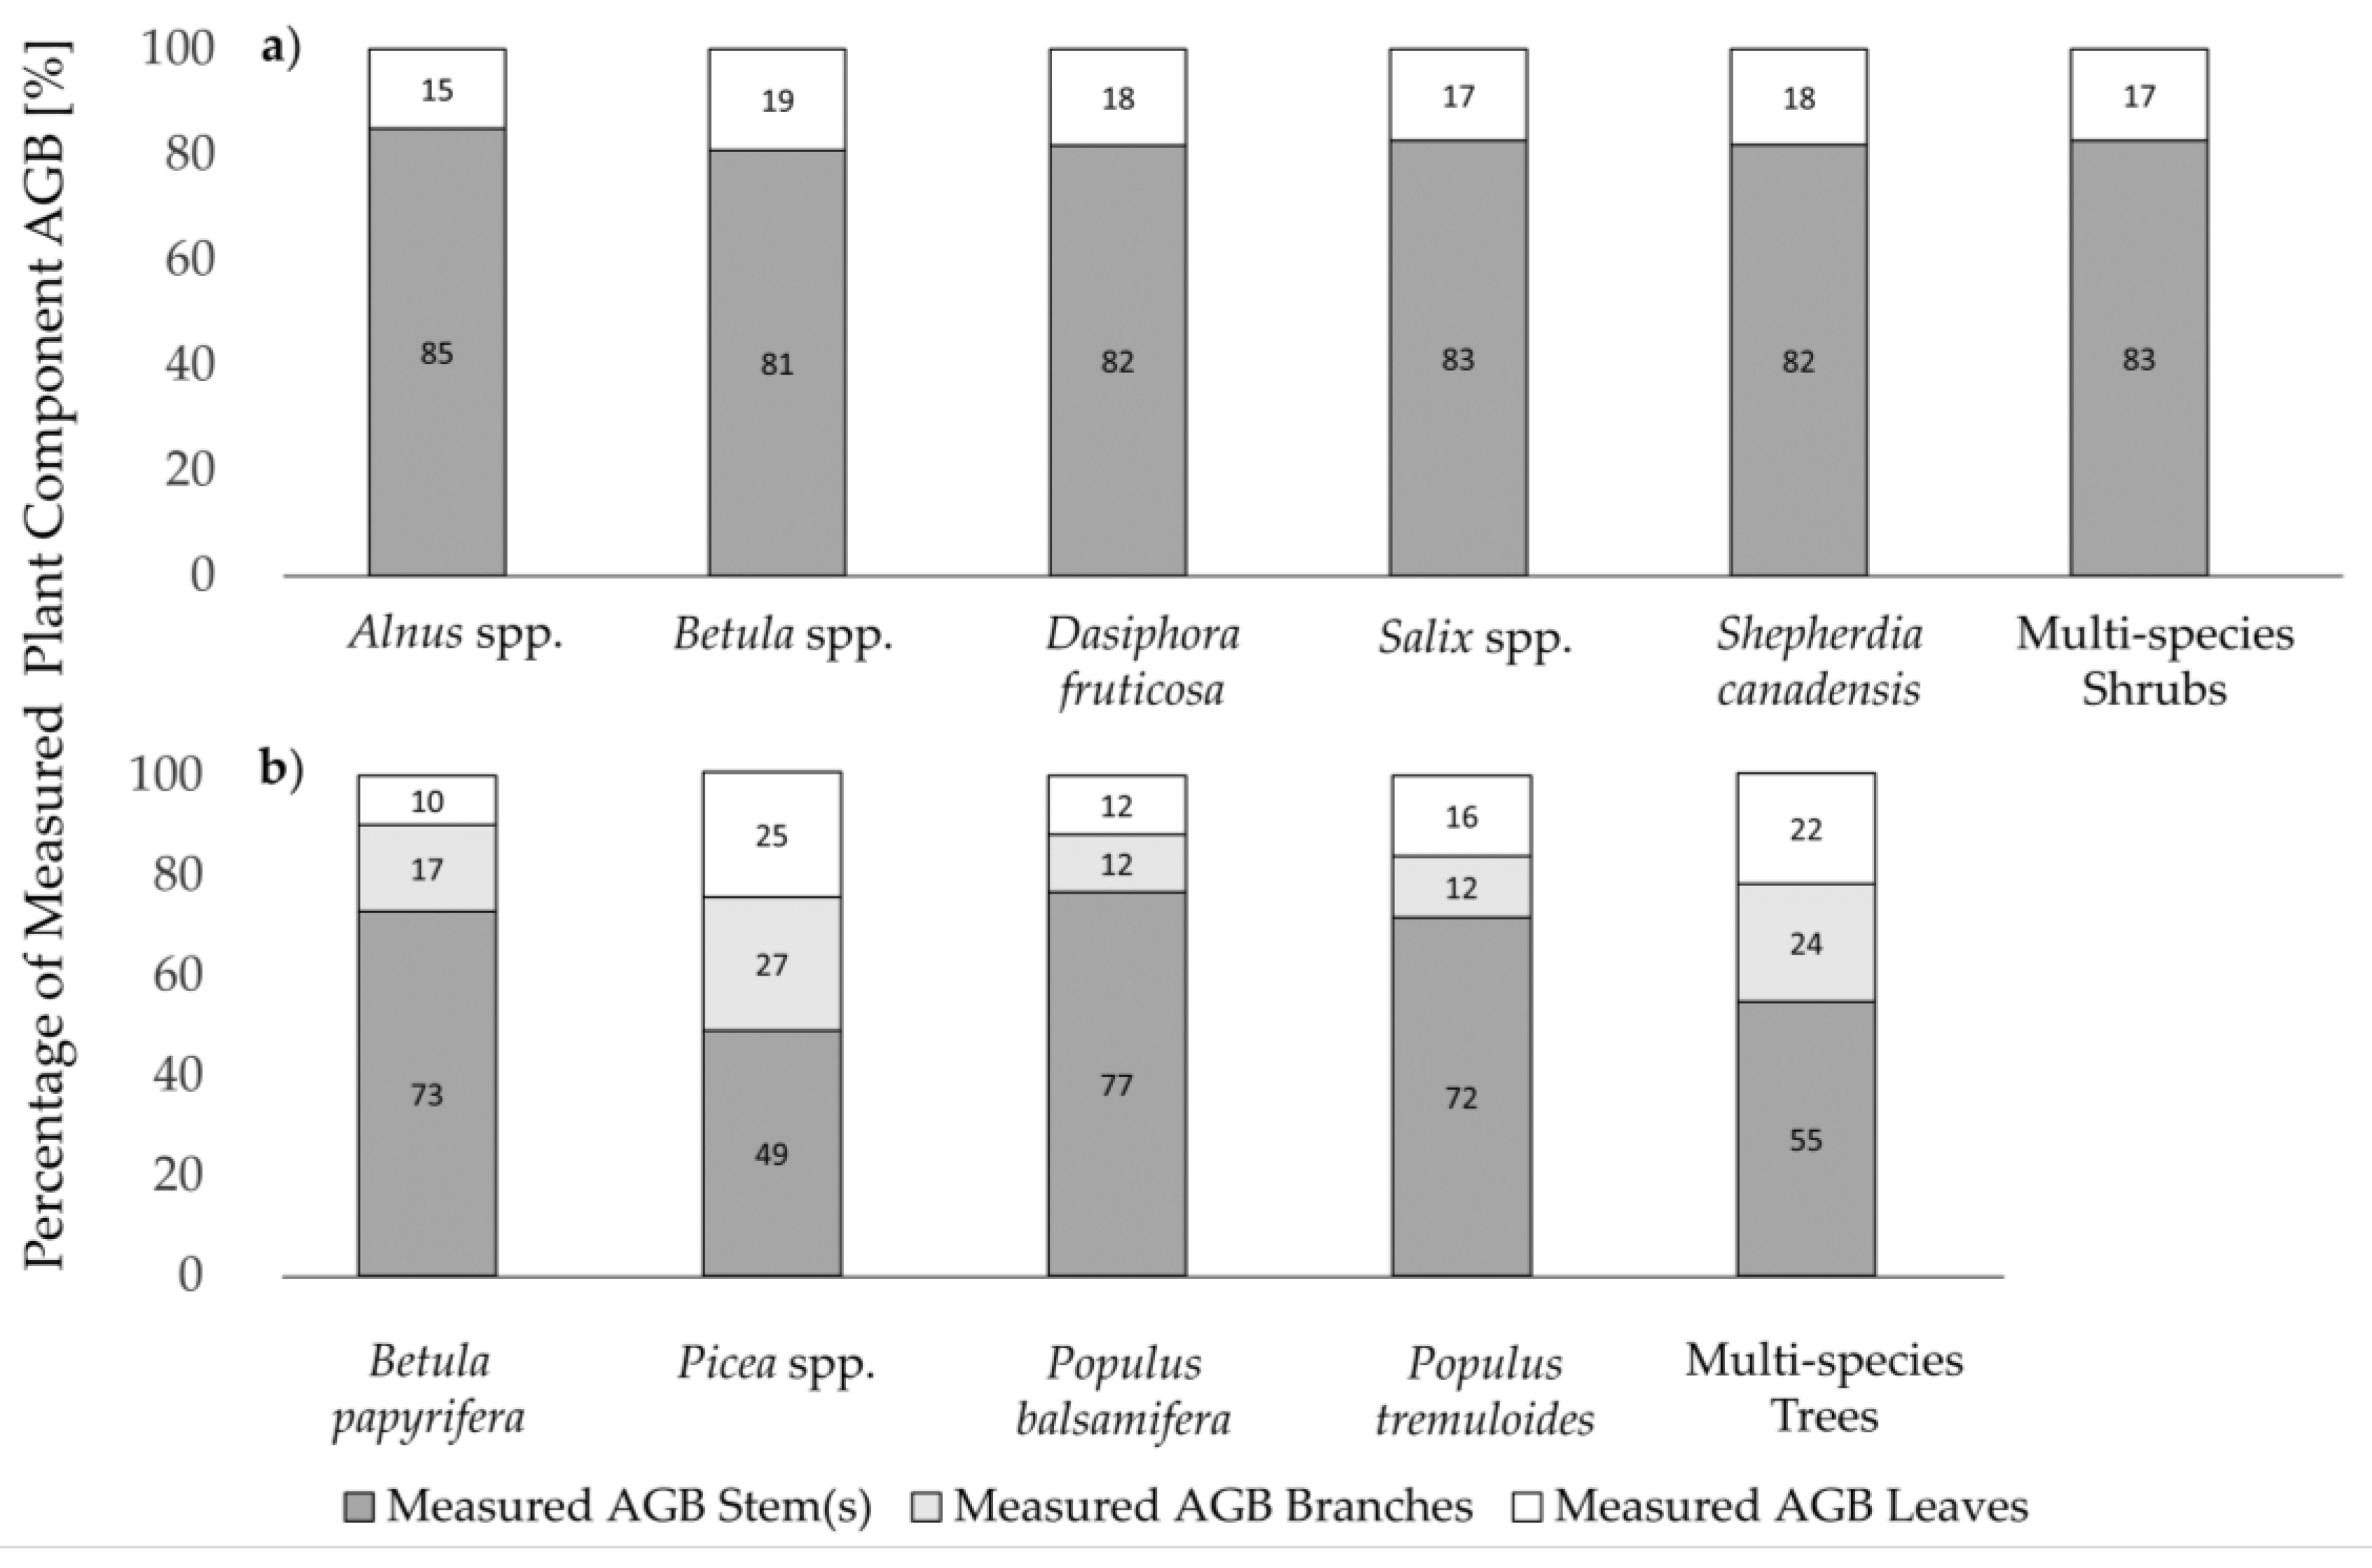
3.1. Measured Plant Component AGB

The amounts of harvested individual plants per genus/species and descriptive statistics of measured plant component AGB are provided in Table 1. The percentages of the measured AGB per plant component is provided in Figure 2. We found similar plant AGB for leaves and stems for all five shrub genera/species, ranging from 15% (Alnus spp.) to 19% (Betula spp.) for leaves, and from 81% (Betula spp.) to 85% (Alnus spp.) for stems, respectively (Figure 2a). Similarly uniform was the measured plant component AGB for deciduous tree species, ranging from 10% (Betula papyrifera) to 16% (Populus tremuloides) leaf biomass, 12% (Populus tremuloides) to 17% (Betula papyrifera) branch biomass, and 72% (Populus tremuloides) to 77% (Populus balsamifera) stem biomass (Figure 2b). The measured plant component AGB of the evergreen Picea genus had lower stem biomass (49%) and higher branch (27%) and leaf (25%) biomass compared to the deciduous tree and shrub genera/species. This finding can be explained by the thick and often longer branches of the sampled Picea plants in comparison to the branches of short-stature deciduous tree species. We further found that the biomass of leaves and branches combined (52%) was approximately equal to the stem biomass (49%) of the Picea genus. Although biomass allocation changes with tree size and age (e.g. [21,22]), Petersson et al. [22] reported approximately 45% combined leave and branch biomass and 40% stem biomass (including bark) for 11 to 20 year old Pinus sylvestris stands in Sweden, while Johansson [23] derived a mean stem biomass proportion of 56% for 17 to 54 year old Picea abies stands growing on abandoned farmland in Sweden. In addition, we found that all five shrub genera/species had similar AGB allocations comparable to the three deciduous tree species.
The variability of measured plant component AGB per shrub and short-stature tree genus/species is depicted in Figure 3a–g, respectively. From the five shrub genera/species sampled, Alnus spp. and Betula spp. were similar and showed greater variation compared to Dasiphora fruticosa, Salix spp., and Shepherdia canadensis. This differs from the findings of, e.g. He et al. [24], who found greatest structural differences between Alnus spp. and Betula spp. However, in our study Betula spp. showed greater differences in leaf biomass compared to all other genera/species, which is similar to the reported differences in total AGB of the Betula genus by the same authors [24]. In addition, we found similar structural growth forms of Alnus spp. and Betula spp. as reported by Lantz et al. [25] and Moffat et al. [26] for Arctic environments. Alnus spp. had stems growing in an outward radiating form, while both Alnus spp. and Betula spp. developed long shoots. However, Salix spp. was the dominant species in our study area compared to Betula nana dominance on lichen plots found in the Tuktoyaktuk coastland tundra [26]. Our study results showed further that Salix spp. had a lower median of stem biomass and more outliers compared to the other four genera/species. This might not only be due to greater structural variability of this genus, but also due to the larger sample amount (n = 79, Table 1), which increases the sampling of a greater range of structural variation. However, Salix spp. was the dominant genus at our field locations, and therefore, the larger sample amount represents the naturally dominant occurrence of Salix spp. in our study area. For deciduous short-stature tree genera/species, stem, branch, and leaf biomass (Figure 3d–g) showed similar variation, while Picea spp. had greater ranges, outliers, and medians for stem, branch, and leaf biomass, as previously described (Figure 2b). In addition, it needs to be mentioned that influences of phenological changes could be the reason for slightly greater shrub foliage AGB variation compared to deciduous tree foliage AGB variation, due to the measuring period of shrubs extending into early August (Figure 3c,g).
These findings suggest that short-stature deciduous tree genera/species may be combined with shrub genera/species as input into C allocation or terrestrial primary production models. However, model results might be improved when short-stature evergreen tree genera/species are analyzed separately, as already suggested by, e.g. Gower et al. [27], because these plant types differ in C budget processes, such as net primary production and C allocation [27,28,29], as well as percentage of plant component AGB. In addition, variations in plant traits, such as dry matter of leaves, adult plant height, leaf area, seed mass, leaf mass per area, and leaf nitrogen, vary among species as well as within species, in particular at local scales and in areas of low species richness (e.g., [30]). This suggests a need to additionally incorporate plant trait information in earth system models to improve understanding of the responses of plant communities, e.g., in ecosystem function and community assembly, to climate-mediated changes of environmental conditions [30]. The data used in this paper, does not provide the complete list of plant trait information, however, the plant component information might be useful as a first step towards improved earth system models in northern boreal environments.

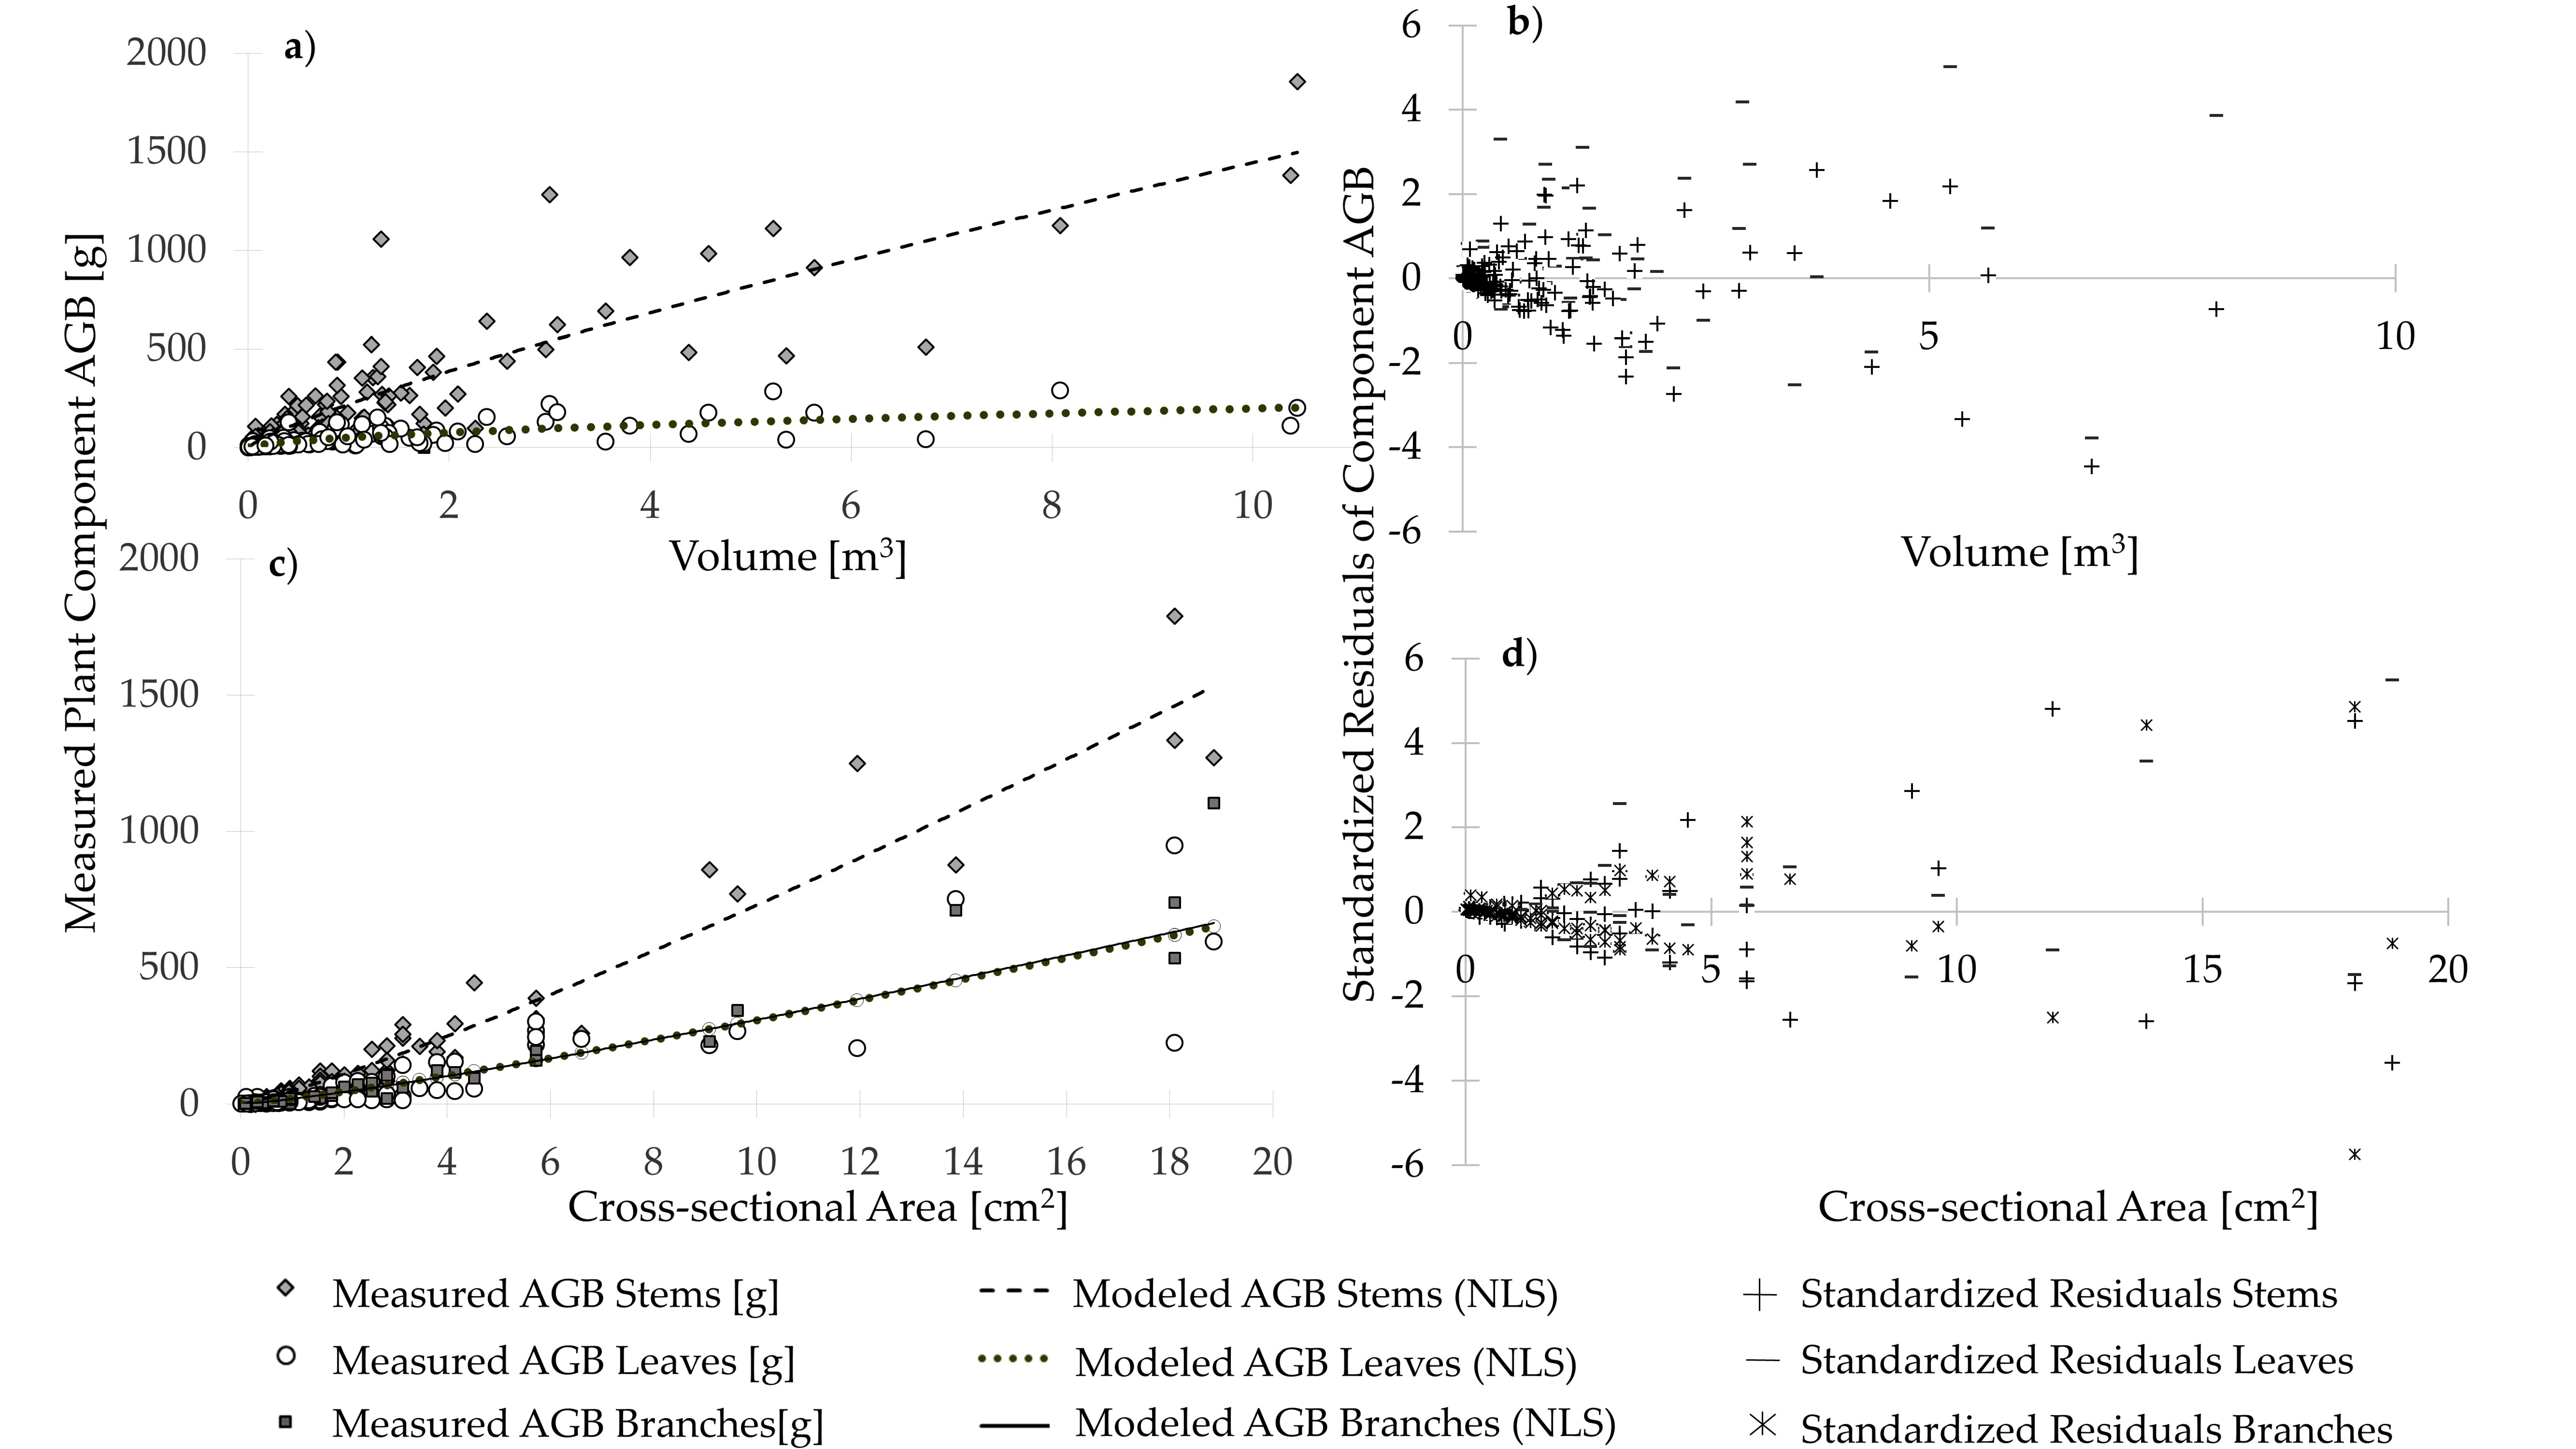
3.2. Modeled Plant Component AGB and Allometric Equations

Regression coefficients and error statistics for the modeling of plant component AGB are provided for each genus/species as well as for multi-species shrubs (Table 2) and short-stature trees (Table 3). Because we found different AGB allocation of Picea spp., we also provided one combined component model for all deciduous tree species excluding Picea spp. (herein ‘reduced hardwood tree model’) (Table 3).
Modeled total AGB that was derived by the sum of the single component AGB models was on average 0.13 g ± 1.67 g standard deviation (0.03% of modeled mean total AGB) higher for shrubs, and 1.88 g ± 1.09 g standard deviation (0.67%) higher for tress respectively, compared to the total AGB model results.
For shrub component AGB, we achieved better model fits for stem biomass (60.33 g ≤ RMSE ≤ 163.59 g; 0.651 ≤ R2 ≤ 0.885) compared to leaf biomass (12.62 g ≤ RMSE ≤ 35.04 g; 0.380 ≤ R2 ≤ 0.735) for each genus/species as well as for the general multi-species shrub model using the three-dimensional predictor variable volume. Higher prediction errors of leaf and branch biomass models vs. stem biomass models have been found as well by Lambert et al. [31]. However, except for Shepherdia canadensis, R2 are above 0.5 for all other genera/species and multi-species shrubs (Table 2). For short-stature trees, leaf biomass predictions using cross-sectional area as the independent variable resulted in similar model fits (18.21 g ≤ RMSE ≤ 70.0 g; 0.702 ≤ R2 ≤ 0.882) compared to branch biomass (6.88 g ≤ RMSE ≤ 45.08 g; 0.736 ≤ R2 ≤ 0.923) and only slightly better model fits for stem biomass (30.87 g ≤ RMSE ≤ 11.72 g; 0.887 ≤ R2 ≤ 0.960) for each genus/species as well as the general hardwood and multi-species tree models (Table 3). This suggests that leaf biomass can be predicted using cross-sectional area as an independent variable for short-stature trees, leading to better results as the prediction of leaf biomass of tall-stature trees (diameter at breast height (DBH) > 9 cm) using DBH as an independent variable (e.g., [31,32]). Due to the different AGB allocation of Picea spp., we derived a reduced hardwood tree model including only the remaining hardwood tree species, as explained above. For this reduced hardwood tree model however, we did not receive better overall model fits (0.760 ≤ R2 ≤ 0.887) compared to the full model that includes all tree genera/species (0.767 ≤ R2 ≤ 0.940). In fact, model fits for stem and branch biomass were better for the full multi-species tree model. However, model fits for leaf biomass improved using the reduced hardwood tree model (Table 3).
The inspection of dependent vs. independent variable for the multi-species shrub and tree component models (Figure 4a,b) as well as the standardized residuals (Figure 4c,d) showed higher residuals of modeled leaf biomass compared to stem biomass for shrubs, while residuals were relatively homogeneous across all three modeled plant components for trees, as indicated by the goodness-of-fit metrics discussed above.
For shrubs, the highest residuals were attributed to four shrub genera/species excluding Sheperdia canadensis, while the highest tree residuals corresponded to Picea glauca as well as mariana. Although this might imply that the multi-species tree component AGB models were mainly fit to Picea spp., we did not find higher residuals for smaller tree species in the multi-species component models. We achieved similar results with LLRC (not shown). This suggests that our multi-species models may have utility for using less invasive observation techniques (e.g., unmanned airborne vehicles or laser scanning) where vegetation species and type may be indeterminate. Furthermore, our genus/species-specific as well as multi-species models for predicting single plant component AGB may be well suited for scaling plant component and total AGB of shrubs and short-stature trees to the sporadic to discontinuous permafrost zones of the Taiga Plains and Taiga Shield ecozones of boreal northwestern Canada.

4. Conclusions

In this study we describe plant AGB allocation to leaf, branch, and stem components as well as plant component AGB allometric models for common boreal shrub and short-stature tree genera/species (<4.5 m height above ground) found in boreal northwestern Canada. We found similar AGB allocation to stems, branches, and leaves of shrubs and deciduous tree genera/species across our study region, while the sampled evergreen Picea genus differed in the AGB allocation to the aboveground plant components. Our plant component AGB allometric models showed better model fits for stem biomass compared to leaf biomass for shrubs. For short-stature trees, leaf biomass predictions resulted in similar model fits compared to branch biomass predictions with slightly better model fits for stem biomass predictions. In addition, our multi-species allometric models for shrubs and short-stature trees might be utilized for remote sensing techniques that do not allow to distinguish between plant functional types. This dataset and equations are a useful next step for integrating shrubs and short-stature tree AGB into C accounting strategies in order to improve our understanding of the rapidly changing boreal ecosystem function of forest and peatland ecosystems within the sporadic to discontinuous permafrost region. This provides an improved ability to develop full ecosystem models in the most climatically vulnerable and changing ecosystems found in the northern hemisphere.

Author Contributions

Conceptualization, L.F., C.H. and L.C.; methodology, L.F., C.H. and L.C.; validation, L.F. and L.C.; formal analysis, L.F.; investigation, L.F., C.H. and L.C.; resources, L.C. and C.H.; data curation, C.H.; writing—original draft preparation, L.F.; writing—review and editing, L.C., C.H., and L.F.; visualization, L.F.; supervision, L.C. and C.H.; project administration, L.C.; funding acquisition, L.C. and C.H. All authors have read and agreed to the published version of the manuscript.

Funding

This research was funded by the National Science and Engineering Research Council of Canada (NSERC)—Discovery Grants to Dr. Laura Chasmer and Dr. Christopher Hopkinson. Funding for field work has been provided by a start-up grant to Dr. Laura Chasmer from the University of Lethbridge. Further funding was provided by the Canadian Foundation of Innovation Award to Dr. Christopher Hopkinson.

Acknowledgments

Fieldwork was supported by the Government of the Northwest Territories—Tyler Rea and Ben Paulsen and the Dehcho Guardians program supported by William Quinton, Wilfrid Laurier University. For support in field data collection and biomass processing, the authors would like to thank Rachelle Shearing, Jesse Aspinall, Emily Jones, and Lavinia Haase from the University of Lethbridge, as well as Garrett Isiah with the Dehcho Guardian program. For provision of lab infrastructure (ovens) and expertise, we would like to thank Lawrence Flanagan from the University of Lethbridge. We also thank three anonymous reviewers for their careful reviews.

Conflicts of Interest

The authors declare no conflict of interest.

References

  1. Vitt, D.H.; Halsey, L.A.; Bauer, I.E.; Campbell, C. Spatial and temporal trends in carbon storage of peatlands of continental western Canada through the Holocene. Can. J. Earth Sci. 2000, 37, 683–693. [Google Scholar] [CrossRef]
  2. Kurz, W.A.; Shaw, C.H.; Boisvenue, C.; Stinson, G.; Metsaranta, J.; Leckie, D.; Dyk, A.; Smyth, C.; Neilson, E.T. Carbon in Canada’s boreal forest—A synthesis. Environ. Rev. 2013, 21, 260–292. [Google Scholar] [CrossRef]
  3. Bernier, P.; Kurz, W.A.; Lemprière, T.C.; Ste-Marie, C. A Blueprint for Forest Carbon Science in Canada: 2012–2020; Natural Resources Canada, Canadian Forest Service: Ottawa, ON, Canada, 2012; 52p. [Google Scholar]
  4. Romero-Lankao, P.; Smith, J.B.; Davidson, D.J.; Diffenbaugh, N.S.; Kinney, P.L.; Kirshen, P.; Kovacs, P.; Villers Ruiz, L. North America. In Climate Change 2014: Impacts, Adaption, and Vulnerability. Part B: Regional Aspects. Contribution of Working Group II to the Fifth Assessment Report of the Intergovernmental Panel on Climate Change; Barros, V.R., Field, C.B., Dokken, D.J., Mastrandrea, M.D., Mach, K.J., Bilir, T.E., Chatterjee, M., Ebi, K.L., Estrada, Y.O., Genova, R.C., et al., Eds.; Cambridge University Press: Cambridge, UK; New York, NY, USA, 2014; pp. 1439–1498. [Google Scholar]
  5. Dale, V.H.; Joyce, L.A.; McNulty, S.; Neilson, R.P.; Ayres, M.P.; Flannigan, M.D.; Hanson, P.J.; Irland, L.C.; Lugo, A.E.; Peterson, C.J.; et al. Climate Change and Forest Disturbances. Bioscience 2001, 51, 723. [Google Scholar] [CrossRef] [Green Version]
  6. Quinton, W.L.; Hayashi, M.; Chasmer, L. Peatland Hydrology of Discontinuous Permafrost in the Northwest Territories: Overview and Synthesis. Can. Water Resour. J. 2009, 34, 311–328. [Google Scholar] [CrossRef]
  7. Baltzer, J.; Veness, T.; Chasmer, L.; Sniderhan, A.E.; Quinton, W.L. Forests on Thawing Permafrost: Fragmentation, Edge Effects, and Net Forest Loss. Glob. Chang. Biol. 2014, 20, 824–834. [Google Scholar] [CrossRef] [PubMed]
  8. Chasmer, L.; Hopkinson, C. Threshold Loss of Discontinuous Permafrost and Landscape Evolution. Glob. Chang. Biol. 2017, 23, 2672–2686. [Google Scholar] [CrossRef]
  9. Myers-Smith, I.H.; Forbes, B.C.; Wilmking, M.; Hallinger, M.; Lantz, T.C.; Blok, D.; Tape, K.D.; Macias-Fauria, M.; Sass-Klaassen, U.; Lévesque, E.; et al. Shrub expansion in tundra ecosystems: Dynamics, impacts and research priorities. Environ. Res. Lett. 2011, 6, 045509. [Google Scholar] [CrossRef] [Green Version]
  10. Myers-Smith, I.H.; Kerby, J.T.; Phoenix, G.K.; Bjerke, J.W.; Epstein, H.E.; Assmann, J.J.; John, C.; Andreu-Hayles, L.; Angers-Blondin, S.; Beck, P.S.A.; et al. Complexity revealed in the greening of the Arctic. Nat. Clim. Chang. 2020, 10, 106–117. [Google Scholar] [CrossRef] [Green Version]
  11. Helbig, M.; Chasmer, L.E.; Kljun, N.C.; Quinton, W.L.; Treat, C.C.; Sonnentag, O. The positive net radiative greenhouse gas forcing of increasing methane emissions from a thawing boreal forest-wetland landscape. Glob. Chang. Biol. 2017, 23, 2413–2427. [Google Scholar] [CrossRef] [Green Version]
  12. Goulden, M.L.; Mcmillan, A.M.S.; Winston, G.C.; Rocha, A.V.; Manies, K.L.; Harden, J.W.; Bond-Lamberty, B.P. Patterns of NPP, GPP, respiration, and NEP during boreal forest succession. Glob. Chang. Biol. 2011, 17, 855–871. [Google Scholar] [CrossRef] [Green Version]
  13. Goetz, S.J.; MacK, M.C.; Gurney, K.R.; Randerson, J.T.; Houghton, R.A. Ecosystem responses to recent climate change and fire disturbance at northern high latitudes: Observations and model results contrasting northern Eurasia and North America. Environ. Res. Lett. 2007, 2, 045031. [Google Scholar] [CrossRef]
  14. Amiro, B.; Orchansky, A.; Barr, A.; Black, T.; Chambers, S.; Iii, F.C.; Goulden, M.; Litvak, M.; Liu, H.; McCaughey, J.; et al. The effect of post-fire stand age on the boreal forest energy balance. Agric. For. Meteorol. 2006, 140, 41–50. [Google Scholar] [CrossRef] [Green Version]
  15. Beck, P.S.A.; Goetz, S.J. Satellite observations of high northern latitude vegetation productivity changes between 1982 and 2008: Ecological variability and regional differences. Environ. Res. Lett. 2011, 6, 045501. [Google Scholar] [CrossRef]
  16. Flade, L.; Hopkinson, C.; Chasmer, L. Allometric equations for shrub and short-stature tree aboveground biomass within boreal ecosystems of northwestern Canada. Forests 2020, 11, 1207. [Google Scholar] [CrossRef]
  17. Ecosystem Classification Group. Ecological Regions of the Northwest. Territories—Taiga Plains. Department of Environment and Natural Resources; Government of the Northwest Territories: Yellowknife, NT, Canada, 2007.
  18. Ecosystem Classification Group. Ecological Regions of the Northwest. Territories—Taiga Shield. Department of Environment and Natural Resources; Government of the Northwest Territories: Yellowknife, NT, Canada, 2008.
  19. Baskerville, G.L. Use of logarithmic regression in the examination of plant biomass. Can. J. For. 1972, 2, 49–53. [Google Scholar]
  20. Mascaro, J.; Labs, P.; Litton, C.M.; Schnitzer, S. Minimizing Bias in Biomass Allometry: Model Selection and Log—Transformation of Data. Biotropica 2011, 43, 649–653. [Google Scholar] [CrossRef] [Green Version]
  21. Konôpka, B.; Pajtík, J.; Moravčík, M.; Lukac, M. Biomass partitioning and growth efficiency in four naturally regenerated forest tree species. Basic Appl. Ecol. 2010, 11, 234–243. [Google Scholar] [CrossRef] [Green Version]
  22. Petersson, H.; Holm, S.; Ståhl, G.; Alger, D.; Fridman, J.; Lehtonen, A.; Lundström, A.; Mäkipää, R. Individual tree biomass equations or biomass expansion factors for assessment of carbon stock changes in living biomass—A comparative study. For. Ecol. Manag. 2012, 270, 78–84. [Google Scholar] [CrossRef] [Green Version]
  23. Johansson, T. Biomass production of Norway spruce (Picea abies (L.) Karst) growing on abandoned farmland. Silva. Fenn. 1999, 33, 261–280. [Google Scholar] [CrossRef] [Green Version]
  24. He, A.; McDermid, G.J.; Rahman, M.M.; Strack, M.; Saraswati, S.; Xu, B. Developing allometric equations for estimating shrub biomass in a boreal fen. Forests 2018, 9, 569. [Google Scholar] [CrossRef] [Green Version]
  25. Lantz, T.C.; Marsh, P.; Kokelj, S. Recent Shrub Proliferation in the Mackenzie Delta Uplands and Microclimatic Implications. Ecosystems 2013, 16, 47–59. [Google Scholar] [CrossRef]
  26. Moffat, N.D.; Lantz, T.C.; Fraser, R.H.; Olthof, I. Recent vegetation change (1980–2013) in the tundra ecosystems of the Tuktoyaktuk Coastlands, NWT, Canada. Arct. Antarct. Alp. Res. 2016, 48, 581–597. [Google Scholar] [CrossRef] [Green Version]
  27. Gower, S.T.; Vogel, J.G.; Norman, M.; Kucharik, C.J.; Steele, S.J. Carbon distribution and aboveground net primary production in aspen, jack pine, and black spruce stands in Saskatchewan and Manitoba, Canada. J. Geophys. Res. 1997, 29. [Google Scholar] [CrossRef]
  28. Bonan, G. Ecosystems. In Ecological Climatology; Cambridge University Press: Cambridge, UK, 2016; pp. 328–357. [Google Scholar] [CrossRef]
  29. Baldocchi, D.; Vogel, C. Energy and CO2 flux densities above and below a temperate broad-leaved forest and a boreal pine forest. Tree Physiol. 1996, 16, 5–16. [Google Scholar] [CrossRef] [Green Version]
  30. Thomas, H.J.D.; Bjorkman, A.D.; Myers-Smith, I.H.; Elmendorf, S.C.; Kattge, J.; Diaz, S.; Vellend, M.; Blok, D.; Cornelissen, J.H.C.; Forbes, B.C.; et al. Global plant trait relationships extend to the climatic extremes of the tundra biome. Nat. Commun. 2020, 11. [Google Scholar] [CrossRef]
  31. Lambert, M.-C.; Ung, C.-H.; Raulier, F. Canadian national tree aboveground biomass equations. Can. J. For. Res. 2005, 35, 1996–2018. [Google Scholar] [CrossRef]
  32. Ung, C.H.; Bernier, P.; Guo, X.J. Canadian national biomass equations: New parameter estimates that include British Columbia data. Can. J. For. Res. 2008, 38, 1123–1132. [Google Scholar] [CrossRef]
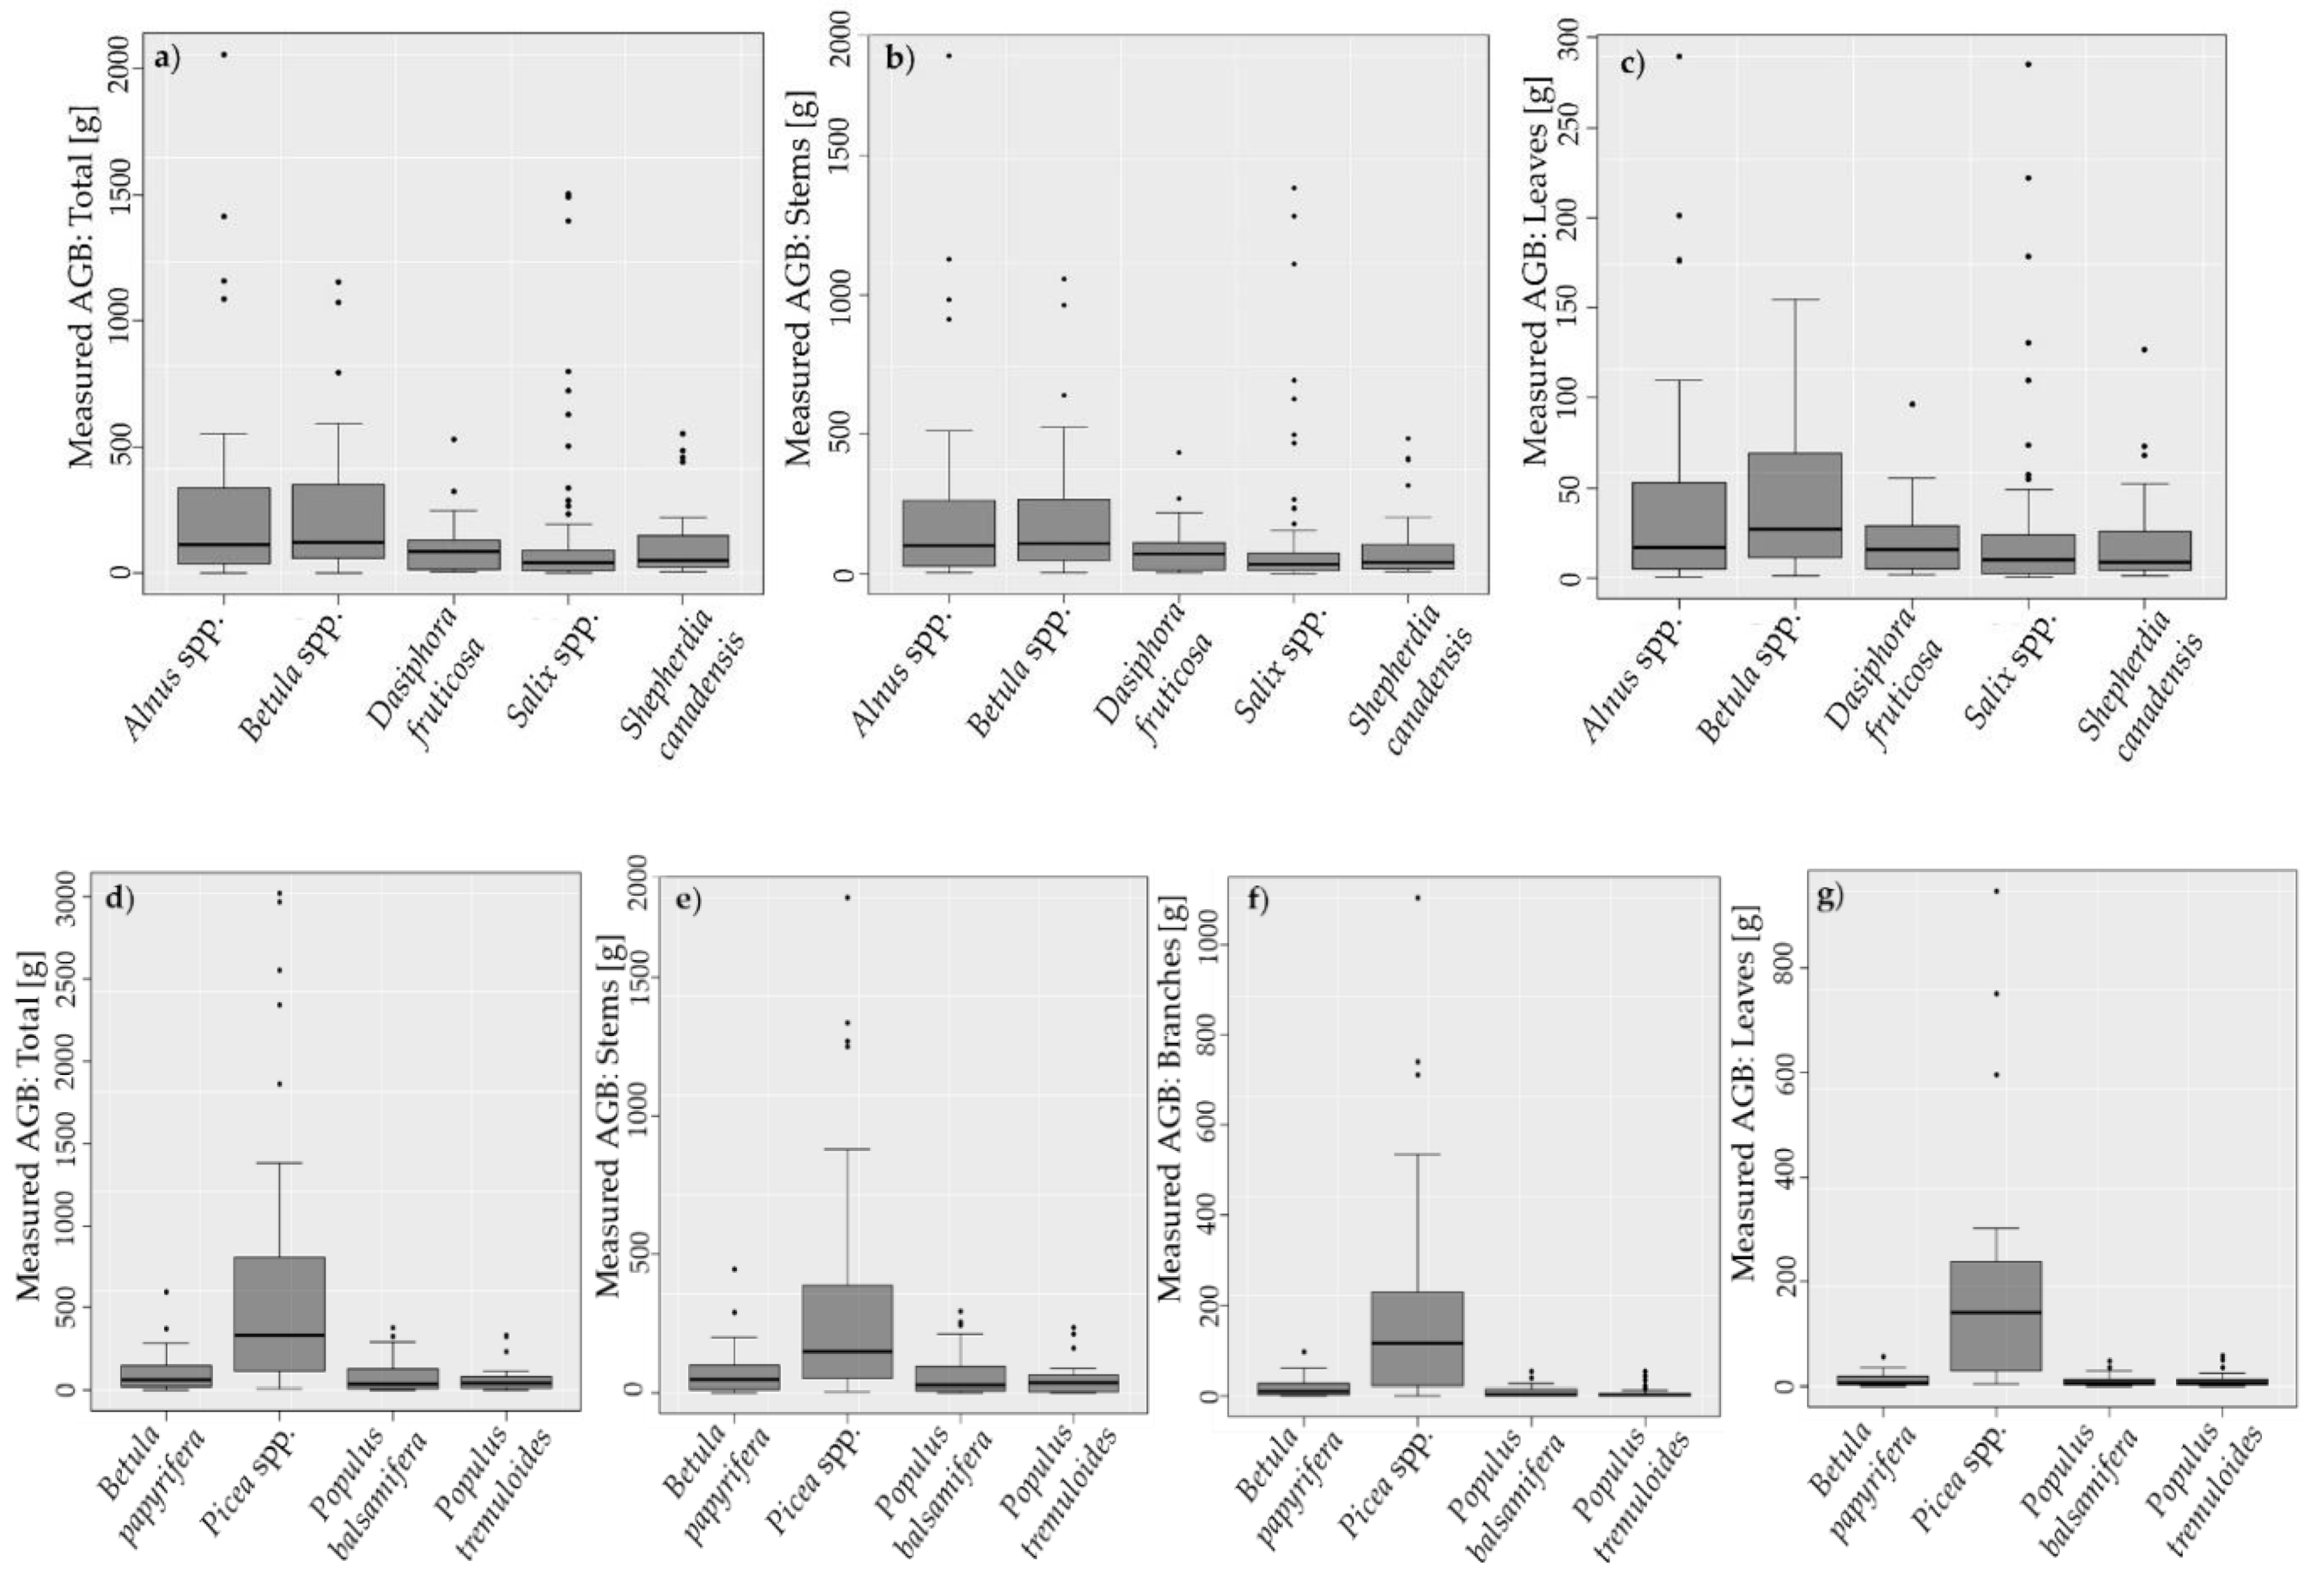
Figure 1. Area of harvested aboveground biomass of shrubs and trees, distributed across the sporadic to discontinuous permafrost zone of the Taiga Plains and Taiga Shield ecozones of boreal northwestern Canada.
Forests 12 00234 g001
Figure 2. Measured aboveground biomass [%] per plant component for common boreal (a) shrub and (b) short-stature tree genera/species.
Forests 12 00234 g002
Figure 3. Boxplots of measured aboveground biomass [g] per plant component (total, stem, branch, and leaf aboveground biomass (AGB)) for common boreal (ac) shrub and (dg) short-stature tree genera/species. Points represent outliers of the distribution.
Forests 12 00234 g003
Figure 4. Model fits and standardized residuals per plant component for multi-species (a,b) shrub and (c,d) short-stature tree AGB. Shrub and tree component AGB was modeled via iterative nonlinear least-squares regression, using volume and cross-sectional area as the predictor variable, respectively.
Forests 12 00234 g004
Table 1. Descriptive statistic per plant genus/species and plant component (range of values in parentheses, average ± standard deviation).
Plant Genus/SpeciesNo. of SamplesMaximum
Height [m]
Total
AGB [g]
AGB
Stems [g]
AGB
Branches [g]
AGB
Leaves/Needles [g]
Alnus spp.33[0.2; 3.2]
1.3 ± 0.7
[1.3; 2057.1] 311.4 ± 470.9[0.6; 1856]
264.8 ± 401.8
-[0.4; 289.7]
46.7 ± 68.0
Betula spp.46[0.2; 2.1]
1.1 ± 0.4
[4.0; 1154.1]
232.7 ± 261.1
[2.2; 1057.2]
188.2 ± 228.4
-[1.3; 154.7]
44.5 ± 42.3
Dasiphora fruticosa20[0.2; 0.9]
0.6 ± 0.4
[5.1; 530.8]
117.6 ± 127.9
[3.6; 434.6]
96.2 ± 105.8
-[1.5; 96.2]
21.4 ± 22.7
Salix spp.79[0.3; 2.8]
0.9 ± 0.5
[0.8; 1503.7]
143.3 ± 302.5
[0.4; 1381.4]
118.4 ± 261.1
-[0.4; 284.8]
24.9 ± 47.0
Shepherdia canadensis28[0.3; 1.7]
0.8 ± 0.4
[7.1; 552.0]
121.5 ± 158.9
[5.7; 484.0]
99.5 ± 134.9
-[1.1; 127.0]
22.0 ± 28.6
Betula papyrifera15[0.7, 3.4]
2.0 ± 0.8
[4.2; 596.2]
127.7 ± 162.2
[2.6; 444.9]
93.0 ± 122.4
[0.8; 95.7]
22.0 ± 26.1
[0.8; 55.6]
12.7 ± 14.8
Picea glauca14[0.4; 3.8]
1.8 ± 1.2
[10.5; 3021.8]
865.0 ± 992.4
[3.4; 1789.6]
426.1 ± 545.6
[1.2; 739.4]
212.5 ± 247.8
[5.9; 947.8]
226.4 ± 270.5
Picea mariana15[0.4; 3.6]
1.6 ± 0.9
[12.5; 2968.9]
668.5 ± 801.2
[4.3; 1269.6]
326.0 ± 412.2
[3.1; 1103.6]
195.2 ± 270.4
[5.1; 595.7]
157.1 ± 152.2
Populus balsamifera31[0.2; 4.2]
1.7 ± 1.1
[1.0; 380.9]
85.7 ± 103.3
[0.7; 294.9]
65.7 ± 81.3
[0.3; 53.1]
11.3 ± 13.7
[0.04; 47.0]
10.1 ± 11.1
Populus tremuloides30[0.4; 3.9]
1.8 ± 0.9
[1.1; 329.2]
67.8 ± 84.3
[0.5; 233.7]
50.2 ± 58.7
[0.04; 52.4]
8.6 ± 13.2
[0.2; 58.1]
10.9 ± 14.0
Table 2. Volume-based regression coefficient estimates with error statistics to be input into Equations (2)–(5) as appropriate to derive shrub component AGB.
ModelLN (β)βSE (β)αSE (α)CFRMSE [g]R2
Alnus spp.StemsLLRC5.104164.6793 0.9474 1.2166163.590.882
NLS 146.372030.01761.02100.1021 137.230.885
LeavesLLRC3.41830.5083 0.7862 1.179235.040.735
NLS 37.03928.51310.78050.1213 35.010.735
Betula spp.StemsLLRC5.415224.7525 0.8135 1.1766137.050.651
NLS 275.701028.24440.89800.1222 134.390.654
LeavesLLRC3.97753.3567 0.6370 1.206827.510.578
NLS 64.84465.16630.60470.1019 27.480.579
Dasiphora fruticosaStemsLLRC5.350210.6083 0.7564 1.160860.720.672
NLS 255.690031.38930.84900.2042 60.330.675
LeavesLLRC3.71441.0175 0.6228 1.180013.200.676
ILS 55.90386.567780.82690.1911 12.620.691
Salix spp.StemsLLRC5.161174.3387 0.8857 1.1364112.780.814
NLS 210.994022.31090.83200.0588 111.900.817
LeavesLLRC3.66439.0171 0.7380 1.176733.750.519
ILS 48.68475.68190.57340.0728 31.760.546
Shepherdia canadensisStemsLLRC5.073159.6526 0.7601 1.101862.160.789
NLS 192.05718.04950.66900.0849 60.680.801
LeavesLLRC3.50433.2482 0.6807 1.234223.740.380
NLS 38.95395.842770.45350.1263 21.770.427
Multi-
species Shrubs
StemsLLRC5.240188.6701 0.8642 1.1842123.310.795
NLS 220.146012.72770.81700.0337 120.100.796
LeavesLLRC3.69240.1250 0.7151 1.233531.520.586
NLS 50.47422.99200.59450.0393 30.120.600
Table 3. Regression coefficient estimates with error statistics based on cross-sectional area to be input into Equations (2)–(5) as appropriate to derive short-stature tree component AGB.
ModelLN (β)βSE (β)αSE (α)CFRMSE [g]R2
Betula papyriferaStemsLLRC3.97052.9845 1.2370 1.066040.880.898
NLS 41.499411.97281.54940.2193 36.630.913
BranchesLLRC2.63413.9294 1.1440 1.05428.330.900
NLS 12.71522.959961.29210.1826 8.080.905
LeavesLLRC2.1248.3645 1.0140 8.601270.000.882
NLS 7.86272.13021.21430.2150 5.700.853
Picea spp. StemsLLRC3.89449.1069 1.0670 1.0782170.970.928
NLS 42.843711.94271.22010.1030 129.290.929
BranchesLLRC3.43030.8766 1.0230 1.112994.070.892
NLS 19.18426.64971.28660.1272 80.780.904
LeavesLLRC3.82145.6498 0.8059 1.1088123.210.702
NLS 42.299817.98150.91480.1635 119.890.704
Populus balsamiferaStemsLLRC3.80544.9253 1.1320 1.164825.460.919
NLS 47.35125.57761.32350.1053 22.430.924
BranchesLLRC1.7735.8885 1.1140 1.47586.880.736
NLS 7.68721.86981.23400.2211 6.830.737
LeavesLLRC2.0287.5989 1.0370 1.45775.810.832
ILS 8.319541.16951.10070.1313 4.530.834
Populus tremuloidesStemsLLRC3.77043.3801 1.0670 1.162713.640.950
NLS 41.70583.06811.26580.0680 11.720.960
BranchesLLRC1.6825.3763 1.0910 1.53806.180.816
NLS 4.59101.00361.81270.1858 4.420.888
LeavesLLRC2.2559.5353 0.8919 1.13656.500.854
NLS 8.072531.03641.43620.1149 4.110.917
Hardwood TreesStemsLLRC3.83046.0625 1.1220 1.148230.870.887
NLS 41.42123.96941.44310.0807 26.480.904
BranchesLLRC1.9276.8689 1.1270 1.48938.70.760
NLS 6.48251.16071.59660.1475 8.000.789
LeavesLLRC2.1388.4825 0.9655 1.24345.570.826
NLS 8.286830.82421.22250.0872 4.440.841
Multi-
species Trees
StemsLLRC3.83346.2009 1.1090 1.129680.190.939
NLS 49.17905.07721.17120.0393 73.170.940
BranchesLLRC2.33610.3398 1.2690 1.656851.610.919
NLS 12.79202.22831.43150.0639 45.080.923
LeavesLLRC2.58413.2500 1.1070 1.505573.110.768
NLS 20.28914.65841.18070.0872 67.960.767
Publisher’s Note: MDPI stays neutral with regard to jurisdictional claims in published maps and institutional affiliations.

