Article

Performance and Phenotypic Stability of Norway Spruce Provenances, Families, and Clones Growing under Diverse Climatic Conditions in Four Nordic Countries

Norwegian Institute of Bioeconomy Research (NIBIO), Division of Forestry and Forest Resources, P.O. Box 115, NO-1431 Ås, Norway
*
Author to whom correspondence should be addressed.
Forests 2021, 12(2), 230; https://doi.org/10.3390/f12020230
Submission received: 13 January 2021 / Revised: 12 February 2021 / Accepted: 13 February 2021 / Published: 17 February 2021

Abstract

:
Genetic variation and phenotypic stability in Norway spruce were studied based on provenances, families, and clones planted in trials at 12 sites in four Nordic countries. The families were generated in a factorial cross between 10 parents of Norwegian origin and 10 parents of Eastern European origin, and the clones were propagated from seedlings within 20 of the same families. Traits analyzed were survival, proportion of trees with stem defects, and tree heights. Stability was analyzed by regression analyses with the genetic entries’ annual shoot increment as the dependent variable and the total site mean as an environmental index. Information about growth and phenology traits were available from short-term tests. For tree heights, significant variance components were present both among female and male parents, but not for their interactions, indicating that non-additive genetic effects are small. Genotype × environment interactions were significant at all three genetic levels, but their variance components had considerably lower values than the variance components estimated for the effects of families and clones. For the set of families of Norwegian origin, strong relationships were observed between the timing of annual shot elongation, mortality, and height growth. Large variation was found at all three genetic levels for phenotypic stability measured by regression coefficients. A positive relationship was present between the regression coefficient and the timing of annual shoot growth for families, indicating that later flushing families responded more to a high site index. The regression coefficient can be a useful supplement to the breeding value when selecting for superior and stable genotypes.

1. Introduction

The norm of reaction of a genotype describes its pattern of phenotypic response to changing environmental growth conditions. It characterizes its phenotypic plasticity, which is the ability of the genotype to form varying phenotypes. A related concept, more appropriate when considering the growth performance of forest trees in a series of trials, is phenotypic stability, which is here defined in the dynamic sense [1]: a genetic unit is said to be stable if its growth performance is similarly related to the mean production level at sites with different environmental conditions for growth. Deviations from the general response function of all genetic units tested are considered as contributions to instability. If norms of reaction of different genotypes are not parallel, then genotype × environment (G × E) interactions are present. Such instability causes changes in the ranking of the genotypes growing at different environments. This has implications in tree breeding, where one objective is to produce reproductive materials that have a stable and high growth performance across a wide range of environmental conditions. The materials should also be stable with temporal environmental variation at the same site (e.g., climate change). If the interactions are related to predictable factors such as site and climate, they can to some extent be adjusted for by subdivision of breeding and deployment zones [2]. However, the breeders of Norway spruce in the Nordic countries must consider that environmental heterogeneity is substantial within actual zones for factors such as soil productivity and local climatic conditions. More knowledge of the genetic components of phenotypic stability in Norway spruce and its implications in selection should therefore be provided.
In Norway spruce (Picea abies (L.) Karst.) trials in the Nordic countries some G × E interactions for height growth have been demonstrated both for provenances [3], families [4,5], and sets of clones [6,7]. In the lowland of southern Scandinavia, the main cause of the interactions in this species seems to be damage caused by late spring frosts [7]; clones with an early bud flush contributed most to the G × E interactions. In an analysis of G × E interactions for height growth in breeding populations in southern Sweden, the interactions were low to moderate and largely unpredictable [6], and with spring frost damage as an important factor. It has been suggested that the same genetic material could be used over large areas in southern Sweden [2,5,7]. However, in a recent study of Norway spruce progeny trials in southern and central Sweden [8], quite strong G × E interactions were found for tree height, and climate indices of spring and autumn temperature could account for a large amount of these interactions, with frost damage as the important cause. Substantial non-additive genetic effects for height and diameter in Norway spruce were found for clones from full-sib and half-sib families [9], and G × E interactions were strong for non-additive genetic effects.
The present study is based on assessments and measurements made in 15 field trials in four Nordic countries comprising provenances, full-sib families, and clones of Norway spruce. The origin and selection history varied between the parents of the full-sib families. Our objective is to present the variability and inheritance patterns at three genetic levels and the implications of different genetic backgrounds of the full-sib families and clones. Furthermore, as significant G × E interactions were found for tree height, we wanted to characterize the genetic variation in phenotypic stability of performance across multiple sites and show how this response parameter is related to phenology traits. Selection for stability in breeding of Norway spruce will be discussed.

2. Materials and Methods

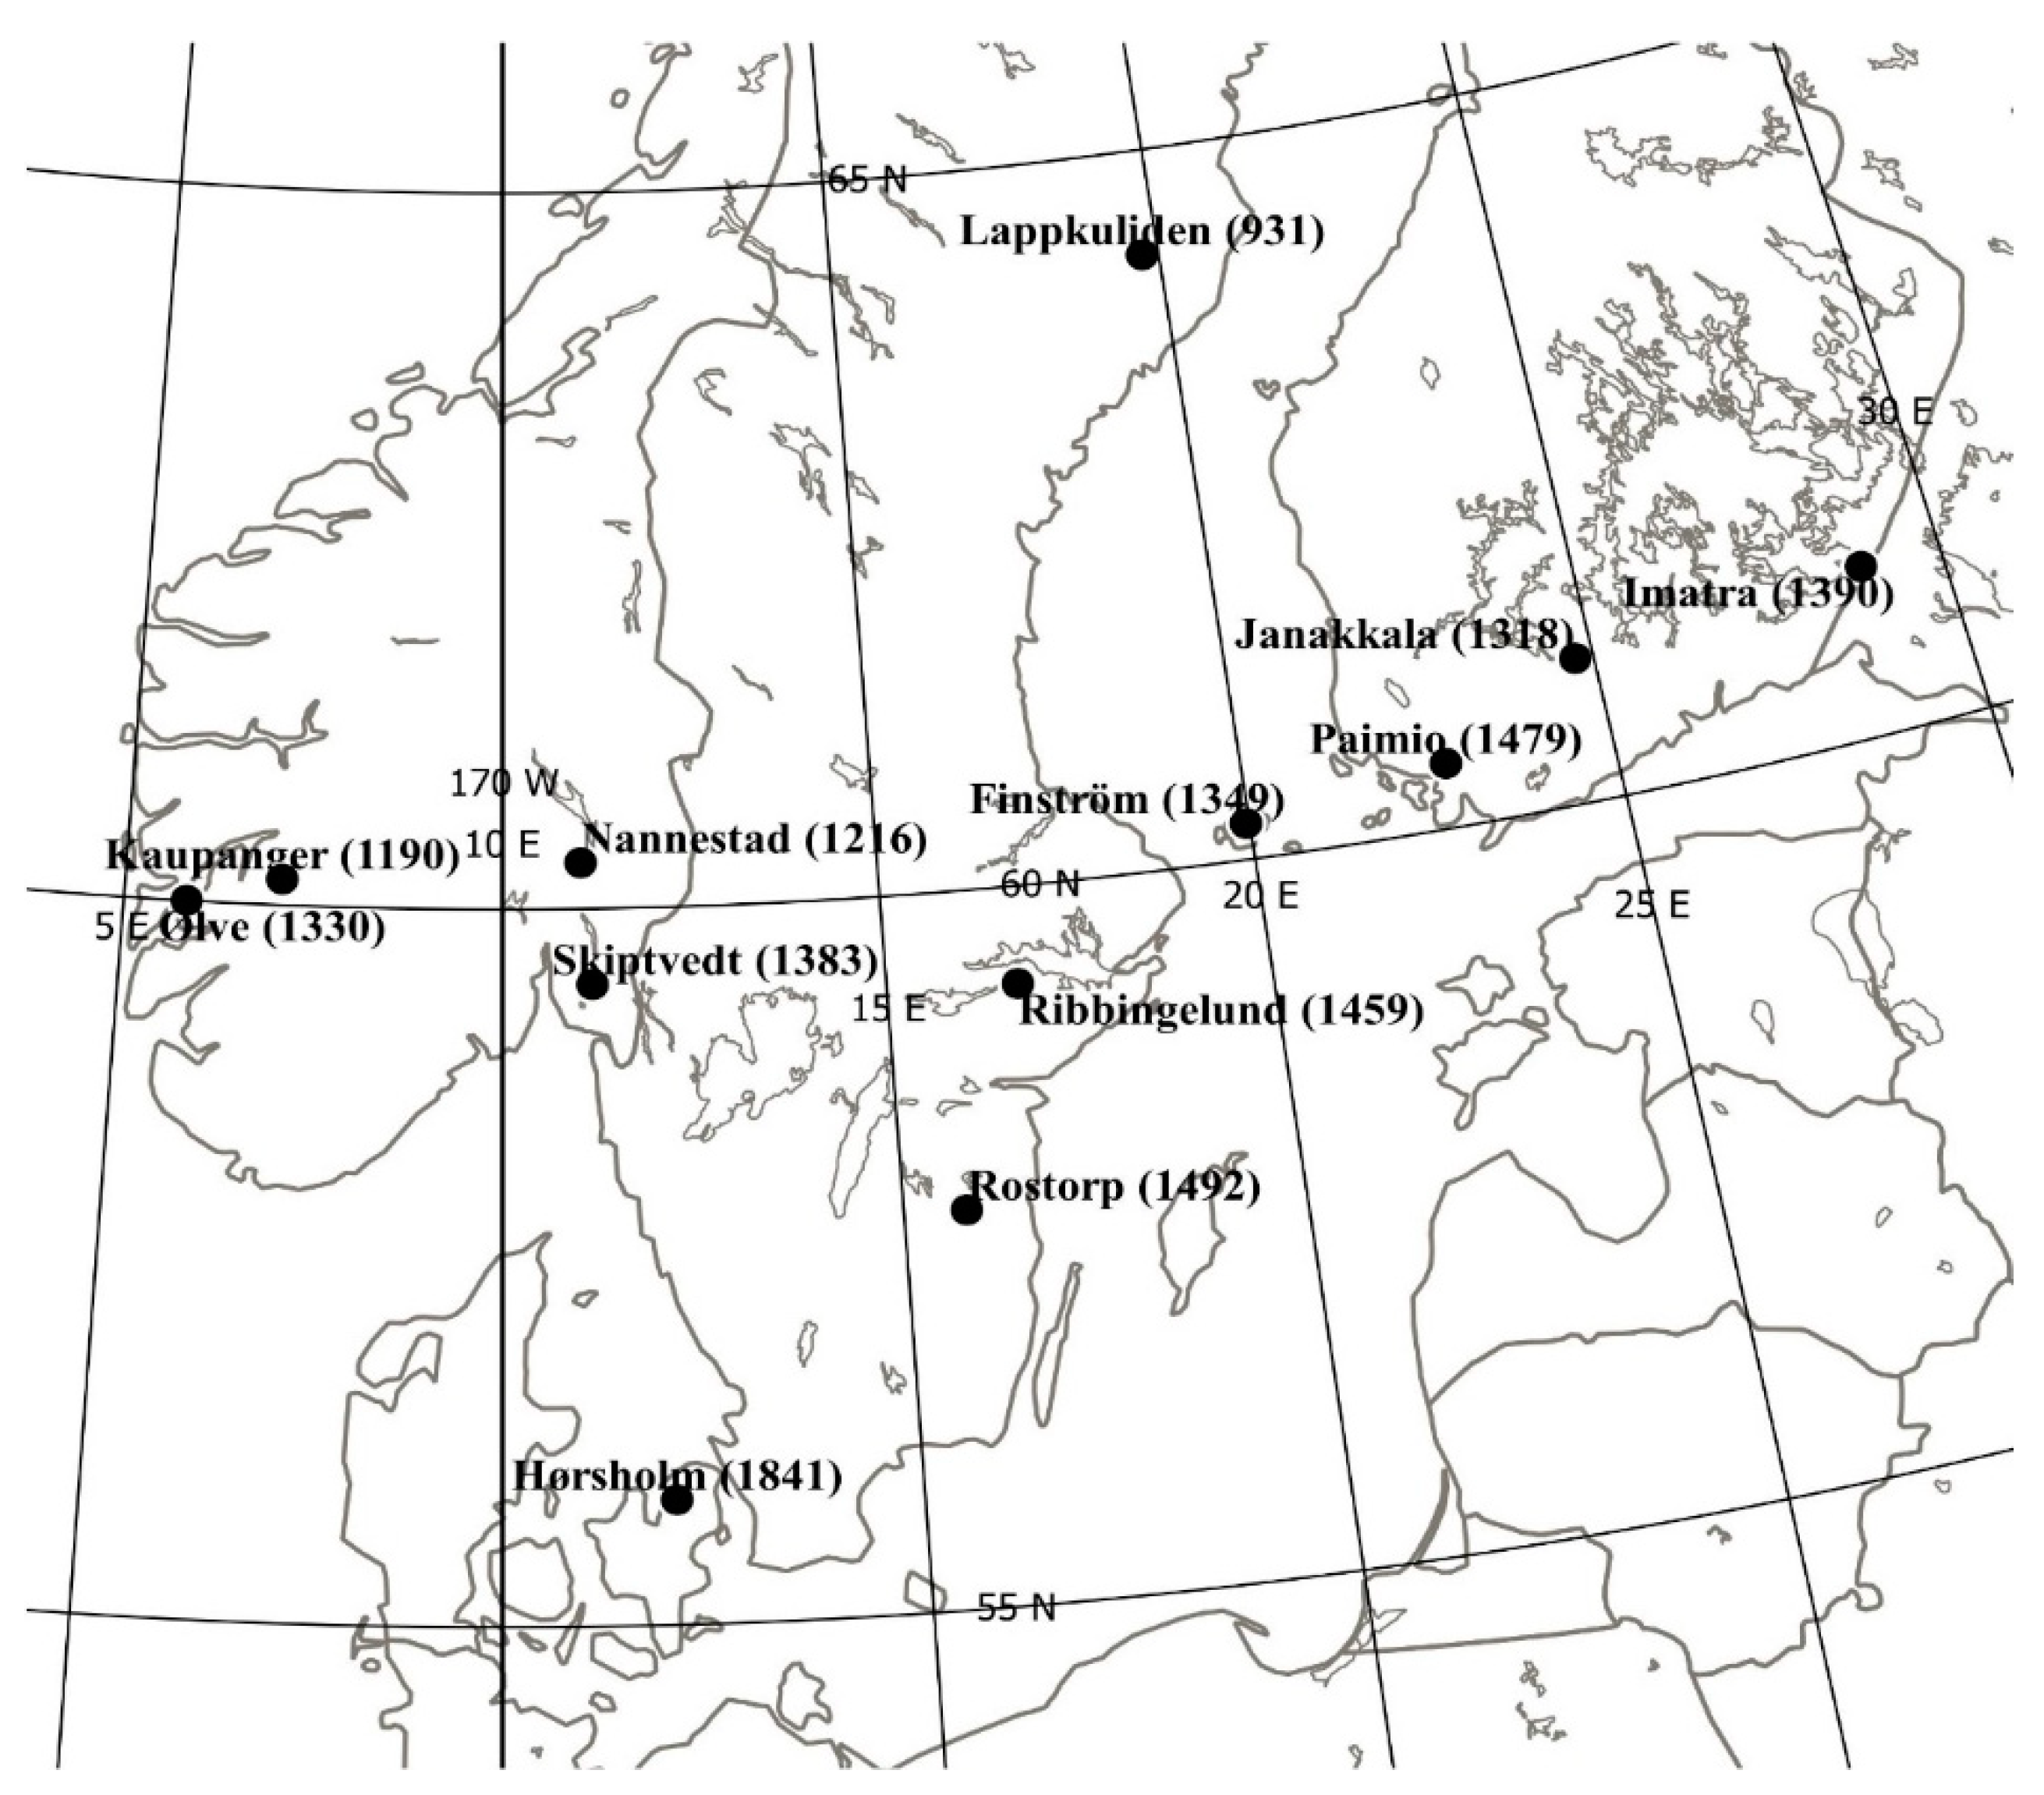
2.1. Materials, Trials, and Measurements

Seedlings from 20 Norway spruce provenances, 100 full-sib families from a 10 × 10 factorial cross and 240 clones from a subset of 20 of the families, were planted in 17 field trials at 12 sites in Norway, Sweden, Finland, and Denmark in 1988 and 1989 (Table 1, Figure 1). Seedlings from the 100 full-sib families had earlier been planted in a short-term trial in Norway, and data from early height growth and phenology traits are available from this trial [10].
The materials planted in 1988 at seven sites comprise seedlings from 100 full-sib families after controlled crosses made in 1983 at Stange Seed Orchard in Norway (lat. 60°43′ N, long. 11°11′ E, alt. 180 m) and from 20 provenances. Eight of the provenances were from Sweden and Finland, six were from Eastern Europe, four were from the Carpathian Mountains, and two were from Harz, Germany. At the site Rostorp (trial 3), only six provenances were planted. The full-sib families had been generated in a complete 10 × 10 factorial cross. One group of ten parents were plus-trees originating from natural stands in a rather limited geographical area between altitudes 40 and 320 m in southern Norway (N). The other group of ten parents were young plus-trees selected from five outstanding Eastern European (E) provenances from latitudes between 47° and 57° and altitudes between 80 and 720 m in Romania, Belarus, North-East Poland, and Latvia, in the international Norway spruce provenance trial of 1938 planted at Södra Bäcksjö, Sweden, latitude 63°56′ [11]. The selections were done in 1967, at age 25 years from planting. These trees were phenotypically selected for superior height growth and absence of stem defects such as double stems, forking, and ramicorn branches [10]. In the factorial cross, five parents from each of the two groups of origin were used as maternal and five as paternal parents (Table 2). Thus, the 100 full-sib families can logically be sub-divided into four separate groups of crosses based on the origin of the parents: N × N, N × E, E × N, and E × E. Eight of the field trials were in 1989, planted with rooted cuttings from a selected set of 20 of the full-sib families. These 20 families were pairwise related with one parent in common, as shown in Table 2.
The field test sites cover a wide range of environmental conditions in the Nordic countries (Table 1, Figure 1) regarding temperature climate, rainfall, and distance from the coast. Several sites are located at approximately the same latitude (60° N), being situated from the Atlantic oceanic coastal climate of West Norway, in East Norway, in Central Sweden, on the Åland Islands, and in the coast and interior of Finland. In addition, one southern site, Hørsholm, Denmark, and one northern, Lappkuliden, Sweden, are included. Both types of trials were planted at the same location at Lappkuliden, Paimio, and Imatra. The sites Lappkuliden, Imatra, and Hørsholm are outside the recommended deployment area for seedlings from seed produced in Stange Seed Orchard.
Climate reference data for the sites were obtained for the sites in Norway based on weighted mean values of the 1961–1990 period from the closest meteorological stations [12]. For the sites in Sweden, Finland, and Denmark, the data were derived from meteorological observations interpolated into high resolution gridded data in climate models [13]. The range of mean annual temperature is from 2.0 to 8.8 °C for the 12 sites, and the temperature sum, calculated as the accumulated daily mean temperatures above 5 °C, varies from 931 to 1841 degrees (Figure 1).
The seedlings for the family and provenance trials were produced at Biri Nursery (60.95° N, 10.60° E, 160 m elevation), Norway, and were one year old when they were planted in the spring of 1988. Six of the seven trials were planted at forest sites at a spacing of either 1.8 or 2 m. One of the trials (Paimio) was planted at agricultural soils at 1 m spacing. The experimental design was, in all trials, single tree plots with families and provenances mixed and randomized in 40 replicates.
The rooted cuttings for clonal trials were also produced at Biri Nursery and were planted in 1989 two growth seasons after propagation. From each of the 20 full-sib families, 18 clones were originally propagated, and 12 of these were selected to be included in the trials. One ramet of each clone was planted in single tree plots in a randomized block design with six replicates. Six of the eight trials were planted at forest sites and two on agricultural soils (Paimio and Hørsholm).
Tree heights were measured in the field trials nine (two trials), ten (eleven trials), or eleven (two trials) growing seasons after planting, and assessments were made of each tree whether it had double stems, forks, or ramicorn branches, hereafter called stem defects. Assessments of bud burst in scoring classes [14] were made in 1999 in the clone trial at Kaupanger. In one of the two the short-term trials established earlier at Ås, Norway, with the 100 families, the elongation of terminal shoots was measured weekly during the growing season in 1989 and 1990, and Weibull shoot elongation curves were estimated [10]. From these curves, the days of initiation and cessation of shoot elongation, counted in days from April 1, were estimated separately for each tree. Least square family means (LS) of these traits will be related to measurements made in the field trials. Similar measurements were made in the trial at Skiptvedt during the growing season in 1992 [10], and means of provenances were calculated for the same traits.

2.2. Measures of Phenotypic Stability

Several criteria are available for characterizing phenotypic stability [1,4,15]. Here, regression coefficients were calculated for each genetic unit using its mean annual shoot growth at each site as the dependent variable and the site mean as an environmental index and explanatory variable in linear regression analyses. Due to unequal ages, when measurements were made, regression analyses were done on tree heights divided by the age when measured, here denoted by height increment. The regression coefficient b of each genetic unit characterizes its specific response in height growth to the changing environmental conditions defined by the mean performance of all genotypes and is an indirect measure of its phenotypic stability. It is a measure of the relationship between the interaction effects and the environmental values [15]. If the estimated regression coefficient b is close to 1, then the genetic unit has an average response to the site conditions and its growth performance parallels that of the site means. A b > 1.0 indicates relative high performance at the most productive sites, while a b < 1.0 indicates relative better growth on low yielding sites. Large deviations from the regression line characterize a low fit to the estimated response and instability in height growth relative to the mean performance, caused by sampling errors or non-linearity, and can be measured by the deviation mean square in the regression or the coefficient of determination (R2) [1]. These two measures are strongly related, and the latter will be used here. Both b and R2 are independent of the units of measurements.
An alternative index of the environmental conditions in each trial could be the site mean height of the 10% tallest trees in each replicate, regardless of their provenance or family relationships. This parameter should estimate the production potential of a forest site and is like the “dominating tree height” [16], which often is used as a site index. Regressions analyses were here also performed with this index and with annual mean temperature and the degree days at each site as explanatory variables.

2.3. Calculations and Statistical Analyses

The percentage of dead trees (mortality) and the percentage of trees with at least one type of stem defects were calculated for each genetic entry in each trial, and the percentages were transformed by the log square-root transformation before statistical analyses were made.
Mean provenance and family values were available from earlier analyses [10] for the days of shoot growth initiation (Day1) and cessation (Day2). Mean values for flushing scores of clones were available from the clone trial at Kaupanger.
Separate analyses of variance of heights were made within each site both in the provenance and family trials and in the clonal trials using SAS Proc Mixed and Proc GLM [17]. The significance of variance components was tested by F-tests, specifying Method = Type 3. As there were some differences in the root mean square errors (RMSE) among sites from these analyses, transformations were made by dividing the individual tree heights by the RMSE in each trial. Statistical analyses across sites were then performed based both on the original heights and on their transformed values. Least square (LS) height means of all genetic entries at each site were estimated by Proc GLM.

2.3.1. Provenance Data

Analyses of variance of height growth across site for the provenances were based on the model
Yijk = µ + Pi + Sj + PSij + Bjk + Eijk
where µ is the general mean, Pi is the fixed effect of provenance i, Sj is the fixed site effect, PSik is the interaction between provenance and site, Bkl is the random block effect within site, and Eijk is the random error term.

2.3.2. Family Data

The two groups of parents, Norwegian (N) and Eastern European (E), belong to populations with different origins and different selection histories and show different patterns of variability [10]. It was therefore found necessary to make quantitative genetic analyses in each of the small 5 × 5 factorials separately, a fact that limits the generalizations that are drawn from estimated genetic parameters [10]. In the analyses and presentations focus has been on the N × N and E × E family groups. The low number of parents and families is also the reason why no attempts were made to separate the total genetic variance into additive, dominance, and epistatic components, which can be done when measurements are available from trials with families and clones within families [9,18,19].
The analyses of variance of height across sites were therefore done separately within each of the four groups of crosses, according to the model
Yijkl = µ + Fi + Mj + FMij + Sk + FSik + MSjk + FMSijk+ Bkl + Eijkl
where µ is the general mean, Fi is the effect of female parent i, Mj that of male parent j, FMij is the interaction between female parent i and male parent j, Sk is the site effect, FSik, MSjk, and FMSijk are the three interactions with parents and site, Bkl is the block effect within site, and Eijkl is the random within plot error term. All effects, except Sk, are assumed to be random with expectations 0 and respective variance components. The analyses were made across all sites and with the two most extreme sites Lappkuliden and Imatra excluded.

2.3.3. Clonal Data

The five full-sib families that are represented by clones within each of the four crossing groups were analysed across sites according to the following model
Yijkl = µ + FAi + Cij + Sk + FASik + CSijk + Bkl + Eijkl
where µ is the general mean, FAi is the effect of full-sib family i, C ij that of clone within family, Sk is the site effect, FASik is the interaction between family and site, CSijk is the interaction between clones (within family) and site, Bkl is the block effect within site, and Eijkl is the random error term. All effects, except Sk, are assumed to be random with expectations 0 and respective variance components. Analyses of variance within each site were based on similar models, but with the site effect and genetic entry by site interactions excluded. The narrow sense heritability in the family trials was calculated for the N × N and E × E families as twice the sum of the female and male variance components divided by the total phenotypic variance that was the sum of all the other variance components, except the block components. The broad sense heritability in the clonal trial was similarly calculated as the sum of the family and clone components divided by the total phenotypic variance. The standard errors of the heritabilities were calculated by the Taylor expansion for variances of ratios [15].
Pearson correlation coefficients for height between pairs of sites for the three types of material were calculated based on LS means at each site. Correlation coefficients were calculated between the family means for the day of growth initiation and growth cessation in the short-term test and mean tree height, percent mortality, and percentage of trees with stem defects in the field trials.
Height measurements were made in the trials at different ages, after nine, ten, or eleven growth seasons. Therefore, the mean annual height increment (LS) was calculated for all genetic entries to make in order to compare the phenotypic response of provenances, families, and clones to the varying site conditions. Linear regression analyses by SAS Proc Reg were performed using this mean increment at each site as dependent variable and the total site mean height increment as independent variable. For the provenances, families, and clones, a total of 20, 100, and 240 regressions coefficients, respectively, were estimated. The regression analyses were made both for the original increments and for their transformed values. As there were high correlations between the regression coefficients from the two analyses (r = 0.80–0.95), only the results from the first analyses will be presented. Regression analyses were also made for the family trials using the mean annual height increment of the 10% tallest trees per replicates as site index and explanatory variable and also based on the annual mean temperature and degree days for the trial sites.
For the family trials, a factorial analysis of variance of the regression coefficients for all 100 families was made with the female and male parents as the main effects and their interaction as the error term. A similar analysis was made for the clones, with the terms families and clones within families in the model. These analyses were based on models (4) and (5) for families and clones, respectively,
Yij = µ + Fi + Mj + Eij
Zik = µ + FAi + Cikk
where Yij and Zik are the regression coefficients for family ij and clone ik, respectively, and F and Mj are the parental effects in the factorial cross, Eij is the interaction between the two parents, and FAi and Cik are the family and clone within family effects.

3. Results

3.1. Mortality and Stem Defects

The mean mortality and the percentage of trees with stem defects varied considerably among the sites (Table 1). However, there were no relationships present between these trial means and the site mean annual temperature or temperature sum. For provenances, the variation in mean mortality across sites was significant (p < 0.01) and varied from 23% to 43% with lowest values for the Nordic and Eastern European provenances. The same provenances also had the lowest percentage of trees with stem defects, varying from 16% to 35% among provenances, but these differences were not significant. Among the 100 full-sib families, the mean mortality ranged from 24% to 40% and for stem defects from 8% to 37%. Only minor differences in mortality were present among the four groups of crosses, whilst the mean percentage of defects varied from 16% to 23% with the lowest mean for the E × E and highest mean for the N × N families. In the clonal trials, small differences were present for mortality both for crossing types and for families. The percentages of stem defects showed larger variation, with a mean of 32% for clones from the N × N and 19% for those from the E × E crosses. The provenance hybrid families were intermediate. The mean frequencies of defects of the 20 families that were represented both with clones and seedlings were strongly related (r = 0.86).

3.2. Height

At all sites, significant differences (p < 0.001) were present for height among both the female and male parents in all four groups of crosses (analyses not shown). In the clonal trials, there were significant differences (p < 0.001) for height among families and clones within families, with a range among clones from 49% to 180% of the site mean (analyses not shown).
Analyses of variance across sites were made both of tree heights and their transformed values and showed significant variation both for provenances, families, clones within families, and their interactions with sites. As minor differences in results were present between the two types of analyses, only those made on the original tree heights are presented.
The mean height across sites for the provenances was 202 cm, with a range of variation from 158 to 230 cm. The eight Nordic provenances had a mean height of 190 cm, while the six provenances from Eastern Europe had a mean of 215 cm. The variation among provenances was significant (p < 0.0001), and there was a significant interaction among provenances and sites (p < 0.0001). In a separate analysis of the eight Nordic provenances, they differed significantly (p < 0.0001), but the interaction with sites was now not significant (p = 0.09).
The mean height for the families was 214 cm, with a range of variation from 171 to 249 cm among the 100 full-sib families. In the analyses of variance, considerably larger variance components were found for the female and male parents in the N × N than in the E × E crosses, and the estimates of heritability were 0.20 and 0.03, respectively (Table 3). The female x male variance components showed low values and were not significant in three of the four crossing groups. Significant interactions between parents and sites were present in all four groups. In additional analyses made, excluding the two most extreme sites Lappkuliden (northern) and Imatra (eastern), the interactions were still significant and with quite similar values of the variance component estimates.
In the trials with clones, similar differences in patterns of variation were present between the N × N and E × E family groups (Table 4). The clone within family component was slightly lower than the family component in the N × N families, and slightly higher in the E × E families. Both interaction variance components (family × site and clone (family) × site) were significant in all four family groups. These were, however, in most cases considerably smaller than the family and clone components. The proportional variance of the family and clone within family components, interaction components, and the error component were 26%, 6%, and 68%, respectively, in the N × N family group, and 15%, 8%, and 77% in the E × E families. The estimates of the broad sense heritability were, as expected, higher than the narrow sense estimates from the family trials. In separate analyses, excluding the Lappkuliden and Imatra sites, or the Hørsholm site, the relative values of the interaction components were slightly reduced and those for components for families and clones within families increased, but most components were still significant at the 5% level.
The interaction between provenances and trials for height is reflected in the phenotypic correlations between pairs of trials (not shown). Only low, or even negative, values were estimated for the correlation coefficients between the mean heights of the provenances at the site on the west coast of Norway and in the other trials. The three sites in Finland have the closest relationship with pairwise correlation coefficients in the range 0.55–0.66.
For the 25 N × N families, there were in general medium to high values of the correlation coefficients between pairs of trials in the range 0.51–0.80. Rather low relationships were present among sites for the 25 families in the E × E crosses, most likely due to the lesser variation among families.
The correlation coefficients between pairs of trials for clones had generally low values in the range 0.20–0.59. They were considerably higher when they were calculated for family means, based on the 12 clones, with values between 0.46 and 0.83.

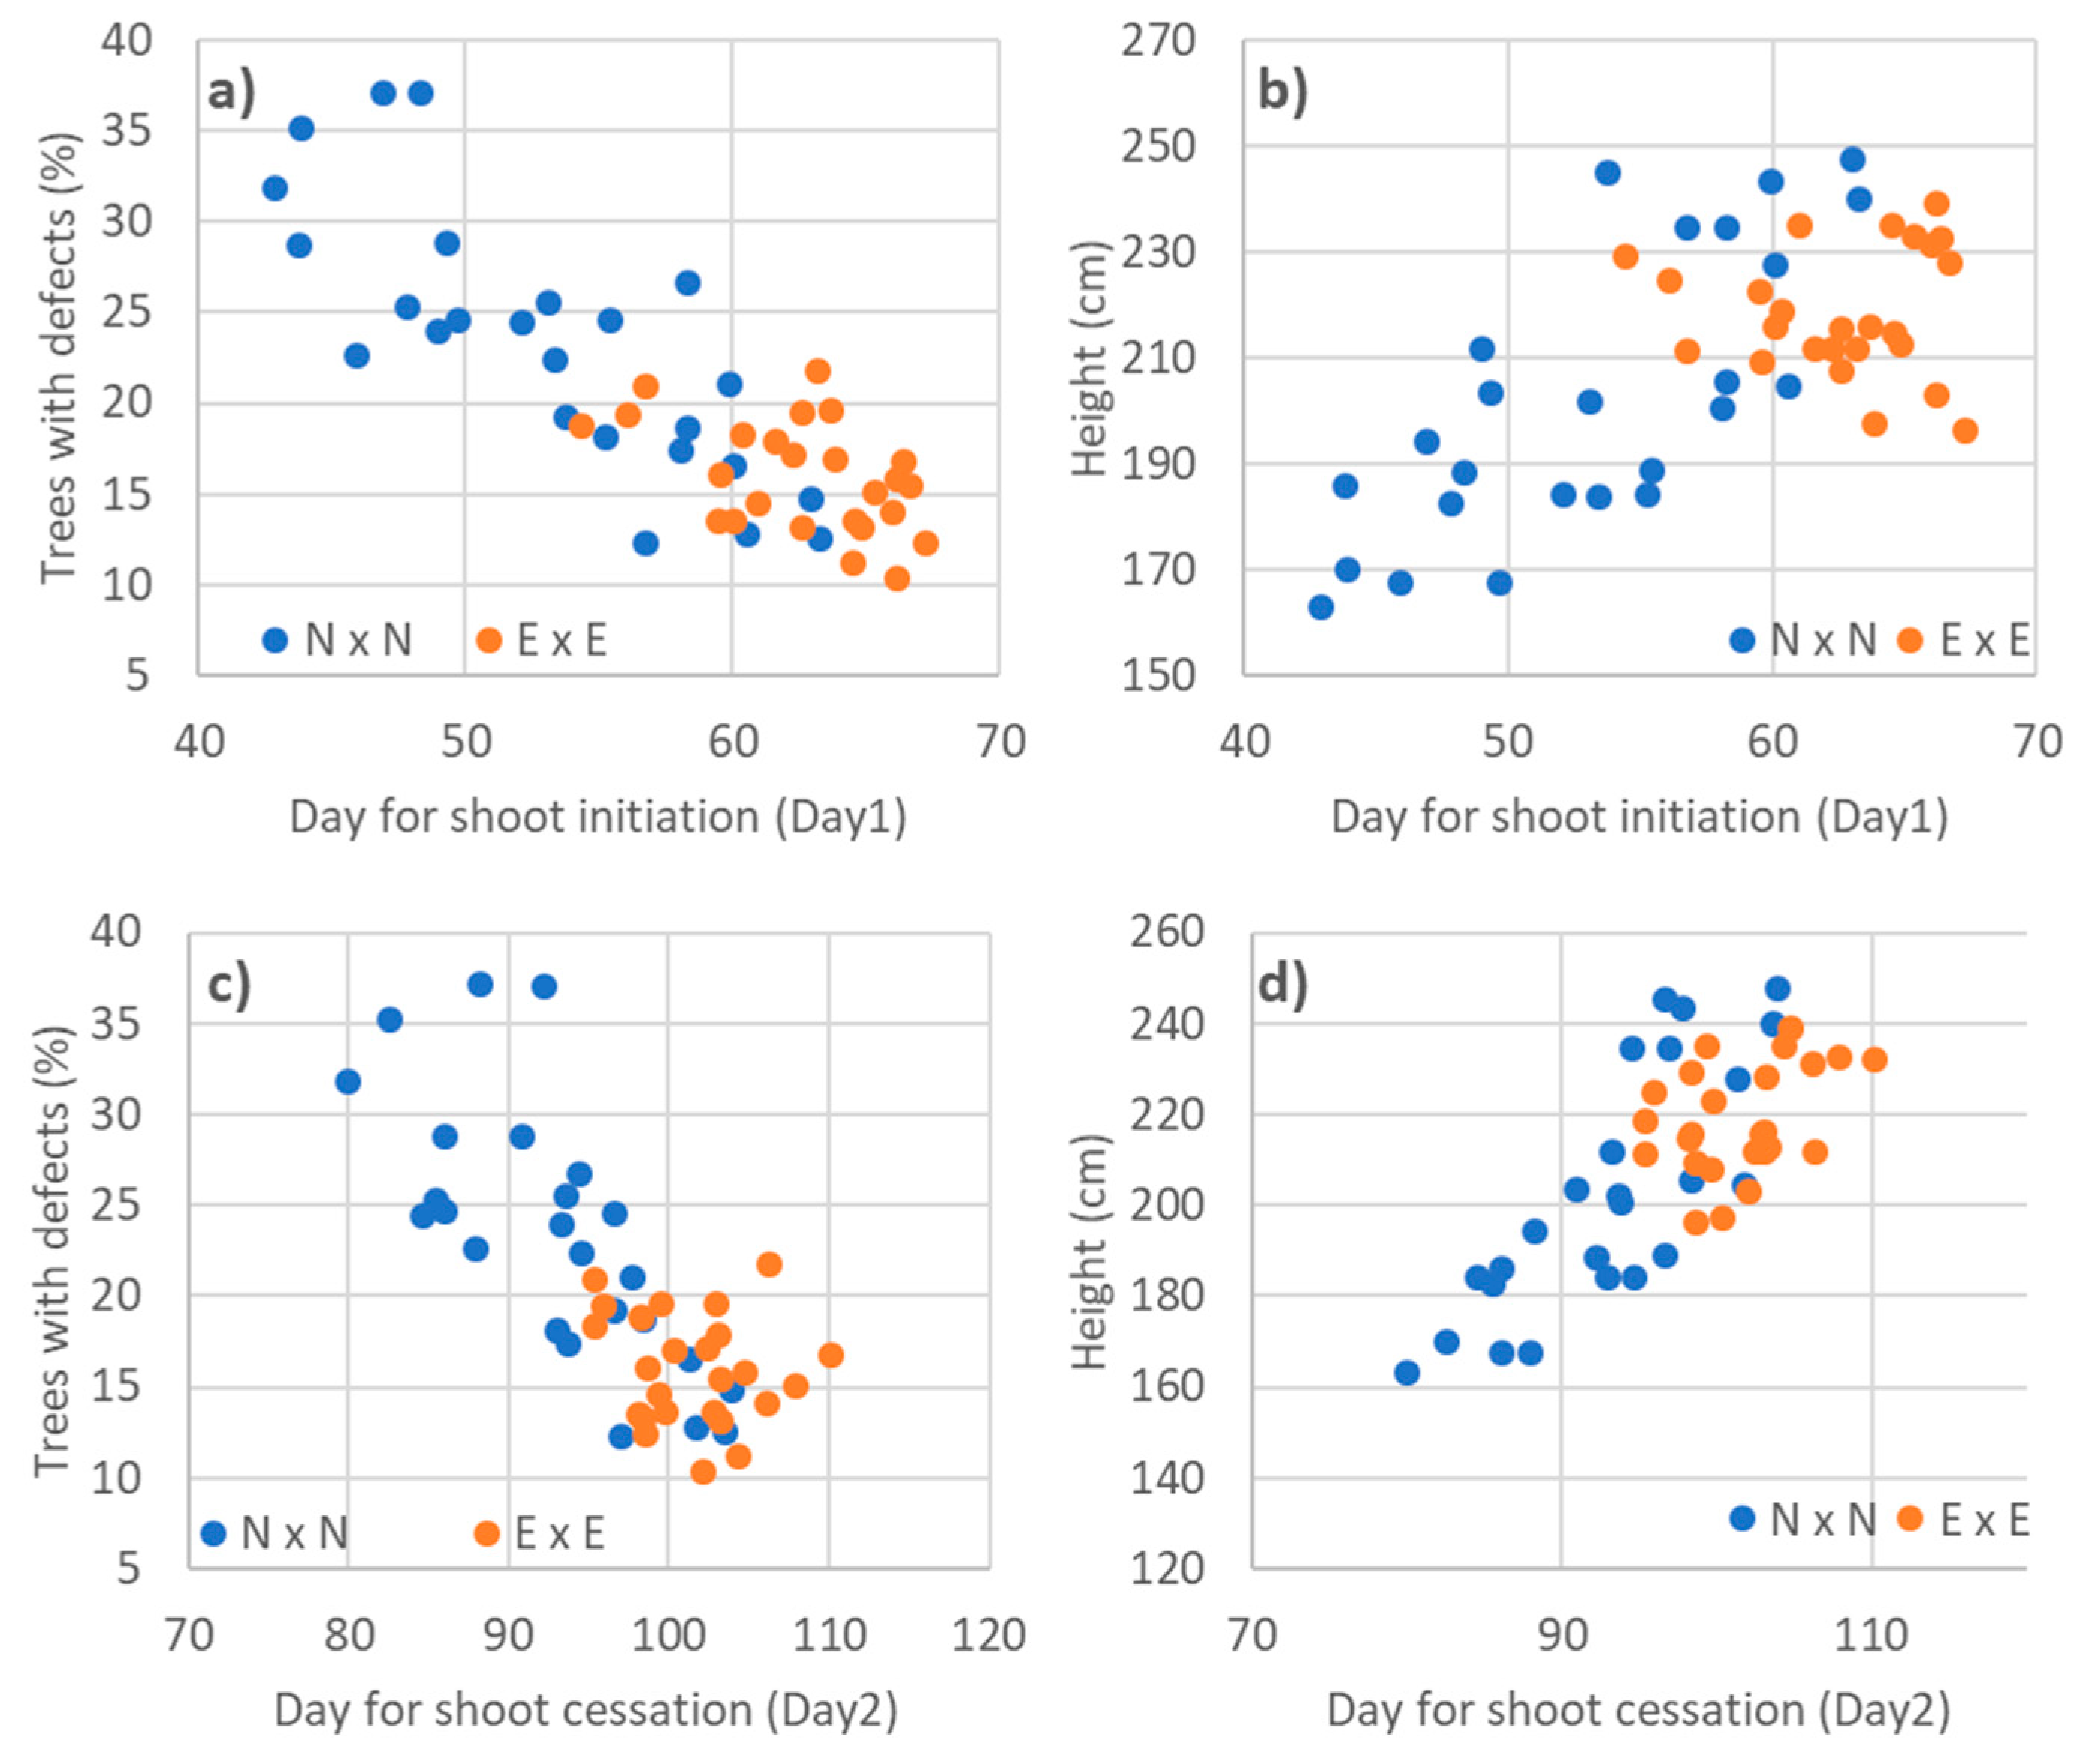
3.3. Relationships to Phenology Traits

Earlier analyses of the phenology assessments of families in the short-term trials showed heritability estimates of the days for shoot growth initiation (Day1) and cessation (Day2) equal to 0.89 and 0.88, respectively, in the N × N family group, and 0.61 and 0.47 in the E × E families [10]. The estimates of the genetic correlation between these two traits were as high as 0.92 and 0.67 for the two groups. For clones in the Kaupanger trial, the broad sense heritability estimates for the timing of bud burst were 0.84 and 0.79 in the two family groups. There were no relationships between mortality in the field tests and the phenology traits across the seven family and provenance trials, nor in the clonal trials. For provenances, there were only weak relationships between stem defects and the phenology traits Day1 and Day2. However, this relationship was stronger between height and Day1 and Day2 (r = 0.69 and r = 0.77). For the N × N families, strong associations were present between these phenology traits and stem defects and height (Figure 2), with phenotypic correlations between Day1 and stem defects as high as r = −0.80, and Day1 and heights of 0.76. These associations could not be found for the E × E families (Figure 2). N × N families with an early growth start and early growth cessation showed the highest frequency of stem defects and slower height growth. Similar relationships were present for the 20 families in the eight trials with clones, with correlation coefficients between Day1 and stem defects of 0.80 and Day1 and height growth of 0.60 (not shown in figure). Correlations between these traits at the clonal level were present only in the N × N family group, where the coefficients between the same pair of traits were 0.58 (Day1, stem defects) and 0.53 (Day1, height).

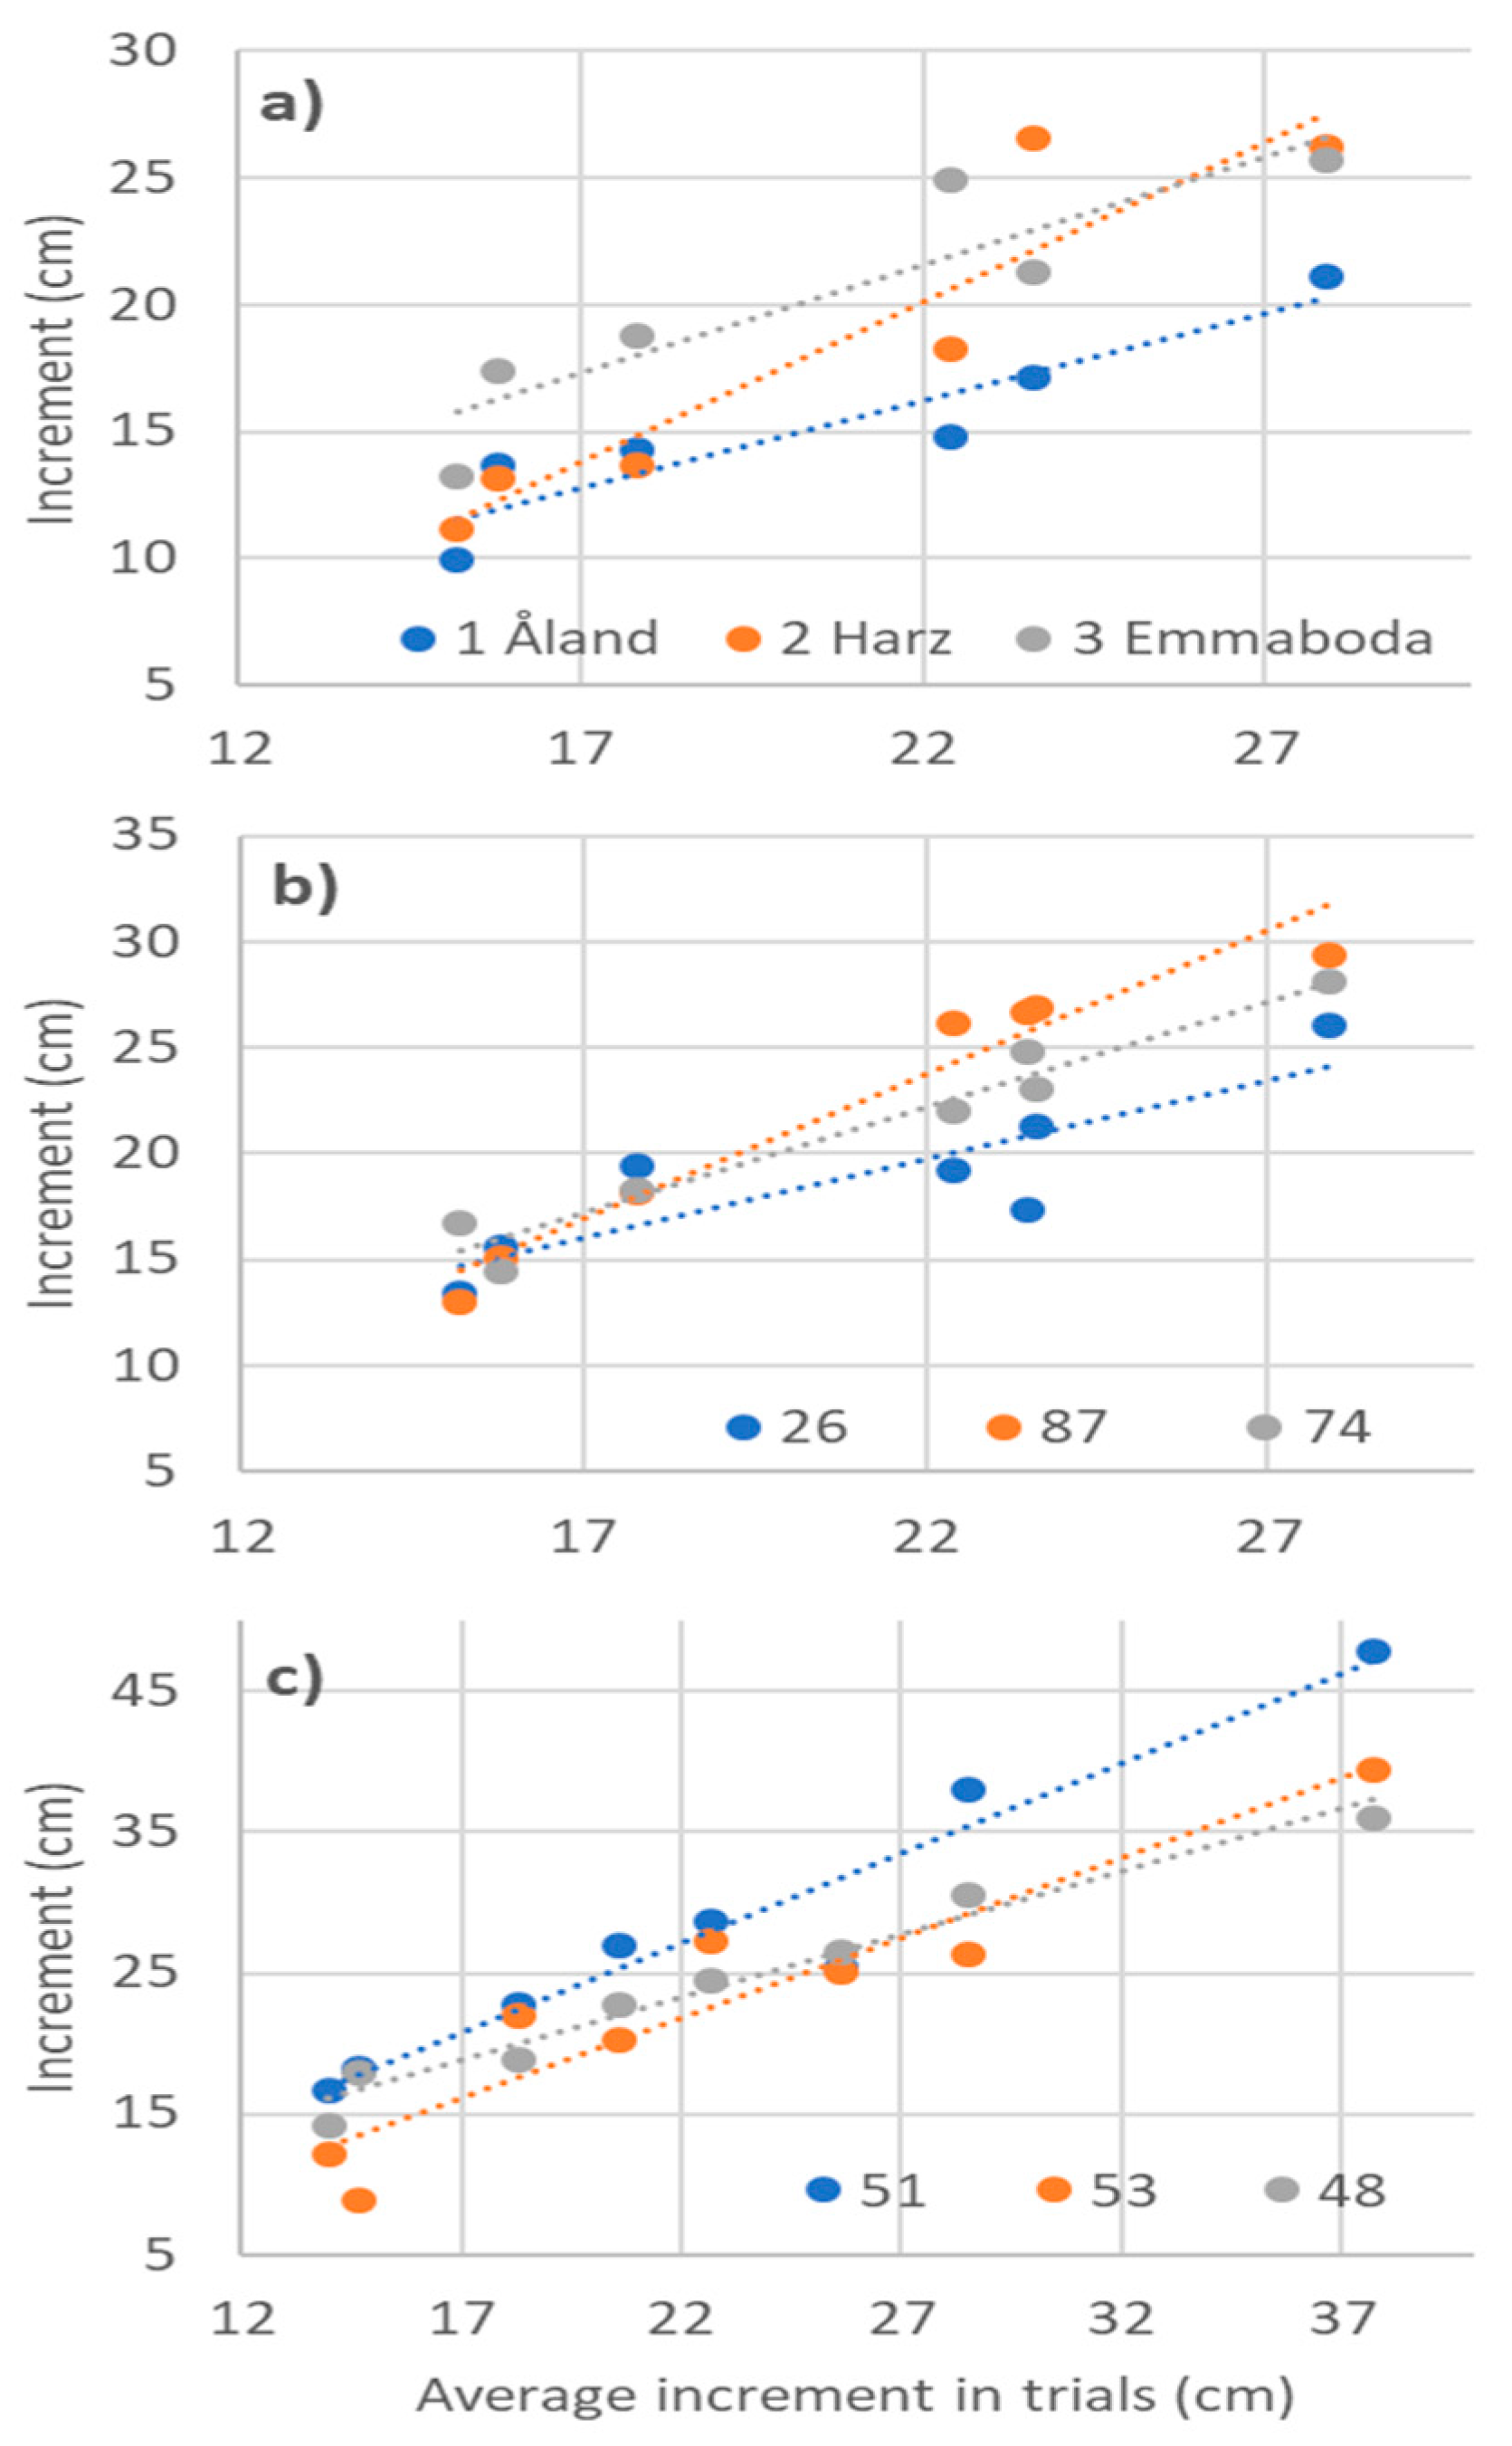
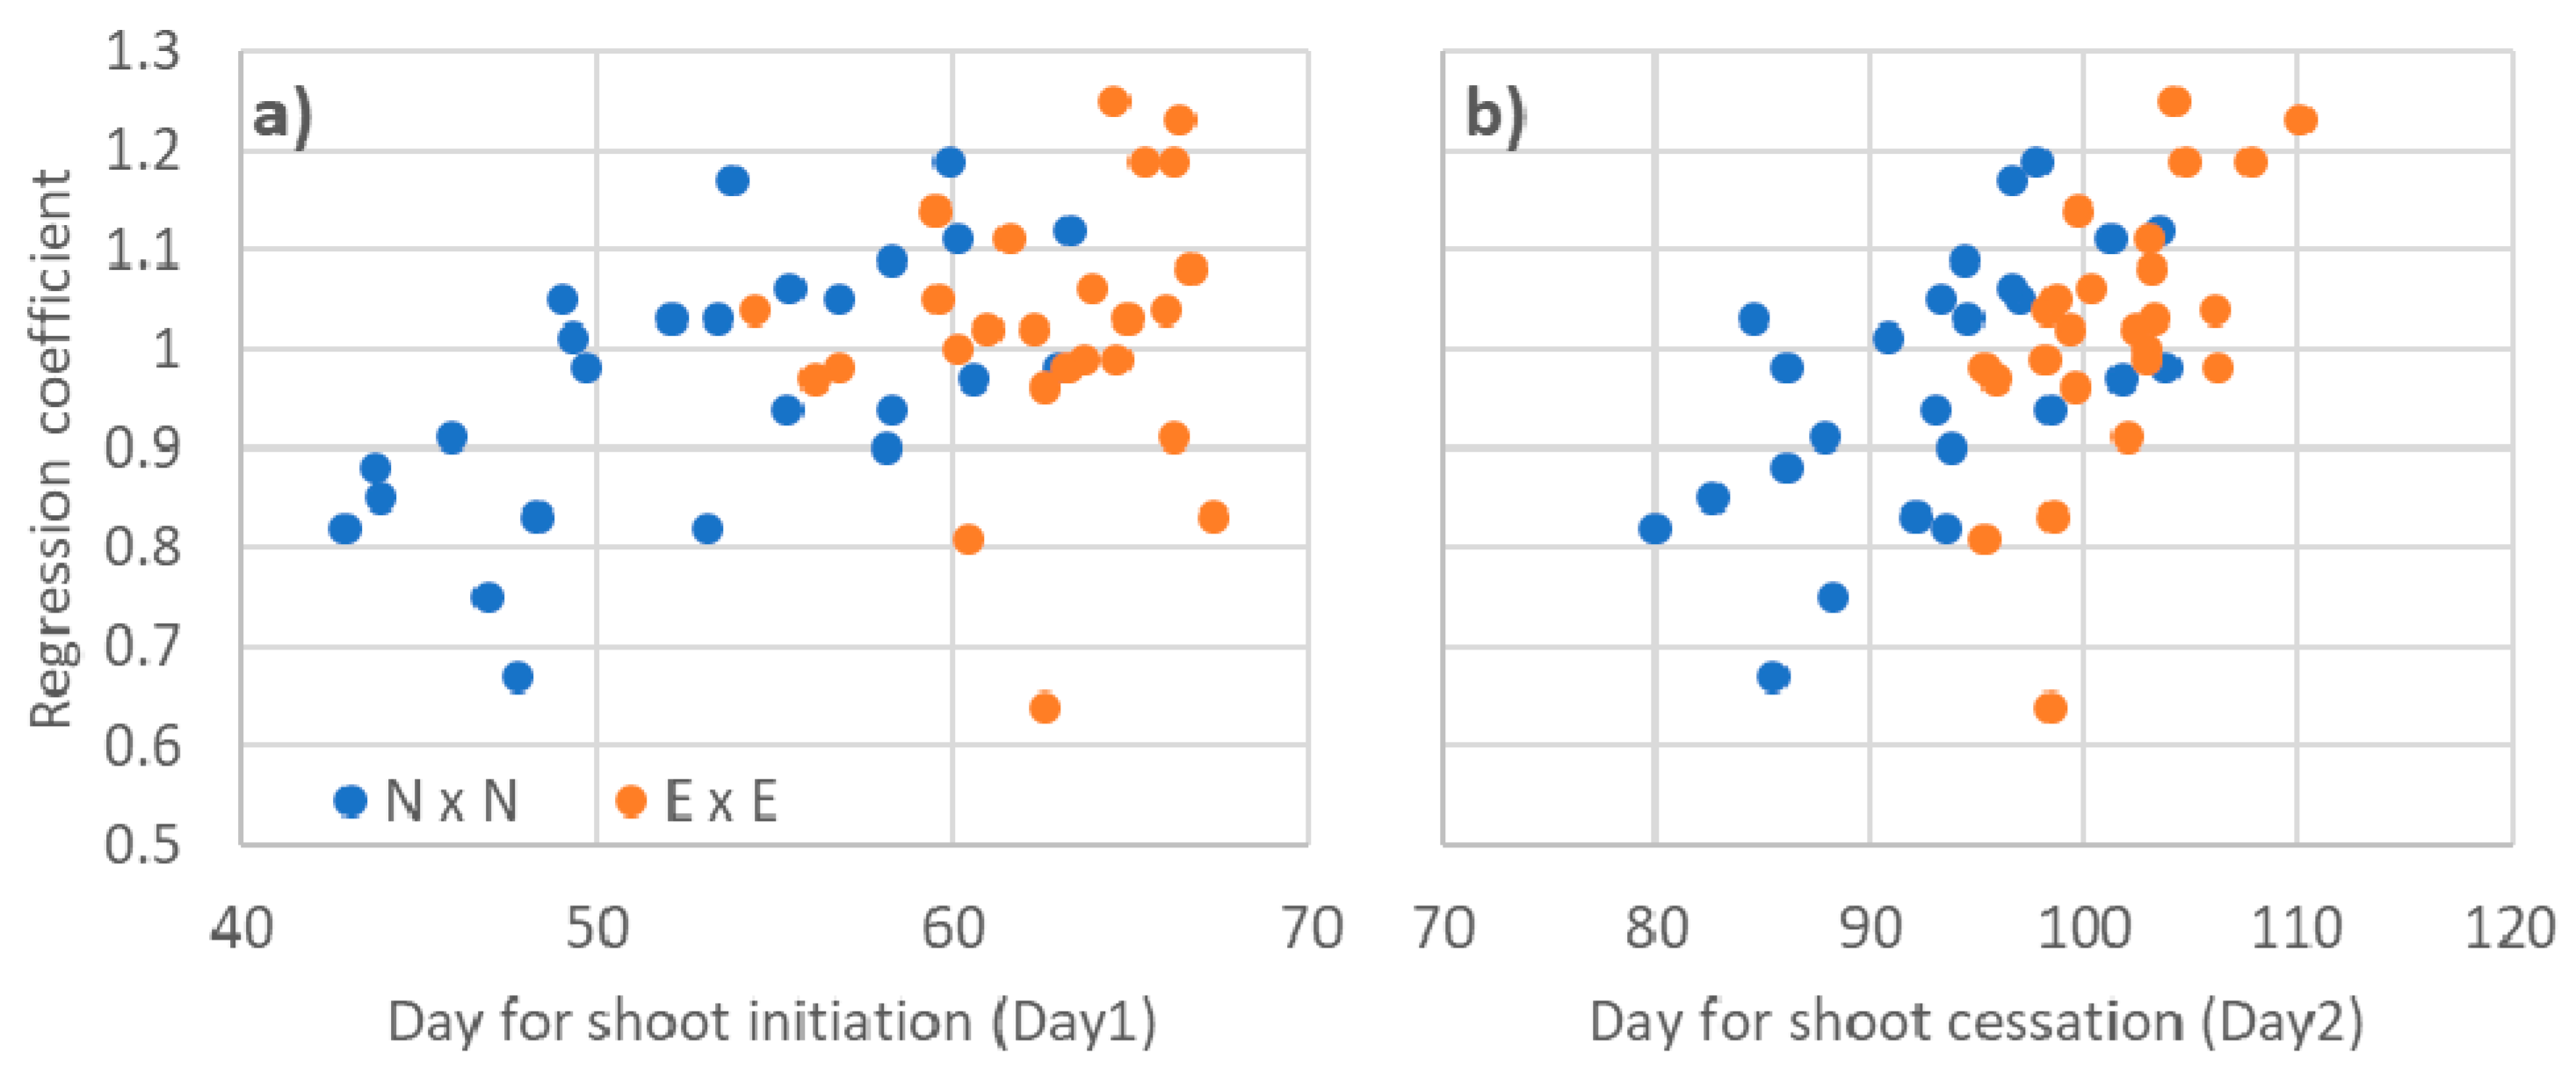
3.4. Phenotypic Stability Parameters

The estimates of the regression coefficients for the mean height increment against the site mean for the 20 provenances varied from 0.69 to 1.31, with quite good fit to the regression lines with R2 values from 0.81 to 0.99. Figure 3a shows the plots of the regression lines and the corresponding values for three of the provenances studied: Åland, Finland (b = 0.69, R2 = 0.86), Harz, Germany (b = 1.27, R2 = 0.87), and Emmaboda, Sweden (b = 0.85, R2 = 0.81). The Åland provenance showed inferior growth at all sites and the lowest values of the regression coefficient. The Harz provenance has a steep regression line with poor growth at the climatic most severe sites and superior performance at the sites with the best growth conditions, particularly at Ølve on the west coast of Norway. When the provenances were grouped in four regions, the Nordic region had the lowest mean regression coefficient of 0.87, the Eastern European had 1.01, the Carpathian Mountains 1.22, and Harz 1.15.
The estimated regression coefficients for the 100 full-sib families also varied considerably, with a range between 0.64 and 1.44, among families (Table 5). The fit to the regression line, as expressed by the coefficient of determination had a mean value of R2 = 0.72 and ranged between 0.49 and 0.99. The mean regression coefficients were 0.97 and 1.02 in the N × N and E × E family groups, respectively, and with mean R2 values of 0.81 and 0.90.
The plots shown in Figure 3b present examples of the estimated regression lines and deviations for three unrelated families. Family 26 (b = 0.75), which has the largest deviations from the regression line, has inferior growth on the most productive sites compared to other two families, while family 87 (b = 1.36) has a very good growth at these sites and more average at the less productive sites. It also had a good fit to the regression line (R2 = 0.95).
In the overall analysis of variance of regression coefficients (all families in the factorial mating), significant variation was present both among the female and male parents (p < 0.001), with 25% of the its variation among the female and 20% among the male parents. This clearly demonstrates the genetic component of the phenotypic response to the variation in environmental conditions at the trial sites. A similar analysis of variance of R2 showed significant variation both among the female (p = 0.02) and male parents (r = 0.002), and with 9% and 21%, respectively, of its variation due to the two types of parents.
When the mean of the 10% tallest trees at each site was used as explanatory variable in the regression analysis instead of the mean of all trees, estimated coefficients were lower and in the range from 0.43 to 1.13. The regression coefficients from the two analyses were strongly correlated (r = 0.91), but a lower fit to the regression lines was obtained using this latter index in the analyses (R2 of 0.72 compared to 0.86 in the regressions based on the total site mean). The families contributed very differently to the top 10% in the index, varying from 0 to 15 trees in each trial. One family was not represented at all in any of the indices across the seven trials, and one family was represented by 48 trees. No further analyses were done using this index.
In the regression analyses of the increments made with either the annual mean temperature or degree days as explanatory variables, a low fit was obtained in both types of analyses, with mean R2 values equal to 0.47 and 0.32, respectively. This shows that temperature is not the only environmental factor causing differences in performance of the genetic materials at these sites.
In the clonal trials, the estimated regression coefficients for individual clones varied in the range from 0.40 to 1.64 with R2 values from 0.46 to 0.99. For the 20 families, mean regression coefficients varied from 0.78 to 1.20. An example of the variation among the clones in one family is presented in Figure 3c. Clone 51 (b = 1.29) had the best height growth at seven sites and was superior at the two most productive sites. When the total variation of the regression coefficients was partitioned into two components, assuming unrelated families, 25% was among families (p = 0.04) and 75% among clones within families. Most likely a substantial part of the large variation among clones is caused by a high experimental error of the clonal means at each site.
Twenty families were represented both in the family and clonal trials (Table 2). The correlation between the mean family mean regression coefficients estimated from the two types of trials was as low as r = 0.46 (p = 0.04).
Figure 4a,b shows the plots of the regression coefficients for families in the N × N and E × E groups against Day1 and Day2, respectively. For the N × N families, there is a clear positive relationship for both phenology traits (r = 0.61 and r = 0.60); families with an early growth start have a value of the regression coefficient below 1.0 and so have families with an early growth cessation. For the families in the E × E group, there is a positive relationship between the regression coefficient and Day2 (r = 0.60).
In the N × N family group, there was a positive relationship (r = 0.66) between the regression coefficient and R2; families with the lowest value for the regression coefficient showed the largest deviation from the regression line.
There were considerable differences between the family and clonal trials in the variance of estimates of the stability parameter reflected in a mean root square error of 3.01 for the clones compared to the value of 1.94 for the regression analyses for the 100 families. In the clonal trials, six ramets of each clone were planted at each trial site. The mean mortality among sites varied from 8% to 33% and with variation among clones. Their LS means are therefore estimated with quite large and variable sampling errors, which influences the precision of the estimates of regression coefficients for the clones. Another factor contributing to differences between the regression estimates from the family and clone trials is that the site index at Hørsholm clonal trial site was high, and trees were taller than at the other sites. This certainly influences the regression coefficient estimates; clones and families that are responsive to the favorable conditions for growth will have a steep regression line. This can also be a reason for the unexpected low relationship between the mean family regression coefficients estimated for clones and seedlings (20 families that were common).

4. Discussion

There was a large variation among the 20 provenances for survival and height growth after ten years, and those from Eastern Europe and the Nordic countries generally showed the best performance. The Central European provenances performed on average poorly but were among the best ranked in the mild climate in West Norway. Evidently, provenances that are not well adapted to the harsh conditions at the sites with the most severe climatic conditions made the largest contribution to the interactions. These results confirm conclusions from reports from large provenance trials in the Nordic countries [2,20]. The different patterns of provenance performance across sites are clearly expressed by the variation of the regression coefficients. They showed that the provenances from the Carpathian Mountains and Harz had superior height growth at the most productive sites but grew poorly at the sites with the most severe climatic conditions. The Eastern European provenances showed on average good growth on all sites, while the provenances from Sweden and Finland, except that from Åland, showed relatively good growth at the less productive sites, but relatively poorer growth at the most productive sites. The variable performance of the Central European provenances across Nordic sites confirms results from earlier provenance trials [3,20].
The differences between the N × N and E × E family groups in mortality and percentage of trees with stem defects confirm the results from the short-term tests previously reported [10], as do the results from the analyses of heights showing large differences in genetic variability within the two groups families. Thus, the lower level of genetic variation among the E × E families, most likely caused by both natural selection and the artificial selection (made by the tree breeders) of the parents after growing in the climatically harsh environment for 25 years in northern Sweden, is still present after ten years in fifteen field trials.
In the analyses of the family trials (trials 1–7), the female and male variance components for height showed considerably higher values than their interaction component (F × M), which was not significant. This indicates that the additive genetic variation is the most important and that non-additive genetic effects are small for the families in the two 5 × 5 factorials. A different result, with significant F × M components, was obtained from the analyses of tree heights after five growing seasons in two short-term trials on agricultural soils with the same families [10]. Non-additive genetic effects have also been demonstrated for height and diameter growth in progeny trials of Norway spruce, comprising clones and families from the Swedish breeding program [9]. The deviating results from the present analyses with 9–11 year- old trees were confirmed in the analysis of height at age 17 years in the field trial at Skiptvedt with the same genetic material [10]. The deviations from reports of other genetic materials could be due to the small number of parents, trial site conditions, and varying G × E interactions.
The variance components for families and clones within families estimated in the clonal trials were strongly significant and showed approximately similar values. This is according to the expectation that the genetic variances among and within full-sib families are of similar size when small non-additive genetic effects are present [21].
In the short-term trials with the same 100 full-sib families planted at two sites, one with a quite mild climate and the other one with frequent frost occurrences both in the spring and in the autumn, quite large G × E interactions were found for height growth after five growing seasons, in particular for the families in the N × N group [10]. The relative magnitude of the interaction variance components was smaller in the field trials we report now, even if they were significant in the analyses of variance. In the N × N family group, they were considerably less than 50% of the family variance component, which has been considered to be a critical value limiting the potential gain for selection in breeding [22].
The strong relationships found between the timing of shoot elongation and frequency of stem defects and height growth for the N × N families (Figure 2a,b) correspond to what was found in one of the short-term trials [10]. Once again, it shows the importance of delayed bud-flush to avoid spring frost damages [2,7].
The field test sites cover a wide range of environmental conditions in the Nordic countries where Norway spruce is being planted. Nine of the sites are located at approximately the same latitude (60° N), being situated in the humid coastal climate of West Norway, in East Norway, in Central Sweden, on the Åland Islands and in interior Finland, and one is southern (Hørsholm, Denmark, latitude 56° N) and one northern (Lappkuliden, Sweden, latitude 64° N). The overall results show that quite large geographic zones can be used in the breeding of Norway spruce in the Nordic countries, but also that G × E interactions may depend on local conditions and may be largely unpredictable, as recently demonstrated [2].
The regression analyses identified families and clones that respond differently when the conditions for growth change. Some genotypes have a superior performance at sites with high productivity and less than average performance at poorer sites, others have relatively better growth at the last type of sites. The regression coefficients characterize these differences in response, which are clearly genetically controlled. In addition, the coefficient of determination (R2) also has a genetic component. Genotypes with a late initiation of shoot elongation generally had the best growth at the productive sites with a steep regression line. Therefore, there are positive relationships between height, Day1, and the regression coefficient, particularly evident in the N × N family group, being more variable in phenology. This shows that the regression coefficient, as a stability parameter, to a large extent is related to these traits.
In forest tree breeding, we want to select materials with high performance across the whole landscape that are able utilize productive sites and at the same time not perform poorly at sites with a lower production level. Therefore, genotypes with a relatively high and stable production at low-yielding sites as well as having capacity to respond with a high production under favourable conditions are sought. We would argue that when applying the regression coefficient method such as used here, candidate genotypes will be characterized by a coefficient close to or slightly above 1. At the same time, they need to have a strong average breeding value estimated across representative sites within the defined breeding zone. However, genotypes might also show strong breeding values even if the performance is not stable, so an index comprising both the coefficient and breeding value might be needed in combination for effective selection in a breeding program. They cannot be completely identified by the regression techniques applied here, and a more complicated curvilinear regression analysis could be used to identify such responses.
A positive relationship was observed between the timing of shoot elongation and the regression coefficient (and mean height increment) for the N × N families. Thus, a selection based on a late bud flush would most likely be favourable for both improving height growth and lower frequency of stem defects.

Author Contributions

Initial project administration and funding acquisition; data collection; data analyses; draft writing: T.S.; further project administration; funding acquisition; review and editing: A.S. All authors have read and agreed to the published version of the manuscript.

Funding

This work was financially supported by The Nordic Forest Research Co-operation Committee (grant number SNS-26 and SNS-60), the Research Council of Norway (grant number 216050), the project B4EST of the Agriculture and the European Union’s Horizon 2020 Research and Innovation Programme under grant agreement No 773383, The Norwegian Forest Seed Station, and the Norwegian Institute of Bioeconomy Research (NIBIO).

Institutional Review Board Statement

Not applicable.

Informed Consent Statement

Not applicable.

Data Availability Statement

The data presented in this study are available on request from the corresponding author.

Acknowledgments

Many scientists and technicians have contributed to this study, particularly Jon Dietrichson, Reidar Tutturen, and Øystein Johnsen, at the former Norwegian Forest Research Institute; Gösta Eriksson and Dag Lindgren, at the Swedish University of Agricultural Sciences; Veikko Koski and Lena Yrjänä, at the former Finnish Research Institute; and Hubert Wellendorf and Viggo Jensen, University of Copenhagen. We thank them all for their contributions.

Conflicts of Interest

The authors declare no conflict of interest.

References

  1. Becker, H.; Leon, J. Stability analysis in plant breeding. Plant Breed. 1988, 101, 1–23. [Google Scholar] [CrossRef]
  2. Berlin, M.; Jansson, G.; Högberg, K.A. Genotype by environment interaction in the southern Swedish breeding population of Picea abies using new climatic indices. Scand. J. For. Res. 2015, 30, 112–121. [Google Scholar] [CrossRef]
  3. Persson, B.; Persson, A. Survival and Quality of Norway Spruce (Picea abies (L.) Karst.) Provenances at the Three Swedish Sites of the IUFRO 1964/68 Picea abies Provenance Experiment; 1992 Report 29; Dept for Yield Research, SLU: Garpenberg, Sweden, 1992.
  4. Skrøppa, T. A critical evaluation of methods available to estimate the genotype × environment interactions. Studia For. Suec. 1984, 166, 3–14. [Google Scholar]
  5. Hannerz, T.; Sonesson, J.; Ekberg, I. Genetic correlations between growth and growth rhythm observed in short-tern test and performance in long-term field trials of Norway spruce. Can. J. For. Res. 1999, 29, 768–778. [Google Scholar] [CrossRef]
  6. Benzer, B.; Foster, G.S.; Hellberg, A.R.; Podzorski, A.C. Genotype × environment interaction in Norway spruce involving three levels of genetic control: Seed source, clone mixture and clone. Can. J. For. Res. 1988, 18, 1172–1181. [Google Scholar] [CrossRef]
  7. Karlsson, B.; Wellendorf, H.; Roulund, H.; Werner, M. Genotype x trial interaction and stability across sites in 11 combined provenance and clone experiments with Picea abies in Denmark and Sweden. Can. J. For. Res. 2001, 31, 1826–1836. [Google Scholar] [CrossRef]
  8. Chen, Z.Q.; Karlsson, B.; Wu, H.X. Patterns of additive genotype-by-environment interaction in tree height of Norway spruce in southern and central Sweden. Tree Genet. Genomes 2017, 13–25. [Google Scholar] [CrossRef] [Green Version]
  9. Berlin, M.; Jansson, G.; Högberg, K.A.; Helmersson, A. Analysis of non-additive genetic effects in Norway spruce. Tree Genet. Genomes 2019, 15, 42. [Google Scholar] [CrossRef]
  10. Skrøppa, T.; Steffenrem, A. Selection in a provenance trial of Norway spruce. (Picea abies L. Karst) produced a land race with desirable properties. Scand. J. For. Res. 2016, 31, 439–449. [Google Scholar] [CrossRef]
  11. Langlet, O. Mellaneuropeiska granprovenienser i svenske skogsbruk. [Central European provenances in Swedish forestry]. Kungl. Skogs och Lantbr. Tidskrift. 1960, 99, 259–329. [Google Scholar]
  12. Solvin, T.M.; Steffenrem, A. Modelling the epigenetic response of increased temperature during reproduction on Norway spruce phenology. Scand. J. For. Res. 2019, 34, 83–93. [Google Scholar] [CrossRef]
  13. Bärring, L.; Berlin, M.; Andersson Gull, B. Tailored climate indices for climate-proofing operational forestry applications in Sweden and Finland. Int. J. Climatol. 2017, 123–142. [Google Scholar] [CrossRef] [Green Version]
  14. Krutzsch, P. Norway Spruce Development of Buds; IUFRO S2.02.11; The Royal College of Forestry: Stockholm, Sweden, 1973. [Google Scholar]
  15. Lynch, M.; Walsh, B. Genetics and Analysis of Quantitative Traits; Sinauer Associates, Inc.: Sunderland, MA, USA, 1998. [Google Scholar]
  16. Tveite, B. Bonitetskurver for gran. [Site-index curves for Norway spruce]; Meddelelser fra Norsk Institutt for Skogforskning: Ås, Norway, 1977. [Google Scholar]
  17. SAS Institute. SAS/STAT User’s Guide; Version 9; SAS Institute: Cary, CA, USA, 2003. [Google Scholar]
  18. Mullin, T.J.; Morgenstern, E.K.; Park, Y.S.; Fowler, D.P. Genetic parameters from a clonally replicated test of black spruce (Picea mariana). Can. J. For. Res. 1992, 22, 24–36. [Google Scholar] [CrossRef]
  19. Russel, J.; Costa e Silva, J.; Baltunis, B.S. Multisite genetic parameter estimates from a Callitropsis kookiness diallel study with clonally replicated progeny. Can. J. For. Res. 2015, 45, 689–697. [Google Scholar] [CrossRef]
  20. Fottland, H.; Skrøppa, T. The IUFRO 1964/68 provenance experiment with Norway spruce (Picea abies) in Norway: Variation in mortality and height growth. Meld. Skogforsk 1989, 43, 1–30. [Google Scholar]
  21. Falconer, D.S.; Mackey, T. Introduction to Quantitative Genetics, 4th ed.; Pearson Education Ltd.: Harlow, UK, 1996. [Google Scholar]
  22. Shelbourne, C.J.A. Genotype-environment interaction: Its study and its implications in forest tree improvement. Proc. IUFRO Genet. SABRAO Joint Seem Tokyo 1972, B-1, 1–28. [Google Scholar]
Figure 1. The field test sites in four Nordic countries with the annual temperature sum for mean daily temperature above 5 °C in brackets.
Forests 12 00230 g001
Figure 2. Plot of the relationships between the percentage of trees with stem defects (a,c) and tree height (b,d) with the day for shoot growth initiation (Day1) (a,b) and shoot growth cessation (Day2) (c,d) at the family-mean level (site 1–7). The material is grouped in N × N (blue) and E × E families (orange).
Forests 12 00230 g002
Figure 3. Estimated regressions lines for the genetic entries’ height increment as a function of the average increment of the trials shown for (a) three selected provenances (sites 1–7), (b) families (sites 1–7), and (c) clones within family 83 (sites 11–18).
Forests 12 00230 g003
Figure 4. Plot of regression coefficients estimated for families against the days of shoot growth initiation (Day1) (a) and cessation (Day2) (b), day number after May 1 (sites 1–7). N × N families are blue and the E × E families are orange.
Forests 12 00230 g004
Table 1. Locations of field trials with average survival (%), tree height, and proportion of trees with stem defects. Trials 1, 2, 11, and 12 are in Norway; trials 3, 4, 13, and 14 in Sweden; trials 5, 6, 7, 16, 17, and 18 in Finland; and trial 15 is in Denmark. Trials 1 to 7 comprise provenances and families, while trials 11 to 18 comprise clones propagated from 20 of the families. The average values are obtained from measurements nine growing seasons after planting in trials 17 and 18 (*), eleven in trials 1 and 4 (**), and ten in the remaining trials.
Trial and Location Latitude °NLongitude °EAltitude MMortality %Height cmStem Defects %
1 Ølve60°00′5°50′5010.2260 **8.9
2 Skiptvedt59°28′11°11′10024.822415.5
3 Rostorp57°47′15°47′16566.023518.1
4 Lappkuliden64°16′19°37′19052.8174 **19.3
5 Paimio60°27′22°44′404.127921.7
6 Janakkala61°00′24°45′13027.617816.0
7 Imatra61°10′28°53′8042.915226.9
11 Kaupanger61°11′7°05′808.018310.0
12 Nannestad60°19′11°05′20022.125614.5
13 Ribbingelund59°19′16°42′5031.920611.5
14 Lappkuliden64°1′19°37′19033.214737.0
15 Hørsholm55°52′12°04′5014.737731.9
16 Finström60°15′19°57′524.322727.4
17 Paimio60°27′22°44′404.5257 *36.1
18 Imatra61°10′28°53′8028.9126 *39.0
Table 2. The 100 factorial crosses made between 10 Norwegian (N) and 10 Eastern European (E) parents. The N × N and E × E families are indicted as shaded squares. The 20 families that were propagated by rooted cuttings are denoted by X.
Famale ParentsMale Parents
Norwegian (N)Eastern European (E)
11121314151617181920
Norwegian (N)1XXXXXXXXXX
2XXXXXXXXXX
3XXXXXXXXXX
4XXXXXXXXXX
5XXXXXXXXXX
Eastern European (E)6XXXXXXXXXX
7XXXXXXXXXX
8XXXXXXXXXX
9XXXXXXXXXX
10XXXXXXXXXX
Table 3. Estimates of variance components and narrow sense heritabilities (h2) for height of 100 families after ten or eleven growing seasons at seven sites (sites 1–7) for each crossing type separately. In parentheses, p-values of variance components and standard error of the heritability.
Source/CrossN × NN × EE × NE × E
Mean Height (cm)205221209219
F215.5 (0.0002)81.3 (0.0002)0.0 0.0
M476.8 (<0.0001) 59.5 (0.007)423.3 (<0.0001)105.2 (0.001)
F × M38.5 (0.07)73.5 (0.0012)22.3 (0.20)26.0 (0.05)
F × S0.069.5 (0.0009)88.8 (<0.0001)66.3 (<0.0001)
M × S71.9 (0.01)114.7 (<0.0001)117.5 (<0.0001)47.7 (0.004)
F × M × S101.2 (0.002)2.7 (0.54)0.00.0
Error5926.46559.16066.15861.8
h20.20 (0.15) 0.03 (0.04)
F: female parent; M: male parent; S: site; N: Norwegian parent; E: Eastern European parent.
Table 4. Means and estimates of variance components and the broad sense heritabilities (H2) for height of clones within families after ten growing seasons at eight sites (sites 11–18). In parentheses, p-values of variance components and standard error of the heritability.
SourceN × NN × EE × NE × E
Mean height (cm)169178194187
Family768.3 (<0.0001)651.2 (<0.0001)191.8 (0.05)269.6 (0.003)
Family × site164.3 (<0.0001)84.5 (0.01)279.0 (<0.0001)200.5 (<0.0001)
Clone (family)503.5 (<0.0001)462.3 (<0.0001)755.1 (<0.0001)373.1 (<0.0001)
Clone (family) × site141.7 (0.01)292.9 (<0.0001)174.1 (0.04)131.6 (0.04)
Error3291.83451.24221.43333.1
H20.26 (0.20) 0.15 (0.11)
Table 5. Estimates of regression coefficients for annual height increment of 100 full-sib families planted at seven sites (sites 1–7). The regression coefficients of the N × N and E × E families are shaded.
Male
Female
11121314151617181920Mean
11.050.941.030.880.981.000.930.861.140.750.96
21.091.190.940.671.031.001.151.220.890.921.01
30.750.820.910.850.820.740.860.981.030.790.86
41.171.111.060.831.010.941.021.201.191.041.06
50.981.120.971.050.900.691.051.150.871.040.98
60.930.770.991.010.790.810.641.190.970.960.91
71.071.050.850.970.990.981.141.251.041.051.04
81.201.060.881.070.980.981.021.231.001.061.05
91.441.361.011.201.011.080.991.191.111.031.14
101.231.070.960.890.780.830.991.041.020.910.97
Mean1.091.050.960.940.930.900.981.131.020.961.00
Publisher’s Note: MDPI stays neutral with regard to jurisdictional claims in published maps and institutional affiliations.

