Article

Using Sentinel-2 Images to Map the Populus euphratica Distribution Based on the Spectral Difference Acquired at the Key Phenological Stage

1
College of Resources and Environment Science, Xinjiang University, Urumqi 830046, China
2
Institute of Arid Ecology and Environment, Xinjiang University, Urumqi 830046, China
3
Key Laboratory of Oasis Ecology, Xinjiang University, Urumqi 830046, China
*
Author to whom correspondence should be addressed.
Forests 2021, 12(2), 147; https://doi.org/10.3390/f12020147
Submission received: 6 December 2020 / Revised: 19 January 2021 / Accepted: 23 January 2021 / Published: 27 January 2021
(This article belongs to the Special Issue Remote Sensing Applications in Forests Inventory and Management)

Abstract

:
Populus euphratica is an important tree species in desert ecosystems. The protection and restoration of natural Populus euphratica forests requires accurate positioning information. The use of Sentinel-2 images to map the Populus euphratica distribution at a large scale faces challenges associated with discriminating between Populus euphratica and Tamarix chinensis. To address this problem, this study selected the Daliyabuyi Oasis in the hinterland of the Taklimakan Desert as the study site and sought to distinguish Populus euphratica from Tamarix chinensis. First, we determined the peak spectral difference period (optimal time window) between Populus euphratica and Tamarix chinensis within monthly Sentinel-2 time-series images. Then, an appropriate vegetation index was selected to represent the spectral difference between Populus euphratica and Tamarix chinensis within the key phenological stage. Finally, the maximum entropy method was used to automatically determine the threshold to map the Populus euphratica distribution. The results indicated that the period from 22 April to 1 May was the optimal time window for mapping the Populus euphratica distribution in the Daliyabuyi Oasis. The combination of the inverted red-edge chlorophyll index (IRECI) and the maximum entropy method can effectively distinguish Populus euphratica from Tamarix chinensis. The user’s accuracy of the Populus euphratica distribution extraction from single-data Sentinel-2 images acquired within the optimal time window was 0.83, the producer’s accuracy was 0.72, and the F1-score was 0.77. This study verified the feasibility of mapping Populus euphratica distribution based on Sentinel-2 images, and analyzed the validity of exploiting spectral differences within the key phenological stage from a single-data image to distinguish between the two species. The results can be used to extract the distribution of Populus euphratica and serve as an auxiliary variable for other plant classification methods, providing a reference for the extraction and classification of desert plants.

1. Introduction

Populus euphratica is an important constructive tree species in the desert ecosystem, and is mainly distributed in Xinjiang, China. It serves as a crucial barrier in protecting oases and maintaining the stability of the oasis ecosystem [1,2]. Habitat deterioration has resulted in a decline in natural Populus euphratica forests. Consequently, the relevant watershed management agencies have repeatedly implemented ecological water conveyance to restore the natural Populus euphratica forests [3,4,5]. The protection of forest resources requires accurate positioning information as a basic premise [6,7]. Mapping the Populus euphratica distribution is essential for its protection and restoration.
Remote sensing is an important approach for tree species mapping [8,9,10]. The use of high-resolution images can yield higher accuracy in tree species mapping. There have been many successful cases of tree species mapping based on high-resolution commercial satellite images, such as WorldView imagery and QuickBird data [8,11,12,13]. However, high-resolution images are limited by their high price, limited coverage, and long return period, restricting the availability of large-scale tree species mapping [14,15]. Medium-resolution satellite imagery can effectively balance the contradiction between spatial resolution and temporal resolution. Moreover, it has the advantages of free data acquisition and broad coverage, and it is widely used in large-scale tree species mapping [7]. Tamarix chinensis is a typical desert shrub and its habitat highly overlaps with that of Populus euphratica, with which it typically forms mixed forests, increasing the difficulty of Populus euphratica distribution mapping based on satellite images [12,16]. Valid discrimination of Populus euphratica from Tamarix chinensis is the key to mapping the distribution of Populus euphratica.
Different plant species have their specificity in phenology, a crucial and sensitive feature for tree species mapping [15,17,18]. Numerous studies have established the advantages and potential of phenological information in distinguishing plant species [19,20,21]. Extracting phenological metrics from incorporated multi-temporal remote sensing images is a commonly used method to discriminate tree species. For this method, after incorporating multi-temporal satellite images, a smoothing function is selected to filter and suppress noise, and an appropriate fitting function is then used to extract key phenological parameters [22,23,24,25,26]. The extraction of phenological metrics relies on multi-temporal data, and the presence of clouds weakens the usability of optical images and increases the difficulty of multi-temporal image composites [27,28]. Moreover, the results vary with the selected smoothing and fitting functions [29].
Exploiting the spectral difference within the key phenological stage to discriminate plant species is also an effective method for mapping tree species distribution. The spectral signatures of plants vary with time and are significantly distinct for different phenological stages. In the key phenological stage, such as the bud break, leaf-onset, and senescence season [7,20,30], the unique spectral signatures of some plants make them significantly distinct from other plants [31,32]. Several studies have indicated that the unique orange color of Tamarix chinensis in late fall and early winter aids in its identification, which is beneficial for improving the accuracy of species distribution mapping [9]. Compared with the method of extracting phenological parameters based on compound multi-temporal images, mapping the tree species distribution utilizing the spectral difference from a single-date image within the key phenological stage is relatively simple and convenient. The simple structure of desert tree species makes it feasible to map the Populus euphratica distribution based on spectral differences from single-temporal images, decreasing the dependency on multi-temporal data and reducing the workload [9,10,33]. Meanwhile, Sentinel-2 imagery has the unique advantage of reflecting plant spectral differences. Sentinel-2 imagery has up to 12 bands. The three bands at the red and the near-infrared positions effectively indicate the spectral differences of the plants [7,34]. The dense Sentinel-2 image set (1 tile/5 d) also increases the availability of images during the peak period of spectral differences [14]. These features render Sentinel-2 images as optimal medium-resolution satellite data for species discrimination [19,28,35].
Overall, phenological information is conducive to tree species discrimination. However, these traits are rarely used for mapping the Populus euphratica distribution. Only a few studies have focused on the phenological differences between Populus euphratica and Tamarix chinensis, and the extraction of the Populus euphratica distribution based on the spectral differences from single-date Sentinel-2 images within the key phenological stage is also rarely reported [10,34]. The peak period of spectral differences (optimal time window) during the key phenological stage is the best timing to distinguish species. However, the duration of this period is usually relatively short [9,32,34,36]. Therefore, the accurate identification of the optimal time window is the key to exploiting the spectral difference from a single-date image for mapping the Populus euphratica distribution [10]. Furthermore, the spectral difference among tree species results from their different changes in the chlorophyll and leaf area, and their differences in appearance are reflected in the leaf color and greenness [37,38]. Therefore, selecting a vegetation index to identify or capture slight differences in tree species is necessary. Various vegetation indices have different abilities in detecting changes in vegetation greenness [22,29]. Thus, the selection of an optimal vegetation index that is sensitive to the spectral difference among tree species is a prerequisite for Populus euphratica mapping [34].
In view of the above factors, we selected a typical desert oasis (Daliyabuyi Oasis) as the study site to explore the feasibility of using the spectral difference from single-date Sentinel-2 images, acquired within the key phenological stage, to map the Populus euphratica distribution. The main steps involved in achieving this goal were as follows. First, we determined the optimal time window for mapping the distribution of Populus euphratica. Secondly, we selected an appropriate vegetation index to indicate the spectral differences among the tree species. Thirdly, an automatic threshold determination method was used to extract the Populus euphratica distribution, and the accuracy was evaluated.

2. Study Site and Data

2.1. Study Site

Daliyabuyi Oasis is located in Yutian County, Xinjiang, China, in the hinterland of the Taklimakan Desert, with geographic coordinates of 38°16′–38°37′ N, 81°05′–81°46′ E (Figure 1). It is a relatively primitive natural oasis that evolved from the tail of the Keriya River, with a core area of ~324 km2 and average annual precipitation of <10 mm. The area experiences dust storms and floating dust weather [39,40]. The vegetation composition of the oasis, as a typical representative of desert ecosystems, is dominated by Populus euphratica, Tamarix chinensis, and Phragmites communi.

2.2. Data

2.2.1. Sentinel-2 Imagery

In this study, 12 tiles (1 tile/month) from the none-cloud Sentinel-2 level 2A product for October 2019 to September 2020 period were selected (Table 1). The level 2A product is the atmospheric corrected images released by the European Space Agency (ESA). The study site is covered by one tile Sentinel-2 image (T44SNH). The images were resampled to 10 m using the Snap 7.0 software and then cropped to the range of the Daliyabuyi Oasis.

2.2.2. Reference Data

Gaofen-2 (GF-2) images were used as auxiliary data. GF-2 is a high-resolution optical satellite launched by China in 2014. The resolutions of the panchromatic and multispectral images were 1 and 4 m, respectively. The GF-2 images used in this study were from 17 September 2018.
The preprocessing steps for the GF-2 image were as follows: (1) image registration using the Image Registration Workflow tool in the Envi 5.3.1 software to register the panchromatic image with the multispectral image; (2) image sharpening using the Gram-Schmidt Pan Sharpening Classic tool in the Envi 5.3.1 software. The resampling method used was cubic convolution. After image sharpening, the resolution of the GF-2 multispectral image was 1.0 m. The automatic image registration tool in the Envi 5.3.1 software was used to register the GF-2 image to the Sentinel-2 image. The pixel position error after registration did not exceed one pixel (10 m).

2.2.3. Ground Phenological Observation Data
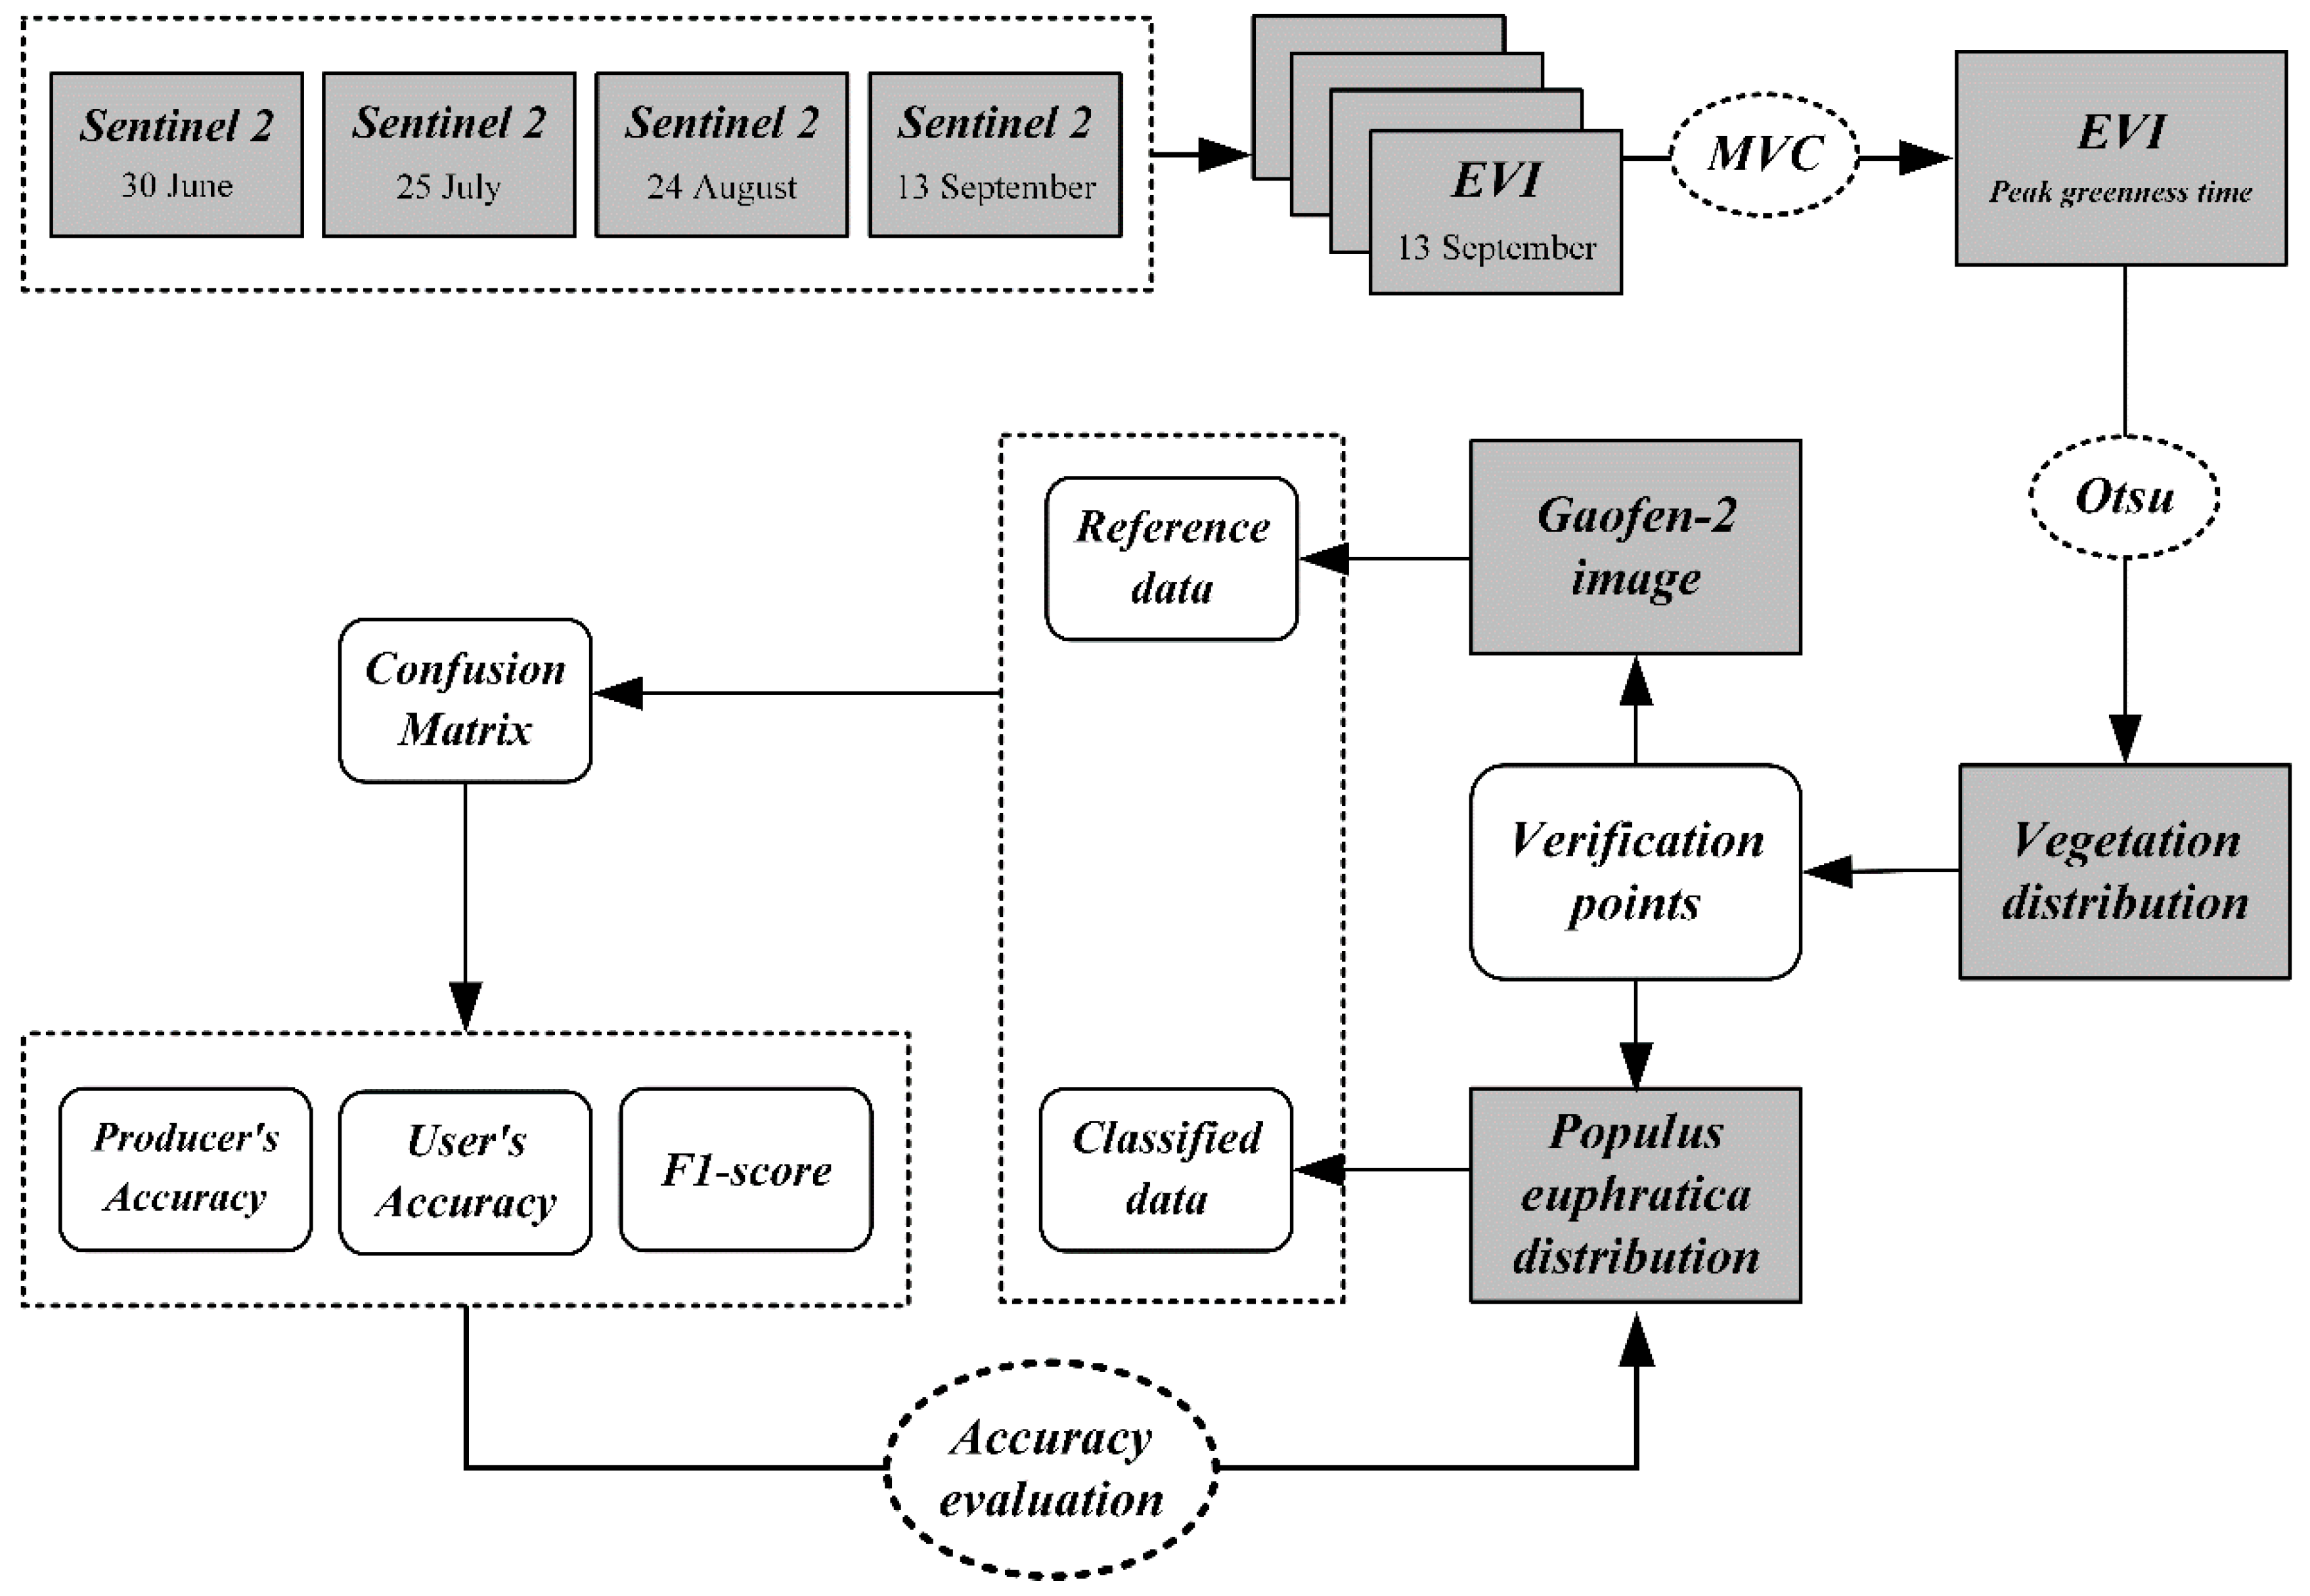
Ground phenological pictures were taken at regular intervals using an Ltl Acorn field observation camera installed on 20 August 2019. The shooting mode was set to timed photography at 10:00, 12:00, and 14:00. A total of 115 clear images acquired at 12:00 noon (local time 2:00 p.m.) from 1 March to 23 June (1 piece per day) were screened to construct a daily dataset of the greenness changes in Populus euphratica and Tamarix chinensis during spring.

3. Methods

3.1. Determination of the Optimal Time Window

The spectral reflectance curves for each month were drawn based on the pure Populus euphratica and Tamarix chinensis pixels that were evenly selected from the Sentinel-2 image. The month displaying the most significant variation in the spectral reflectance curves of Populus euphratica and Tamarix chinensis was selected as the candidate time window. The inverted red-edge chlorophyll index (IRECI) frequency distribution of the Populus euphratica and Tamarisk pixels were compared to select the optimal time window.
The optimal time window was determined with three steps:
(1) The pure pixels of Populus euphratica and Tamarix chinensis were selected. The sharpened GF-2 multispectral image had a high resolution of 1 m; thus, the pixels of Populus euphratica and Tamarix chinensis could be visually identified from the GF-2 image (Figure 2). Therefore, in the ENVI 5.3.1 software, we superimposed the GF-2 image onto the Sentinel-2 image; thus, the GF-2 image served as a reference layer to help us select pure pixels of Populus euphratica and Tamarix chinensis from the Sentinel-2 image. Then, with the ROI tool, 1200 pixels of Populus euphratica and 1200 pixels of Tamarix chinensis were evenly selected from the Sentinel-2 image by visual interpretation (Figure 1).
(2) The spectral reflectance curves for Populus euphratica and Tamarix chinensis were drawn for each month. In the Envi 5.3.1 software (classic version), the points (pure pixels, ROI file) selected in Step 1 were used to extract the pixel values of Populus euphratica and Tamarix chinensis in each band from 12 Sentinel-2 images in a continuous time series. The Origin 2018 software was used to calculate the mean of the sample points and plot the mean frequency distribution. The month displaying the most significant variations in the spectral reflectance of Populus euphratica and Tamarix chinensis was selected by analyzing the change features of the curves.
(3) Finally, the IRECI was calculated. Considering that there may be a deviation in the spectral reflectance difference observed by visual interpretation in step 2, we used the IRECI index to verify the determination of the best time window. The points (pure pixels, ROI file) were used to extract the IRECI values of Populus euphratica and Tamarix chinensis for each month; the IRECI frequency distribution was drawn, the frequency distribution curve was fitted with the normal distribution function, and the intersection of the curves was taken as a threshold to separate the pixels of Populus euphratica with Tamarix chinensis. The producer’s accuracy, user’s accuracy, and overall accuracy [9,34,41] were then calculated, and the month with the highest overall accuracy was selected as the optimal time window for differentiating Populus euphratica from Tamarix chinensis.

3.2. Screening the Appropriate Vegetation Index

Different vegetation indices have different sensitivities to changes in plant greenness. Therefore, selecting a suitable vegetation index according to the research content and objective is necessary. We pre-screened four vegetation indices (Table 2) constructed by the red-edge and near-infrared bands that can effectively indicate the difference in spectral reflectance between Populus euphratica and Tamarix chinensis, with the pure pixels of Populus euphratica and Tamarix chinensis pixels to further evaluate their performance [34,42,43]. The Excess Green minus Excess Red Index (ExGR, Table 2) is a widely used vegetation index that effectively indicates the difference in plant greenness in digital images. Based on the fine time resolution phenological dataset constructed by ground pictures, we used the ExGR index to analyze the greenness change features of Populus euphratica and Tamarix chinensis in spring to determine the optimal time window within the Sentinel-2 images.

3.3. Automatic Threshold Determination Method

To screen the optimal time window and vegetation index, the intersection of the IRECI frequency distribution fitting curves of the pure pixels of Populus euphratica and Tamarix chinensis was used as the threshold to distinguish between Populus euphratica and Tamarix chinensis. However, due to the lack of high-resolution images and the time-consuming and laborious selection of pure pixels, selecting the intersection as the threshold in practical applications was challenging. Therefore, it was necessary to adopt an automatic threshold determination method to segment the image. Six commonly used automatic threshold determination methods were tested for image segmentation in IDL 8.5 to determine the most appropriate method. The six tested automatic threshold selection methods were: (1) the maximum entropy thresholding algorithm, an automatic threshold selection method, which uses the entropy of the grey level histogram to segment images into two-level [46]; (2) the Otsu thresholding algorithm, named after the Japanese researcher Nobuyuki Otsu, which converts a gray level image to a binary image via the maximization of inter-class variation [47]; (3) the moments thresholding algorithm, which uses the moment-preserving principle for automatic threshold selection [48]; (4) the isodata thresholding algorithm, which uses an iterative approach to select an optimum threshold [49]; (5) the Minimum Error thresholding algorithm, whose principal is to optimize the average pixel classification error rate to find a cutoff point as a threshold [50]; (6) the mean thresholding algorithm, which takes the mean value of the gray levels as the threshold [51].

3.4. Accuracy Evaluation

The pure pixels selected in Section 3.1 were only suitable for evaluating the optimal time window and vegetation index, and cannot represent the extraction accuracy of Populus euphratica in the entire image. Therefore, the following steps were performed for accuracy verification (Figure 3).
First, verification points were randomly generated in the vegetation distribution area of the study site. In this step, verification points were randomly generated at a ratio of 0.1% of the total pixels using the ENVI 5.3.1 software.
Second, the verification points were superimposed on our classification results (Populus euphratica distribution map), and the categories of the verification points were extracted to obtain the classified data.
Third, the verification points were superimposed on the GF-2 image to obtain the category of verification points in the GF-2 image. The GF-2 image had a high resolution of 1 m, meaning that we could visually judge whether these points belonged to Populus euphratica pixels, Tamarix chinensis pixels, or other vegetation pixels. Therefore, the categories of these random verification points in the GF-2 image can be regarded as reference data.
Additionally, the classified data and reference data were used to build the confusion matrix; then, the user’s accuracy, producer’s accuracy, and F1-score (a commonly used quality metric in classification, i.e., the harmonic mean of the user’s accuracy and producer’s accuracy) [34,52] were calculated as the accuracy evaluation indicators.
We note that, in step 1, verification points should not be generated directly from the original Sentinel-2 image. This is because most of the pixels in the original image belong to desert pixels (non-vegetation pixels), and the proportion of vegetation pixels is relatively small. If the verification points are generated directly from the original image, most of the verification points are desert pixels. The IRECI value of desert pixels is very low, which almost does not yield error in the classification accuracy. This means that many of the random verification points are invalid. This will result in difficulties in the accuracy verification based on visual inspection. We focused on the extraction accuracy of Populus euphratica, such that we need to generate random verification points from vegetation pixels.
To extract the vegetation distribution of the study site, we considered using Sentinel-2 images acquired within the peak vegetation greenness period (from June to September) to calculate the enhanced vegetation index (EVI, Table 2). Then, we used the maximum value composite (MVC) method to synthesize the EVI images, followed by the Otsu thresholding method to segment the MVC image to obtain the vegetation distribution area. Therefore, random verification points were generated from the vegetation distribution area; the category of the verification pixels belonged to Populus euphratica pixels, Tamarix chinensis pixels, or other vegetation pixels.

4. Results

4.1. Spectral Reflectance Difference

In Sentinel-2 images, the red-edge bands (0.65–0.793 µm) and near-infrared band (0.785–0.9 µm) are most useful to tree species classification [7,14]; thus, we focused on the variation characteristics of the spectral reflectance of Populus euphratica pixels and Tamarix chinensis pixels in the red-edge bands and near-infrared band. In the range of red-edge bands and near-infrared band (Figure 4), the spectral reflectance of Tamarix chinensis pixels showed no significant change in January, February, and March. Comparing the spectral reflectance of Tamarix chinensis pixels in April and May, the spectral reflectance of Tamarix chinensis pixels increased significantly in May, had no significant change from June to September, and began to decline from October. Comparing the spectral reflectance of Populus euphratica in March and April, the spectral reflectance increased significantly in April, continued to increase in May, and had no significant change from June to September. Overall, April and May were the characteristic periods of greenness change for Populus euphratica and Tamarix chinensis.

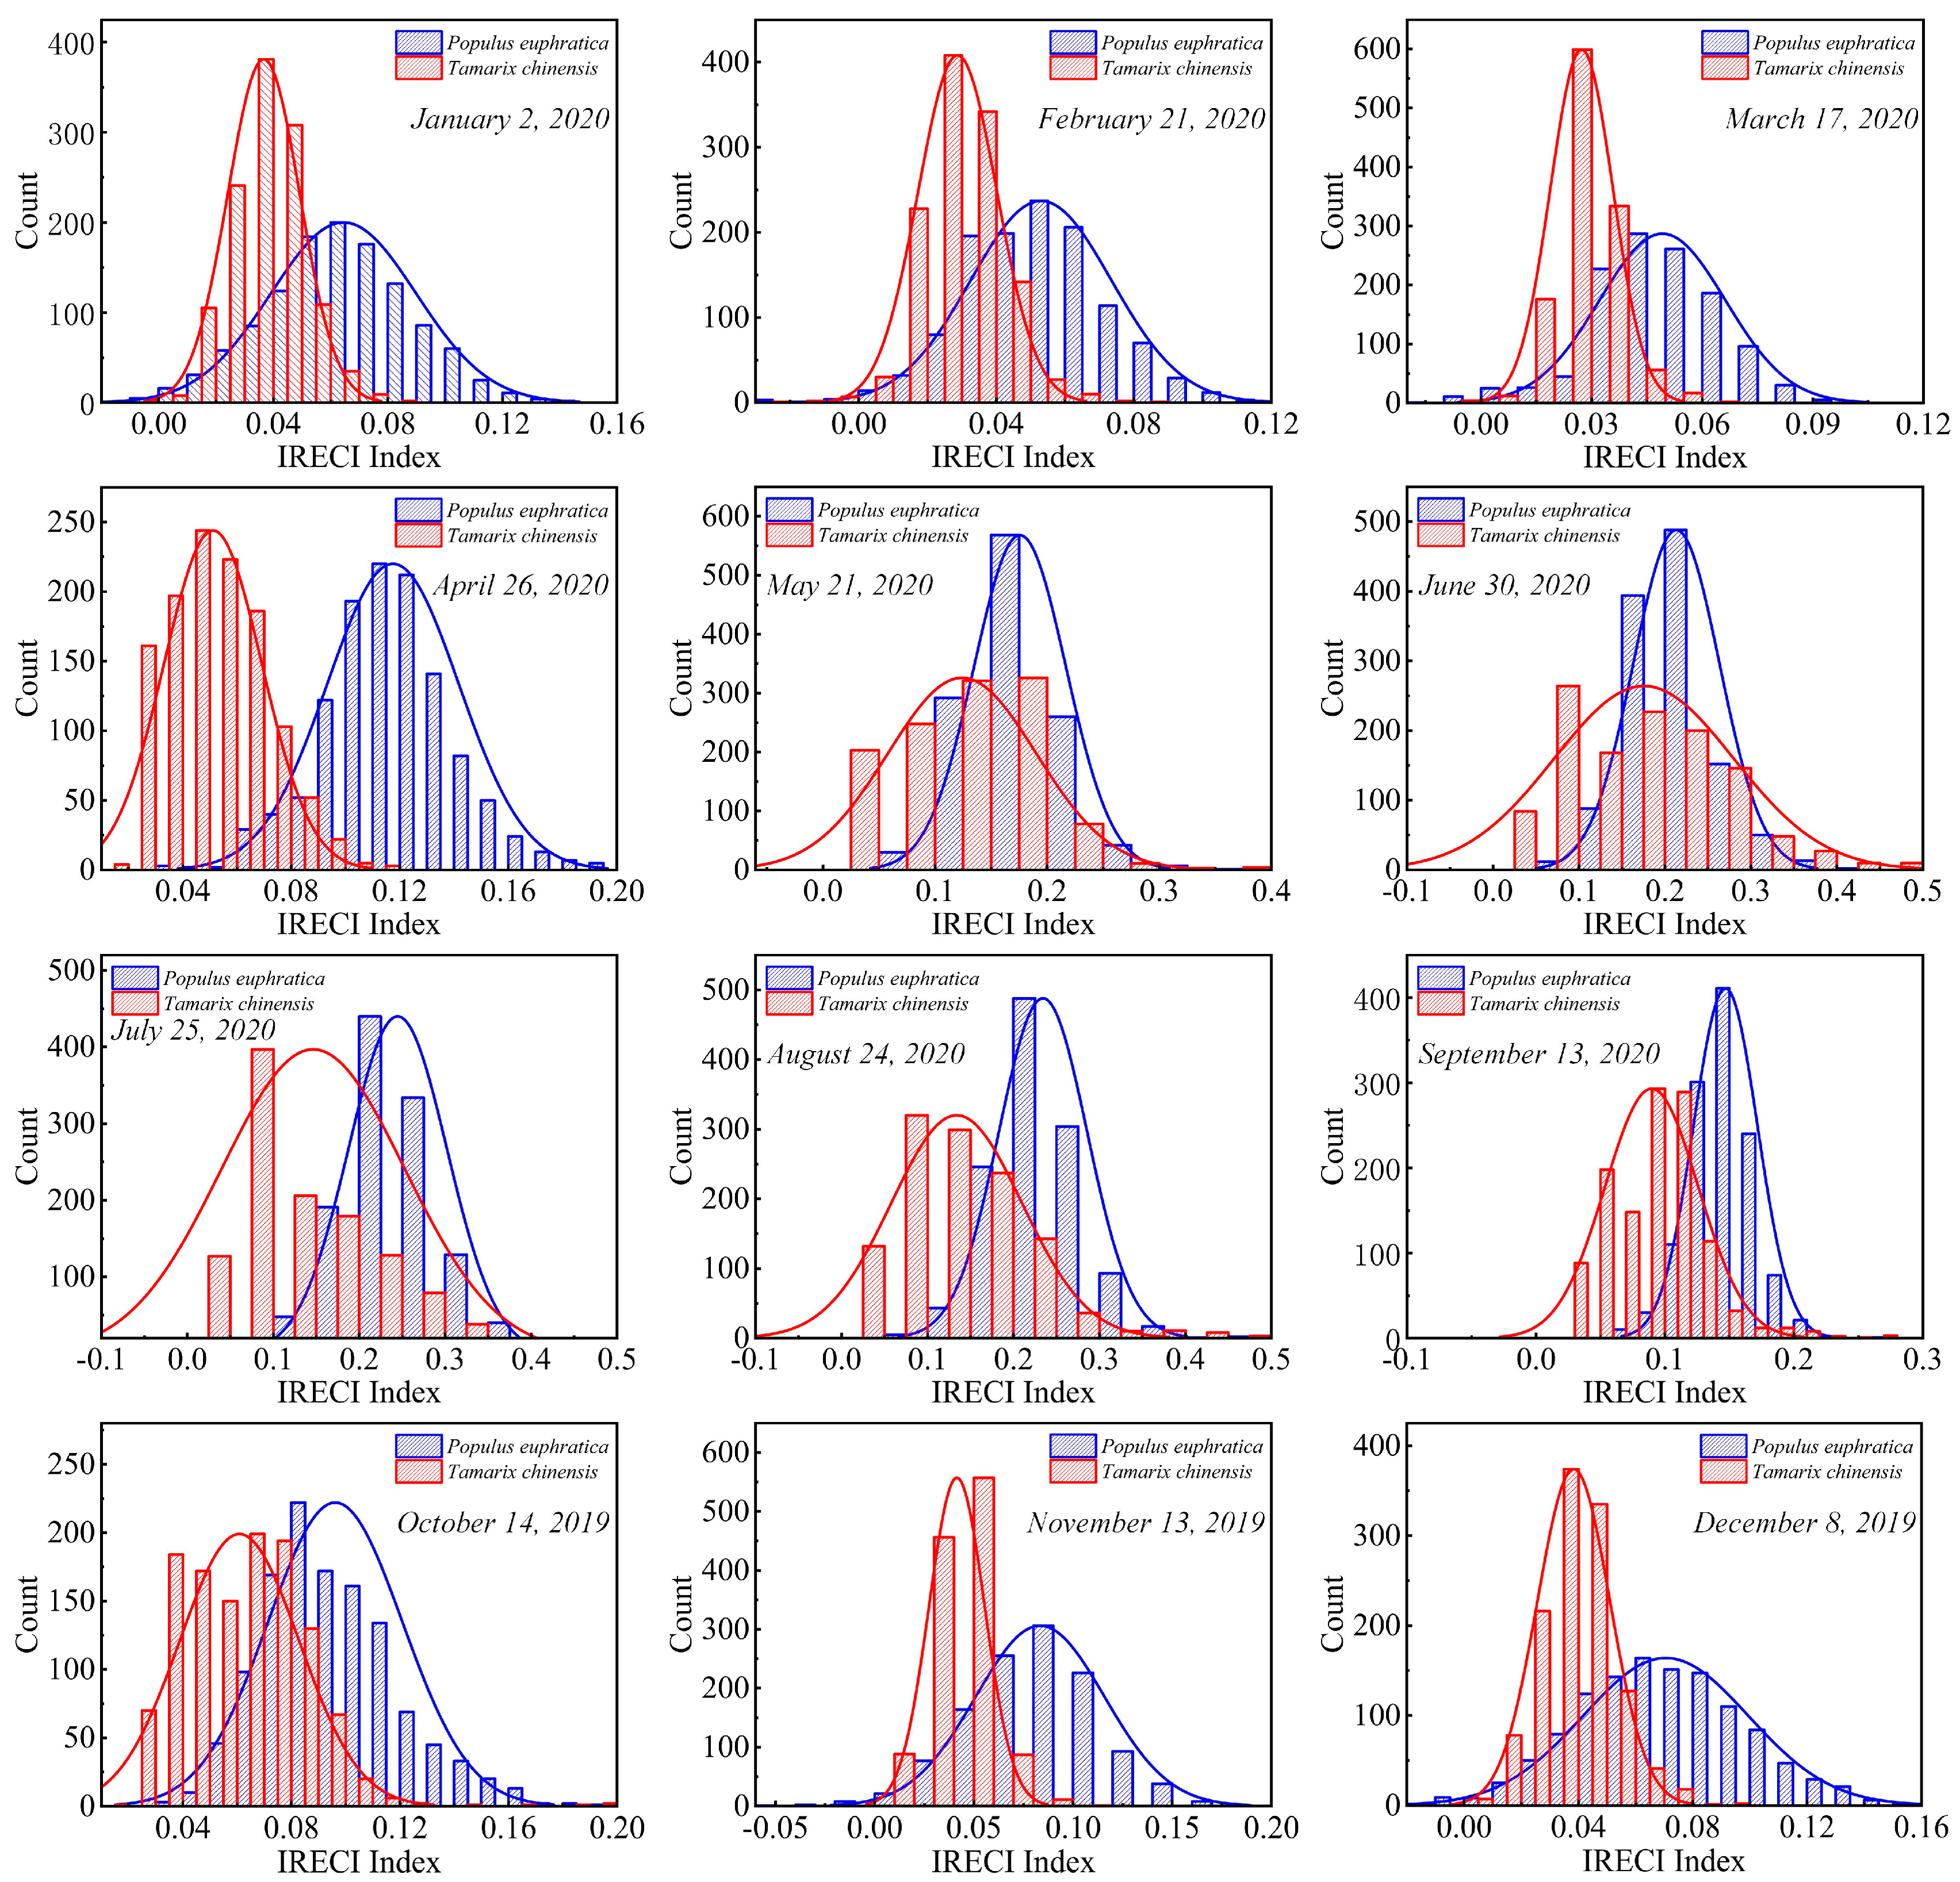
4.2. Difference in Frequency Distribution of IRECI

In terms of numerical distribution, the Populus euphratica IRECI values were distributed in the high-value interval, while the IRECI values of the Tamarix chinensis pixels were distributed in the low-value interval. The Tamarix chinensis IRECI frequency distribution was relatively concentrated in January, February, March, November, and December. The IRECI values of the Populus euphratica and Tamarix chinensis pixels significantly overlapped and were thus challenging to distinguish. From May to October, the Populus euphratica IRECI frequency was concentrated and the Populus euphratica and Tamarix chinensis IRECI values had a low numerical separation. In April, the Populus euphratica and Tamarix chinensis IRECI frequency distribution was relatively concentrated in a small interval. Furthermore, the IRECI values of Populus euphratica and Tamarix chinensis were significantly distinct, with a high numerical separation in April. The intersection of the IRECI frequency distribution fitting curves was used as the threshold to separate the Populus euphratica pixels from the Tamarix chinensis pixels, as well as to calculate the producer’s accuracy, user’s accuracy, and overall accuracy (Table 3). The results showed that the extraction performance for the Populus euphratica distribution based on Sentinel-2 images acquired in April was the best, with an overall accuracy of 93.42%, followed by that for September and November. In the studied year, the performance of separating Populus euphratica pixels from Tamarix chinensis pixels from the Sentinel-2 image acquired in May was the worst, with an overall accuracy of 67.88%. The performance for separating the Populus euphratica pixels from the Tamarix chinensis pixels was related to the difference in the spectral reflectance of Populus euphratica and Tamarix chinensis. The greater the difference in spectral reflectance, the better the discrimination of tree species (Figure 5). Based on the above, we determined April to be the optimal time window for mapping the Populus euphratica distribution.

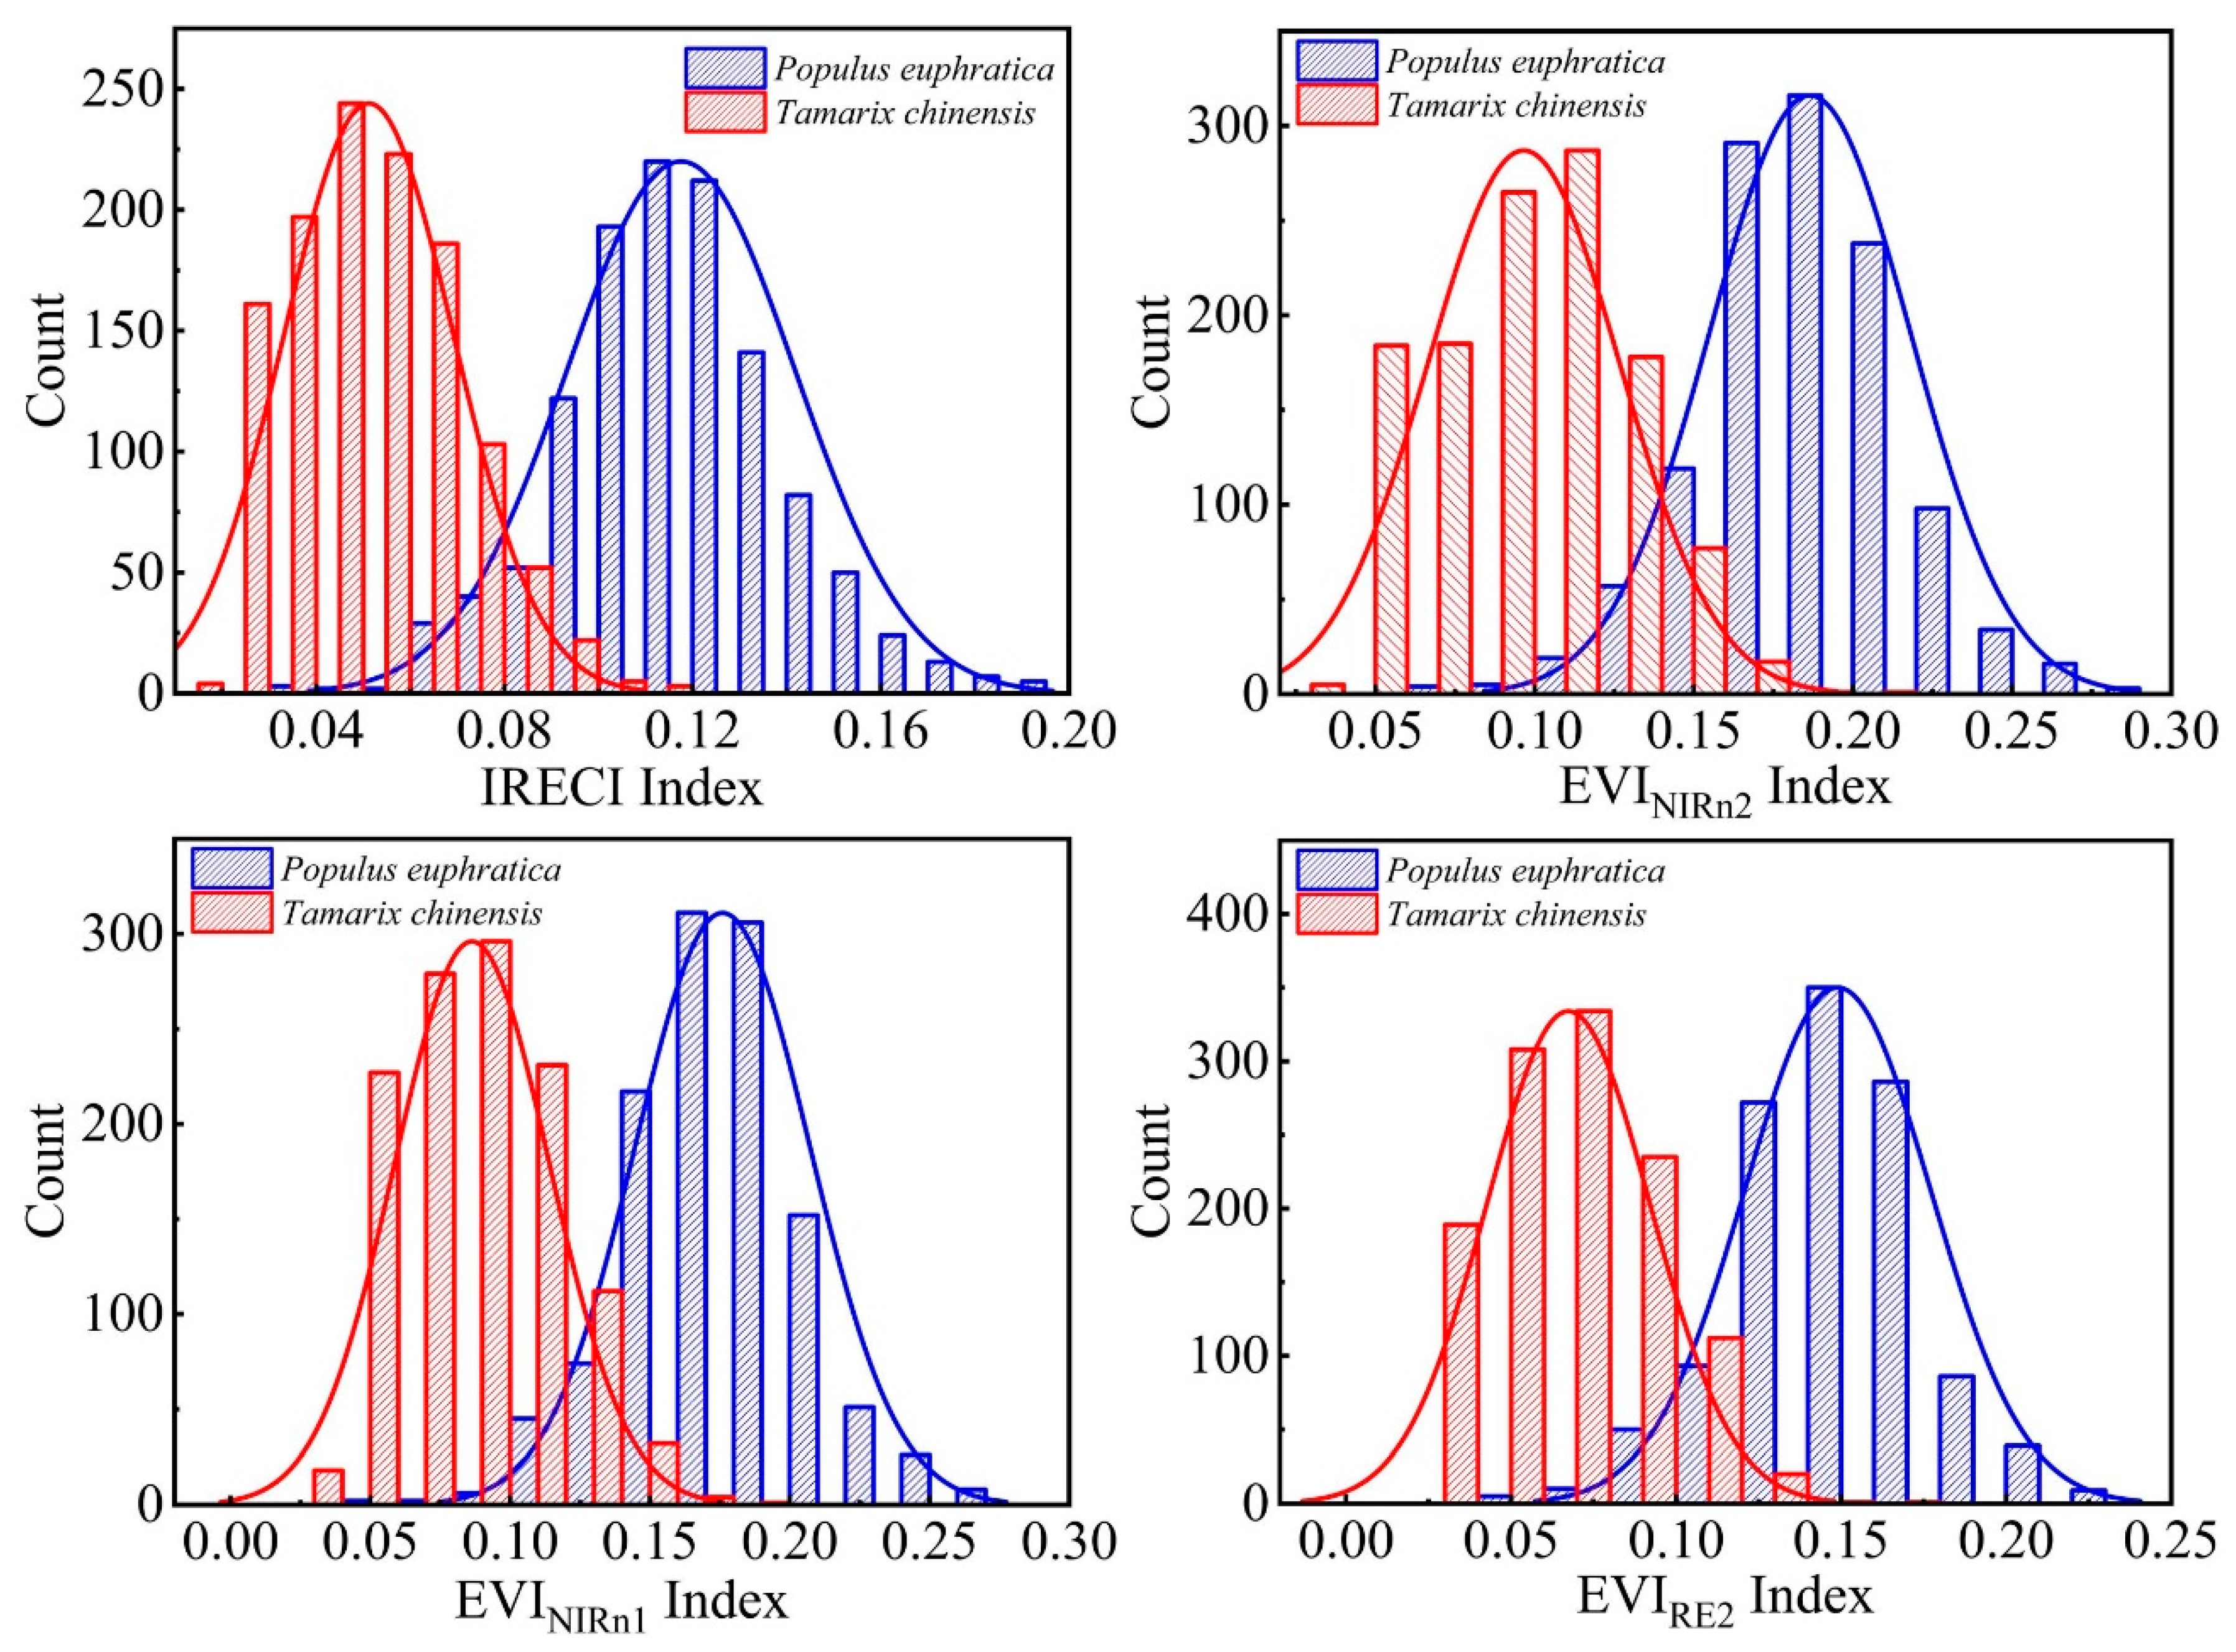
4.3. Appropriate Vegetation Index and Threshold Determination Method Selection

The distribution of vegetation index values for Populus euphratica and Tamarix chinensis (Figure 6) revealed no significant difference in the frequency distribution of these four vegetation indices. Moreover, all pure pixels of Populus euphratica and Tamarix chinensis displayed good numerical separation. The EVIRE2 index had the highest overall accuracy (0.936), followed by the IRECI index (0.934) and the EVINIRn2 (0.931) index. Furthermore, only a marginal difference in the overall accuracy of each index was recorded (Table 4). The applicable scenarios for the threshold determination methods differ, and tests are usually required to select an appropriate threshold determination method. From our calculation of the overall accuracy of the Populus euphratica distribution mapping derived from the combination of vegetation indices and automatic threshold determination methods, we found that among the combination of four vegetation indices and six threshold determination methods, only the IRECI index and maximum entropy combination was effective (92.3% accuracy) for separating the Populus euphratica pixels from the Tamarix chinensis pixels (Table 5). Therefore, we selected this combination to map the Populus euphratica distribution.

4.4. Populus Euphratica Distribution Mapping Results

The threshold of IRECI determined by the maximum entropy method was 0.748, which was similar to the intersection (0.8) of the IRECI frequency distribution fitting curves drawn based on the pure pixels of Populus euphratica and Tamarix chinensis. We used 0.748 as the threshold to segment the IRECI image and extract the Populus euphratica distribution (Figure 7). Comparing the extraction performance of Populus euphratica in different regions, we found that the extraction results in sparse areas (A–C), evenly distributed areas (D–F), and dense areas (G–I) were similar to the real situation. Moreover, there was no significant difference in the extraction effect among the different regions. The extraction performance of Populus euphratica in the dense area was the best. In several areas close to the main river channel (M–O), Tamarix chinensis pixels were misclassified as Populus euphratica pixels. However, this was not the case in the tributary area (J–L). The visual interpretation results of the pixel category discrimination showed that the user’s accuracy in mapping Populus euphratica based on the IRECI index and the maximum entropy method was 0.83, the producer’s accuracy was 0.72, and the F1-sore was 0.77 (Table 6).

5. Discussion

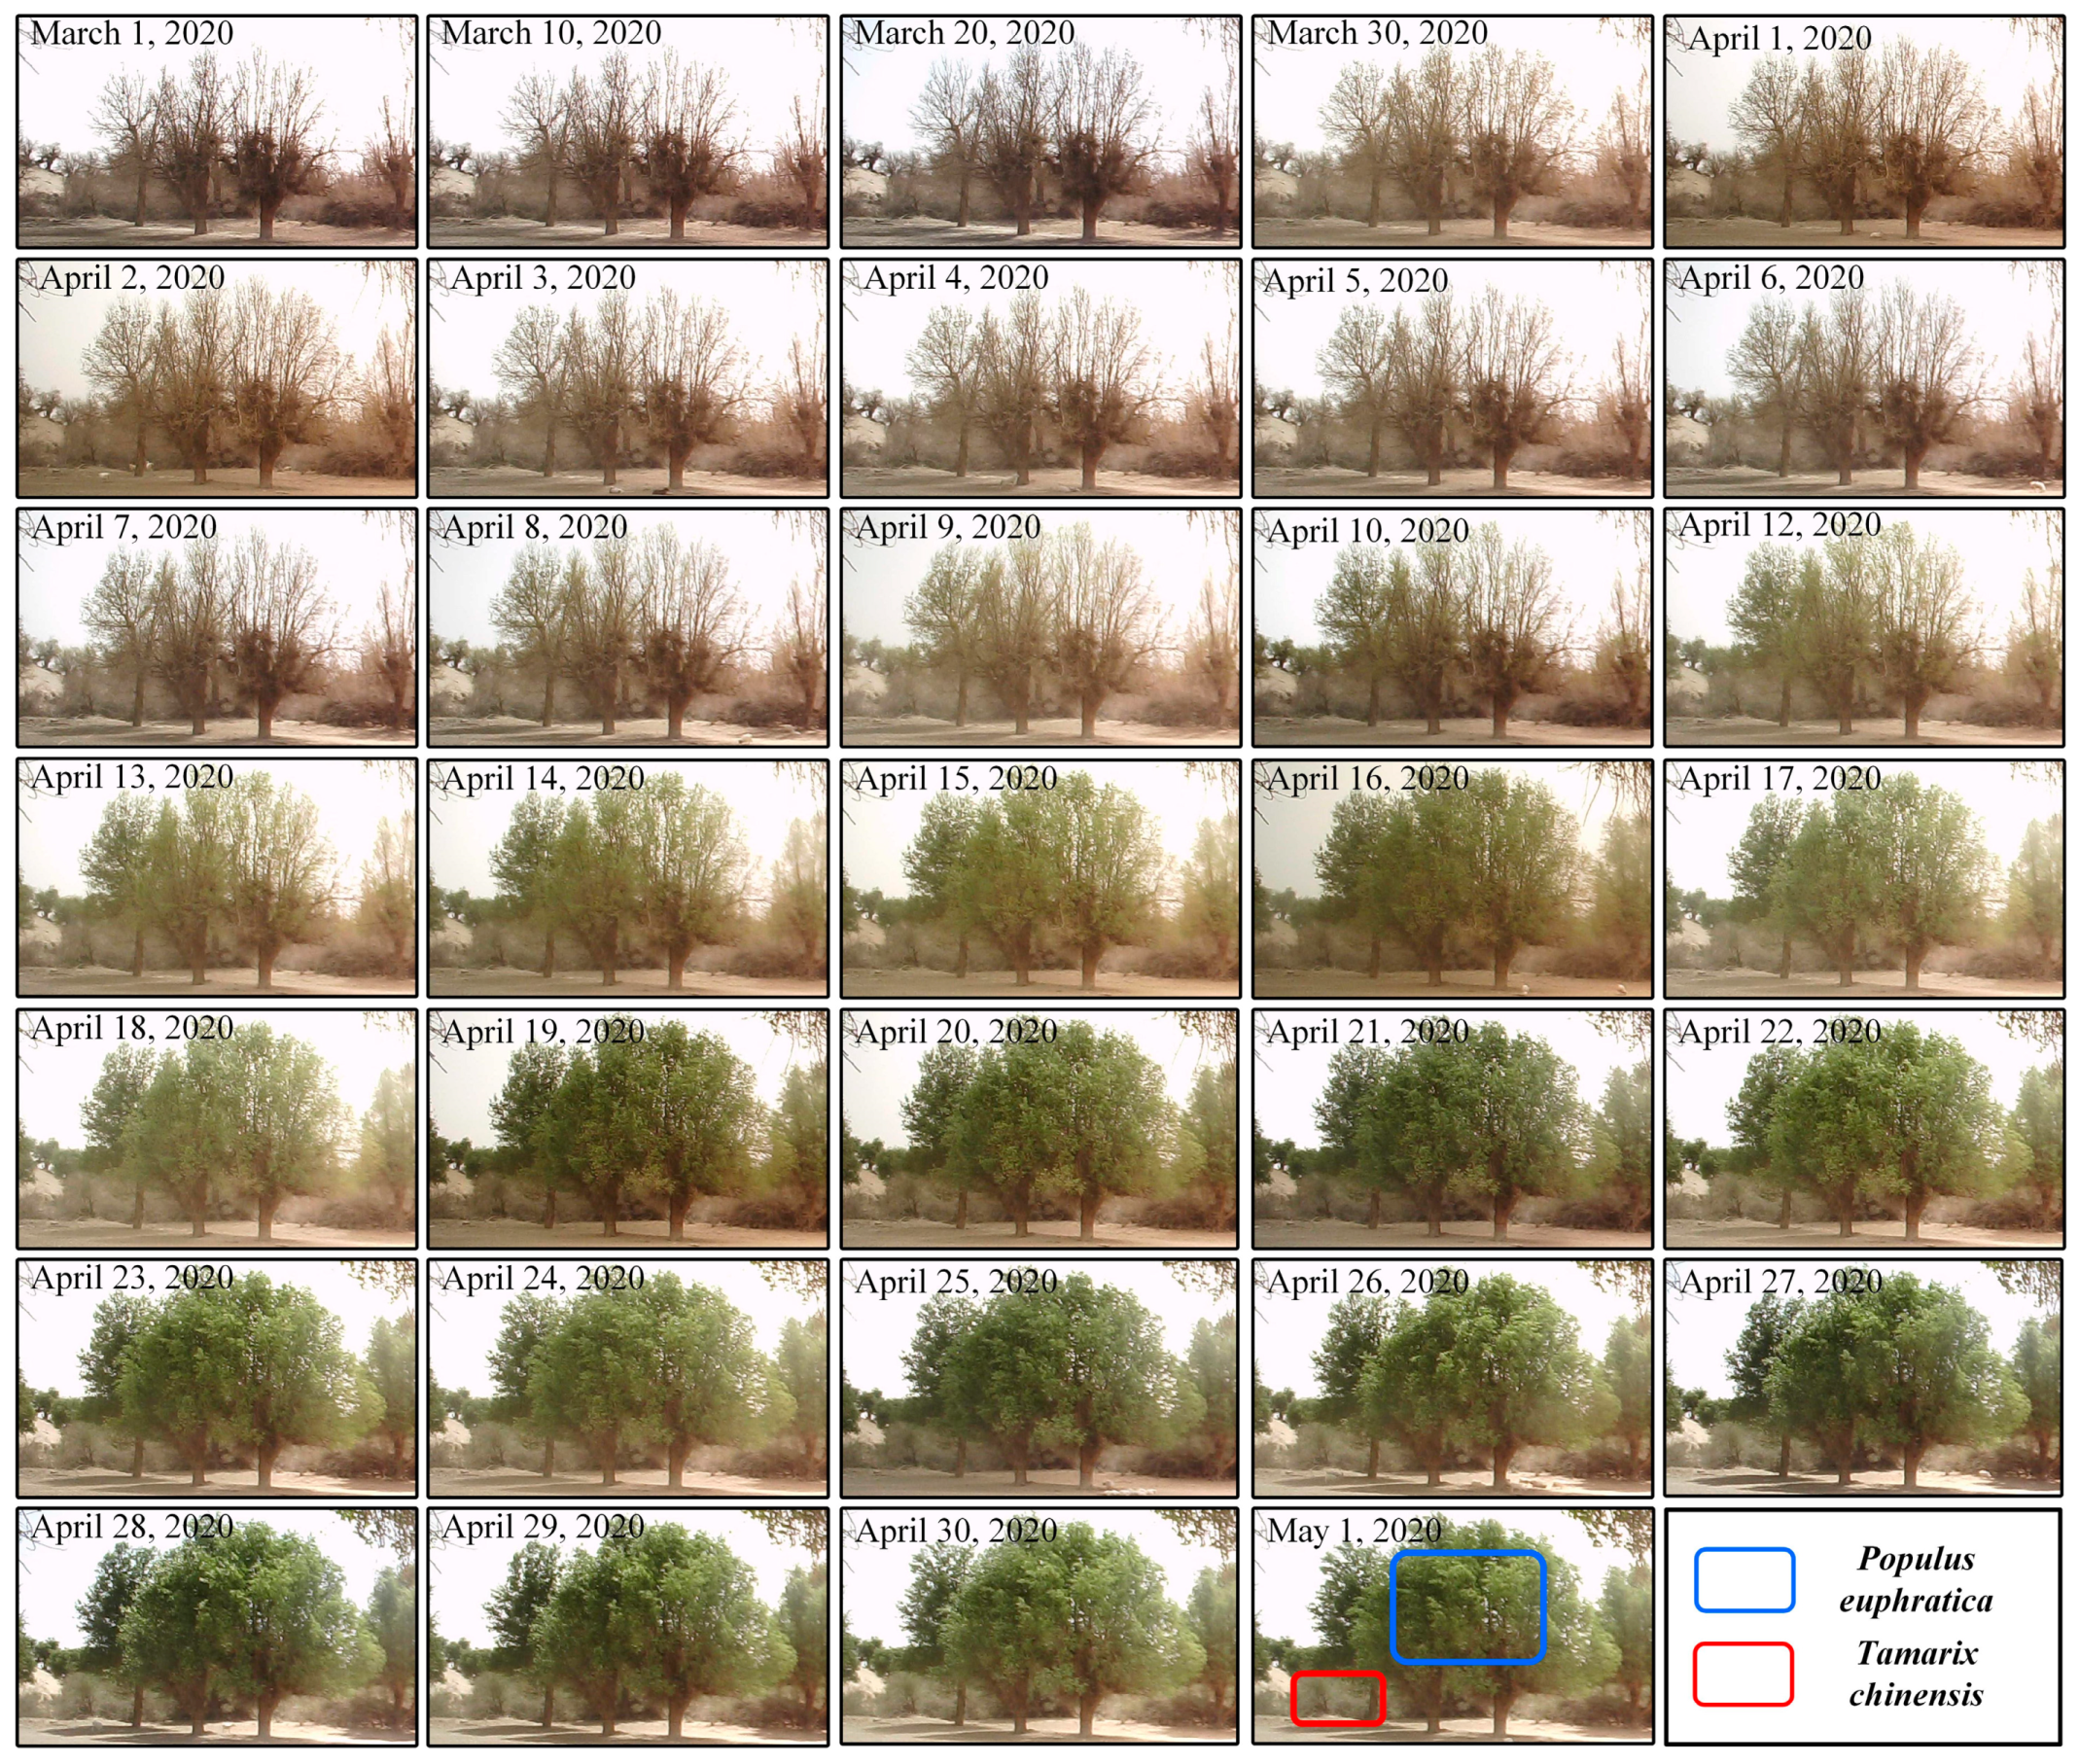
5.1. Ground Verification for Optimal Time Window

Accurately identifying the optimal time window for mapping the Populus euphratica distribution is difficult without an in situ observation of this species’ phenological behavior [22,53]. Therefore, we conducted a ground verification of the phenological behavior of Populus euphratica and Tamarix chinensis using ground digital pictures. The ExGR of the selected pixels was calculated and mean ExGR curves from 1 March to 23 June were plotted using the Origin 2018 software (Figure 8 and Figure 9). The ExGR index calculation was performed in batches using the IDL 8.5 software.
From the graphs (Figure 8 and Figure 9), the leaf greening period of Populus euphratica is earlier than that of Tamarix chinensis, and the greening speed of Populus euphratica is significantly faster than that of Tamarix chinensis. Specifically, the Populus euphratica leaves began greening between the end of March and the beginning of April, and greening increased exponentially around 10 April. The greenness approached a peak around 19 April and increased slowly for one week (around 27 April), after which the greenness did not increase significantly. The greenness change of Tamarix chinensis was relatively slow. The greening period of Tamarix chinensis started around 10 April; the greening speed was relatively fast at the beginning of May, reaching its peak around 25 May, after which the greenness did not increase significantly. Overall, the greening period of Tamarix chinensis lagged behind that of Populus euphratica by approximately one month. Comparing the numerical difference between the two curves, the peak difference period in IRECI between Populus euphratica and Tamarix chinensis lasted from 22 April to 1 May. We note that, starting from May, sandstorms occurred frequently and visibility decreased, leading to a decrease in the ExGR values in the pictures. The field observation records for Populus euphratica at different growth stages conducted in Alar in the northwestern Tarim Basin revealed that the leaf emergence of Populus euphratica was concentrated in early April, followed by leaf unfolding in mid-April, which lasted to mid–late May [54]. This is consistent with our observations in the Daliyabuyi Oasis.
Comparing Figure 4 and Figure 9, the greenness changes in Populus euphratica and Tamarix chinensis in the ground pictures are consistent with the changes in the spectral reflectance curves in the Sentinel-2 images. The phenological behavior of Populus euphratica predates Tamarix chinensis by approximately one month. Specifically, the greenness (spectral reflectance) of Populus euphratica reached its peak in late April, whereas the greenness (spectral reflectance) of Tamarix chinensis peaked in late May. In the monthly Sentinel-2 time-series images, the spectral difference between Populus euphratica and Tamarix chinensis peaked in late April. The above findings illustrate the rationality of using the Sentinel-2 image acquired in late April to differentiate Populus euphratica from Tamarix chinensis. The spectral difference between Populus euphratica and Tamarix chinensis within the key phenological stage is effective for mapping the Populus euphratica distribution based on the single-date Sentinel-2 image.

5.2. Main Factors Affecting the Extraction Accuracy of Populus euphratica

At a regional scale, dense Populus euphratica distribution areas displayed an improved extraction performance due to the purer Populus euphratica pixels in dense areas in the Sentinel-2 image. In areas close to the main river channel (Figure 7M–O), Tamarix chinensis pixels were misclassified as Populus euphratica pixels. The reason may be that the phenological behavior of Tamarix chinensis is similar to that of Populus euphratica because of the availability of water near the main channel, rendering the IRECI of Tamarix chinensis pixels similar to those of Populus euphratica pixels, which increases the difficulty in discriminating Populus euphratica pixels from Tamarix chinensis pixels. Therefore, the phenological variability at the regional scale leads to a decrease in the user’s accuracy (precision).
At the pixel scale, two main factors affect the extraction accuracy of Populus euphratica: the health degree of individual Populus euphratica, and the crown width and aggregation of individual Populus euphratica. Unhealthy Populus euphratica specimens have few leaves and are not easily identified by the IRECI. Several Populus euphratica had dead branches owing to the harsh environment in the desert area [55]. Healthy and mature Populus euphratica individuals with large crown sizes are more likely to be detected in Sentinel-2 images. In contrast, Populus euphratica individuals with small crowns can be detected if their distribution is clustered. Therefore, the health level, crown width, and aggregation of Populus euphratica determines whether its pixels can be effectively recognized on Sentinel-2 images, thus affecting the producer’s accuracy (recall).

5.3. Advantages of Sentinel-2 Image in Mapping Populus euphratica Distribution

Sentinel-2 consists of two satellites, A and B, with a return period of five days. The fine time resolution effectively guarantees cloudless images, thus increasing the availability of data, which is extremely beneficial for the identification of the key phenological stage [7]. According to Section 5.1, the optimal time window period lasts ~10 days (from 22 April to 1 May). Three Sentinel-2 images were available for this period. In addition, Sentinel-2 is equipped with three sensitive bands at the red-edge and near-infrared positions, which can effectively sense the spectral difference among plants [7,56]. This characteristic is crucial for plant discrimination. Our study revealed that the spectral index (IRECI) constructed with sensitive bands can effectively sense and capture the spectral difference exhibited within the key phenological stage to map the tree species distribution. Furthermore, the high resolution (10 m) of Sentinel-2 images allows for the identification of single Populus euphratica trees with large crown widths at the pixel scale.

5.4. Result Applications and Limitations

Studies on the Tamarix chinensis coloration stage have demonstrated the potential of phenological information in mapping the Tamarix chinensis distribution [9,10,31]. However, a few studies have focused on the usability of exploiting the difference in the foliage greening timing to distinguish Populus euphratica from Tamarix chinensis. Prior studies have stated that the foliage spectral similarity of Populus euphratica and Tamarix chinensis in summer did not allow for the spectral difference alone to distinguish Populus euphratica from Tamarix chinensis. Therefore, previous studies used shape and shadow information to map Populus euphratica [16]. However, those methods are only suitable for high-resolution images and cannot be applied to Sentinel-2 images. Our study established a critical time window during which Populus euphratica leaves are fully extended and the greenness reached its peak. Concurrently, the Tamarix chinensis leaves began to turn green, such that this is the best time to perform the separation of the two species. This feature is highly advantageous for extracting the Populus euphratica distribution from Sentinel-2 images.
Based on the Sentinel-2 image for late April and using the IRECI index and maximum entropy method to extract the Populus euphratica distribution, we obtained an F1-score of 0.77. This value implies that it is feasible to map the Populus euphratica distribution based on spectral differences from the single-date image. Therefore, future studies should aim to exploit the spectral differences within the key phenological stage to identify desert plants. The key to the effective utilization of spectral differences is to determine the optimal time window [9]. Larger spectral differences are more suitable for distinguishing tree species. Only the peaks of spectral differences appearing in the key phenological stage are effective for plant species discrimination, and these peaks can be used as sensitive variables for tree species mapping. Owing to the short duration of the time window, it is necessary to determine the optimal time window based on in situ phenological observation data, which have a fine temporal resolution. Therefore, we used a timed camera to acquire daily pictures of Populus euphratica and Tamarix chinensis to supplement the Sentinel-2 images [22].
Our research provides a pioneering method for mapping the Populus euphratica distribution. We determined that selecting the appropriate date for acquiring images is the key to mapping the Populus euphratica distribution. If the acquired date is appropriate, a considerable mapping accuracy can be obtained using less data and simple methods. Furthermore, the optimal time window for mapping Populus euphratica distribution determined in this study can be used to extract Populus euphratica distribution in other regions and eliminate the influence of Populus euphratica in the classification of other vegetation. In addition, this method can be used to determine the optimal time window for discriminating tree species. Moreover, the IRECI index, calculated within the time window, can be used to directly extract the Populus euphratica distribution; this index can also be used as an auxiliary variable in other classification methods for plant mapping.
This study extracts the Populus euphratica distribution based on spectral differences within the key phenological stage. The proposed method is simple and easy to implement, requires less data, and can quickly realize large-scale Populus euphratica distributions with good accuracy. However, the application of the method has some limitations. A disadvantage of this method is that due to environmental variation (such as accessibility to surface water and the groundwater depth), the phenological timing of Tamarix chinensis varies at a regional scale, decreasing the extraction accuracy of the Populus euphratica distribution [57]. Furthermore, the temperature is the primary factor affecting the Populus euphratica phenology [58]. Therefore, at a larger spatial scale, differences may exist in phenological timing, thereby reducing the availability of the optimal time window. Several studies have indicated that the phenological timing of Tamarix chinensis may vary at the individual level, increasing the complexity of Populus euphratica mapping based on phenological information [9]. In addition, because optical images are easily affected by clouds, there may be no none-cloud images available within the optimal time window in some years, which will limit the application of this method.

6. Conclusions

Fine temporal resolution ground phenological observation data can accurately capture the phenological behavior differences among tree species; these data can be used to determine the best time window for mapping the Populus euphratica distribution using Sentinel-2 images. This study used the characteristic earlier greening time of Populus euphratica leaves to explore the application of phenological difference in Populus euphratica distribution mapping. Our results indicated that 22 April to 1 May is the optimal time window for separating Populus euphratica and Tamarix chinensis. Moreover, the IRECI index effectively indicates the spectral reflectance difference between Populus euphratica and Tamarix chinensis. An F1-score of 0.77 was obtained using the single-date Sentinel-2 image acquired during the key phenological stage to map the Populus euphratica distribution.
The combination of the IRECI index and the maximum entropy threshold segmentation method can be used for the rapid extraction of the Populus euphratica distribution at a large scale. Furthermore, the IRECI index calculated within the optimal time window can be used as an auxiliary variable for other plant classification methods. However, the phenological variability of plants at a regional and individual scale decreases the accuracy of the vegetation distribution mapping using the single-date image. Our research provides a new perspective for mapping the distribution of the rare desert tree species, Populus euphratica, at a large scale. The spectral difference within the key phenological stages is beneficial for distinguishing Populus euphratica from Tamarix chinensis. The results also provide a useful reference for the classification of other desert plants.

Author Contributions

Conceptualization, H.L.; methodology, H.L. and Q.S.; investigation, Y.W.; formal analysis, H.L. and H.S.; resources, Q.S.; writing—original draft, H.L.; writing—review and editing, B.I. and Q.S. All authors have read and agreed to the published version of the manuscript.

Funding

The authors thank the National Natural Science Foundation of China (NSFC, U1703237) for financial support.

Data Availability Statement

No new data were created or analyzed in this study. Data sharing is not applicable to this article.

Acknowledgments

The authors thank Suhong Liu at the School of Geography, Beijing Normal University, for her assistance in coding. The authors appreciate the anonymous reviewers for their constructive comments and suggestions that significantly improved the quality of this manuscript.

Conflicts of Interest

The authors declare no conflict of interest.

References

  1. Lang, P.; Jeschke, M.; Wommelsdorf, T.; Backes, T.; Lv, C.; Zhang, X.; Thomas, F.M. Wood harvest by pollarding exerts long-term effects on Populus euphratica stands in riparian forests at the Tarim River, NW China. For. Ecol. Manag. 2015, 353, 87–96. [Google Scholar] [CrossRef]
  2. Aishan, T.; Halik, Ü.; Betz, F.; Gärtner, P.; Cyffka, B. Modeling height–diameter relationship for Populus euphratica in the Tarim riparian forest ecosystem, Northwest China. J. For. Res. 2016, 27, 889–900. [Google Scholar] [CrossRef]
  3. Chen, Y.; Chen, Y.; Xu, C.; Ye, Z.; Li, Z.; Zhu, C.; Ma, X. Effects of ecological water conveyance on groundwater dynamics and riparian vegetation in the lower reaches of Tarim River, China. Hydrol. Process. 2010, 24, 170–177. [Google Scholar] [CrossRef]
  4. Ling, H.; Zhang, P.; Xu, H.; Zhao, X. How to Regenerate and Protect Desert Riparian Populus euphratica Forest in Arid Areas. Sci. Rep. 2015, 5, 15418. [Google Scholar] [CrossRef] [PubMed] [Green Version]
  5. Halik, Ü.; Aishan, T.; Betz, F.; Kurban, A.; Rouzi, A. Effectiveness and challenges of ecological engineering for desert riparian forest restoration along China’s largest inland river. Ecol. Eng. 2019, 127, 11–22. [Google Scholar] [CrossRef]
  6. Immitzer, M.; Böck, S.; Einzmann, K.; Vuolo, F.; Pinnel, N.; Wallner, A.; Atzberger, C. Fractional cover mapping of spruce and pine at 1ha resolution combining very high and medium spatial resolution satellite imagery. Remote Sens. Environ. 2018, 204, 690–703. [Google Scholar] [CrossRef] [Green Version]
  7. Persson, M.; Lindberg, E.; Reese, H. Tree Species Classification with Multi-Temporal Sentinel-2 Data. Remote Sens. 2018, 10, 1794. [Google Scholar] [CrossRef] [Green Version]
  8. Immitzer, M.; Atzberger, C.; Koukal, T. Tree Species Classification with Random Forest Using Very High Spatial Resolution 8-Band WorldView-2 Satellite Data. Remote Sens. 2012, 4, 2661–2693. [Google Scholar] [CrossRef] [Green Version]
  9. Diao, C.; Wang, L. Incorporating plant phenological trajectory in exotic saltcedar detection with monthly time series of Landsat imagery. Remote Sens. Environ. 2016, 182, 60–71. [Google Scholar] [CrossRef]
  10. Ji, W.; Wang, L. Phenology-guided saltcedar (Tamarix spp.) mapping using Landsat TM images in western U.S. Remote Sens. Environ. 2016, 173, 29–38. [Google Scholar] [CrossRef]
  11. Pu, R.; Landry, S. A comparative analysis of high spatial resolution IKONOS and WorldView-2 imagery for mapping urban tree species. Remote Sens. Environ. 2012, 124, 516–533. [Google Scholar] [CrossRef]
  12. Xun, L.; Wang, L. An object-based SVM method incorporating optimal segmentation scale estimation using Bhattacharyya Distance for mapping salt cedar (Tamarisk spp.) with QuickBird imagery. GIScience Remote Sens. 2015, 52, 257–273. [Google Scholar] [CrossRef]
  13. Daryaei, A.; Sohrabi, H.; Atzberger, C.; Immitzer, M. Fine-scale detection of vegetation in semi-arid mountainous areas with focus on riparian landscapes using Sentinel-2 and UAV data. Comput. Electron. Agric. 2020, 177, 105686. [Google Scholar] [CrossRef]
  14. Immitzer, M.; Neuwirth, M.; Böck, S.; Brenner, H.; Vuolo, F.; Atzberger, C. Optimal Input Features for Tree Species Classification in Central Europe Based on Multi-Temporal Sentinel-2 Data. Remote Sens. 2019, 11, 2599. [Google Scholar] [CrossRef] [Green Version]
  15. Zhu, X.; Liu, D. Accurate mapping of forest types using dense seasonal Landsat time-series. ISPRS J. Photogramm. Remote Sens. 2014, 96, 1–11. [Google Scholar] [CrossRef]
  16. Ji, W.; Wang, L. Discriminating Saltcedar (Tamarix ramosissima) from Sparsely Distributed Cottonwood (Populus euphratica) Using a Summer Season Satellite Image. Photogramm. Eng. Remote Sens. 2015, 81, 795–806. [Google Scholar] [CrossRef]
  17. Hill, R.A.; Wilson, A.K.; George, M.; Hinsley, S.A. Mapping tree species in temperate deciduous woodland using time-series multi-spectral data. Appl. Veg. Sci. 2010, 13, 86–99. [Google Scholar] [CrossRef]
  18. Dennison, P.E.; Roberts, D.A. The effects of vegetation phenology on endmember selection and species mapping in southern California chaparral. Remote Sens. Environ. 2003, 87, 295–309. [Google Scholar] [CrossRef]
  19. Kollert, A.; Bremer, M.; Löw, M.; Rutzinger, M. Exploring the potential of land surface phenology and seasonal cloud free composites of one year of Sentinel-2 imagery for tree species mapping in a mountainous region. Int. J. Appl. Earth Obs. Geoinf. 2021, 94. [Google Scholar] [CrossRef]
  20. Schriever, J.R.; Congalton, R. Evaluating seasonal variability as an aid to cover-type mapping from Landsat Thematic Mapper data in the Northeast. Photogramm. Eng. Remote Sens. 1995, 61, 321–327. [Google Scholar]
  21. Hu, Q.; Sulla-Menashe, D.; Xu, B.; Yin, H.; Tang, H.; Yang, P.; Wu, W. A phenology-based spectral and temporal feature selection method for crop mapping from satellite time series. Int. J. Appl. Earth Obs. Geoinf. 2019, 80, 218–229. [Google Scholar] [CrossRef]
  22. Weil, G.; Lensky, I.M.; Levin, N. Using ground observations of a digital camera in the VIS-NIR range for quantifying the phenology of Mediterranean woody species. Int. J. Appl. Earth Obs. Geoinf. 2017, 62, 88–101. [Google Scholar] [CrossRef]
  23. Cheng, Y.; Vrieling, A.; Fava, F.; Meroni, M.; Marshall, M.; Gachoki, S. Phenology of short vegetation cycles in a Kenyan rangeland from PlanetScope and Sentinel-2. Remote Sens. Environ. 2020, 248, 112004. [Google Scholar] [CrossRef]
  24. Chen, J.; Jönsson, P.; Tamura, M.; Gu, Z.; Matsushita, B.; Eklundh, L. A simple method for reconstructing a high-quality NDVI time-series data set based on the Savitzky–Golay filter. Remote Sens. Environ. 2004, 91, 332–344. [Google Scholar] [CrossRef]
  25. Ma, M.; Veroustraete, F. Reconstructing pathfinder AVHRR land NDVI time-series data for the Northwest of China. Adv. Space Res. 2006, 37, 835–840. [Google Scholar] [CrossRef]
  26. Cai, Z.; Jönsson, P.; Jin, H.; Eklundh, L. Performance of Smoothing Methods for Reconstructing NDVI Time-Series and Estimating Vegetation Phenology from MODIS Data. Remote Sens. 2017, 9, 1271. [Google Scholar] [CrossRef] [Green Version]
  27. Wulder, M.A.; Loveland, T.R.; Roy, D.P.; Crawford, C.J.; Masek, J.G.; Woodcock, C.E.; Allen, R.G.; Anderson, M.C.; Belward, A.S.; Cohen, W.B.; et al. Current status of Landsat program, science, and applications. Remote Sens. Environ. 2019, 225, 127–147. [Google Scholar] [CrossRef]
  28. Grabska, E.; Frantz, D.; Ostapowicz, K. Evaluation of machine learning algorithms for forest stand species mapping using Sentinel-2 imagery and environmental data in the Polish Carpathians. Remote Sens. Environ. 2020, 251, 112103. [Google Scholar] [CrossRef]
  29. Kowalski, K.; Senf, C.; Hostert, P.; Pflugmacher, D. Characterizing spring phenology of temperate broadleaf forests using Landsat and Sentinel-2 time series. Int. J. Appl. Earth Obs. Geoinf. 2020, 92, 102172. [Google Scholar] [CrossRef]
  30. Jr, J.G.; Civco, D.; Silander, J. Delineating forest canopy species in the Northeastern United States using multi-temporal TM imagery. Photogramm. Eng. Remote Sens. 1998, 64, 891–904. [Google Scholar]
  31. Wang, L.; Silván-Cárdenas, J.L.; Yang, J.; Frazier, A.E. Invasive Saltcedar (Tamarisk spp.) Distribution Mapping Using Multiresolution Remote Sensing Imagery. Prof. Geogr. 2013, 65, 1–15. [Google Scholar] [CrossRef]
  32. Rundquist, B.C.; Brookman, D.A. Spectral characterization of the invasive shrub saltcedar (Tamarix spp.) in North Dakota. Geocarto Int. 2007, 22, 63–72. [Google Scholar] [CrossRef]
  33. Hao, L.; Qingdong, S.; Imin, B.; Kasim, N. Methodology for optimizing quadrat size in sparse vegetation surveys: A desert case study from the Tarim Basin. PLoS ONE 2020, 15, e0235469. [Google Scholar] [CrossRef] [PubMed]
  34. Masemola, C.; Cho, M.A.; Ramoelo, A. Sentinel-2 time series based optimal features and time window for mapping invasive Australian native Acacia species in KwaZulu Natal, South Africa. Int. J. Appl. Earth Obs. Geoinf. 2020, 93, 102207. [Google Scholar] [CrossRef]
  35. Wai-Tim, N.; Purity, R.; Kathrin, E.; Markus, I.; Clement, A.; Sandra, E.J.R.S. Assessing the Potential of Sentinel-2 and Pléiades Data for the Detection of Prosopis and Vachellia spp. in Kenya. Remote Sens. 2017, 9, 74. [Google Scholar]
  36. Chenghai, Y.; James, H.E.; Reginald, S.F. Evaluating airborne hyperspectral imagery for mapping saltcedar infestations in west Texas. J. Appl. Remote Sens. 2013, 7, 1. [Google Scholar] [CrossRef]
  37. Aragones, D.; Rodriguez-Galiano, V.F.; Caparros-Santiago, J.A.; Navarro-Cerrillo, R.M. Could land surface phenology be used to discriminate Mediterranean pine species? Int. J. Appl. Earth Obs. Geoinf. 2019, 78, 281–294. [Google Scholar] [CrossRef]
  38. Rodriguez-Galiano, V.; Dash, J.; Atkinson, P. Characterising the Land Surface Phenology of Europe Using Decadal MERIS Data. Remote Sens. 2015, 7, 9390–9409. [Google Scholar] [CrossRef] [Green Version]
  39. Shi, Q.; Guo, Y.; Zhou, X. Machanism of the influence of surface water and groundwater on vegetation pattern in Daliyaboyi oasis at the tail of Keriya river in Taklamakan deser. J. Xinjiang Univ. 2019, 36, 53–259. [Google Scholar] [CrossRef]
  40. Zhang, F.; Wang, T.; Yimit, H.; Shi, Q.; Ruan, Q.; Sun, Z.; Li, F. Hydrological changes and settlement migrations in the Keriya River delta in central Tarim Basin ca. 2.7–1.6 ka BP: Inferred from 14C and OSL chronology. Sci. China Earth Sci. 2011, 54, 1971–1980. [Google Scholar] [CrossRef]
  41. Foody, G.M. Status of land cover classification accuracy assessment. Remote Sens. Environ. 2002, 80, 185–201. [Google Scholar] [CrossRef]
  42. Frampton, W.J.; Dash, J.; Watmough, G.; Milton, E.J. Evaluating the capabilities of Sentinel-2 for quantitative estimation of biophysical variables in vegetation. ISPRS J. Photogramm. Remote Sens. 2013, 82, 83–92. [Google Scholar] [CrossRef] [Green Version]
  43. Majasalmi, T. The potential of Sentinel-2 data for estimating biophysical variables in a boreal forest: A simulation study. Remote Sens. Lett. 2016, 7. [Google Scholar] [CrossRef]
  44. Huete, A.; Didan, K.; Miura, T.; Rodriguez, E.P.; Gao, X.; Ferreira, L.G. Overview of the radiometric and biophysical performance of the MODIS vegetation indices. Remote Sens. Environ. 2002, 83, 195–213. [Google Scholar] [CrossRef]
  45. Meyer, G.E.; Camargo Neto, J.; Jones, D.D.; Hindman, T.W. Intensified fuzzy clusters for classifying plant, soil, and residue regions of interest from color images. Comput. Electron. Agric. 2004, 42, 161–180. [Google Scholar] [CrossRef] [Green Version]
  46. Kapur, J.N.; Sahoo, P.K.; Wong, A.K.C. A new method for gray-level picture thresholding using the entropy of the histogram. Comput. Vis. Graph. Image Process. 1985, 29, 273–285. [Google Scholar] [CrossRef]
  47. Otsu, N. A Threshold Selection Method from Gray-Level Histograms. IEEE Trans. Syst. Man Cybern. 1979, 9, 62–66. [Google Scholar] [CrossRef] [Green Version]
  48. Tsai, W.-H. Moment-preserving thresolding: A new approach. Comput. Vis. Graph. Image Process. 1985, 29, 377–393. [Google Scholar] [CrossRef]
  49. Ridler, T.W.; Calvard, S. Picture Thresholding Using an Iterative Selection Method. IEEE Trans. Syst. Man Cybern. 1978, 8, 630–632. [Google Scholar] [CrossRef]
  50. Kittler, J.; Illingworth, J. Minimum error thresholding. Pattern Recognit. 1986, 19, 41–47. [Google Scholar] [CrossRef]
  51. Glasbey, C.A. An Analysis of Histogram-Based Thresholding Algorithms. CVGIP Graph. Models Image Process. 1993, 55, 532–537. [Google Scholar] [CrossRef]
  52. Carbonneau, P.E.; Dugdale, S.J.; Breckon, T.P.; Dietrich, J.T.; Fonstad, M.A.; Miyamoto, H.; Woodget, A.S. Adopting deep learning methods for airborne RGB fluvial scene classification. Remote Sens. Environ. 2020, 251, 112107. [Google Scholar] [CrossRef]
  53. Hmimina, G.; Dufrêne, E.; Pontailler, J.Y.; Delpierre, N.; Aubinet, M.; Caquet, B.; de Grandcourt, A.; Burban, B.; Flechard, C.; Granier, A.; et al. Evaluation of the potential of MODIS satellite data to predict vegetation phenology in different biomes: An investigation using ground-based NDVI measurements. Remote Sens.Environ. 2013, 132, 145–158. [Google Scholar] [CrossRef]
  54. Zheng, Y.; Feng, M. Investigation of bud burst, shoot growth and leaf expansion in Populus euphratica of different ages. Acta Ecol. Sin. 2015, 35, 1198–1207. [Google Scholar] [CrossRef] [Green Version]
  55. Aishan, T.; Halik, Ü.; Kurban, A.; Cyffka, B.; Kuba, M.; Betz, F.; Keyimu, M. Eco-morphological response of floodplain forests (Populus euphratica Oliv.) to water diversion in the lower Tarim River, northwest China. Environ. Earth Sci. 2015, 73, 533–545. [Google Scholar] [CrossRef]
  56. Immitzer, M.; Vuolo, F.; Atzberger, C. First Experience with Sentinel-2 Data for Crop and Tree Species Classifications in Central Europe. Remote Sens. 2016, 8, 166. [Google Scholar] [CrossRef]
  57. Bajocco, S.; Ferrara, C.; Alivernini, A.; Bascietto, M.; Ricotta, C. Remotely-sensed phenology of Italian forests: Going beyond the species. Int. J. Appl. Earth Obs. Geoinf. 2019, 74, 314–321. [Google Scholar] [CrossRef]
  58. Li, Z.; Zhang, X.; Zheng, Y.; Qiu, A.; Zhang, L. Effects of temperature on flowering phenological traits of Populus euphratica Oliv. and Populus pruinosa Schrenk populations, Xinjiang, China. J. Arid Land 2019, 11, 754–763. [Google Scholar] [CrossRef] [Green Version]
Figure 1. Location of the study site. (a) Pure pixels of Populus euphratica and Tamarix chinensis in a Sentinel-2 image acquired on 26 April 2020; the band combination is 8/4/3. (b) and (c) Pure pixels in a Gaofen-2 (GF-2) image acquired on 19 September 2018; the band combination is 4/3/2. (1–6) main land cover in the study site.
Forests 12 00147 g001
Figure 2. Typical plant distribution patterns of the study site in three spatial resolution images. The above plot area is 200 × 200 m2. (A) Dense distribution area of Tamarix chinensis, (B) dense distribution area of Populus euphratica, (C) mixed area of Populus euphratica and Tamarix chinensis, and (D) mixed area of Populus euphratica and Tamarix chinensis in the flood period.
Forests 12 00147 g002
Figure 3. Flowchart of the accuracy evaluation. MVC, maximum value composite.
Forests 12 00147 g003
Figure 4. Spectral reflectance curves for Populus euphratica and Tamarix chinensis obtained from monthly Sentinel-2 images.
Forests 12 00147 g004
Figure 5. Inverted red-edge chlorophyll index (IRECI) frequency distribution of Populus euphratica and Tamarix chinensis reference pixels in the monthly Sentinel-2 images.
Forests 12 00147 g005
Figure 6. Frequency distribution of selected vegetation indices for reference samples.
Forests 12 00147 g006
Figure 7. Distribution map of Populus euphratica: (AC) sparse area of Populus euphratica; (DF) evenly distributed areas of Populus euphratica; (GI) dense areas of Populus euphratica; (JL) tributary areas; and (MO) main channel area.
Forests 12 00147 g007
Figure 8. Greenness changes in Populus euphratica and Tamarix chinensis during the leaf development period.
Forests 12 00147 g008
Figure 9. Greenness change curves of Populus euphratica and Tamarix chinensis in spring.
Forests 12 00147 g009
Table 1. Description of the images and bands used in the study.
Data TypeAcquisition DateBandsSpatial Resolution (m)
DayMonthYear
Sentinel-22January2020Blue
Red
Red-edge 1
Red-edge 2
Near-infrared-1
Near-infrared-2
10
21February
17March
26April
21May
30June
25July
24August
13September
14October2019
13November
8December
Gaofen-217September2018Blue/Green/Red/Near-infrared1
UAV28August2018Blue/Green/Red0.33
Note: UAV, unmanned aerial vehicle.
Table 2. Vegetation indices used in this study.
NameAbbrevFormulaReference
Inverted Red-Edge Chlorophyll IndexIRECI(NIRn1 − R)/(RE1/RE2)[42,43]
Enhanced Vegetation IndexEVIRE22.5 × (RE2 − R)/(1 + RE2 + 6R − 7.5B)[44]
EVINIRn12.5 × (NIRn1 − R)/(1 + NIRn1 + 6R − 7.5B)
EVINIRn22.5 × (NIRn2 − R)/(1 + NIRn2 + 6R − 7.5B)
EVI2.5 × (NIR − R)/(1 + NIR + 6R − 7.5B)
Excess Green minus Excess Red IndexExGR3G − 2.4R − B[45]
Note: NIRn1: NIR (near-infrared) narrow 1 band, band 7 of Sentinel-2 image; R: red band, band 4; RE1: red-edge 1 band, band 5; RE2: red-edge 2 band, band 6; B: blue band, band 2; NIRn2: NIR narrow 2 band, band 8A; NIR, near-infrared band, band 8; G, green band.
Table 3. Comparison of the overall classification accuracy in each month of the analyzed year.
MonthSpeciesThresholdPA (%)UA (%)OA (%)
JanuaryPopulus euphratica0.05270.7586.8180.00
Tamarix chinensis89.2575.32
FebruaryPopulus euphratica0.04268.9285.6173.99
Tamarix chinensis88.4273.99
MarchPopulus euphratica0.03975.0090.8283.71
Tamarix chinensis92.4278.71
AprilPopulus euphratica0.0893.6793.2093.42
Tamarix chinensis93.1793.63
MayPopulus euphratica0.13286.3364.4369.33
Tamarix chinensis52.3379.29
JunePopulus euphratica0.15789.5862.4667.88
Tamarix chinensis46.1781.59
JulyPopulus euphratica0.20477.1776.7876.92
Tamarix chinensis76.6777.05
AugustPopulus euphratica0.17887.5877.6281.17
Tamarix chinensis74.7585.76
SeptemberPopulus euphratica0.11889.0084.1686.13
Tamarix chinensis83.2588.33
OctoberPopulus euphratica0.07679.1776.4377.38
Tamarix chinensis75.5878.39
NovemberPopulus euphratica0.0677.2590.3584.50
Tamarix chinensis91.7580.13
DecemberPopulus euphratica0.05668.5889.9580.46
Tamarix chinensis92.3374.61
Note: PA, producer’s accuracy; UA, user’s accuracy; OA, overall accuracy.
Table 4. Overall accuracy of vegetation indices selected for distinguishing Populus euphratica reference samples.
Vegetation Index
Overall accuracyIRECIEVIRE2EVINIRn1EVINIRn2
0.9340.9360.9040.931
Table 5. Comparison of the accuracies of various vegetation indices and threshold determination method combinations.
Threshold MethodVegetation Index
IRECIEVIRE2EVINIRn1EVINIRn2
Maximum entropy0.9230.5000.5000.500
Otsu0.6450.6040.5890.563
Moments0.5920.5500.5550.528
Isodata0.5000.5000.5000.500
Minimum error0.5920.5500.5420.510
Mean0.5390.5090.5050.500
Table 6. Confusion matrix classification results using the combined IRECI index and maximum entropy.
Classified DataReference Data
Populus euphraticaOther
Populus euphratica15832
other621181
PA158/(158 + 62) = 0.72
UA158/(158 + 32) = 0.83
F1-score2/(1/PA + 1/UA) = 0.77
Note: PA, producer’s accuracy; UA, user’s accuracy.
Publisher’s Note: MDPI stays neutral with regard to jurisdictional claims in published maps and institutional affiliations.

