Article

Assessing Tree Coverage and the Direct and Mediation Effect of Tree Diversity on Carbon Storage through Stand Structure in Homegardens of Southwestern Bangladesh

1
Henan Key Laboratory of Earth System Observation and Modeling, Henan University, Kaifeng 475004, China
2
College of Geography and Environmental Science, Henan University, Kaifeng 475004, China
3
Forestry and Wood Technology Discipline, Khulna University, Khulna 9208, Bangladesh
*
Author to whom correspondence should be addressed.
Authors contributed equally to this work.
Forests 2021, 12(12), 1661; https://doi.org/10.3390/f12121661
Submission received: 1 October 2021 / Revised: 10 November 2021 / Accepted: 23 November 2021 / Published: 30 November 2021
(This article belongs to the Special Issue Systematic Approach to Agroforestry Policies and Practices in Asia)

Abstract

:
Dealing with two major challenges, climate change mitigation and biodiversity loss, under the same management program, is more noteworthy than addressing these two separately. Homegardens, a sustainable agroforestry system and a home of diverse species, can be a possible choice to address these two issues. In this study, we assessed tree coverage, and the direct and indirect effects of tree diversity on carbon storage in different carbon pools through stand structure in homegardens of southwestern Bangladesh, using Sentinel 2 and field inventory data from 40 homesteads in eight villages. An unsupervised classification method was followed to assess homegardens’ tree coverage. We found a high tree coverage (24.34% of total area of Dighalia) in homesteads, with a high overall accuracy of 96.52%. The biomass and soil organic carbon (p < 0.05) varied significantly among the eight villages, while total carbon stock did not vary significantly (p > 0.05). Shannon diversity had both direct and indirect effects on biomass carbon, upper layer soil organic carbon and total carbon storage, while basal area mediated the indirect effect. Both basal area and tree height had positive effects on biomass carbon and total carbon storage, with basal area having the strongest effect. These findings suggest that we must maintain higher diversity and tree height in order to maximize and sustain carbon storage, where tree diversity increases stand basal area and improves total carbon storage (including soil organic) in homegardens. Therefore, privately managed homegardens could be a potential nature-based solution for biodiversity conservation and climate change mitigation in Bangladesh.

1. Introduction

Nature-based solutions are one of the best strategies for adapting to global climate change and biodiversity loss [1]. To combat global warming, world leaders committed in the Paris Agreement to keep atmospheric temperature below 2 °C by end of the century [2]. Each signatory country to the Paris Agreement has pledged to cut a part of its greenhouse gas emissions by 2030 [2]. Under the framework of Nationally Determined Contributions (NDCs), each country is meeting their obligation by lowering either low carbon sectors (transport, industry, power, etc.) or by increasing forestry activities (afforestation or restoration) [3]. Homegardens, a sustainable and integrated agroforestry system in tropical and subtropical countries, has huge carbon sequestration potential [4,5]. This climate regulatory role of homegardens can be a potential NDC component for many countries in meeting its carbon emission commitment [3].
Sustainably managed lands that have the ability to supply food and other domestic products to conserve biodiversity and regulate climate are of high demand in the current changing climate [6]. Homegardens are a tiny piece of land just in and around the homestead in rural areas of the tropical and subtropical regions. This unique type of agroforestry system provides multiple ecosystem services over the year to members of the household [7]. It is an intensive cropping system of domesticated annual and perennial plants and/or animals, which are the primary source of household demand, such as food, fruits, fodder, fuel wood and furniture [7,8]. Different coexisting species of trees, shrubs and herbs in homegardens with vertical differentiation make this traditional agroforestry system a forest-like structure [7]. Within human-dominated landscapes, homegardens are considered as highly biodiverse agroforestry systems which play an important role in biodiversity conservation and carbon sequestration [4].
Studies on homegardens’ carbon storage have shown a high capacity for minimizing atmospheric carbon through photosynthesis compared to other agroforestry systems [4,9,10]. Findings on homegardens carbon stocks have revealed that aboveground carbon is mainly contributed by tree and palm species in homegardens, and that soil carbon occupies the largest percentage of the total carbon stored in homegardens [9]. Homegardens with high species diversity and stem density lead to a more basal area and biomass (above and below ground), and therefore, they store more biomass and soil carbon compared to homegardens with less species density and stem density [5,11,12]. In the forest ecosystem, the positive role of species diversity in carbon storage is underpinned by the niche complementarity hypothesis, which believes that higher numbers of species in a stand with greater trait variation have used more resources, and therefore, store more carbon [13]. Some studies have, however, documented no particular relationship between species diversity and carbon stock, which can be explained by selection effect. The selection effect believes that among the coexisting species, the most dominant species with its key traits such as size vigor (height and diameter) regulates carbon storage [12]. Both of these hypotheses can be a driver for homegarden agroforestry carbon regulation, because it is a multi-storied-species landscape. Furthermore, inconsistent results of species diversity and carbon storage relationships have also been reported in different studies in agroforestry systems [5,14]. Thus, for understanding the species diversity and carbon storage and their relationship in a specific study area, we need to conduct direct field investigations.
Bangladesh committed to the Paris Agreement to reduce its greenhouse gas emission from power, transport and industry sectors with an equivalent to 12 Mt CO2e by 2030, which is 5% below the total business as usual emission level from those sectors. However, Bangladesh is a country of villages where almost every household has a homegarden, which are well-established land use systems [7]. A recent study reported that the total tree coverage in non-forest area is about 4.5 million ha, where homegardens have dominant contributions [15]. The homegardens in Bangladesh are biologically diverse and most of the studies on homegardens in Bangladesh remained descriptive on the floristic characteristics, structure, uses and the relation between household and homegarden characters [7,16]. Homegardens in Bangladesh can be a potential component of NDCs, similar to other developing countries. However, few studies focused on the total carbon storage capacity and carbon and biodiversity relationship in Bangladesh [17,18]. This knowledge gap in homegardens agroforestry system in Bangladesh might be one of the most important reasons for excluding agroforestry as a key NDCs component by policy makers, despite its huge coverage and high potential for climate change mitigation.
In this study, we assessed homegarden tree coverage, stand structure, species diversity and carbon storage in southwestern Bangladesh. We set three specific objectives in this study. First, to assess the total tree coverage in homesteads of Dighalia upazila (administrative unit) in the Khulna district, Bangladesh by using Sentinel 2 imagery. Second, to quantify the direct and indirect effects of species diversity on biomass and soil organic carbon stocks through different stand structures in homegardens. Third, to examine how results in line with carbon emission targets have contributed to homegardens’ management system.

2. Materials and Methods
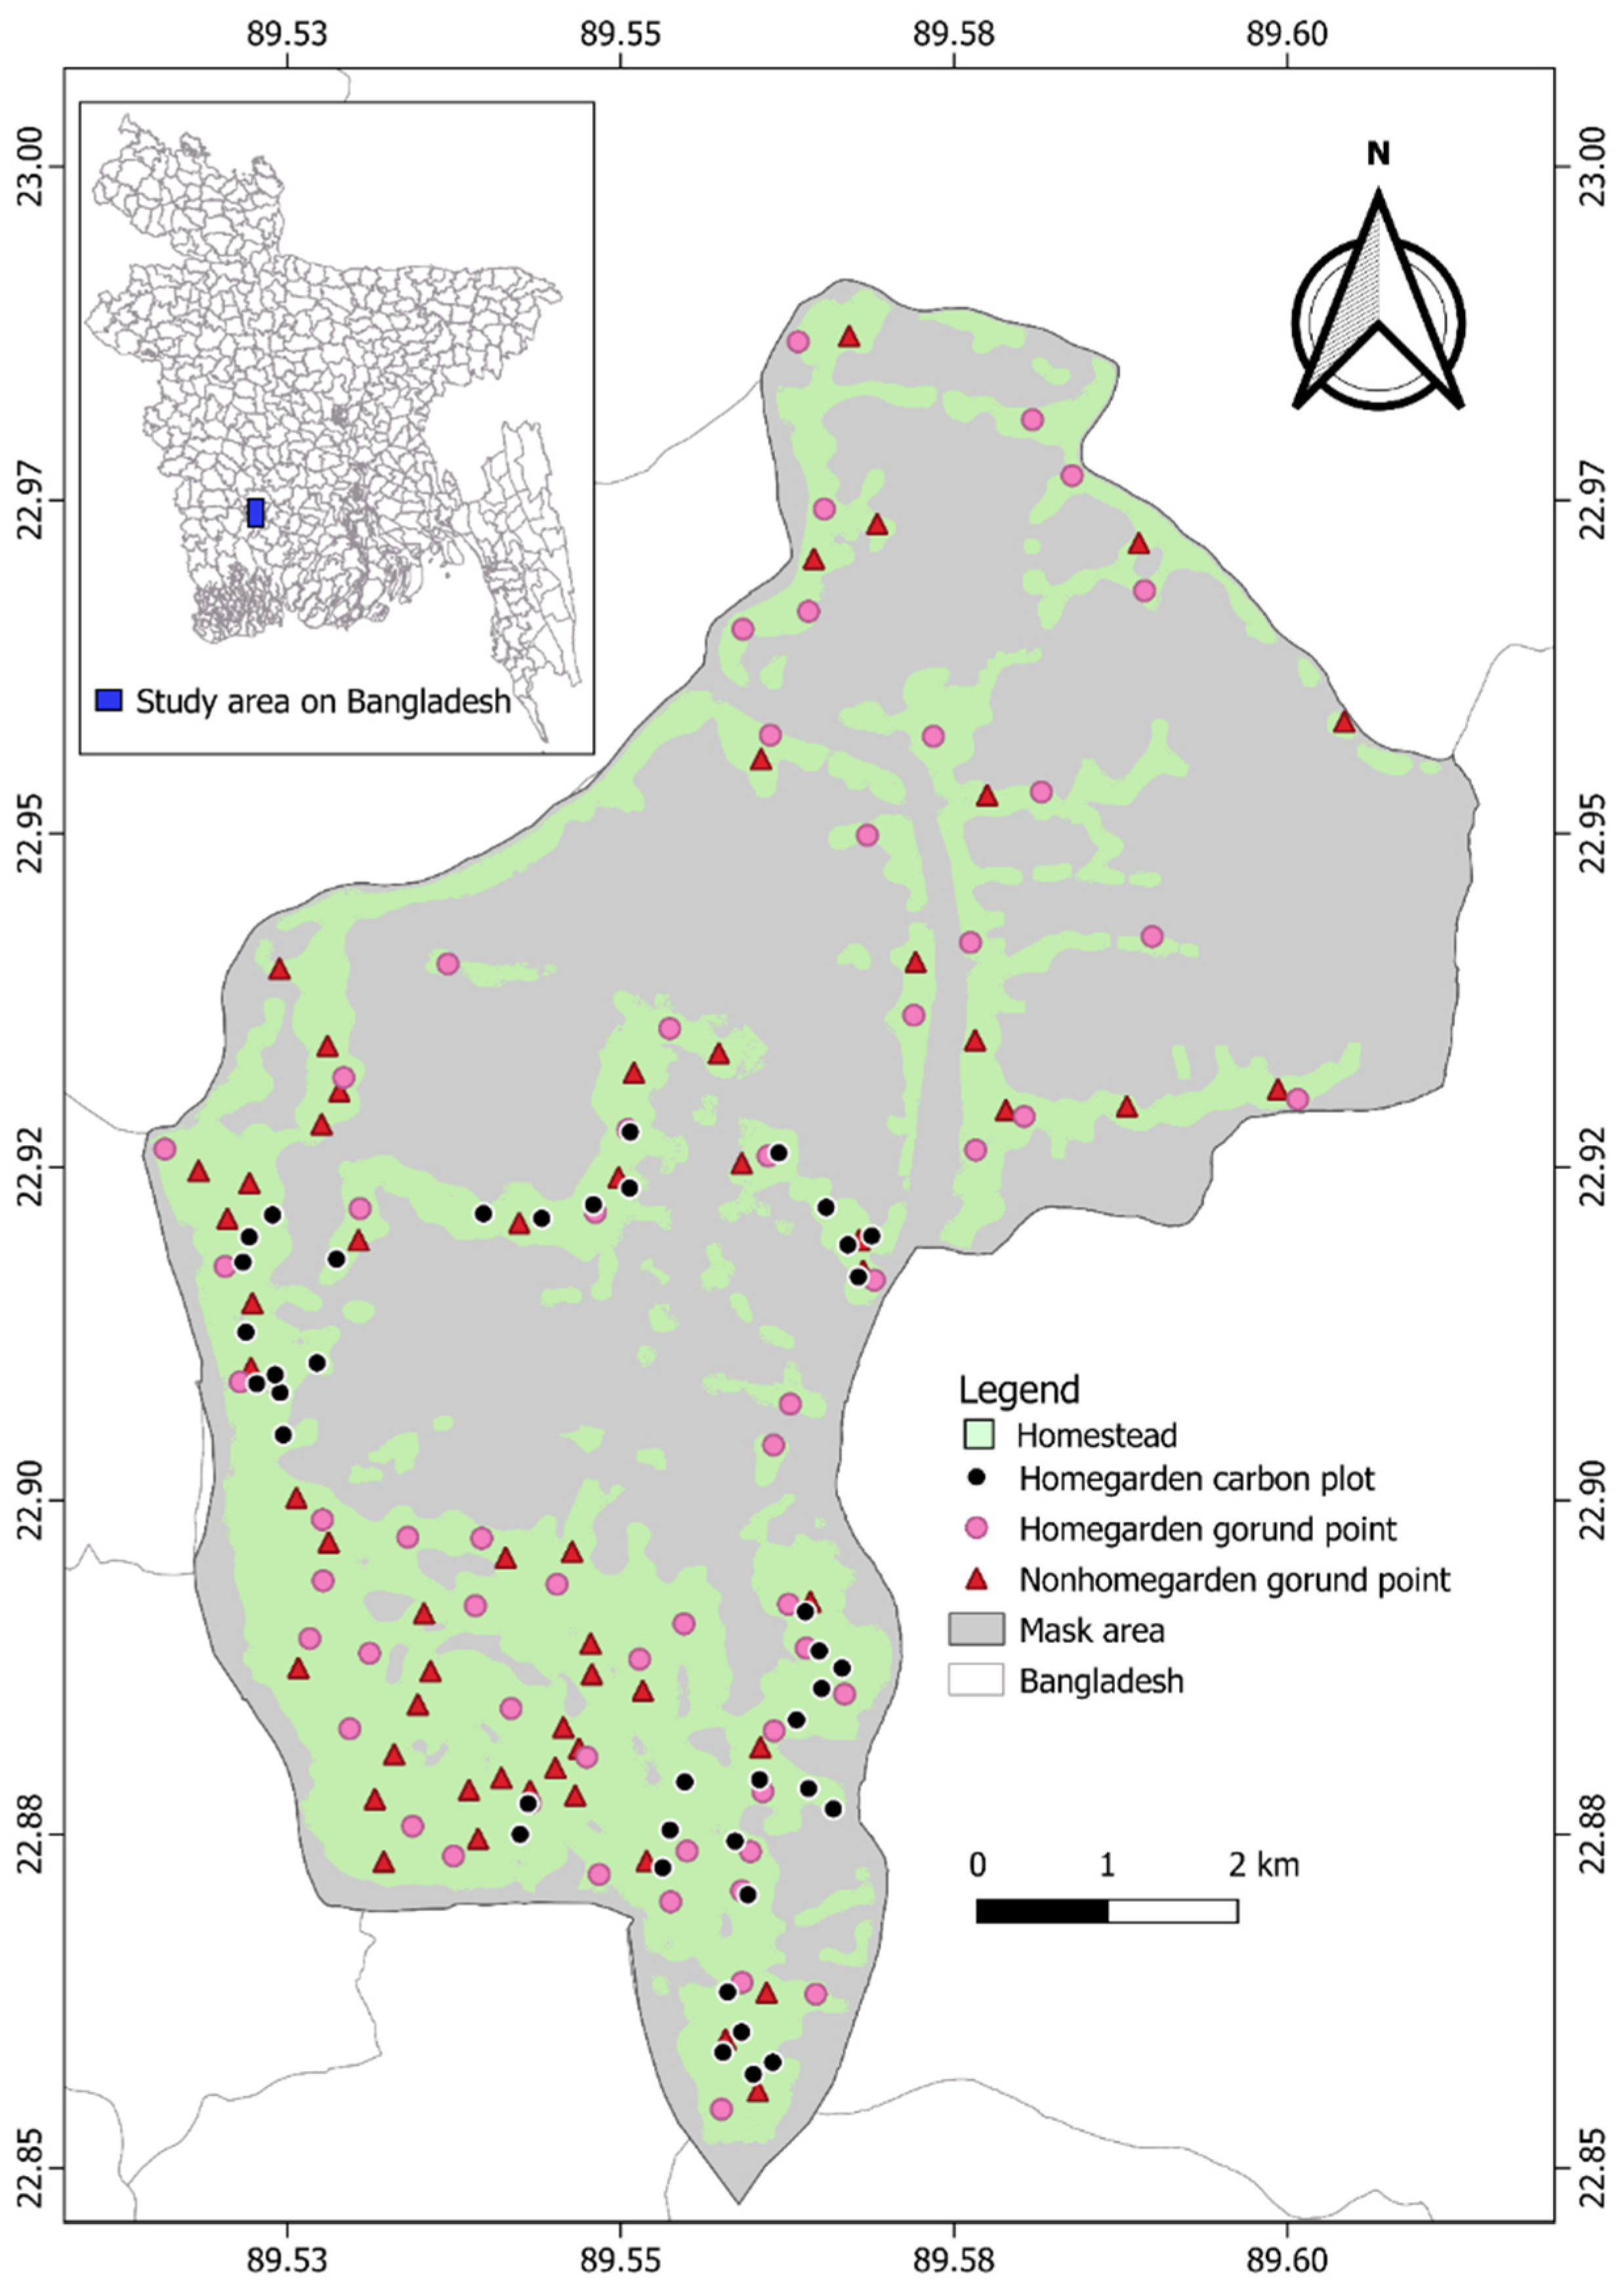
2.1. Study Site

The study was conducted in Dighalia Upazilla (administrative unit) in the Khulna district of Bangladesh (Figure 1). Dighalia Upazilla is located in the southwestern part of Bangladesh. The study area is primarily a flood plain land mass between 22.50° to 22.60° N latitude and 89.31° to 89.37° E longitude. The deltaic landscape of this region is mainly low (<10 m above average sea level), flat and fertile [19]. The average area of the homegarden over the study site is 0.05 ha and rich in biodiversity [19]. It generally enjoys a tropical to subtropical monsoon climate with an average annual temperature of 26 °C. January is the coolest month (average temperature: 12.4 °C), while April is the hottest month (average temperature: 34.6 °C) in this region. The average annual rainfall for this region is 1986 mm (range: 1400–2600 mm). This upazila is enclosed by three main rivers, i.e., the Bhairab, Citra and Naboganga, and is adjacent to Khulna City, the largest city in southwestern Bangladesh [20].

2.2. Sampling Design and Field Inventory

A multi-stage random sampling procedure was followed to select homegardens. First, two unions (smallest administrative unit), namely Senhati and Barakpur, from the total of six unions of Dighalia Upazila were selected randomly. Then, eight villages were selected randomly from the two randomly selected unions (four villages from each union). A total of 40 plots of 10 × 10 m (five from each randomly selected village) were taken purposively (homestead with homegarden), as shown in Figure 1. We measured the diameter at breast height (DBH) and canopy height of all species with a DBH ≥ 3 cm. All species in each sampled plot were identified and recorded to species level or by local name and were later confirmed from an authentic source [19]. We collected soil samples for soil organic carbon assessment from the center of each plot. We pulled out soil cores using an open face peat augur. From the soil core, we took a total of 80 (40 homegardens × 1–plot × 2 depths) soil samples; two from each plot using a five-centimeter-long steel core at the midpoint of 0–15 cm depth and 15–30 cm depth. All samples were air-dried and analyzed for estimating bulk density and soil organic carbon. We analyzed all the soil samples at the Nutrient Dynamics Laboratory of Khulna University, Bangladesh.

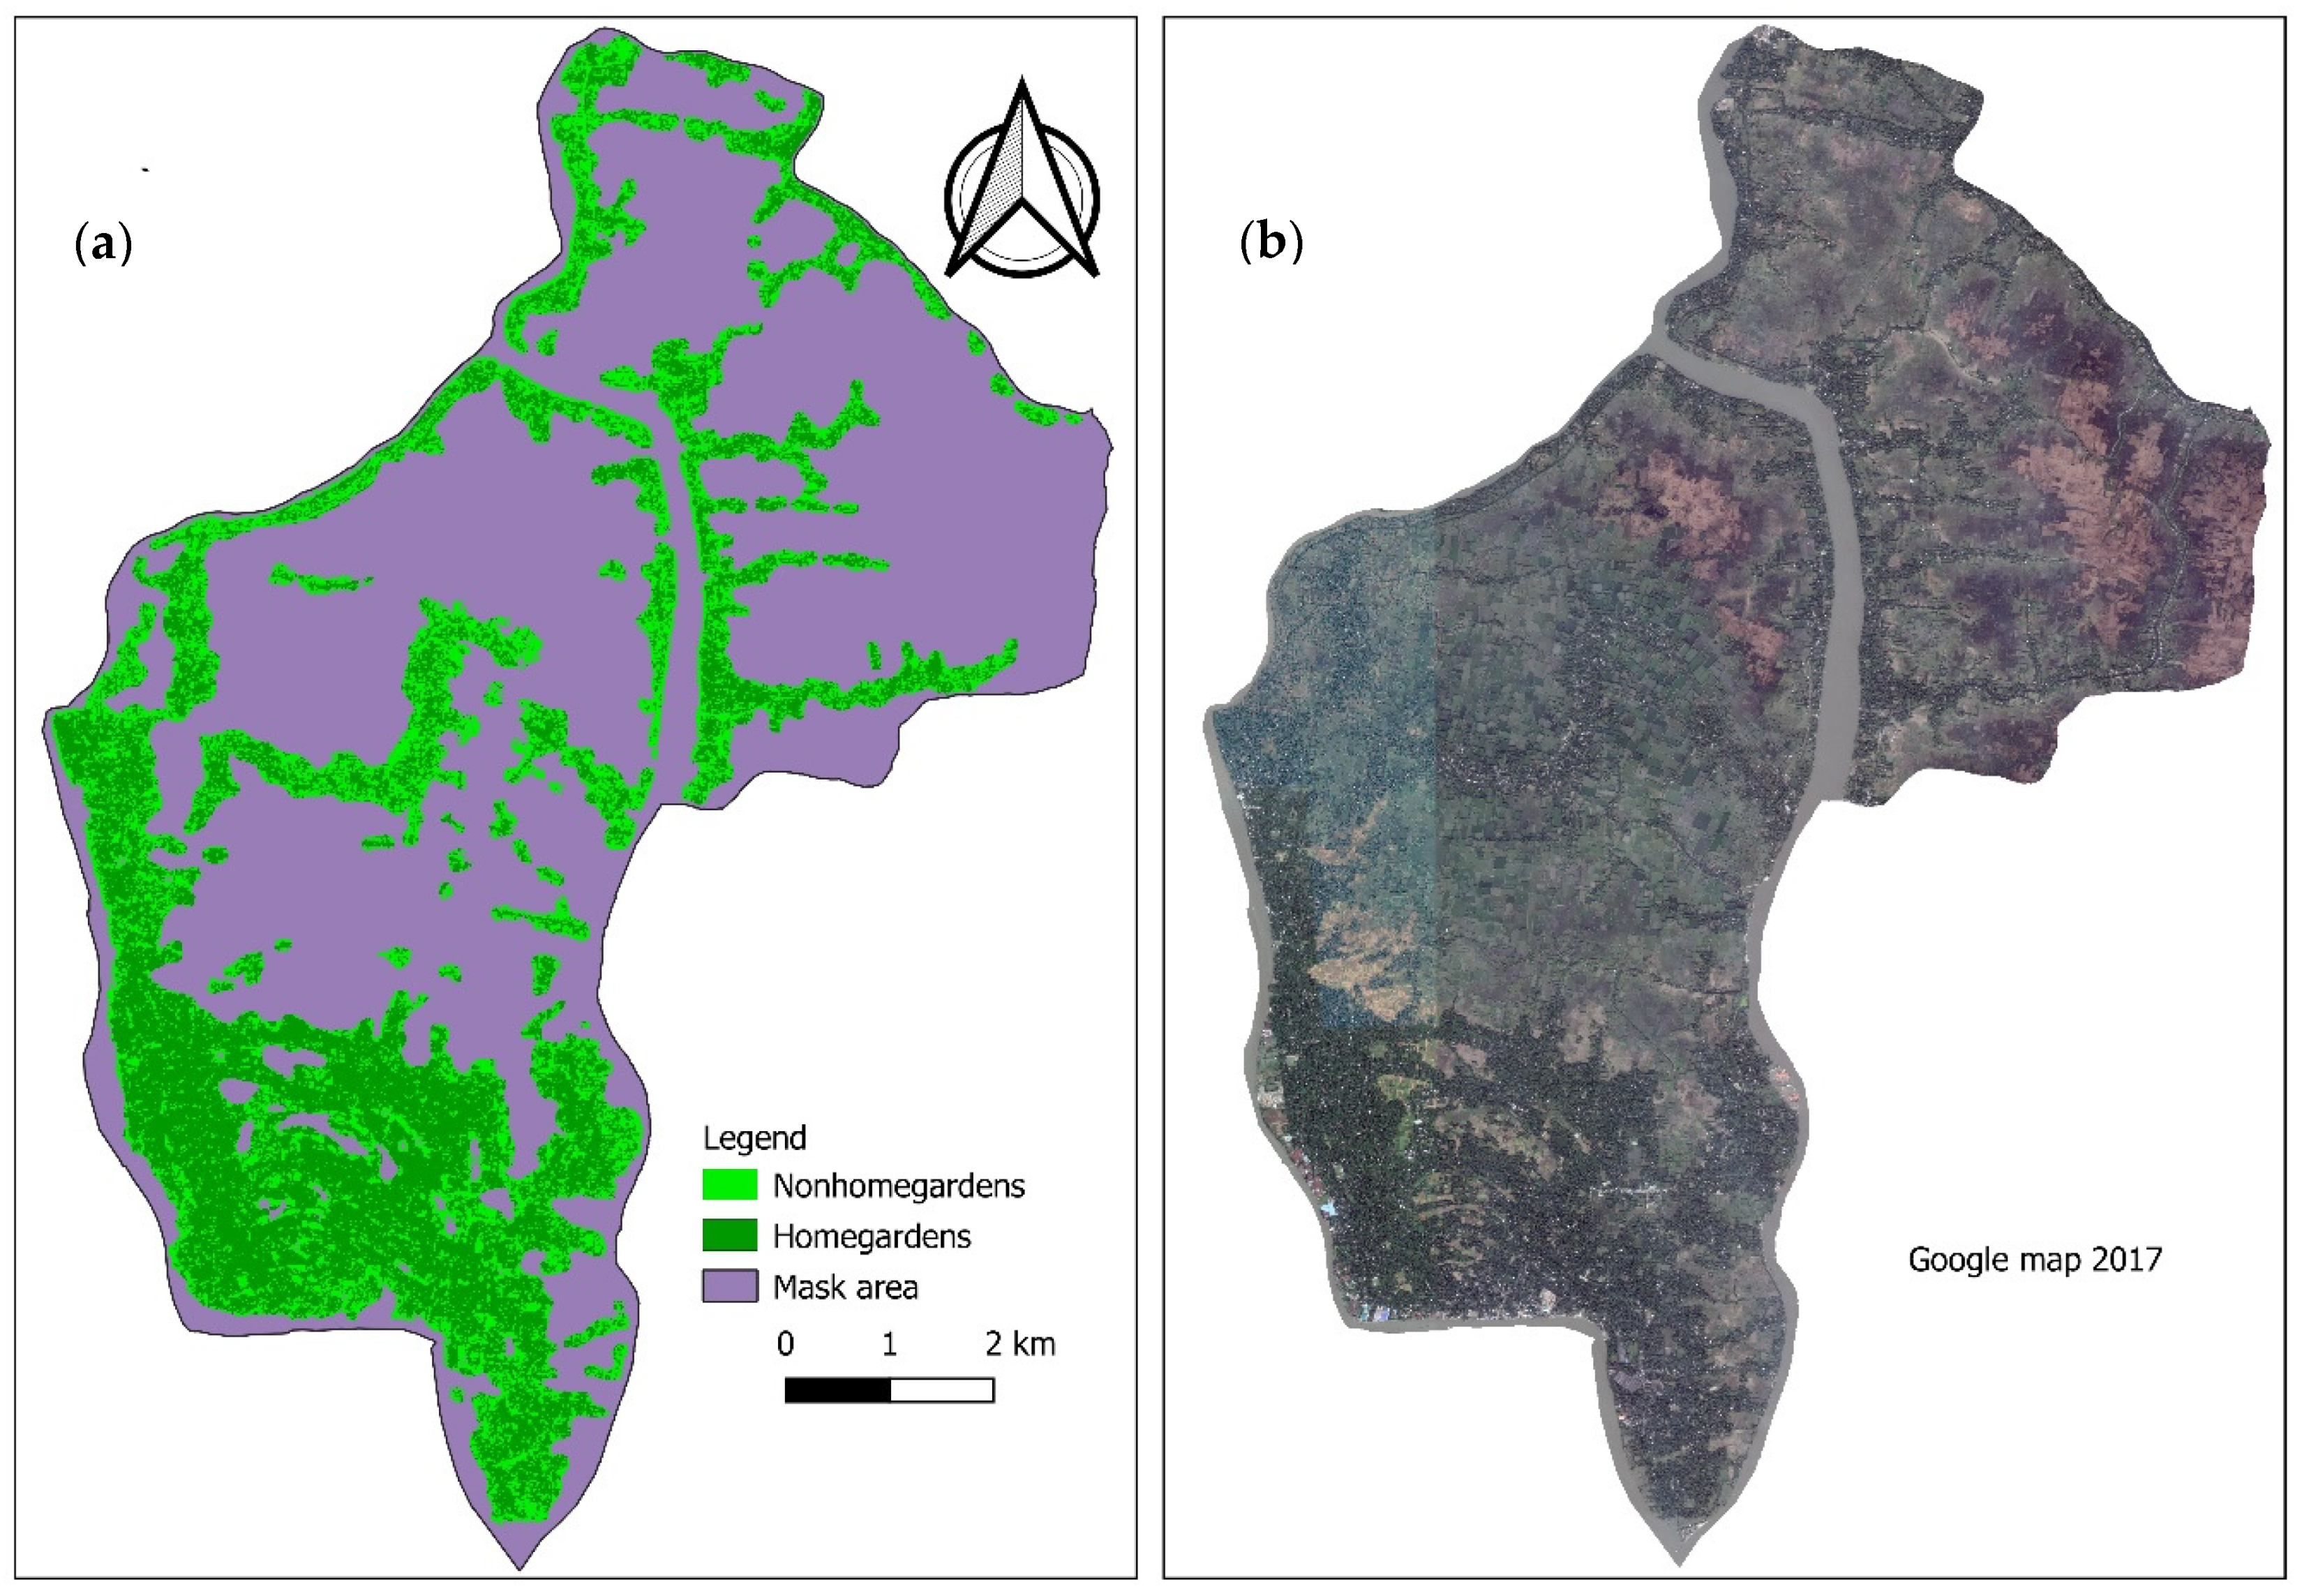
2.3. Remote Sensing Data and Processing

Sentinel -2 satellite image that was acquired in 13 December 2016 was used in this study for assessing the vegetation coverage. The Level-1C product of Sentinel 2 is a version of Top-Of-Atmosphere reflectance image, which is radiometrically and geometrically corrected. Sentinel 2 is a multispectral imager launched on 23 June 2015 by the European Space Agency, which has 13 bands of different resolutions (10–60 m) [21]. In this study, we used the 10 m resolution bands (Red and Near Infrared) for the Normalized Difference Vegetation Index (NDVI). We masked non-homestead areas (water body, crop field and fishpond) in order to distinguish rural settlement with homesteads. Then, we applied an ISODATA algorithm, an iteration method that collapses clusters of similar groups into one by measuring the Euclidean distance between the cluster centers [22,23]. We set the number of classes in the classification to 10, the total class size to 10 and the sample interval to 2. Using Google Earth visual interpretation and field data, we assigned homegardens and non-homegardens classes (houses, paddy fields, fish ponds, waterbodies and built-up areas) to the resultant one band image of ISODATA classification with 10 clusters [24]. We collected 115 points randomly from homegardens (59) and non-homegardens (56) within homestead areas (Figure 1) by using Google Earth visual interpretation for accuracy assessment of our classification result [23,24,25]. A confusion matrix was used for assessing the accuracy of our classification [25]. We used ENVI 5.00 and QGIS 3.14 for classification and mapping.

2.4. Data Analysis

2.4.1. Biomass Carbon

Common allometric equations were used (Table 1) to calculate the biomass [26,27], as it was developed from wide graphical (tropical countries) data and has diameter range (Table 1). The wood density data were obtained from the Global Wood Density Database [28]. For species with missing wood density in this database, we used the average wood density. Biomass carbon was calculated by multiplying 0.5, as it is assumed that wood biomass contains 50% carbon [28].

2.4.2. Soil Carbon Calculation

Soil carbon storage was estimated by the product of soil organic carbon concentration, soil bulk density and soil depth range. Soil bulk density was determined for each soil layer by dividing the oven-dried soil sample mass by the volume of the sample (Equation (1)) [30]:
B u l k   D e n s i t y = ( W t 105 ° C ) V c o r e V c o r e = ( π D c o r e 2 L core ) 4
where Wt105°C is the weight of oven dried soil, Vcore is the volume of the core, Dcore is the inner diameter of the core and Lcore is the length of the core.
The Loss of Ignition method was used for calculating soil organic matter [30]. Generally, soil organic matter contains 58% organic carbon [31]. Thus, we divided the organic matter by 1.724 (a universal conversion factor (called the van Bemmelen factor) for converting the soil organic carbon percentage [31].
After getting the soil bulk density and organic carbon percentage, we calculated the soil carbon stock for each layer using Equation (2):
Soil C (Mg ha−1) = bulk density (g m−3) × soil depth interval (m) × %OC × 0.01
where Soil depth interval = 0.15 for 0–15 cm depth and 15–30 cm depth, %OC is expressed as a decimal fraction (e.g., 5% is expressed as 0.05) and 0.01 is a conversion factor to convert units to Mg ha−1.

2.4.3. Total Carbon Stock

We calculated total carbon stocks (Equation (3)) per hectare by summing the biomass carbon stocks (aboveground and belowground biomass carbon) and soil organic carbon stocks (soil carbon, 0–15 cm and soil carbon, 15–30 cm):
Total C stock (Mg ha−1) = Biomass carbon(AGC + BGC) + TSOCSOC (0–15cm) + SOC (15–30)

2.4.4. Woody Species Diversity Calculation

The Shannon–Wiener index (H; Equation (4)) was used for species diversity [32], while for species richness, the Margalef index (D; Equation (5)) was used [33]:
H = i = 1 S ( P i × ln ( P i ) )
D = ( S 1 ) ln ( N )
where H is the Shannon diversity for a plot, S is the number of species (species richness), Pi is the proportional of individuals of species i in the plot, N is the total number of individuals in a plot and “ln” is the natural logarithm.
One-way analysis of variance (ANOVA) was used to test the significant difference of carbon pools across the eight villages and Duncan’s Multiple Range Test was used for multiple comparisons. Pearson’s correlation tests were performed using the “rstatix” package in R environment (Version 3.6.3) [34], to explore the correlation between stand structure, woody species diversity and carbon pools. Structural equation model (SEM) was used to quantify the direct and indirect effects of tree diversity on carbon pools through stand structure [35]. We used the Lavaan package for employing SEM in R environment (Version 3.6.3) [34]. As recommended, we log transformed and standardized all the covariables before applying the structural equation model. Multiple linear regression was used to quantify the variance inflation factors (VIF) with a threshold value of 2 and assuming that covariables having a value below this threshold have no multicollinearity [36]. In the final steps of the variance inflation factors test, mean tree height, basal area, stem density and Shannon diversity were retained (MDBH had a VIF value that exceeded the threshold value, Supplementary Table S1). Then, we employed SEM for quantifying the direct, indirect and total effect of the Shannon diversity on different carbon pools through stem density, canopy height and basal area. A total 14 SEMs were tested for seven carbon pools, where highly insignificant covariables were removed until the model satisfied fit statistics [37] (Supplementary Table S2). The indirect effects of Shannon diversity were assessed by the path value through its mediator to different carbon pools (response variable) [35]. We assessed the total effect of the Shannon diversity on a carbon pool by adding the direct and indirect effect through different mediators [35,37].

3. Results

3.1. Homegardens Cover

The spatial distribution of homegardens and non-homegardens based on the unsupervised classification of Sentinel 2 images in Dighalia Upazilla showed a good match with the Google Earth map (same year image as of Sentinel 2; Figure 2). Our classification separated homegardens and non-homegardens in homestead areas in Dighalia with a higher overall accuracy and kappa coefficient (overall accuracy = 96.52% and Kappa = 0.93; Table 2). The overall coverage of the homegardens was 17.32 km2 and the total percentage of homegardens in Dighalia was 24.34 (the total area of Dighalia is 71.16 km2).

3.2. Diversity and Stand Structure

The mean Shannon diversity, Margalef diversity and stand structures exhibited a spatial variation across the 40 plots (Table 3). The range of Shannon diversity was 1.91 to 3.01 with a mean of 2.56 ± 0.04 in the 40 plots (Table 3). The Margalef diversity index had a mean value of 2.31 ± 06 (range: 1.44–3.03). The estimated mean stem density, DBH, tree height and basal area were 1055.00 ± 35.62 treesha−1, 13.30 ± 0.49 cm, 7.88 ± 0.17 m and 13.76 ± 0.96 m2 ha−1, respectively, across the 40 sample plots (Table 3).

3.3. Carbon Stocks

High variations of above- and belowground biomass carbon were observed (aboveground: 45.01 ± 6.95 to 88.00 ± 6.39 Mg ha−1; belowground: 9.98 ± 1.36 to 18.11 ± 2.6 Mg ha−1). We found similar biomass carbon stocks in Senhati, Baracpur and Lakhoati villages, but these three villages have significantly lower biomass carbon than in the Chandani mahal village (p < 0.05; Table 4). However, the biomass carbon stocks in these four villages were not significantly different from the other four villages (p > 0.05). Overall, above- and belowground carbon stocks across the 40 plots in Dighalia were 60.42 ± 3.93 and 12.89 ± 0.75 Mg ha−1, respectively. Although the upper layer (0–15 cm) soil organic carbon stocks were insignificant across the different villages (p > 0.05; Table 4), the lower layer (15–30 cm) soil organic carbon stocks were found to be significantly different (p < 0.05; Table 4). In the Chandani mahal and Hagigram villages, soil organic carbon stocks at lower layers were significantly lower than at the Bativita village (p < 0.05; Table 4). Although we found a significant difference in biomass and lower layer soil organic carbon stocks, the differences in overall carbon stocks were insignificant across the villages (p > 0.05). The total carbon stock (biomass and soil carbon pools) in the eight villages ranged from 109.10 ± 10.89 Mg ha−1 (in Senhati) to 152.22 ± 10.15 Mg ha−1 (in Chandani mahal) with an overall average total carbon stock of 129.47 ± 5.10 Mg ha−1 (Table 4). The overall biomass carbon stock (73.31 ± 4.67 Mg ha−1) contributes 56.62 percent of the total carbon stock, while soil carbon (56.16 ± 1.71 Mg ha−1) contributes 43.38 percent of the total carbon stock. As we mapped the total area of homegardens and mean total carbon per hectare in Dighalia, we also assessed the total carbon stock in Dighalia by multiplying the mean carbon stocks by the total area. The total carbon stocks in Dighalia homegardens was 224,242.2 Mg C, which is equivalent to 822,968.29 Mg CO2.

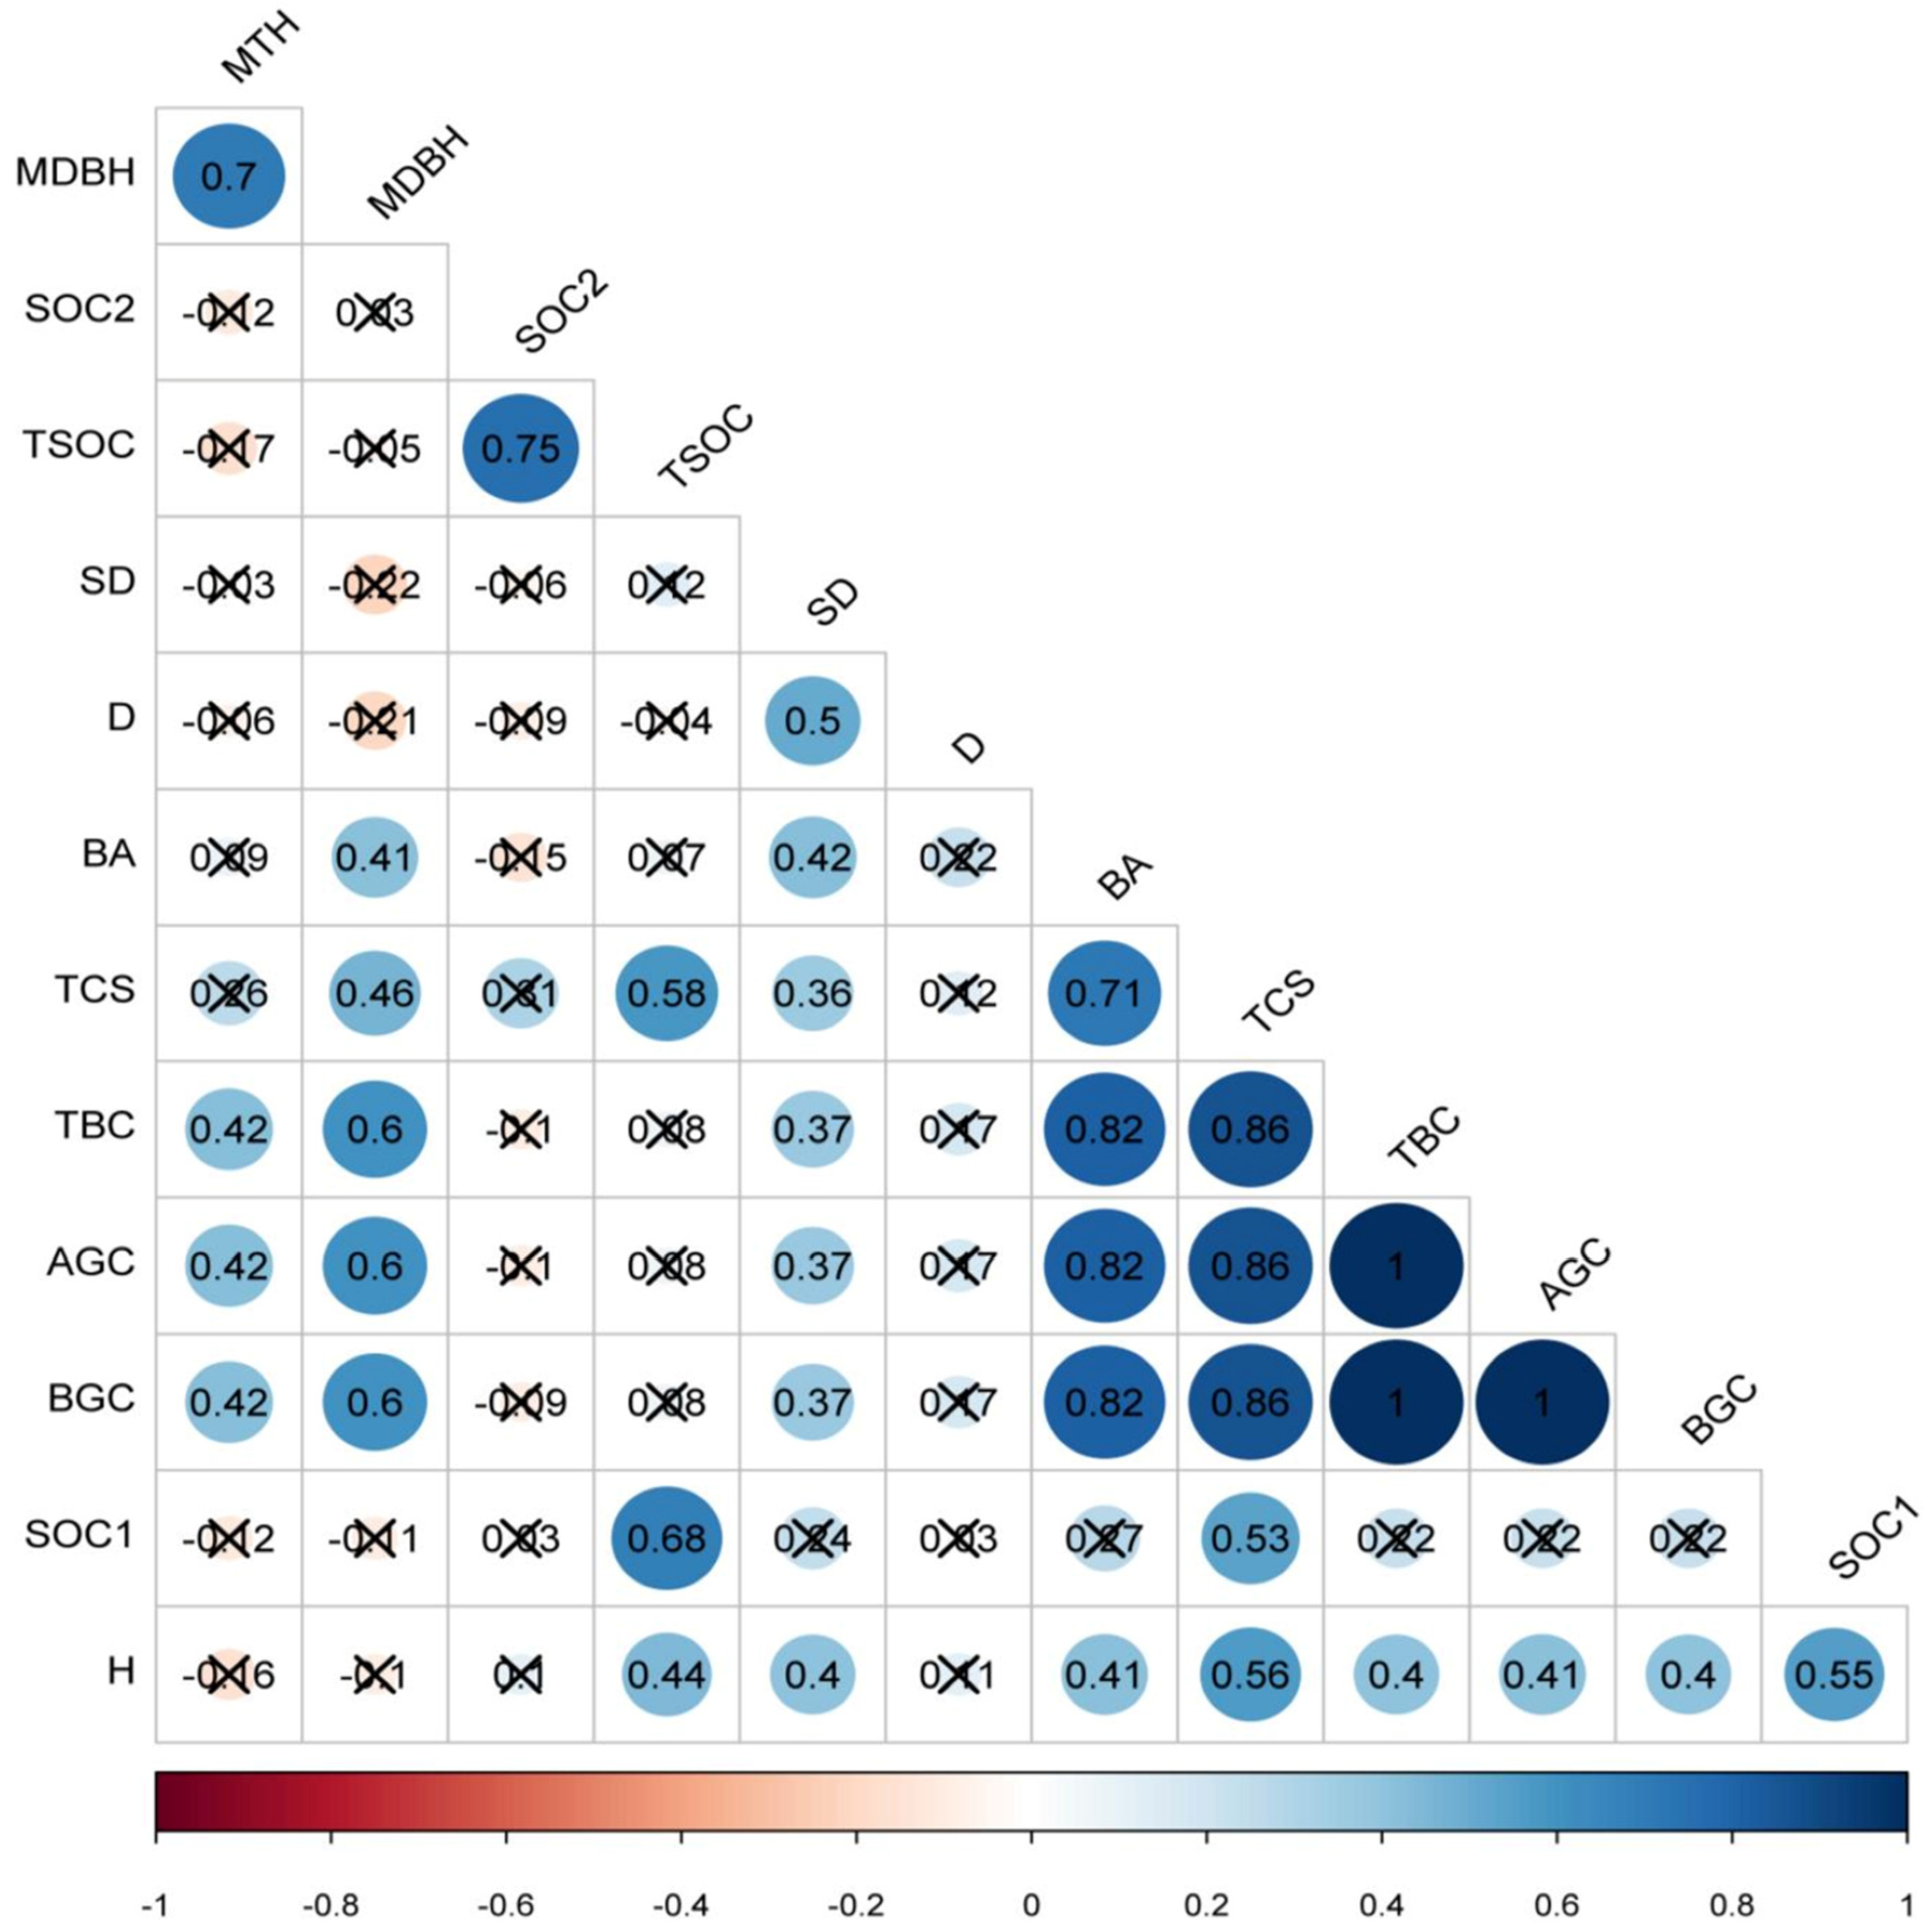
3.4. Bivariate Relationship between Stand Structure, Diversity and Carbon Pools

All four stand structure parameters were positively related to biomass carbon (aboveground and belowground), where basal area had a stronger relation compared to stem density, mean tree height and mean diameter (p < 0.05; Figure 3). However, these four-stand structure parameters had no significant relation with any of the soil organic carbon layers (p > 0.05; Figure 3). When we considered all the carbon pools together as total mean carbon stocks, all four stand structure parameters except mean tree height had a significant relation and basal area also had a stronger relation (p < 0.05, Figure 3). Shannon diversity index also had positive effects on all carbon pools (except lower layer soil organic carbon; p > 0.05; Figure 3) and total carbon stocks as well as stem density and basal area (p < 0.05; Figure 3).

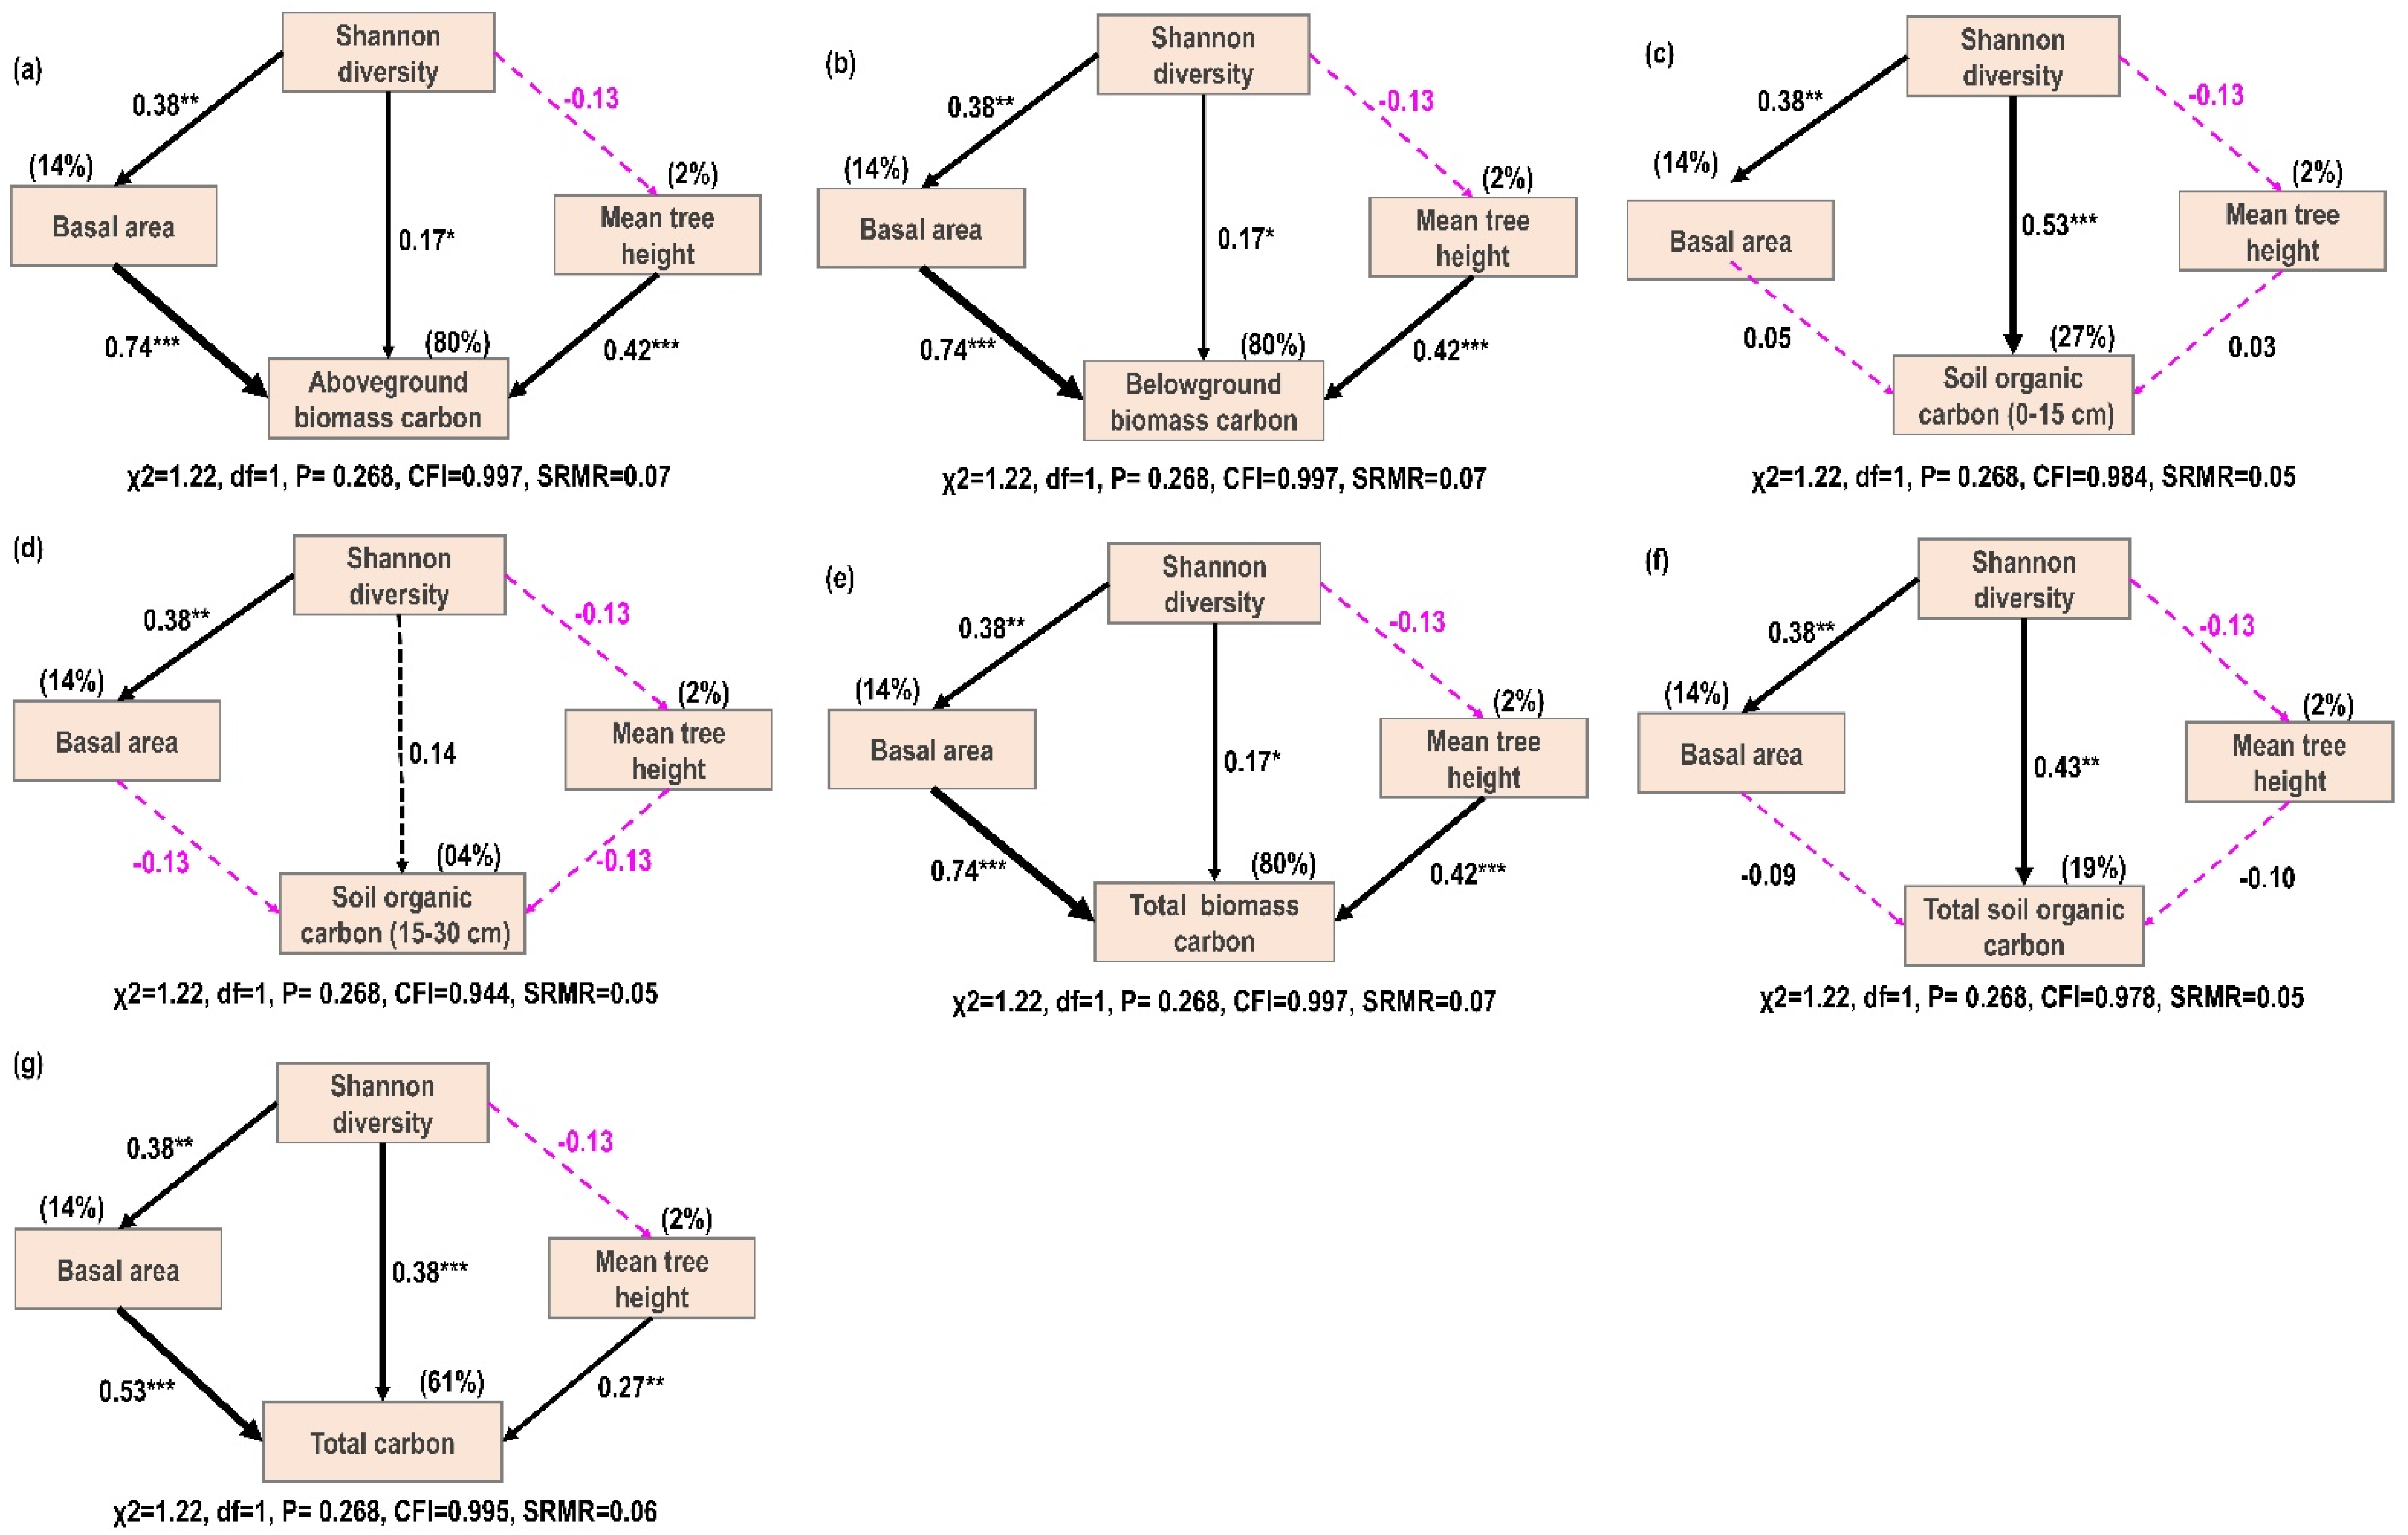
3.5. Direct, Indirect and Total Effects of Biodiversity and Stand Structure on Carbon Pools

Shannon diversity had significant direct and indirect effects on aboveground biomass carbon, belowground biomass carbon total biomass carbon, and total carbon storage, but had only direct effects on the upper layer soil organic carbon and total soil organic carbon (Figure 4a–g). The basal area only significantly mediated the Shannon diversity effect on biomass carbon (above- and belowground) and total carbon stocks (Figure 4a,b,e,g). Basal area had the strongest direct effect on biomass and total carbon storage (Figure 4a,b,e,g), while Shannon diversity had the strongest effect on upper layer and total soil organic carbon storage (Figure 4c,f). Tree height also had positive effects on biomass carbon and total carbon storage (Figure 4a,b,e,g). As the Shannon diversity has indirect effects on the biomass and total carbon storage and, which were mediated by the basal area, the total effect of the Shannon diversity on the aboveground biomass carbon, belowground biomass carbon, total biomass carbon and total carbon storage were 0.393, 0.393, 0.513, 0.393, 0.411 and 0.544, respectively (Table 5). The Shannon diversity, basal area and mean tree height together explained 80%, 80%, 27%, 04%, 80%, 19% and 61% ariations in aboveground biomass carbon, belowground biomass carbon, upper layer soil organic carbon, total biomass carbon, total soil organic carbon and total carbon storage in homegardens, respectively (Figure 4a–g).

4. Discussion

Homegardens’ agroforestry system is rich in biodiversity in the tropics and provides a variety of ecosystem services, including carbon sequestration. We quantified homegardens’ agroforestry vegetation coverage and the direct and mediation effects of tree diversity on carbon storage via stand structure in Dighalia, Khulna, Bangladesh. We found that homegardens had high vegetation coverage and carbon stocks where tree diversity promotes carbon storage directly and indirectly through basal area. The stand basal area had a stronger effect on carbon storage than other stand structural parameters.

4.1. Homegardens Vegetation Coverage

We found a high vegetation coverage (as homegardens) in homesteads, which accounted for 24% of the total area of Dighalia Upazila. Two recent studies reported that the percentage of tree coverage outside forests (woodlots, homegardens and other plantations) in Bangladesh is 13.01 (1,920,700 ha/country area) by Landsat Satellite with 30 m × 30 m pixel [38] and 15.1% by Sentinel 1 and 2 with 10 m × 10 m pixel [15]). While the other two studies focus on all types of trees outside forests, we focused only on the homegardens that were found in villages, which play a key role in biodiversity conservation and carbon sequestration. The difference in percentage of tree coverage in our study could be due to the spatial resolution of satellite data and the specific types of trees outside forests. The forest area percentage within the total land area is one of the key indicators of the Sustainable Development Goals (15.1.1), Achi biodiversity targets of the convention on biological diversity (Target 5; related to forest coverage or extent) and a key activity data for estimating countries’ emission factor [6]. Higher accuracy in the estimation of homegardens’ coverage with high-resolution imagery (Sentinel 2 10 m band), thus, contributes to assessing the accurate uncertainty in the carbon emission factor.

4.2. Stand Structure

Forest stand structures (tree height, DBH, stand density and basal area) are the key indicators of growth and productivity modeling, and recently, the stand level means of these parameters have been used in stand level biomass carbon modeling [39]. Higher amounts of those parameters at the stand level reveals standing resources and, thereby, growth and biomass carbon stocks [18,39]. The mean stem density in our study (1055.00 ± 35.62 trees ha−1) was very high compared with the natural forests in the Chittagong Hill Tracts (South) Forest Division (381 trees ha−1; Nath et al., 1998) in the Chunati Wildlife Sanctuary, Cox’s Bazar (459 trees ha−1) [40]. Higher stem density is also reported in homegardens in Ethiopia (1125.23 ± 334.6) [41]. Homegardens are an intensive land use system, where low planting space is being maintained, which may be the cause of the higher stem density in homegardens compared to natural and secondary forests in Bangladesh. These traditional homegardens with high stem density, thus, play a major role in meeting the timber demand in a sustainable manner while reducing pressure on natural forests [7,18].

4.3. Carbon Stocks

We found a high carbon stock in the studied homegardens, which indicates a huge potential for homegardens to mitigate climate change through sequestering atmospheric CO2. The total average carbon stock in our study (129.47 ± 5.10 Mg ha−1; biomass + soil 0–30 cm) was within the range of total carbon stocks in Ethiopian homegardens (91.75 ± 4.31 to 156.17 ± 13.78 Mg ha−1) [14], but higher than Indonesian homegardens (107 Mg ha−1) [9]. Our result was also higher than that of other agroforestry system’s carbon stocks, such as agroforest (120 Mg ha−1; soil carbon at 40 cm only) in Panama and traditional agroforestry systems (14–70.08 Mg ha−1) in Mali [42]. The variations in total carbon stocks in different studies are mainly due to the difference in biomass and soil carbon pools that depend on higher stem density, basal area and tree size (height; Table 4 and Figure 3) as well as homestead age [9,11]. For example, in our study, the stem density (1055 stem/ha) in homegardens was higher than that of Indonesian homegardens (624.4 stem/ha). Our findings also showed that across villages, some had higher biomass carbon and lower soil carbon stocks than other villages and vice versa, where the biomass carbon varies mainly due to the difference in mean stem density, basal area and canopy height (Table 3; Figure 3). The positive correlation between these stand structures and different carbon pools indicates that high carbon storage is present in homegardens, and thus, villages are associated with higher stand structure (Figure 3).

4.4. Effects of Tree Diversity and Stand Structure on Carbon Pools

Dealing with two major challenges, climate change mitigation and biodiversity loss under the same management program is more noteworthy than addressing these two separately [43]. In order to practice this type of management, we need to show the evidence that species diversity and carbon storage are positively linked. However, conflicting results (positive, negative or neutral) in different ecosystems (or forest types), sparked debate among scientists and posed a barrier to the adoption of a unified management plan [5,11,18,44]. In our study, we found that tree diversity (Shannon) promotes all carbon pools (except for lower layer soil organic carbon) including total carbon stock (Figure 3 and Figure 4). Tree diversity also had a mediation effect on all carbon pools (except soil organic carbon) through increasing stand basal area. These findings indicate that homegardens associated with high diversity had higher carbon stocks. Our result, therefore, supports the complimentary niche hypothesis which believes that higher niche differences between coexisting species can promote more efficient resource acquisition, leading to higher productivity and higher carbon stocks. The basal area and tree height are both good indicators of biomass and productivity, and hence, carbon storage, at the stand level [18,39,45]. Both of these stand structural features had a positive influence on biomass and total carbon storage in homegardens, according to bivariate relationships and subsequently verified by structural equation models, with the basal area having the strongest effect (Figure 3 and Figure 4a,b,e,g). As a result, in order to maximize and sustain both above- and belowground carbon storage (including soil organic) in homegardens, we must maintain higher diversity and stand tree height, where tree diversity increases stand basal area and improves total carbon storage in homegardens. Recent studies in tropical forests have shown that that both selection and complementarity directed the biomass carbon stock together [13]. Potential work should consider different components of diversity, e.g., species richness, functional trait diversity and functional trait composition, to investigate the mechanism between diversity and carbon relationship in homegardens.

4.5. Implication for Nationally Determined Contributions

Agricultural activities are among the main sources of carbon emissions in developing countries. Integrated agroforestry systems, however, are considered to be sustainable land-use systems, such as traditional homegardens, which can be a crucial tool for achieving carbon mitigation goals because it has high potential for sequestering atmospheric carbon. Nevertheless, some countries have not included homegardens as possible NDCs, such as Bangladesh, whose homegardens coverage is so rich. Here, we showed that in the Digholia sub-district, each village had high tree coverage (Figure 2) with high diversity (Table 3) and carbon storage (Table 4). In its initial forest reference level, homegardens have not been listed as forests by the FAO (Food and Agricultural Organization) definition in Bangladesh. Nevertheless, our study shows that both tree coverage (24%) and mean tree canopy height (7.87 m) in homegardens within homesteads satisfied the forest definition by the UNFCCC (United Nations Framework Convention on Climate Change; tree cover: 10–30%; Canopy height: 2–5 m) [46]. Through considering many homegardens as a unit, we can view it as continuous forests (Figure 2). Therefore, homegardens also follow the concept of minimum area of land (0.05–1.0 ha) [42]. Thus, districts with homegardens in Bangladesh satisfy the requirements of REDD+ or the IPCC (Intergovernmental Panel on Climate Change) definition of forests, which has been used in other forest-based mitigation alternatives such as the clean development mechanism (CDM). Nonetheless, since homegardens are not currently included in the REDD+ scheme, we should explicitly enlist homegardens as a choice for prospective NDCs (although a large-scale study is needed in other districts of Bangladesh). Therefore, by setting up a Village Forestry Committee or a group (composed of several homegardens owner), we can manage it like community-based forestry program [18], e.g., social forestry (managed by the Social Forestry Committee with Gender Equity under direct oversight of the Forestry Department of Bangladesh). In this way, it can retain some of the contributions to the Government’s climate change adaptation and mitigation measures promised by the Paris Agreement (NDCs; 5% reduction in greenhouse gas emissions by 2030).

5. Conclusions

In this study, we assessed the tree coverage and direct and indirect effects of tree diversity on carbon storage through stand structure in homestead agroforestry systems (homegardens) in Dighalia, using both remote-sensing and field data. Remote sensing-based tree coverage and consistency of extent of homegardens and field-based canopy height met the forest definition as per IPCC or UNFCCC protocol. High tree diversity with a higher stand structure and carbon storage both above- and belowground indicates that homegardens in Bangladesh play a key role in the conservation of biodiversity and climate change mitigation. We also found that tree diversity promotes carbon storage directly and indirectly via basal area. Therefore, we suggest that for maximizing and sustaining carbon storage, we need to maintain diverse tree species which would lead to a higher stand basal area and, hence, high carbon storage in homegardens. In this way, districts with high homegardens in Bangladesh could contribute to mitigating carbon emissions, and thereby, be a prospective choice (as an agroforestry system) for the NDC.

Supplementary Materials

The following are available online at https://www.mdpi.com/article/10.3390/f12121661/s1, Table S1: Result of multicollinearity test of different covariates using variance inflation factors analysis. Table S2: Fit statistics of the rejected and accepted structural equation models for predicting different carbon pools in combination of plant diversity and stand structure.

Author Contributions

Conceptualization, M.M.R. and G.K.K.; methodology, M.M.R. and G.K.K.; software, M.M.R.; formal analysis, M.M.R. and G.K.K.; investigation, G.K.K. and H.A.; writing—original draft preparation, M.M.R. and G.K.K.; writing—review and editing, M.M.R. and M.E.K.; visualization, M.M.R.; supervision, M.E.K. and M.X.; funding acquisition, G.K.K. and M.M.R. All authors have read and agreed to the published version of the manuscript.

Funding

Gauranga Kundu provided funding for field data collection and soil organic carbon assessment. This research was also supported by the National Key Research and Development Program of China (2017YFA0604300, 2018YFA0606500).

Institutional Review Board Statement

Not applicable.

Informed Consent Statement

Not applicable.

Data Availability Statement

Data analyzed in this manuscript will be provided by the corresponding author upon reasonable request.

Acknowledgments

We would like to thank Mahmood Hossain, of Khulna University, Khulna, Bangladesh, for providing laboratory support in Nutrient Dynamic Lab. We want to acknowledge the European Space Agency for providing the image data. We also want to thank Steven Xu from the Johns Hopkins University for improving the English writing of the paper.

Conflicts of Interest

The authors declare no conflict of interest.

References

  1. Fargione, J.E.; Bassett, S.; Boucher, T.; Bridgham, S.D.; Conant, R.T.; Cook-Patton, S.C.; Ellis, P.W.; Falcucci, A.; Fourqurean, J.W.; Gopalakrishna, T.; et al. Natural climate solutions for the United States. Sci. Adv. 2018, 4, eaat1869. [Google Scholar] [CrossRef] [Green Version]
  2. Gao, Y.; Gao, X.; Zhang, X. The 2 °C Global Temperature Target and the Evolution of the Long-Term Goal of Addressing Climate Change—From the United Nations Framework Convention on Climate Change to the Paris Agreement. Engineering 2017, 3, 272–278. [Google Scholar] [CrossRef]
  3. Duguma, L.A.; Nzyoka, J.; Minang, P.A.; Bernard, F. How agroforestry propels achievement of nationally determined contributions. ICRAF Policy Br. 2017, 34, 1–8. [Google Scholar]
  4. Nair, P.K.R.; Kumar, B.M.; Nair, V.D. Agroforestry as a strategy for carbon sequestration. J. Plant Nutr. Soil Sci. 2009, 172, 10–23. [Google Scholar] [CrossRef]
  5. Kirby, K.R.; Potvin, C. Variation in carbon storage among tree species: Implications for the management of a small-scale carbon sink project. For. Ecol. Manag. 2007, 246, 208–221. [Google Scholar] [CrossRef]
  6. Cardinael, R.; Umulisa, V.; Toudert, A.; Olivier, A.; Bockel, L.; Bernoux, M. Revisiting IPCC Tier 1 coefficients for soil organic and biomass carbon storage in agroforestry systems. Environ. Res. Lett. 2018, 13, 124020. [Google Scholar] [CrossRef]
  7. Kabir, E.; Webb, E.L. Floristics and structure of southwestern Bangladesh homegardens. Int. J. Biodivers. Sci. Manag. 2008, 4, 54–64. [Google Scholar] [CrossRef]
  8. Mohri, H.; Lahoti, S.; Saito, O.; Mahalingam, A.; Gunatilleke, N.; Irham, I.; Hoang, V.T.; Hitinayake, G.; Takeuchi, K.; Herath, S. Assessment of ecosystem services in homegarden systems in Indonesia, Sri Lanka, and Vietnam. Ecosyst. Serv. 2013, 5, 124–136. [Google Scholar] [CrossRef]
  9. Delaney, M.; Hairiah, K.; Purnomosidhi, P. Carbon stocks in Indonesian homegarden systems: Can smallholder systems be targeted for increased carbon storage? Am. J. Altern. Agric. 2002, 17, 138–148. [Google Scholar] [CrossRef]
  10. Saha, S.K.; Nair, P.K.R.; Nair, V.D.; Kumar, B.M. Soil carbon stock in relation to plant diversity of homegardens in Kerala, India. Agrofor. Syst. 2009, 76, 53–65. [Google Scholar] [CrossRef]
  11. Kumar, B.M. Species richness and aboveground carbon stocks in the homegardens of central Kerala, India. Agric. Ecosyst. Environ. 2011, 140, 430–440. [Google Scholar] [CrossRef]
  12. Mattsson, E.; Ostwald, M.; Nissanka, S.P.; Pushpakumara, D.K.N.G. Quantification of carbon stock and tree diversity of homegardens in a dry zone area of Moneragala district, Sri Lanka. Agrofor. Syst. 2014, 89, 435–445. [Google Scholar] [CrossRef] [Green Version]
  13. Mensah, S.; Veldtman, R.; Assogbadjo, A.E.; Kakaï, R.G.; Seifert, T. Tree species diversity promotes aboveground carbon storage through functional diversity and functional dominance. Ecol. Evol. 2016, 6, 7546–7557. [Google Scholar] [CrossRef]
  14. Birhane, E.; Ahmed, S.; Hailemariam, M.; Negash, M.; Rannestad, M.M.; Norgrove, L. Carbon stock and woody species diversity in homegarden agroforestry along an elevation gradient in southern Ethiopia. Agrofor. Syst. 2020, 94, 1099–1110. [Google Scholar] [CrossRef]
  15. Thomas, N.; Baltezar, P.; Lagomasino, D.; Stovall, A.; Iqbal, Z.; Fatoyinbo, L. Trees outside forests are an underestimated resource in a country with low forest cover. Sci. Rep. 2021, 11, 7919. [Google Scholar] [CrossRef]
  16. Bardhan, S.; Jose, S.; Biswas, S.; Kabir, K.; Rogers, W. Homegarden agroforestry systems: An intermediary for biodiversity conservation in Bangladesh. Agrofor. Syst. 2012, 85, 29–34. [Google Scholar] [CrossRef]
  17. Islam, M.; Dey, A.; Rahman, M. Effect of Tree Diversity on Soil Organic Carbon Content in the Homegarden Agroforestry System of North-Eastern Bangladesh. Small-Scale For. 2014, 14, 91–101. [Google Scholar] [CrossRef]
  18. Rahman, M.; Kabir, E.; Akon, A.J.U.; Ando, K. High carbon stocks in roadside plantations under participatory management in Bangladesh. Glob. Ecol. Conserv. 2015, 3, 412–423. [Google Scholar] [CrossRef] [Green Version]
  19. Kabir, E.; Webb, E.L. Household and homegarden characteristics in southwestern Bangladesh. Agrofor. Syst. 2008, 75, 129–145. [Google Scholar] [CrossRef]
  20. Statistic Division, Ministry of Planning, Bangladesh Secretariat. BBS Statistical Year Book of Bangladesh.Bangladesh Bureau of Statistics (BSS); The Government of the People’s Republic of Bangladesh: Dhaka, Bangladesh, 2012.
  21. Drusch, M.; Del Bello, U.; Carlier, S.; Colin, O.; Fernandez, V.; Gascon, F.; Hoersch, B.; Isola, C.; Laberinti, P.; Martimort, P.; et al. Sentinel-2: ESA’s Optical High-Resolution Mission for GMES Operational Services. Remote Sens. Environ. 2012, 120, 25–36. [Google Scholar] [CrossRef]
  22. Dhodhi, M.K.; Saghri, J.A.; Ahmad, I.; Ul-Mustafa, R. D-ISODATA: A Distributed Algorithm for Unsupervised Classification of Remotely Sensed Data on Network of Workstations. J. Parallel Distrib. Comput. 1999, 59, 280–301. [Google Scholar] [CrossRef]
  23. Rahman, M.; Lagomasino, D.; Lee, S.; Fatoyinbo, T.; Ahmed, I.; Kanzaki, M. Improved assessment of mangrove forests in Sundarbans East Wildlife Sanctuary using WorldView 2 and Tan DEM -X high resolution imagery. Remote Sens. Ecol. Conserv. 2019, 5, 136–149. [Google Scholar] [CrossRef]
  24. Yu, L.; Gong, P. Google Earth as a virtual globe tool for Earth science applications at the global scale: Progress and perspectives. Int. J. Remote Sens. 2011, 33, 3966–3986. [Google Scholar] [CrossRef]
  25. Congalton, R.G.; Green, K. Assessing the Accuracy of Remotely Sensed Data: Principles and Practices, 2nd ed.; CRC Press: Boca Raton, FL, USA, 2009; ISBN 978-1-4200-5512-2. [Google Scholar]
  26. Chave, J.; Andalo, C.; Brown, S.; Cairns, M.A.; Chambers, J.; Eamus, D.; Fölster, H.; Fromard, F.; Higuchi, N.; Kira, T.; et al. Tree allometry and improved estimation of carbon stocks and balance in tropical forests. Oecologia 2005, 145, 87–99. [Google Scholar] [CrossRef] [PubMed]
  27. Cairns, M.A.; Brown, S.; Helmer, E.H.; Baumgardner, G.A. Root biomass allocation in the world’s upland forests. Oecologia 1997, 111, 1–11. [Google Scholar] [CrossRef]
  28. Zanne, A.E.; Lopez-Gonzalez, G.; Coomes, D.A.; Ilic, J.; Jansen, S.; Lewis, S.L.; Miller, R.B.; Swenson, N.G.; Wiemann, M.C.; Chave, J. Data from: Towards a worldwide wood economics spectrum. Ecol. Lett. 2009, 12, 351–366. [Google Scholar] [CrossRef]
  29. Pearson, T. Sourcebook for Land Use, Land-Use Change and Forestry Projects; Winrock International and the BioCarbon Fund of the World Bank: Washington, DC, USA, 2005; pp. 56–64. [Google Scholar]
  30. Maynard, D.G.; Curran, M.P. Bulk density measurement in forest soils. In Soil Sampling and Methods of Analysis; Carter, M.R., Gregorich, E.G., Eds.; Taylor & Francis: London, UK, 2008; pp. 863–869. [Google Scholar]
  31. Sparks, D.L.; Page, A.L.; Helmke, P.A.; Loeppert, R.H. Methods of Soil Analysis Part 3—Chemical Methods; SSSA Book Series; Soil Science Society of America, American Society of Agronomy: Madison, WI, USA, 1996; ISBN 978-0-89118-866-7. [Google Scholar]
  32. Shannon, C.E. A Mathematical Theory of Communication. Bell Syst. Tech. J. 1948, 27, 379–423. [Google Scholar] [CrossRef] [Green Version]
  33. Margalef, R. Information theory in biology. Gen. Syst. Yearb. 1958, 3, 36–71. [Google Scholar]
  34. R Core Team. R: A Language and Environment for Statistical Computing; R Foundation for Statistical Computing: Vienna, Austria, 2020. [Google Scholar]
  35. Grace, J.B.; Bollen, K.A. Interpreting the Results from Multiple Regression and Structural Equation Models. Bull. Ecol. Soc. Am. 2005, 86, 283–295. [Google Scholar] [CrossRef]
  36. Zuur, A.F.; Ieno, E.N.; Elphick, C.S. A protocol for data exploration to avoid common statistical problems: Data exploration. Methods Ecol. Evol. 2010, 1, 3–14. [Google Scholar] [CrossRef]
  37. Rahman, M.; Zimmer, M.; Ahmed, I.; Donato, D.; Kanzaki, M.; Xu, M. Co-benefits of protecting mangroves for biodiversity conservation and carbon storage. Nat. Commun. 2021, 12, 3875. [Google Scholar] [CrossRef] [PubMed]
  38. Potapov, P.; Siddiqui, B.N.; Iqbal, Z.; Aziz, T.; Zzaman, B.; Islam, A.; Pickens, A.; Talero, Y.; Tyukavina, A.; Turubanova, S.; et al. Comprehensive monitoring of Bangladesh tree cover inside and outside of forests, 2000–2014. Environ. Res. Lett. 2017, 12, 104015. [Google Scholar] [CrossRef]
  39. Khan, N.I.; Islam, R.; Rahman, A.; Azad, S.; Mollick, A.S.; Kamruzzaman, M.; Sadath, N.; Feroz, S.; Rakkibu, G.; Knohl, A. Allometric relationships of stand level carbon stocks to basal area, tree height and wood density of nine tree species in Bangladesh. Glob. Ecol. Conserv. 2020, 22, e01025. [Google Scholar] [CrossRef]
  40. Rahman, M.L.; Hossain, M.K. Status of fodder and non-fodder tree species in Chunati wildlife sanctuary of Chittagong forest division, Bangladesh. Int. J. For. Usufructs Manag. 2003, 4, 9–14. [Google Scholar]
  41. Bajigo, A.; Tadesse, M. Woody species diversity of traditional agroforestry practices in Gununo Watershed in Wolayitta Zone, Ethiopia. For. Res. 2016, 4, 155. [Google Scholar] [CrossRef]
  42. Takimoto, A.; Nair, P.R.; Nair, V.D. Carbon stock and sequestration potential of traditional and improved agroforestry systems in the West African Sahel. Agric. Ecosyst. Environ. 2008, 125, 159–166. [Google Scholar] [CrossRef]
  43. Phelps, J.; Webb, E.; Adams, W.M. Biodiversity co-benefits of policies to reduce forest-carbon emissions. Nat. Clim. Chang. 2012, 2, 497–503. [Google Scholar] [CrossRef]
  44. Ruiz-Jaen, M.C.; Potvin, C. Can we predict carbon stocks in tropical ecosystems from tree diversity? Comparing species and functional diversity in a plantation and a natural forest. New Phytol. 2010, 189, 978–987. [Google Scholar] [CrossRef] [PubMed]
  45. Rahman, M.; Khan, N.I.; Hoque, A.K.F.; Ahmed, I. Carbon stock in the Sundarbans mangrove forest: Spatial variations in vegetation types and salinity zones. Wetl. Ecol. Manag. 2014, 23, 269–283. [Google Scholar] [CrossRef]
  46. UNFCCC. Report of the Conference of the Parties on its Seventh Session. In Proceedings of the Conference of the Parties, Seventh Session, Marrakesh, Morocco, 29 October–10 November 2001. [Google Scholar]
Figure 1. Map showing carbon sampling plots and ground truthing points in Dighalia Upazilla.
Forests 12 01661 g001
Figure 2. Extent of homegardens and non-homegardens in Dighalia Upazila. (a) Based on unsupervised classification of Sentinel 2 imagery; (b) Google Earth satellite image® shows homegardens covered by dark area.
Forests 12 01661 g002
Figure 3. Correlation matrix between stand structure, diversity and different carbon pools. Block with cross sign indicates insignificant relation (p > 0.05). MDBH: Mean Diameter at Breast Height (1.37 m), MTH: Mean tree height, SD: Stem Density, BA: Basal Area, D = Margalef Diversity index, H = Shannon Diversity Index, AGC: Aboveground Carbon, BGC: Belowground Carbon, SOC1 = Soil Organic Carbon at 0–15 cm depth, SOC2 = Soil Organic Carbon at 15–30 cm, TBC = Total Biomass Carbon (AGC + BGC), TSOC = Total Soil Organic Carbon (0–30 cm).
Forests 12 01661 g003
Figure 4. Structural equation models. (ag) Aboveground biomass carbon (a), belowground biomass carbon (b), soil organic carbon (0–15 cm) (c), soil organic carbon (15–30 cm) (d), total biomass carbon (e), total soil organic carbon (f) and total carbon (g). All SEMs had a similar insignificant χ2 (Chi-Square) of 1.22 (p = 0.268), with a comparative fit index close to one (CFI; 0.98–0.99) and a standardized root mean square residual close to zero (0.08), indicating no significant deviation from model and datasets at one degree of freedom. The lines with pink and black indicate a negative and positive association between the two covariables. Arrows with numbers indicate the standardized association of predictors with dependent variables. Numbers with percentages above boxes independent variables indicate their explained variance (Coefficient of determinant: R squared) by all the predictors. The path values with asterisks indicate their significance level (*** p < 0.001, ** p < 0.01, * p < 0.05), while the insignificant paths were indicated as dotted lines (p > 0.05).
Forests 12 01661 g004
Table 1. Allometric equations used for biomass estimation in this study.
Equation(s)NotesReference
AGB = ρ × exp(−1.499 + 2.148 × ln(DBH) + 0.207 × (ln(DBH))2 − 0.0281(ln(DBH))3)For all dicot treesChave et al. [26]
AGB = 6.666 + 12.826 × ht0.5 × ln(ht)For palm, coconut and date treesPearson et al. [29]
BGB = exp(−1.0587 + 0.8836 × lnAGB)For root biomassCairns et al. [27]
AGB = Aboveground biomass, ρ = Wood density (gcm−3), DBH = Diameter at breast height, ht = Height, BGB = Belowground Biomass.
Table 2. Result of the classification accuracy based on the Confusion Matrix. Column represents the Google Earth vegetation class, while the row represents the Sentinel 2-based class.
Pixel Based Google Earth Based
HomegardensNon-HomegardensTotalUsers (%)Commission (%)
Homegardens5615798.251.75
Non-homegardens3555895.165.17
Total5956115
Producers (%)94.9298.21 Overall96.52
Commission (%)5.081.79 Kappa0.93
Table 3. Descriptive statistics of stand structures and diversity indices across the 40 plots in Dighalia.
VariablesMinimumMaximumMeanSE
Shannon–Wiener index ( H ) 1.913.012.560.04
Margalef index (R) 1.443.032.310.06
Stem density (trees ha−1) 6001600105535.61
Mean DBH (cm) 8.7724.4514.490.49
Tree height (m) 5.8411.007.880.17
Basal area (m2 ha−1) 4.0429.3113.760.96
Table 4. Mean (±SE) difference of different carbon pools between villages. According to the Duncan’s Multiple Range Test, the columns with a similar letter suggest a non-significant difference (p > 0.05).
VillageAboveground
Biomass Carbon
(Mg ha−1)
Belowground
Biomass Carbon
(Mg ha−1)
Soil Organic
Carbon
(0–15 cm)
(Mg ha−1)
Soil Organic
Carbon
(15–30 cm)
(Mg ha−1)
Total Biomass
Carbon
(Mg ha−1)
Total Soil
Organic
Carbon
(Mg ha−1)
Total Carbon
(Mg ha−1)
Senhati45.01 ± 6.95 b9.98 ± 1.36 b26.18 ± 2.25 a27.94 ± 3.38 ab54.99 ± 8.30 b54.12 ± 3.99 ab109.10 ± 10.89 a
Chandani mahal88.00 ± 6.39 a18.11 ± 1.16 a26.04 ± 2.18 a20.08 ± 3.29 b106.11 ± 7.56 a46.12 ± 4.63 b152.22 ± 10.15 a
Bativita55.05 ± 10.07 ab11.89 ± 1.94 ab29.44 ± 3.02 a34.79 ± 2.00 a66.94 ± 12.01 ab64.23 ± 3.85 a131.17 ± 12.14 a
Hagigram61.47 ± 10.47 ab13.12 ± 1.99 ab27.48 ± 3.63 a22.21 ± 3.35 b74.59 ± 12.46 ab49.70 ± 6.28 ab124.30 ± 16.22 a
Baracpur49.96 ± 14.79 b10.82 ± 2.81 b31.28 ± 2.67 a27.04 ± 3.85 ab60.78 ± 17.59 b58.32 ± 5.66 ab119.10 ± 19.06 a
Ghosgati66.83 ± 7.28 ab14.18 ± 1.38 ab30.80 ± 2.20 a29.23 ± 3.27 ab81.01 ± 8.67 ab60.03 ± 4.21 ab141.03 ± 10.83 a
Kamargati67.82 ± 10.86 ab14.34 ± 2.00 ab30.03 ± 6.46 a29.32 ± 4.39 ab82.16 ± 12.86 ab59.35 ± 3.74 ab141.51 ± 14.14 a
Lakhoati49.20 ± 13.18 b10.70 ± 2.51 b30.30 ± 2.27 a27.10 ± 2.06 ab59.91 ± 15.69 b57.40 ± 3.38 ab117.31 ± 18.40 a
Average60.42 ± 3.9312.89 ± 0.7528.94 ± 1.1227.21 ± 1.2573.31 ± 4.6756.16 ± 1.71129.47 ± 5.10
Table 5. Indirect and total standardized effect of the Shannon diversity on different carbon pools. The path values with asterisks indicate their significance level (*** p < 0.001, ** p < 0.01, * p < 0.05).
Indirect and Total EffectsAGCBGCSOC1SOC2TBCTSCTCS
Std. eff.Std. eff.Std. eff.Std. eff.Std. eff.Std. eff.Std. eff.
Indirect effect of the Shannon diversity through basal area0.282 *0.282 *−0.017−0.0490.282 *−0.0350.201 *
Indirect effect of the Shannon diversity through tree canopy height−0.056−0.0560.0040.017−0.0560.014−0.035
Total effect of the Shannon diversity0.393 **0.393 **0.513 ***0.1060.393 **0.411 **0.544 ***
Publisher’s Note: MDPI stays neutral with regard to jurisdictional claims in published maps and institutional affiliations.

