Article

Leaf Phenology Drives Spatio-Temporal Patterns of Throughfall under a Single Quercus castaneifolia C.A.Mey.

1
Department of Forestry, Ahar Faculty of Agriculture and Natural Resources, University of Tabriz, Ahar 5354854517, Iran
2
Department of Forestry and Forest Economics, Faculty of Natural Resources, University of Tehran, Karaj 77871-31587, Iran
3
Leaf Biomechanics and Ecohydrology Research Group, Department of Geography and Environmental Studies, University of Colorado Colorado Springs, Colorado Springs, CO 80918, USA
4
International Joint Research Laboratory for Global Change Ecology, School of Life Sciences, Henan University, Kaifeng 475004, China
*
Author to whom correspondence should be addressed.
Forests 2020, 11(6), 688; https://doi.org/10.3390/f11060688
Submission received: 7 June 2020 / Revised: 15 June 2020 / Accepted: 16 June 2020 / Published: 18 June 2020
(This article belongs to the Special Issue Water Resources Management and Modeling in Forestry)

Abstract

:
Throughfall (TF) makes up the majority of understory rainfall and thereby plays an important role in controlling the amount of water reaching the forest floor. TF under a single Quercus castaneifolia (C.A.Mey, chestnut-leaved oak) tree in Northern Iran was measured during the leafed and leafless periods. TF quantity under the Q. castaneifolia canopy made up 69.3% and 88.0% of gross rainfall during leafed and leafless periods, respectively. Phenoseason influenced TF distribution patterns as TF temporal patterns during the leafed period were slightly more stable than during the leafless periods. The minimum number of TF collectors needed to yield a representative mean TF with accepted errors of 10% at 95% confidence level was twenty-six and twelve TF collectors for leafed and leafless periods, respectively. We conclude that phenoseasonality significantly affects TF spatiotemporal variability and presented the required number of collectors necessary for sampling TF under an individual Q. castaneifolia tree.

1. Introduction

When rainfall falls on a forest, the canopy will capture a portion of it as interception loss. During and following a rainfall event, this intercepted water can evaporate to contribute to evapotranspiration [1]. Commonly, interception loss is indirectly derived from the difference between gross precipitation (the rainfall total above the canopy) and understory rainfall (i.e., net rainfall). Understory rainfall is composed of throughfall (TF) and stemflow (SF) [2]. TF has two parts, where one portion penetrates through canopy gaps and is termed free throughfall. The other portion drips or splashes from branches and leaves and is called release throughfall [3]. Generally speaking, the contribution of TF to understory rainfall is much larger than SF (see the review by Sadeghi et al. [4], SF is typically less than 5% of annual precipitation in canopy water budget [4,5]). Therefore, the careful observation of TF is critically important to accurately and precisely estimate interception loss [6].
Forest canopy structure and meteorological conditions are complex and variable, making TF patterns extremely complicated [3,5]. Up to now, there is no standard protocol for measuring these patterns [4]. The typical way to increase the accuracy of TF measurements is to increase the quantity of TF collection devices [7], expand the opening area of rainfall collection devices [8], or reposition collectors after each sample collection [9]. Nevertheless, all of these methods require an enormous amount of manpower and material resources [10]. Minimizing the cost and effort of TF sampling means reducing the number of collectors [11,12], which is especially difficult when there is high spatial heterogeneity at the tree-scale.
The variable TF input and related chemistry can produce hydrological and biogeochemical “hot moments” and “hot spots” on the forest floor, which may subsequently determine the amount of water available to plants, groundwater recharge, and nutrient cycling [6,13]. “Hot moments” can occur during rainfall events that have particularly large rainfall intensities. TF “hot spots” can occur directly beneath points in the canopy that promote the drainage and coalescence of rainwater at specific vegetative locations within the canopy, such as a large bend of a branch that creates drip points to the forest floor. Therefore, an in-depth understanding of distribution patterns of TF within a forest is a precondition for a rigorous understanding of forest hydrological processes.
Many studies have explored the relationship between canopy cover and TF volume, using such variables as the distance to tree trunk, leaf area index, and plant area index. The positive [14,15], negative [16,17,18] or neutral [19,20,21] effects of the distance to tree trunk on TF volume have been documented, suggesting disagreement within the literature about the relationship of distance to tree trunk on the spatial dynamics of TF within forests. Additionally, the impact of phenoseasonality on TF distribution adds complexity to forest interception processes. The time span in which foliage persists in the canopy may create TF spatial patterns in a vegetation type that varies seasonally. For deciduous forests, seasonal changes in leaf state (i.e., leafed and leafless periods) can change TF spatial patterns [6] and reduce their temporal persistence [22], hence, more research is needed to clarify TF spatial patterns in deciduous species.
Hyrcanian temperate forests form a unique forested massif that stretches 850 km along the southern coast of the Caspian Sea in Iran. Paleoecological data suggest these forests first appeared 25–50 million years ago [23,24,25]. Quercus castaneifolia (C.A.Mey, chestnut-leaved oak) is one of the most important species of Iran’s native oaks, and is widely distributed in the Hyrcanian temperate forests. This species is the second most important commercial species in Iran after oriental beech (Fagus orientalis Lipsky.). Q. castaneifolia makes up 6.6% of the area and 8% of the standing volume of Hyrcanian temperate forests and an individual tree can measure 50 m in height and 3 m in diameter at breast height (DBH) [26,27].
This study examined the spatial and temporal patterns of TF under a single Q. castaneifolia in the Educational Forests of the Tarbiat Modares University, Northern Iran. The major objectives of this study were to measure TF characteristics between leafed and leafless periods under a single Q. castaneifolia tree. Specifically, this intensive study of TF measurement explored (1) the spatial heterogeneity of TF, (2) the temporal patterns of TF between phenoseasons, and (3) the optimum numbers of TF collectors for sampling TF.

2. Materials and Methods

2.1. Site Description

This study was conducted at the International Campus of Tarbiat Modares University at the Faculty of Natural Resources in Noor City, in Northern Iran (lat: 36°34′ N; long: 52°2′ E; elevation above sea level: −18 m a.s.l). The site was chosen for its accessibility to facilitate adequate or frequent monitoring. Long-term (1977–2016) mean annual rainfall in the local area is 1147 mm. The majority of the precipitation occurs during a five-month period from September through January. Mean monthly temperature varies from 7.7 °C in January to 26.2 °C in September, and mean annual air temperature is 16.6 °C. The study focused on a single, isolated mature Q. castaneifolia tree. Tree height, diameter at breast height (DBH), and projected canopy area (PCA) were 13 m, 45 cm, and 155 m2, respectively. Rainfall events were sampled during two canopy development stages of leafed and leafless.

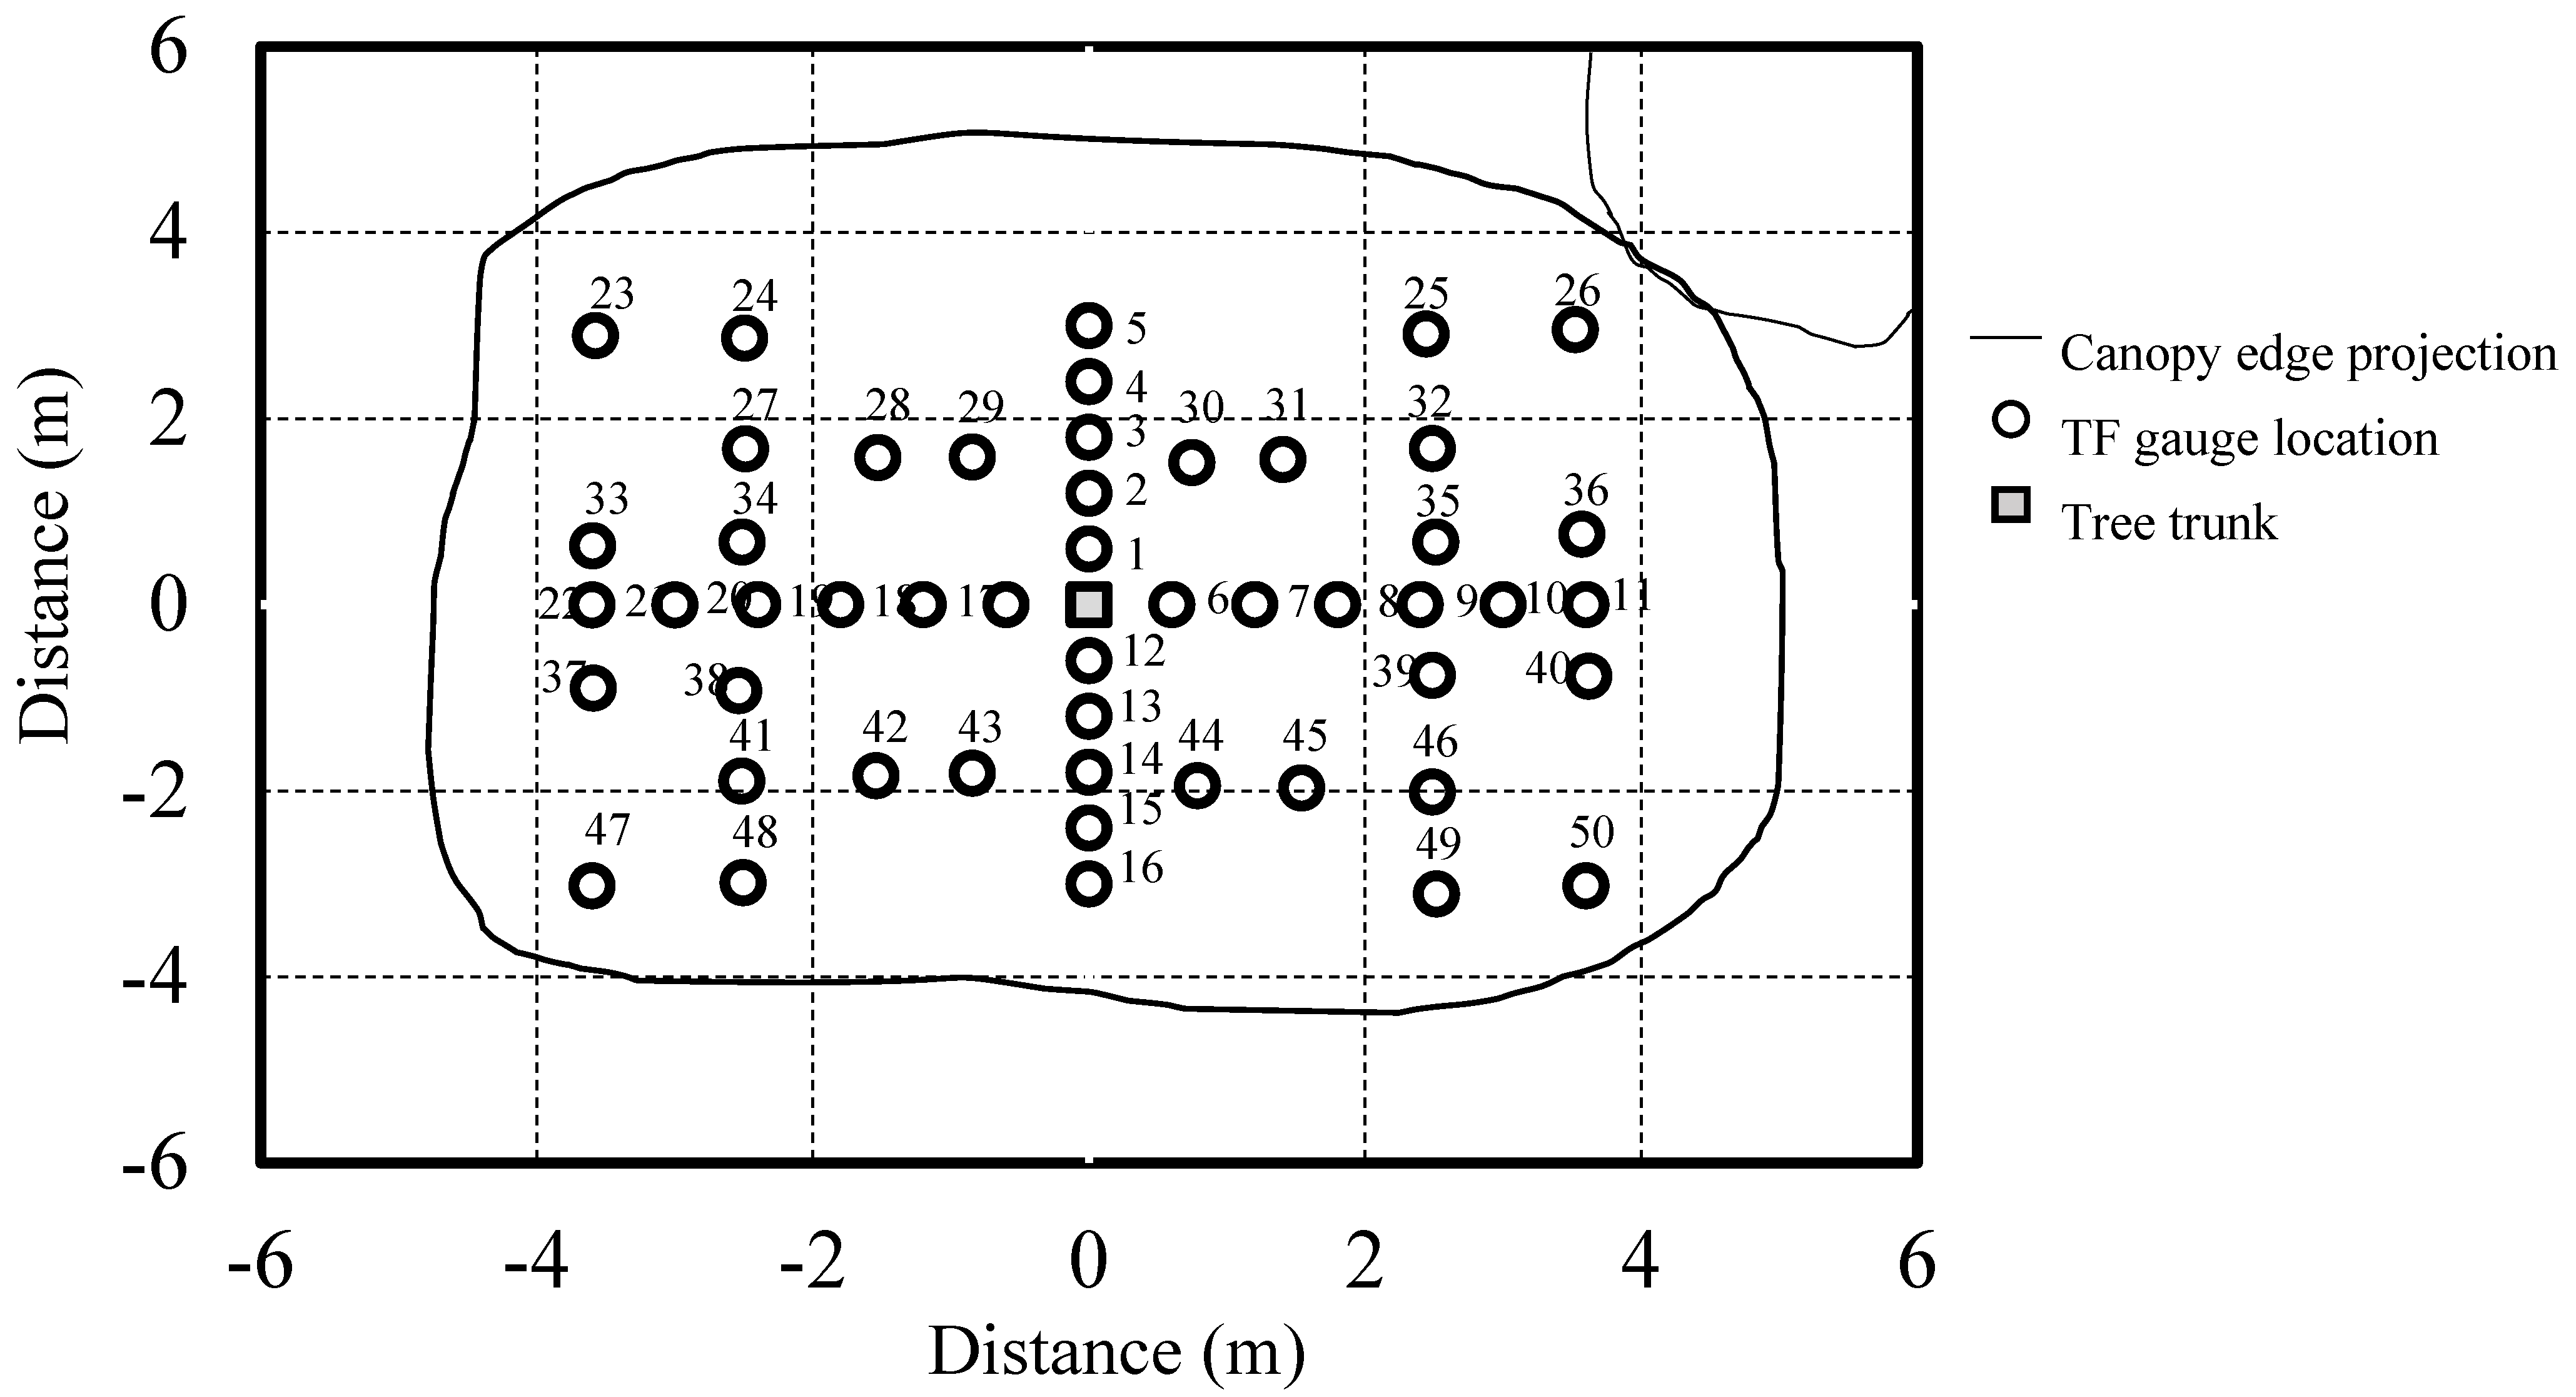
2.2. Gross Rainfall and Throughfall Measurement

Measurements of gross rainfall (GR) and throughfall (TF) were conducted for a period from 3 February to 15 March (the leafless period) and from 14 April to 24 July (the leafed period) in 2013. Gauges were emptied shortly after rainfall events. GR was monitored using six cylindrical plastic rain gauges (diameter = 90 mm). TF was measured using 50 rain gauges identical to the gross rainfall gauges (Figure 1). All gauges were kept stationary during the entire monitoring period. The TF gauges were positioned along multiple axes underneath the canopy and oriented based on cardinal points (Figure 1). The individual gauges and the tree trunk were mapped as a cartesian grid to plot the spatial distribution of TF relative to the tree trunk and canopy edge.

2.3. Throughfall Spatial Variability

Variograms, which express continuity as the average squared difference between quantities measured in different areas, can be used to measure the continuity of spatial phenomena. In this study, we employed regionalized variable theory to model the spatial correlation structure with the variogram [20]. The variogram was calculated using the following equation:
γ ˆ ( h ) = 1 2 n ( h ) i = 1 n ( h ) ( T F i     T F i + h ) 2
where γ ˆ ( h ) is the variogram, n(h) are TF pairs (TFi, TFi+h) where the amount is separated by the distance h, known as the lag, i is different spatial location of the observations. Variograms can be described by their sill and range. The former is the limiting value of the variogram and increases as h increases, while the latter is the lag at which the variogram reaches a hill. The parameters of the model contained the sill parameter, the nugget effect, and the effective range. The sill parameter (C) and nugget effect (C0) are derived from the overall mean TF ( μ ˆ ) and the mean TF for event ( T F j ¯ ) using the following equations:
C j = C s ( T F j ¯ μ ˆ ) 2
C 0 j = C 0 s ( T F j ¯ μ ˆ ) 2
where   C s and   C 0 s are the sill parameters and the nugget effects of standardized data, respectively. The range of spatial dependence of TF was deemed irrelevant to rainfall depth, indicating that the same range was derived from all rainfall events. The surface variogram map for the studied tree was computed to estimate the spatial correlation changes with direction. Variograms were computed for lags up to about half the maximum sample separation distance. We fitted maps for TF by ordinary kriging with the corresponding variogram. After the TF percentage was calculated via division by rainfall depth, we calculated the TF percentage at the interpolated location i for rainfall event j (TFpij) by:
T F p i j = 100 G R j p = 1 q λ p T F i j
where GRj is the rainfall depth for rainfall event j, λ p is the best linear unbiased kriging weights for observations TFij, q is neighboring observations amount that are taken as the interpolation at location i. The overall variogram model of the studied tree was derived from the sill value, the nugget effect, and the range that was considered unchanged for all rainfall events [21]. The model was employed to compute the individual TF percentage for each rainfall event in the present study.

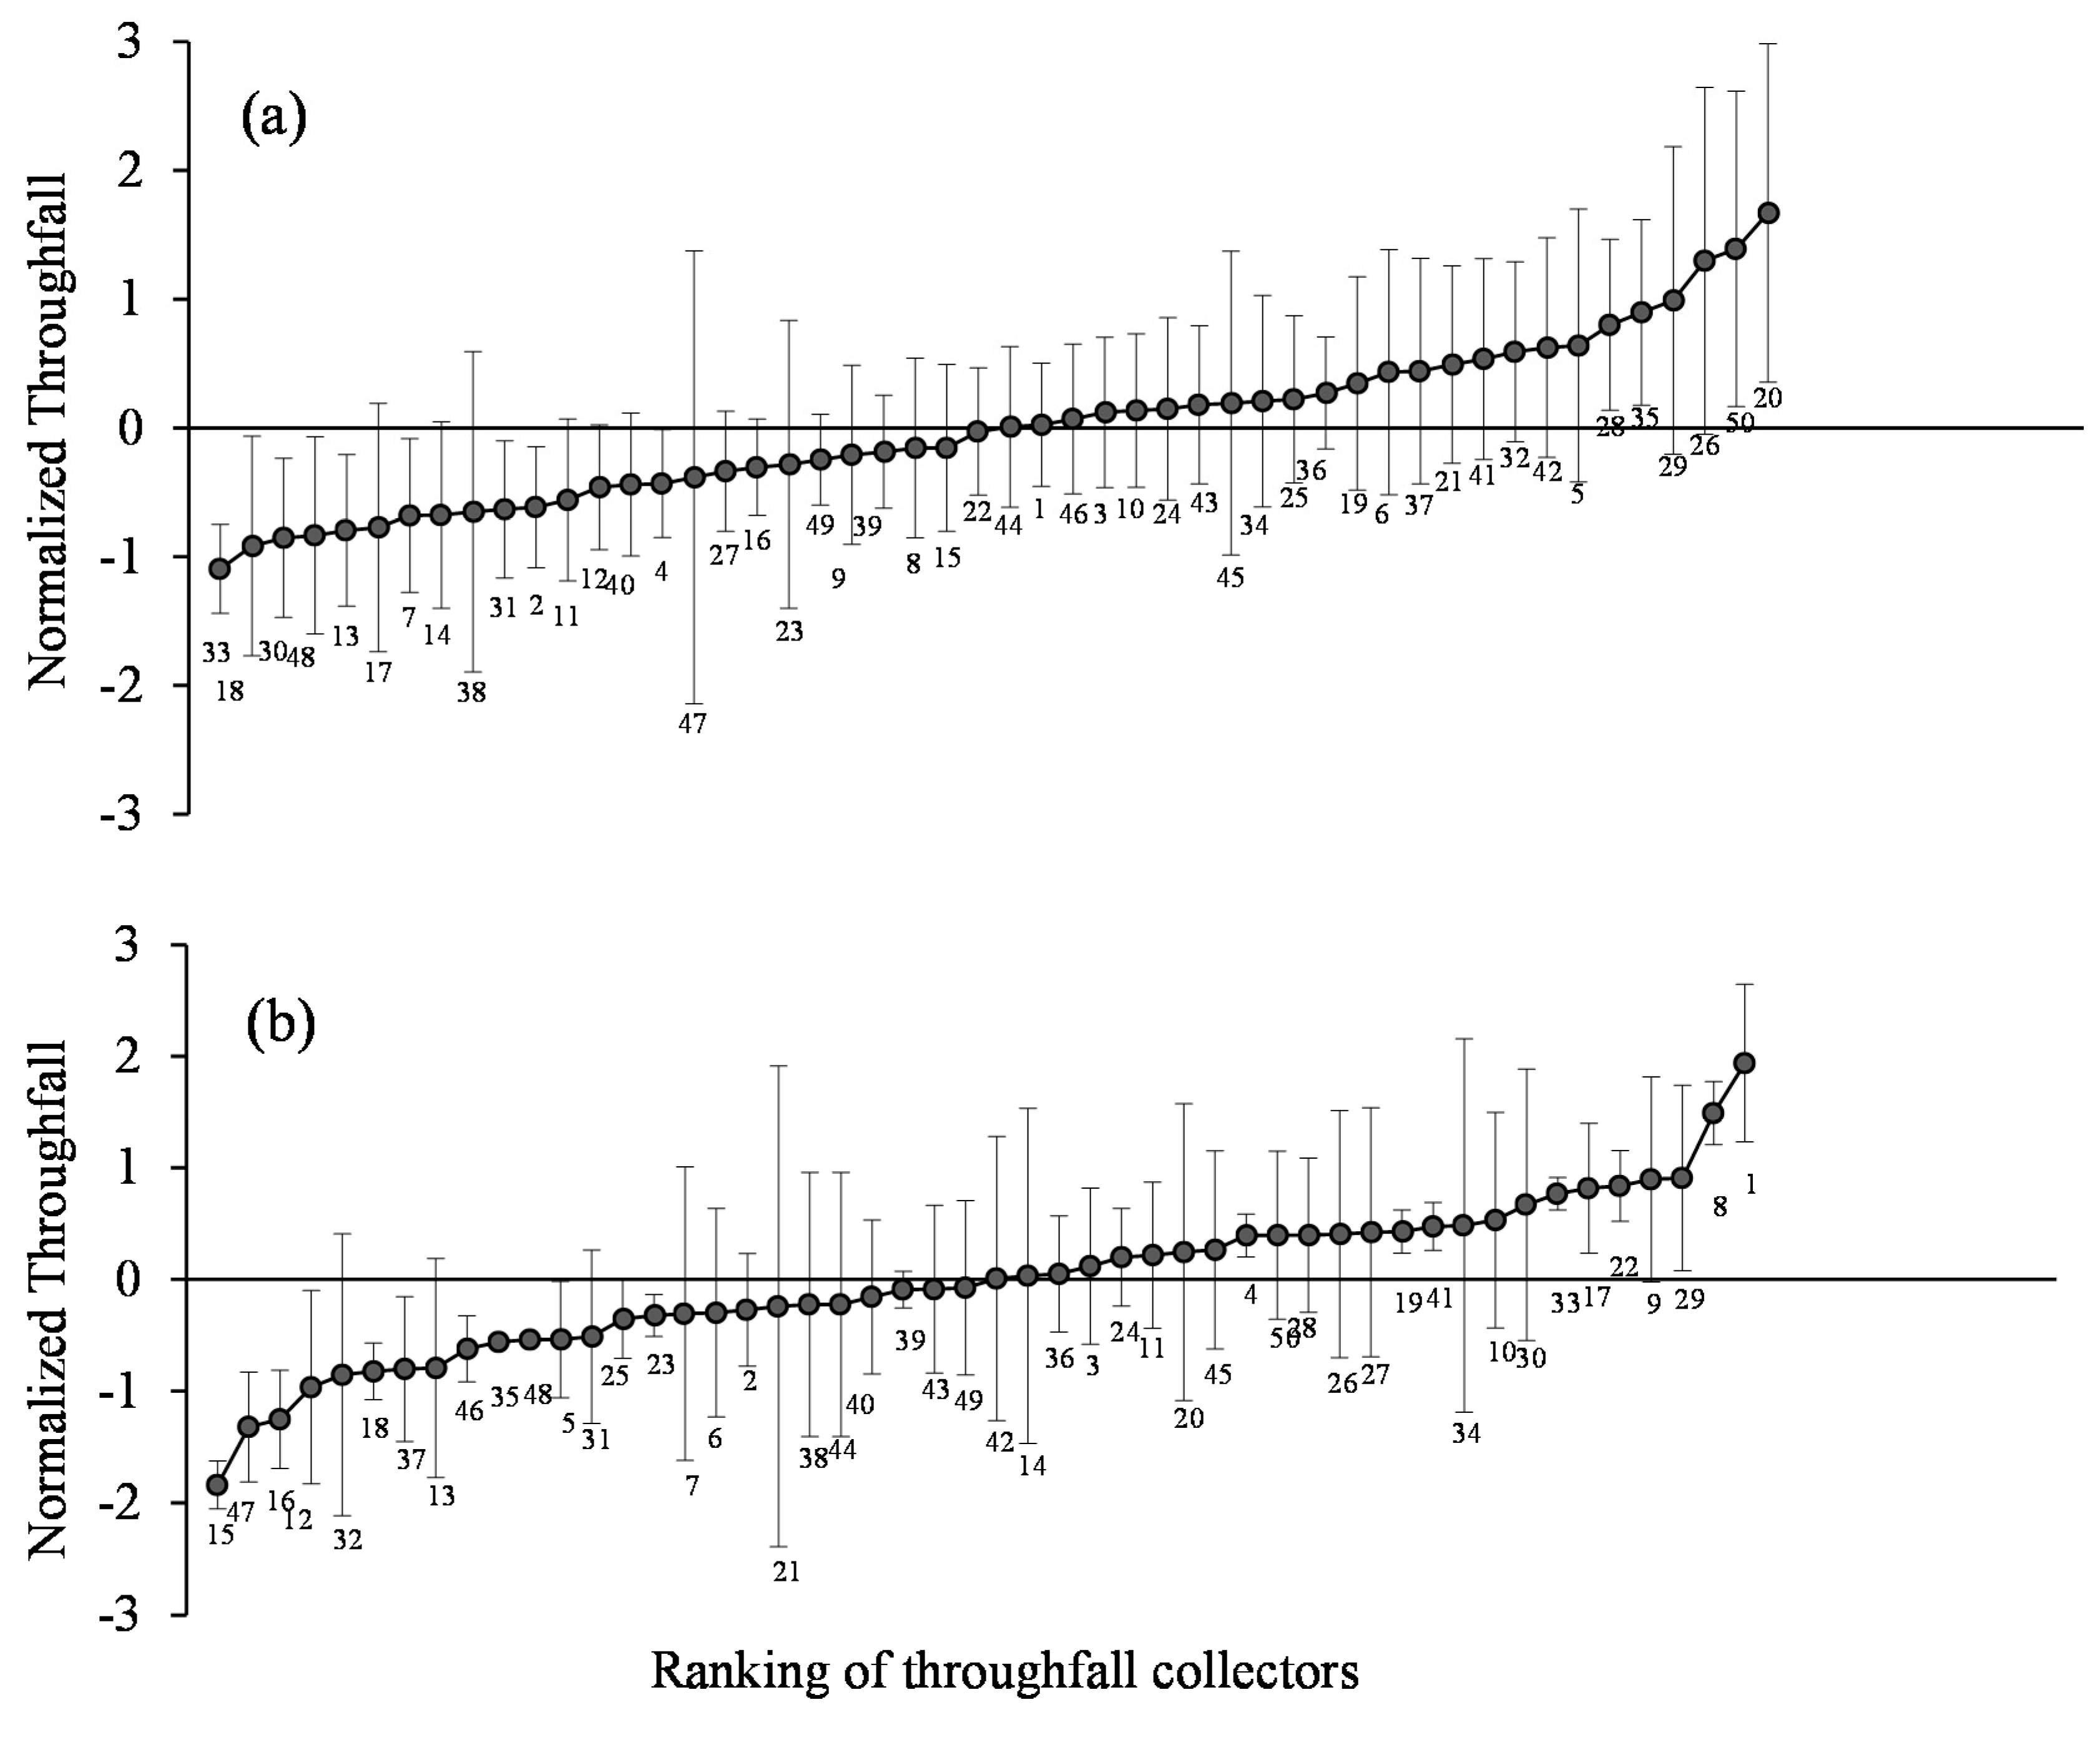
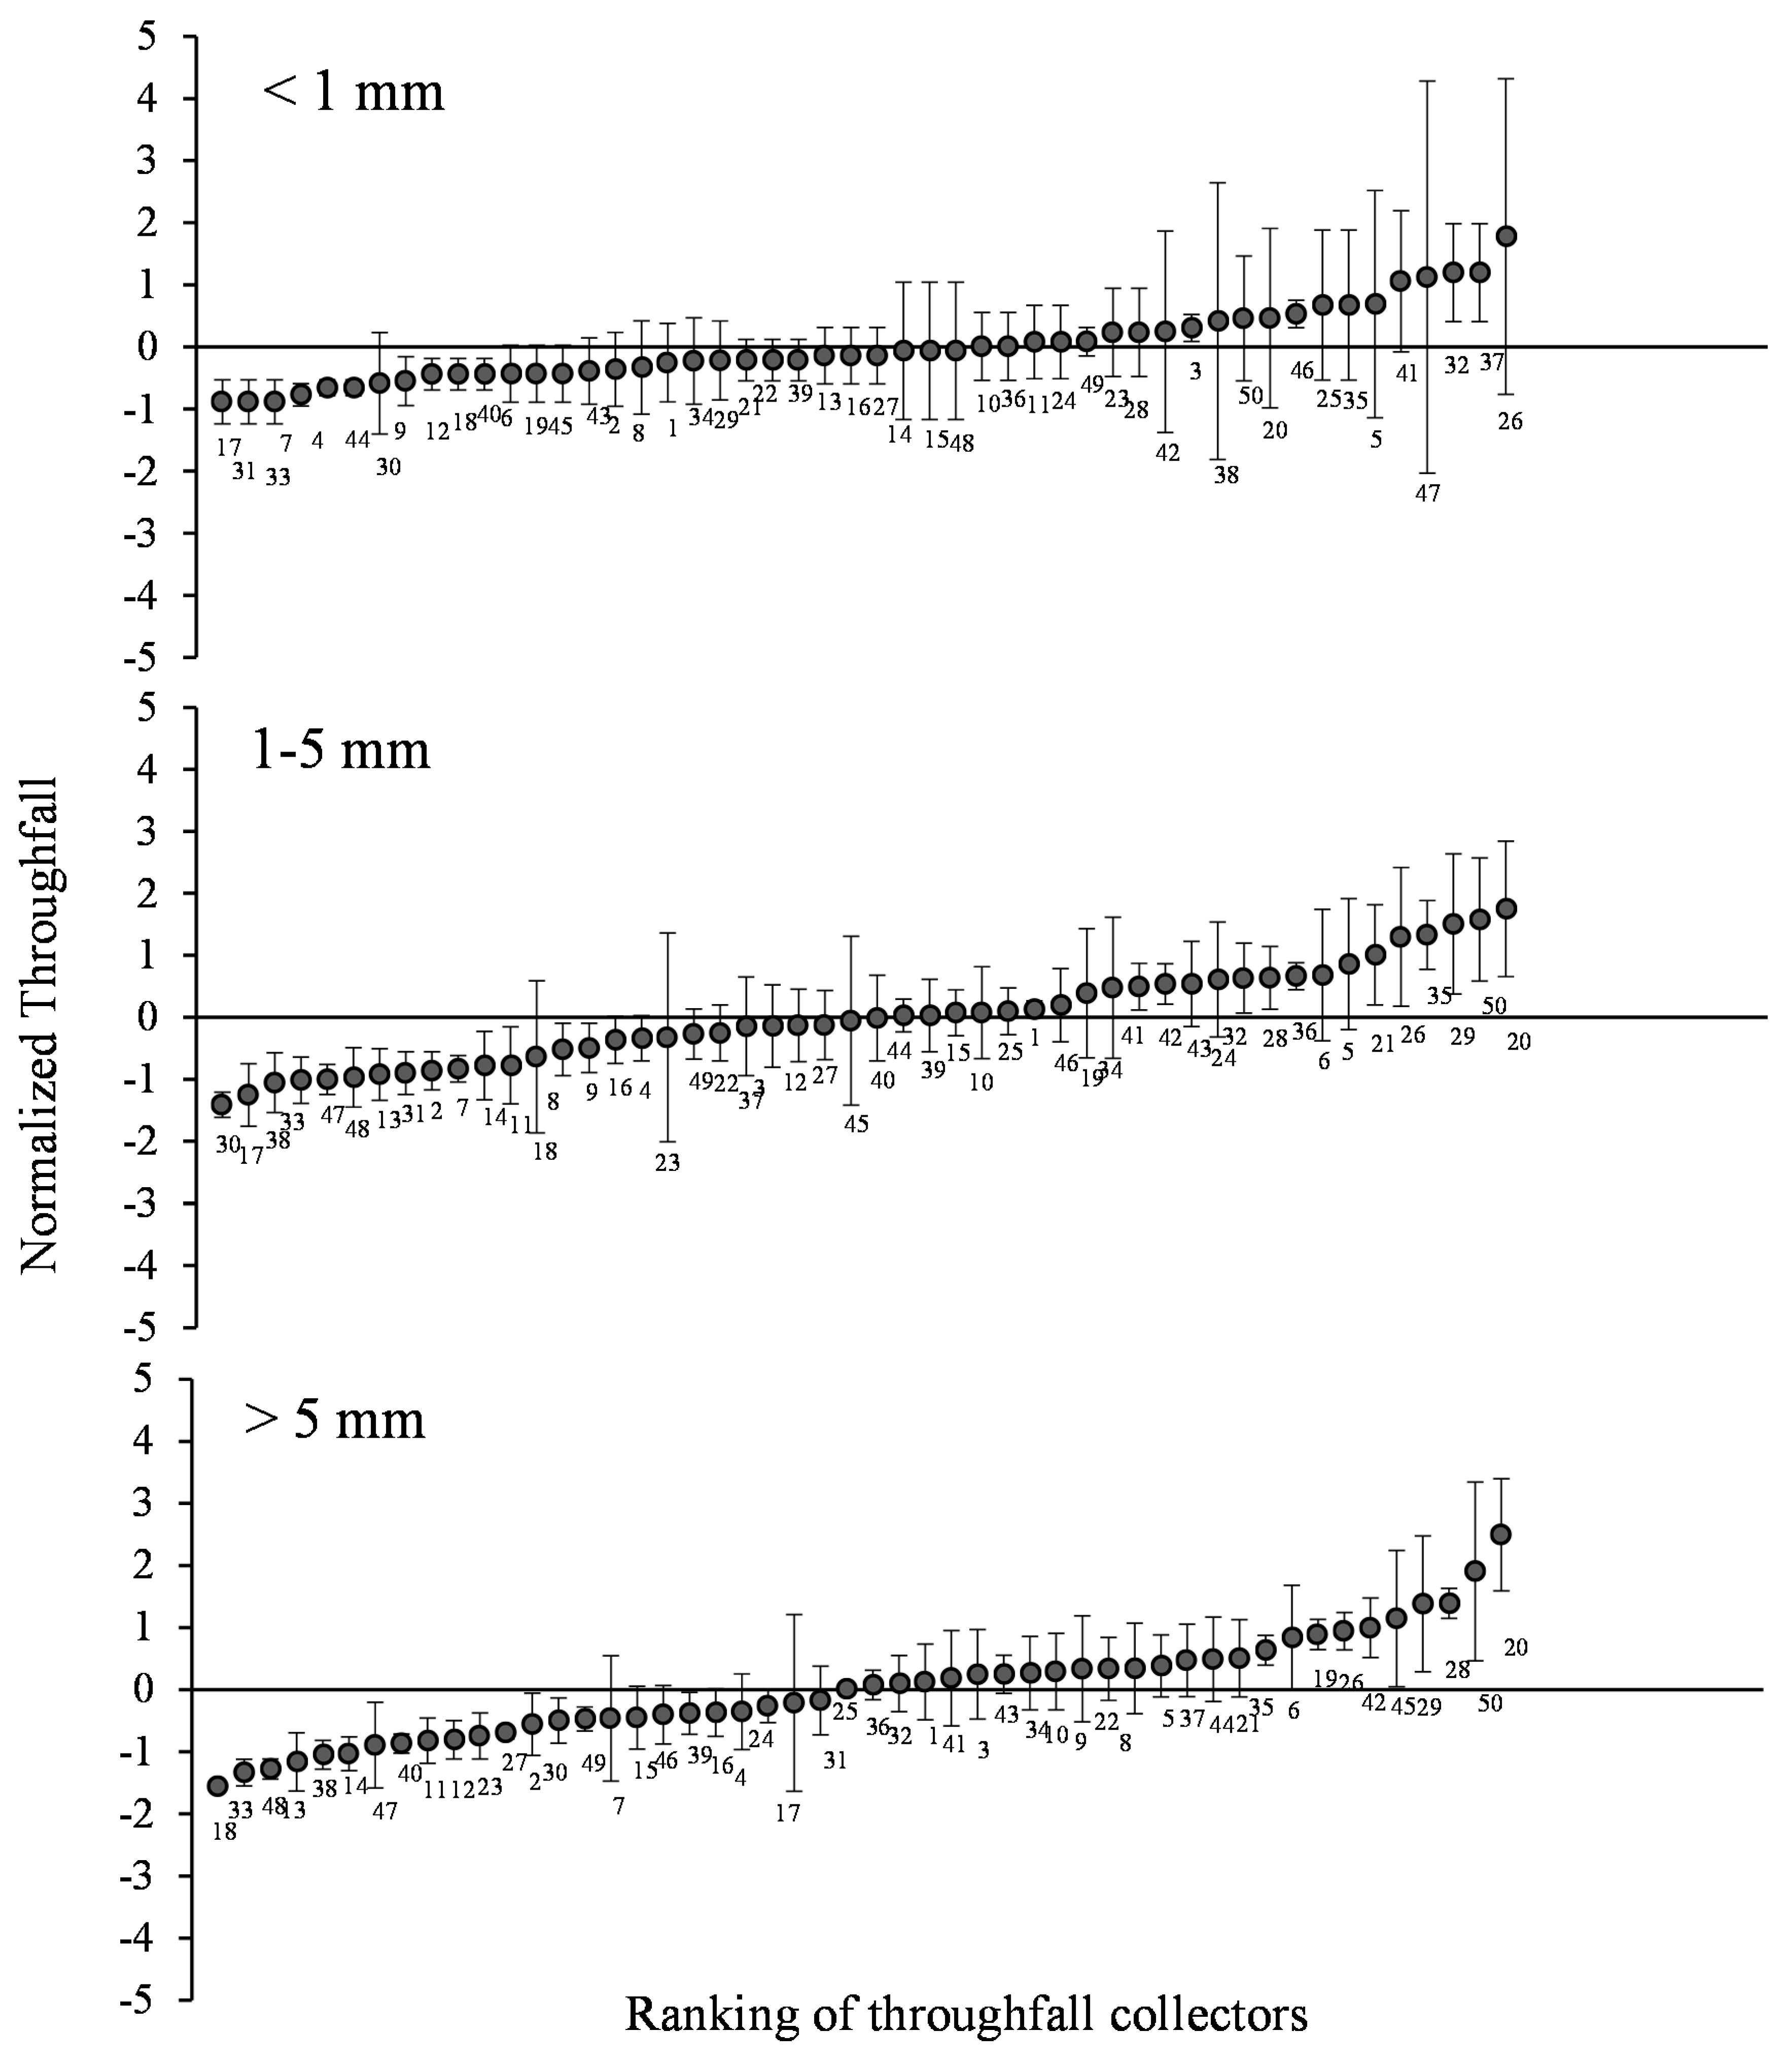
2.4. Temporal Stability of Spatial Throughfall Patterns

To investigate the temporal stability of TF patterns, the Spearman rank correlation coefficients (rs) were calculated. The rs measured the extent of monotonicity of a relationship between two variables. It was calculated between the individual rain event, between the cumulative TF quantity within three rainfall classes (<1, 1 to <5, and ≥5 mm rainfall) for the leafed period, and between the cumulative TF of the two phenoseasons (leafed and leafless periods).
TF usually do not exhibit a normal distribution at the scale of individual rainfall events. In addition to the correlation coefficient, we calculated the time stability plots to investigate the temporal persistence of spatial patterns of TF by using the methodology proposed by Keim et al. [20], which corrects each stationary TF gauge to zero medium and unit variance. TF is quantified using standardized TF for each of the sample points using the formula as follows:
T F S i = T F i     T F m e a n S D
where TFSi and TFi are normalized and measured TF at sampling point i, respectively. TFmean and SD are the mean TF and standard deviation of TF for all sampling points, respectively [9].

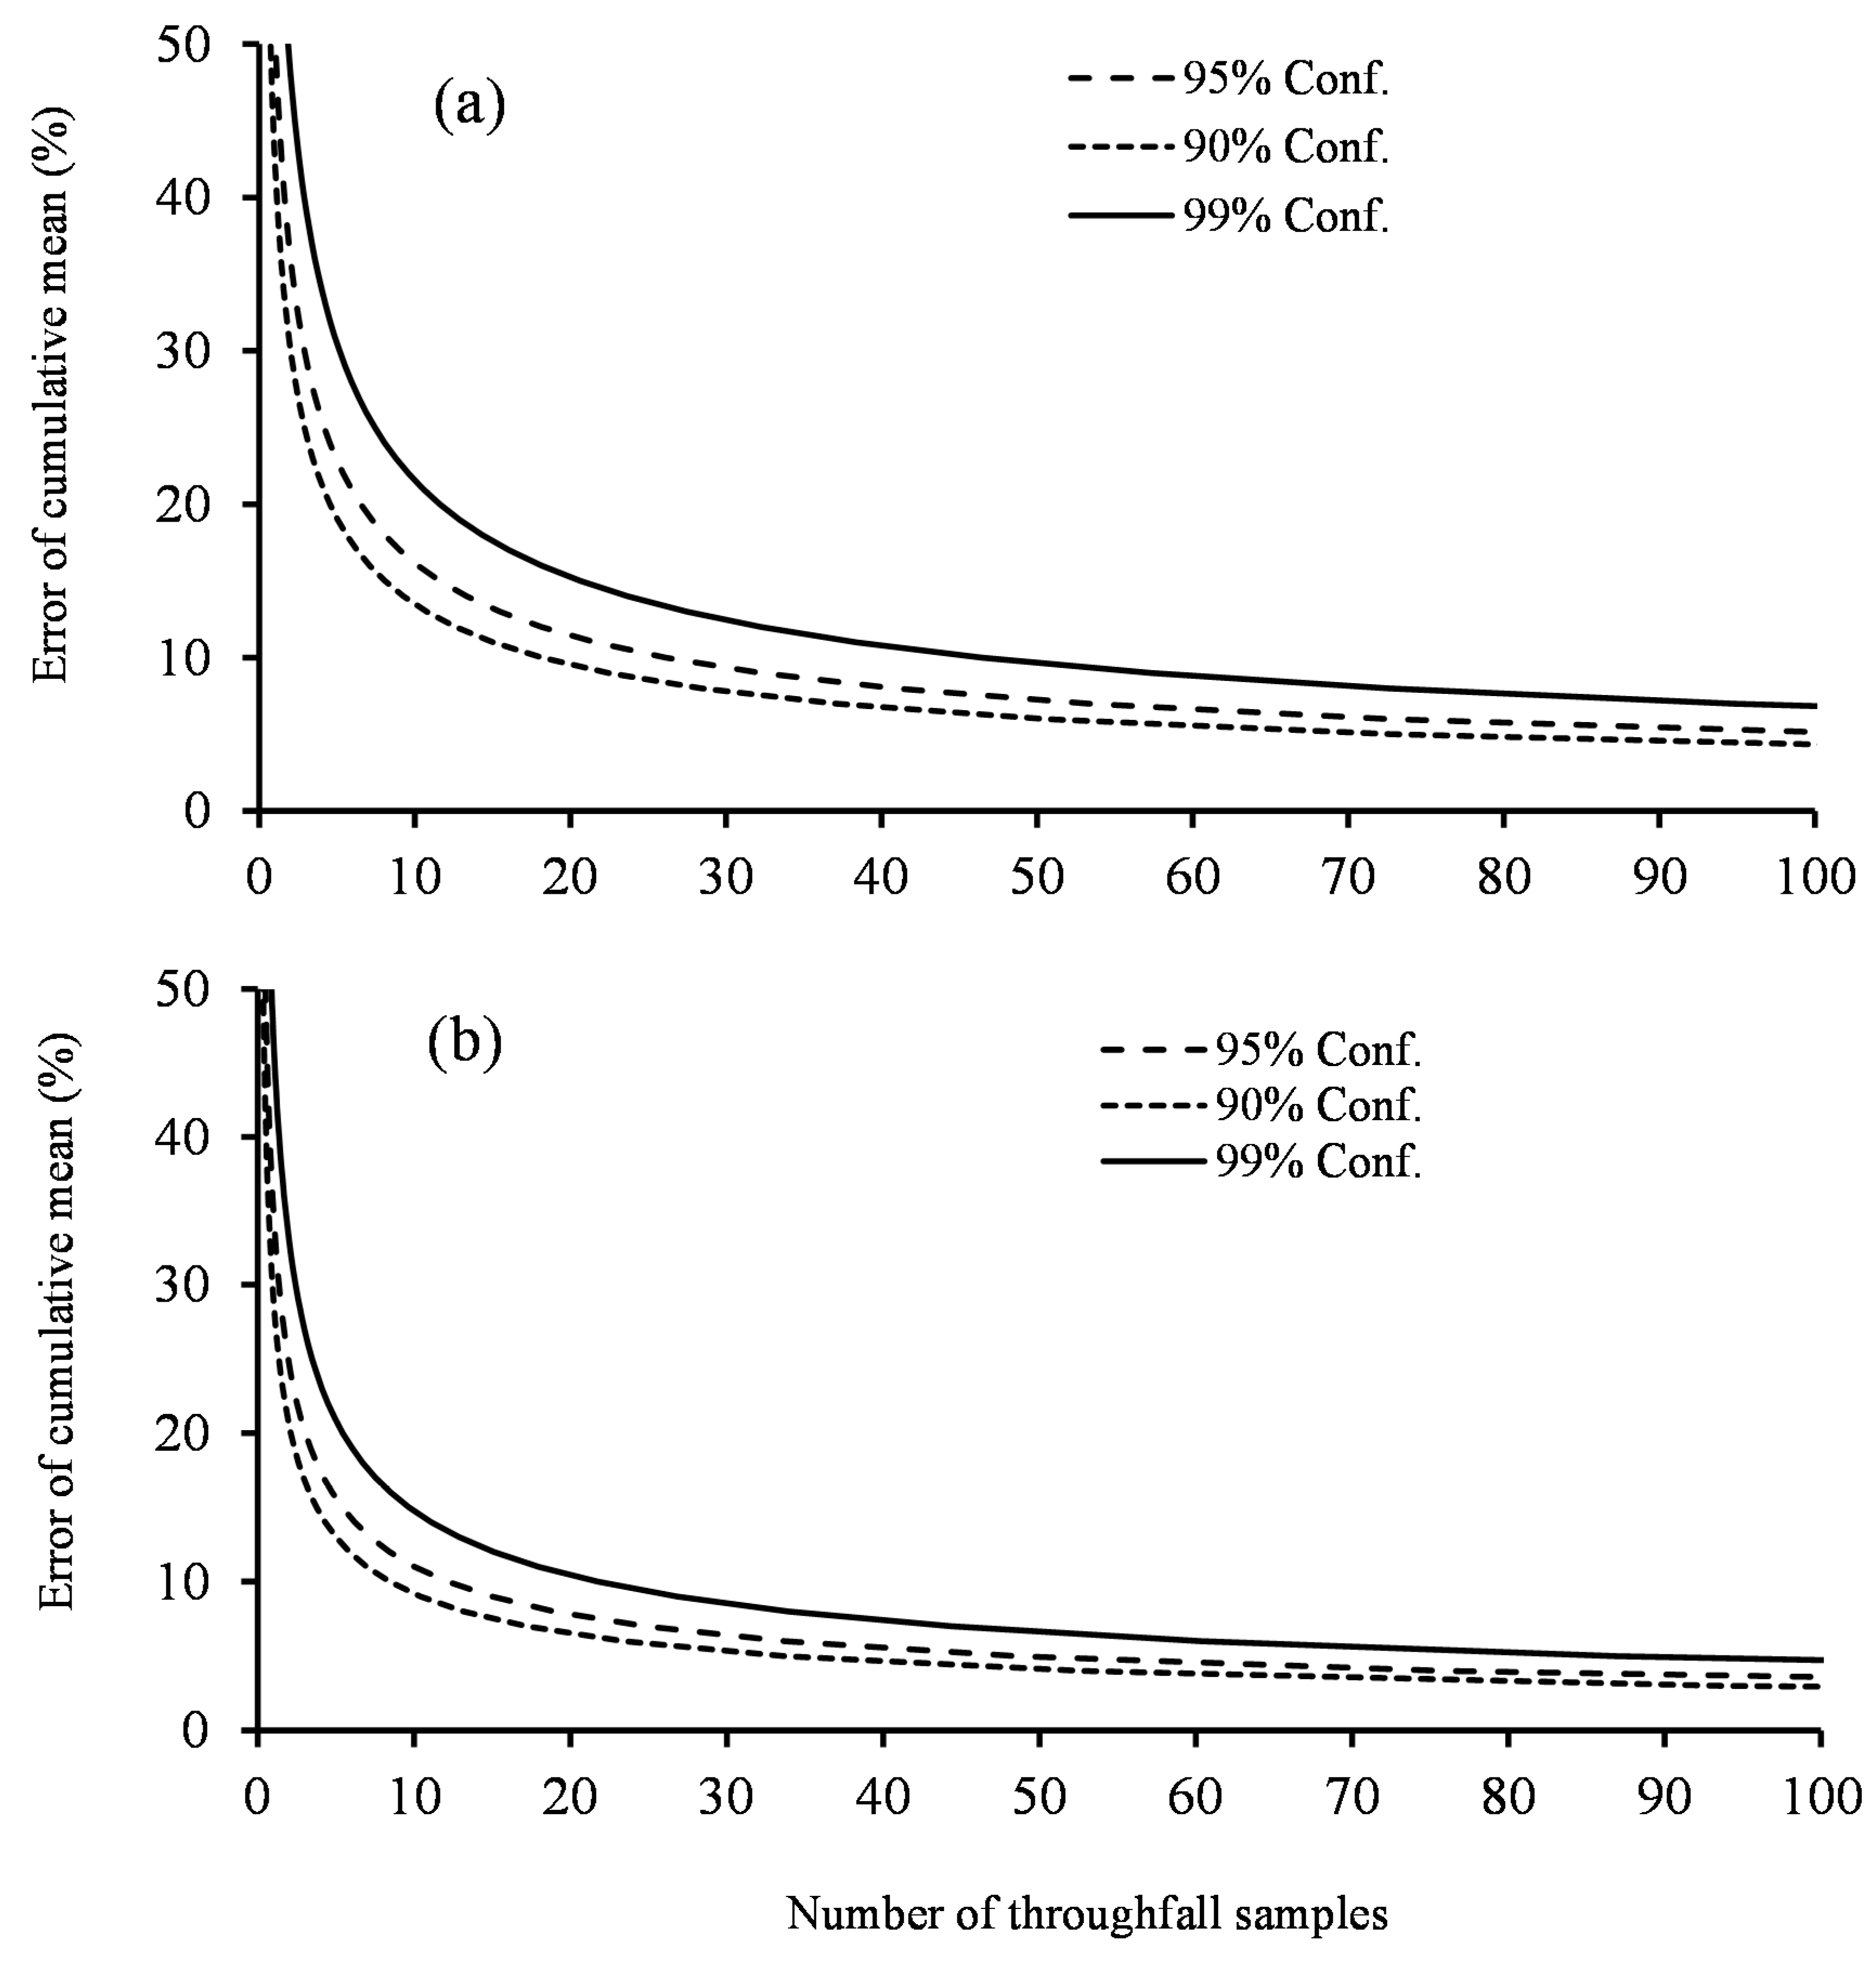
2.5. Minimum Number of Throughfall Collectors

We calculated the required number of TF collectors of our individual Q. castaneifolia tree to determine leafed and leafless TF averages with an acceptable error (5, 10, and 15% of mean cumulated TF) and confidence level (α = 0.01, 0.05, and 0.1) by assuming that the mean TF of all 50 collectors represents the true value. The minimum number of TF collectors (Nmin) required to estimate TF within a preset percentage of mean (E) at 90%, 95%, and 99% confidence interval can be estimated from coefficient of variation of TF (CVt) by the following equation [28]:
N m i n = z c 2 × C V t 2 E 2
where zc is the critical value of the 90%, 95%, and 99% confidence level.

3. Results

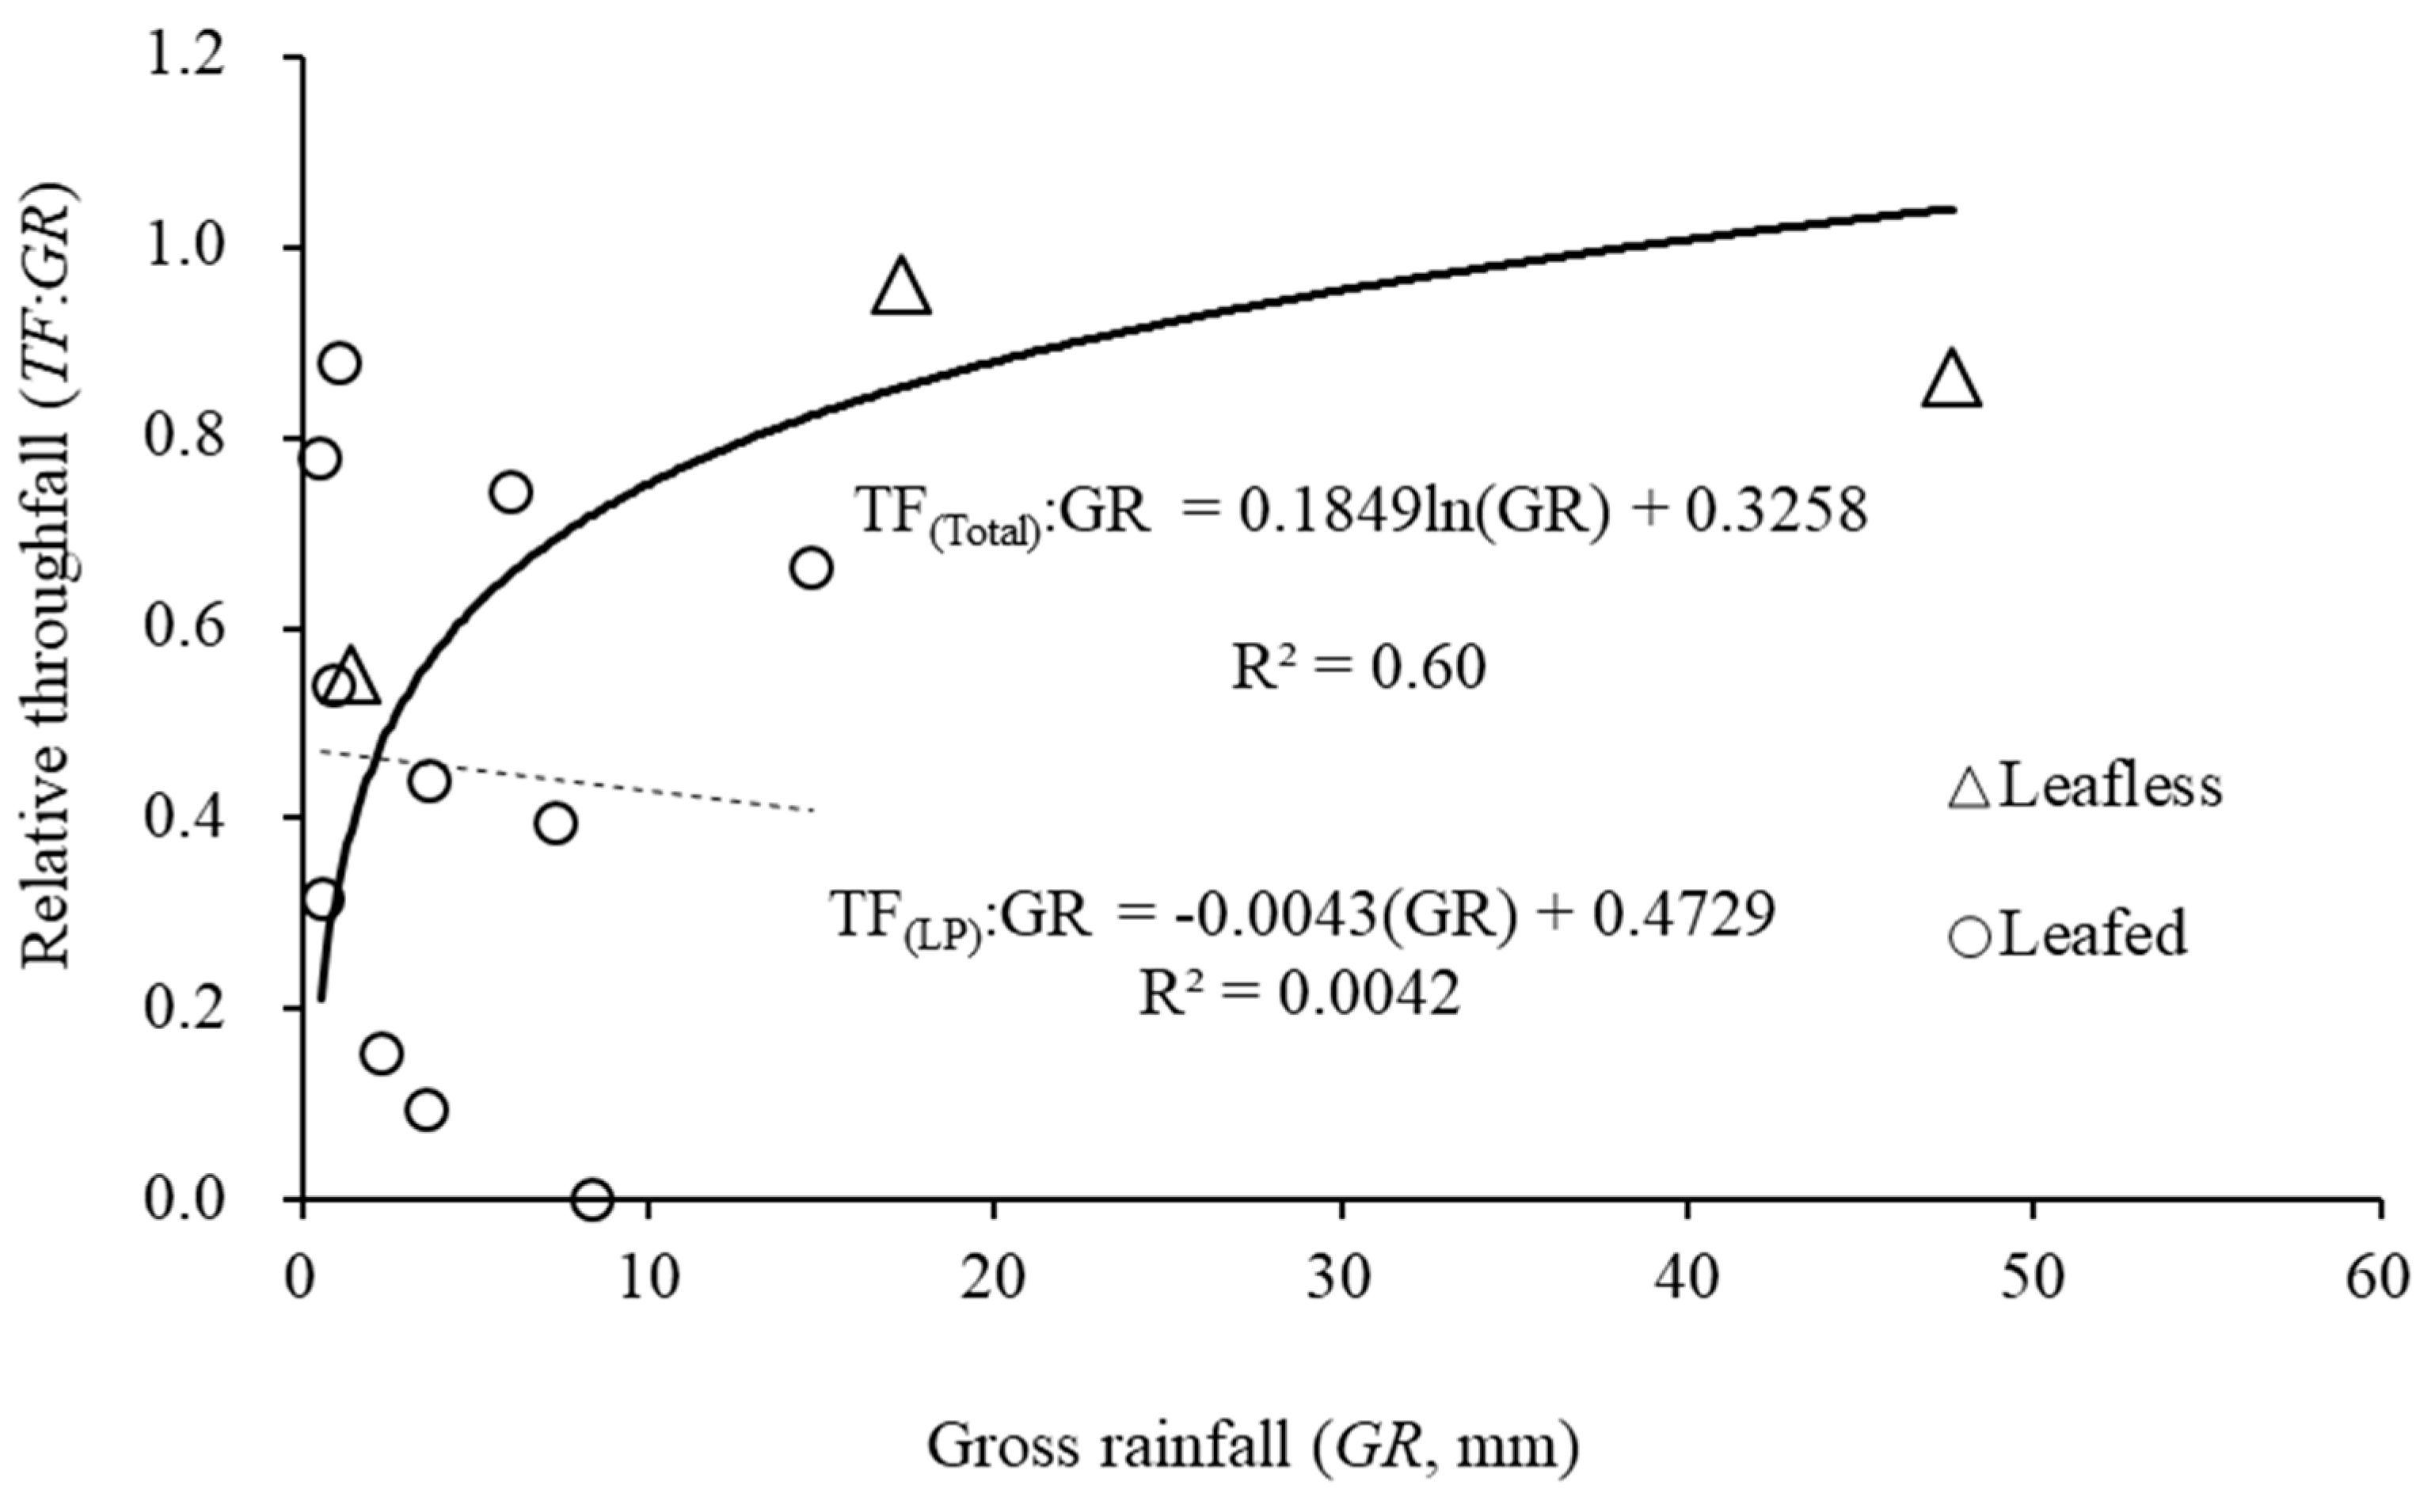
3.1. Gross Rainfall and Throughfall Characteristics

During the study period, there were 15 rainfall events. The 15 events produced a total of 116.8 mm of GR, with individual events ranging from 0.5 mm to 47.7 mm (mean rain event depth was 7.78 mm). Twelve rain storms with a cumulative depth of 50.4 mm occurred during the leafed period, while three rain events adding up to 66.4 mm were recorded in the leafless period. Of the 15 rain events, a 2.31 mm event during the leafed season did not produce any measurable TF, thus only 14 events were used for analysis. The annual, leafed and leafless TF equaled 79.9%, 69.3% and 88.0% of GR, respectively. TF of individual events ranged from 0.1 mm to 41.0 mm, accounting for 9.4% to 95.9% of individual GR. Relative TF was significantly correlated with GR (Figure 2) and was described by the formula: TF:GR = 0.1849 ln (GR) + 0.3258. Separate relationships for each phenoseason could not be derived because of the limited rainfall events during the leafless period. A weak relationship was found between relative TF and GR during the leafed period (TF(LP):GR = −0.0043 (GR) + 0.4729, R2 = 00042). A separate relationship during the leafless period could not be derived because of the limited rainfall events. Because there were larger storms during the leafless period than the leafed period, the rainfall dataset for both periods were combined in Figure 2.

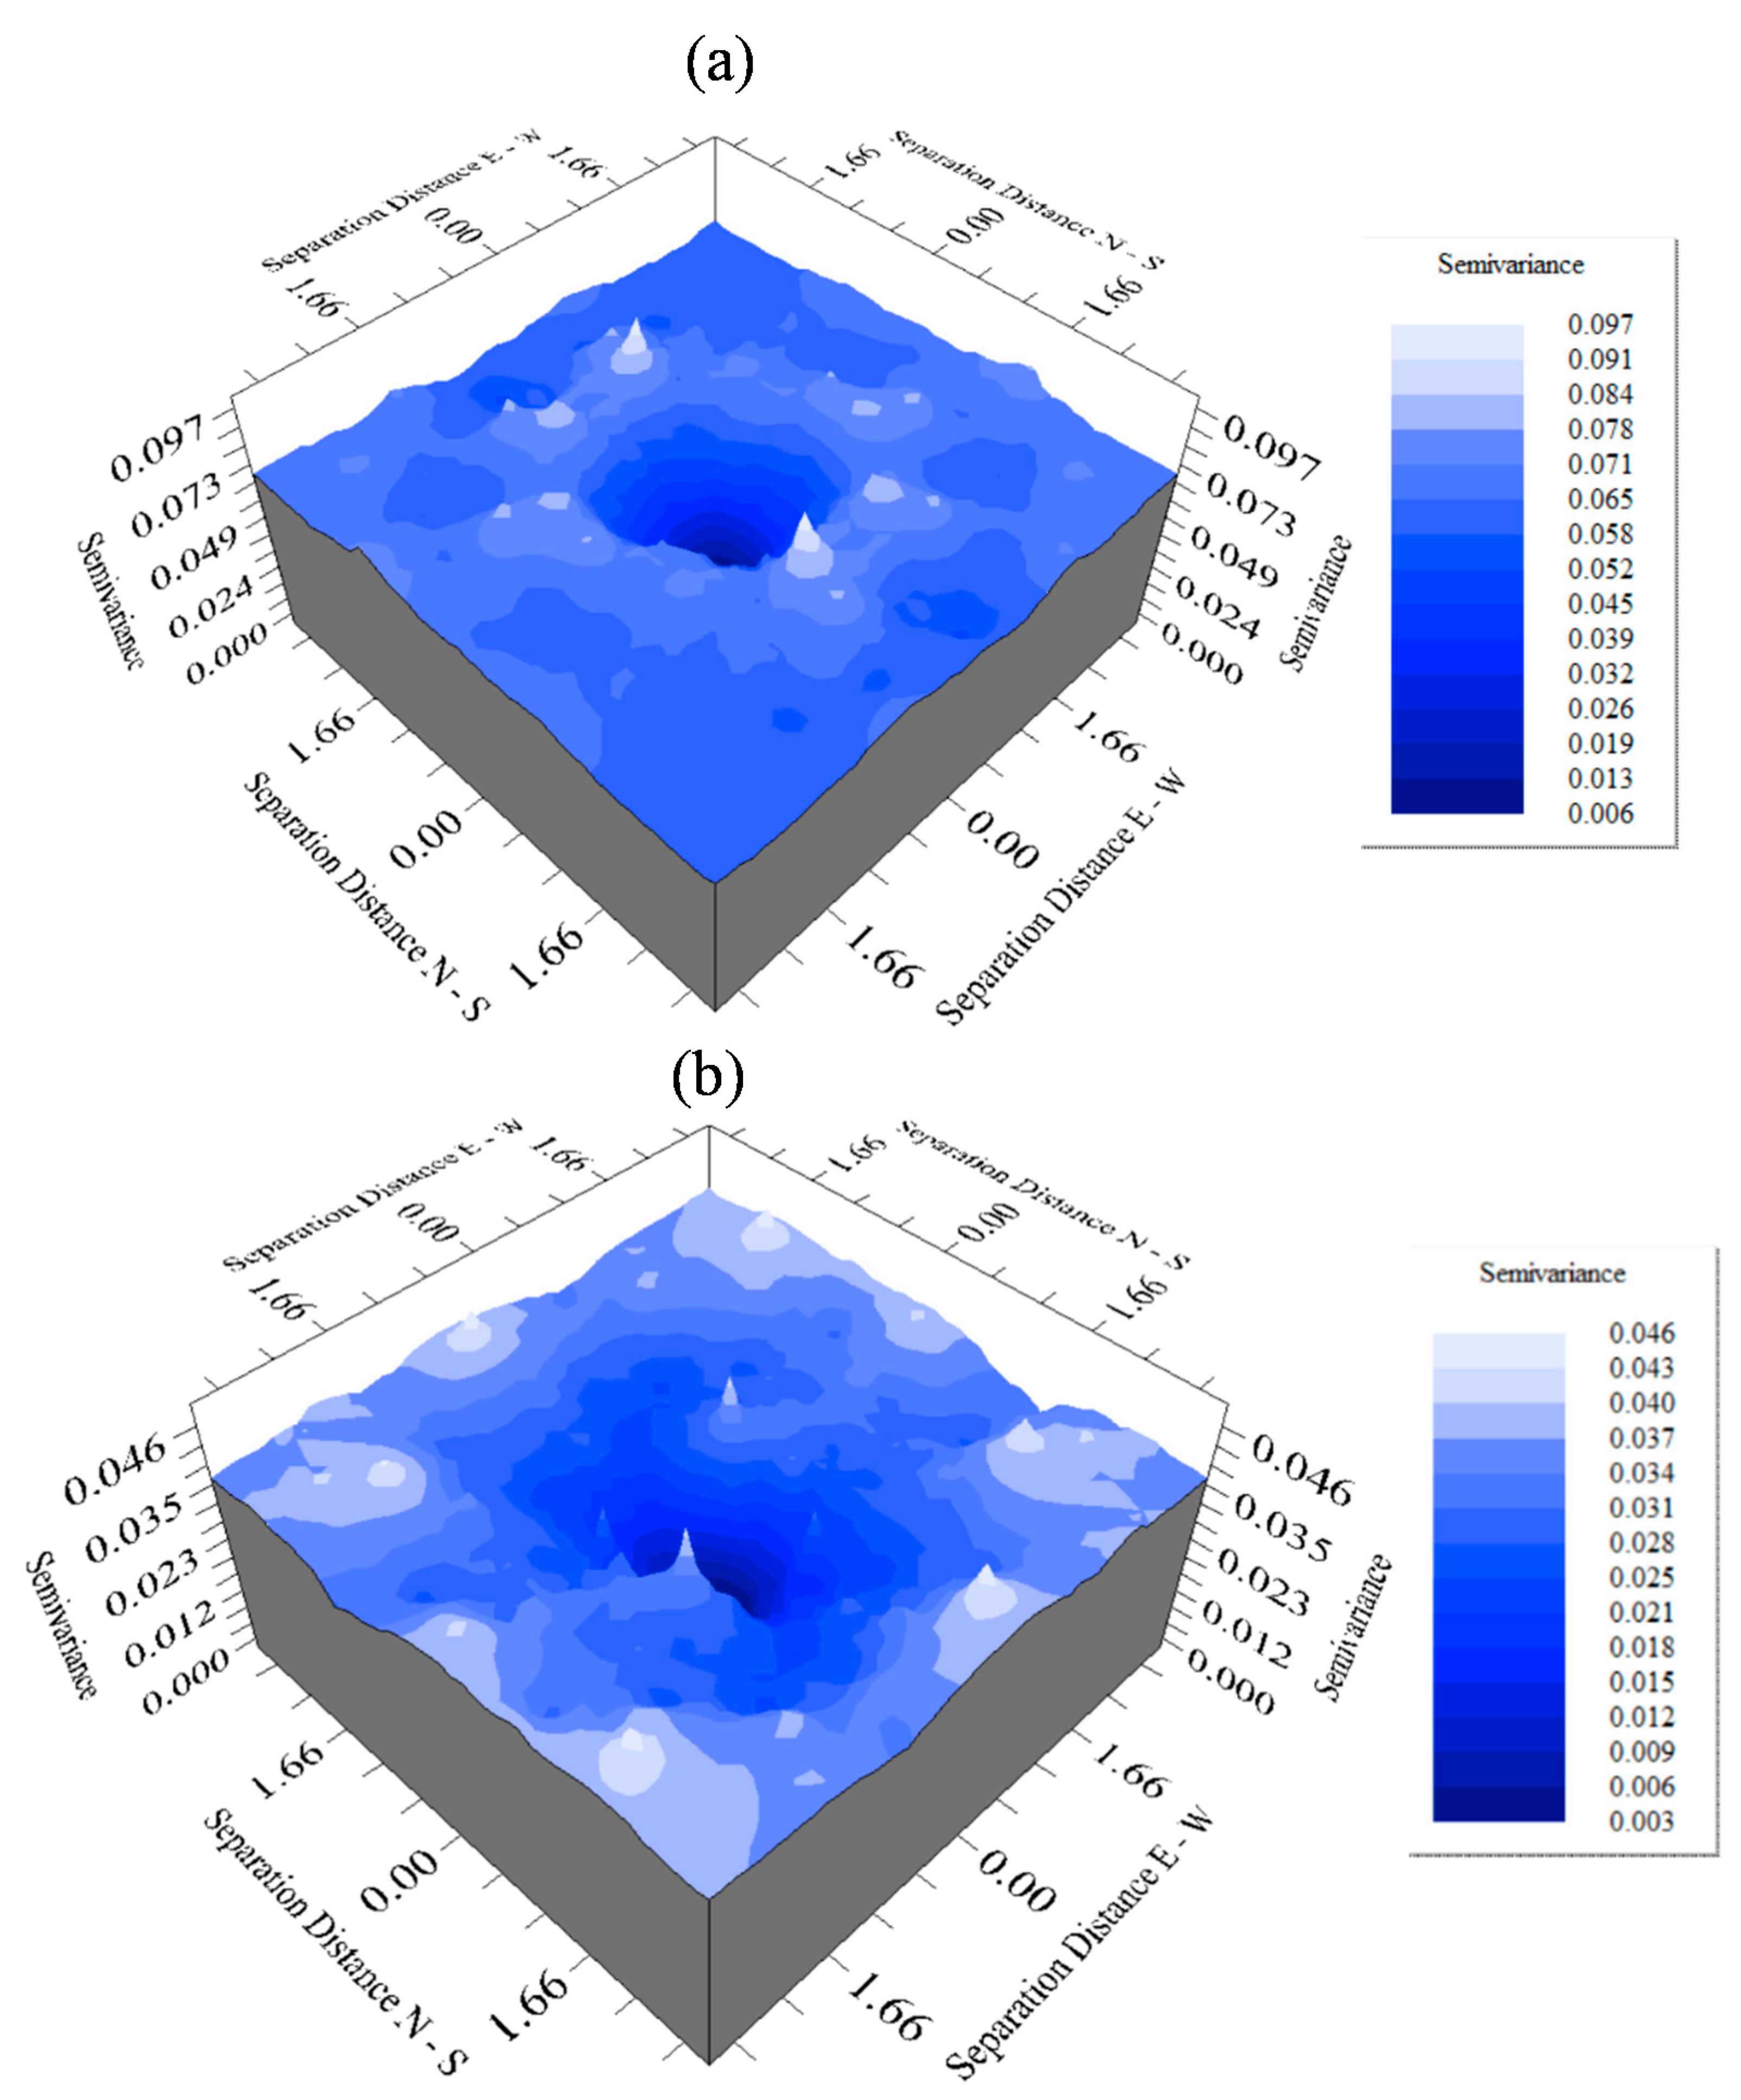
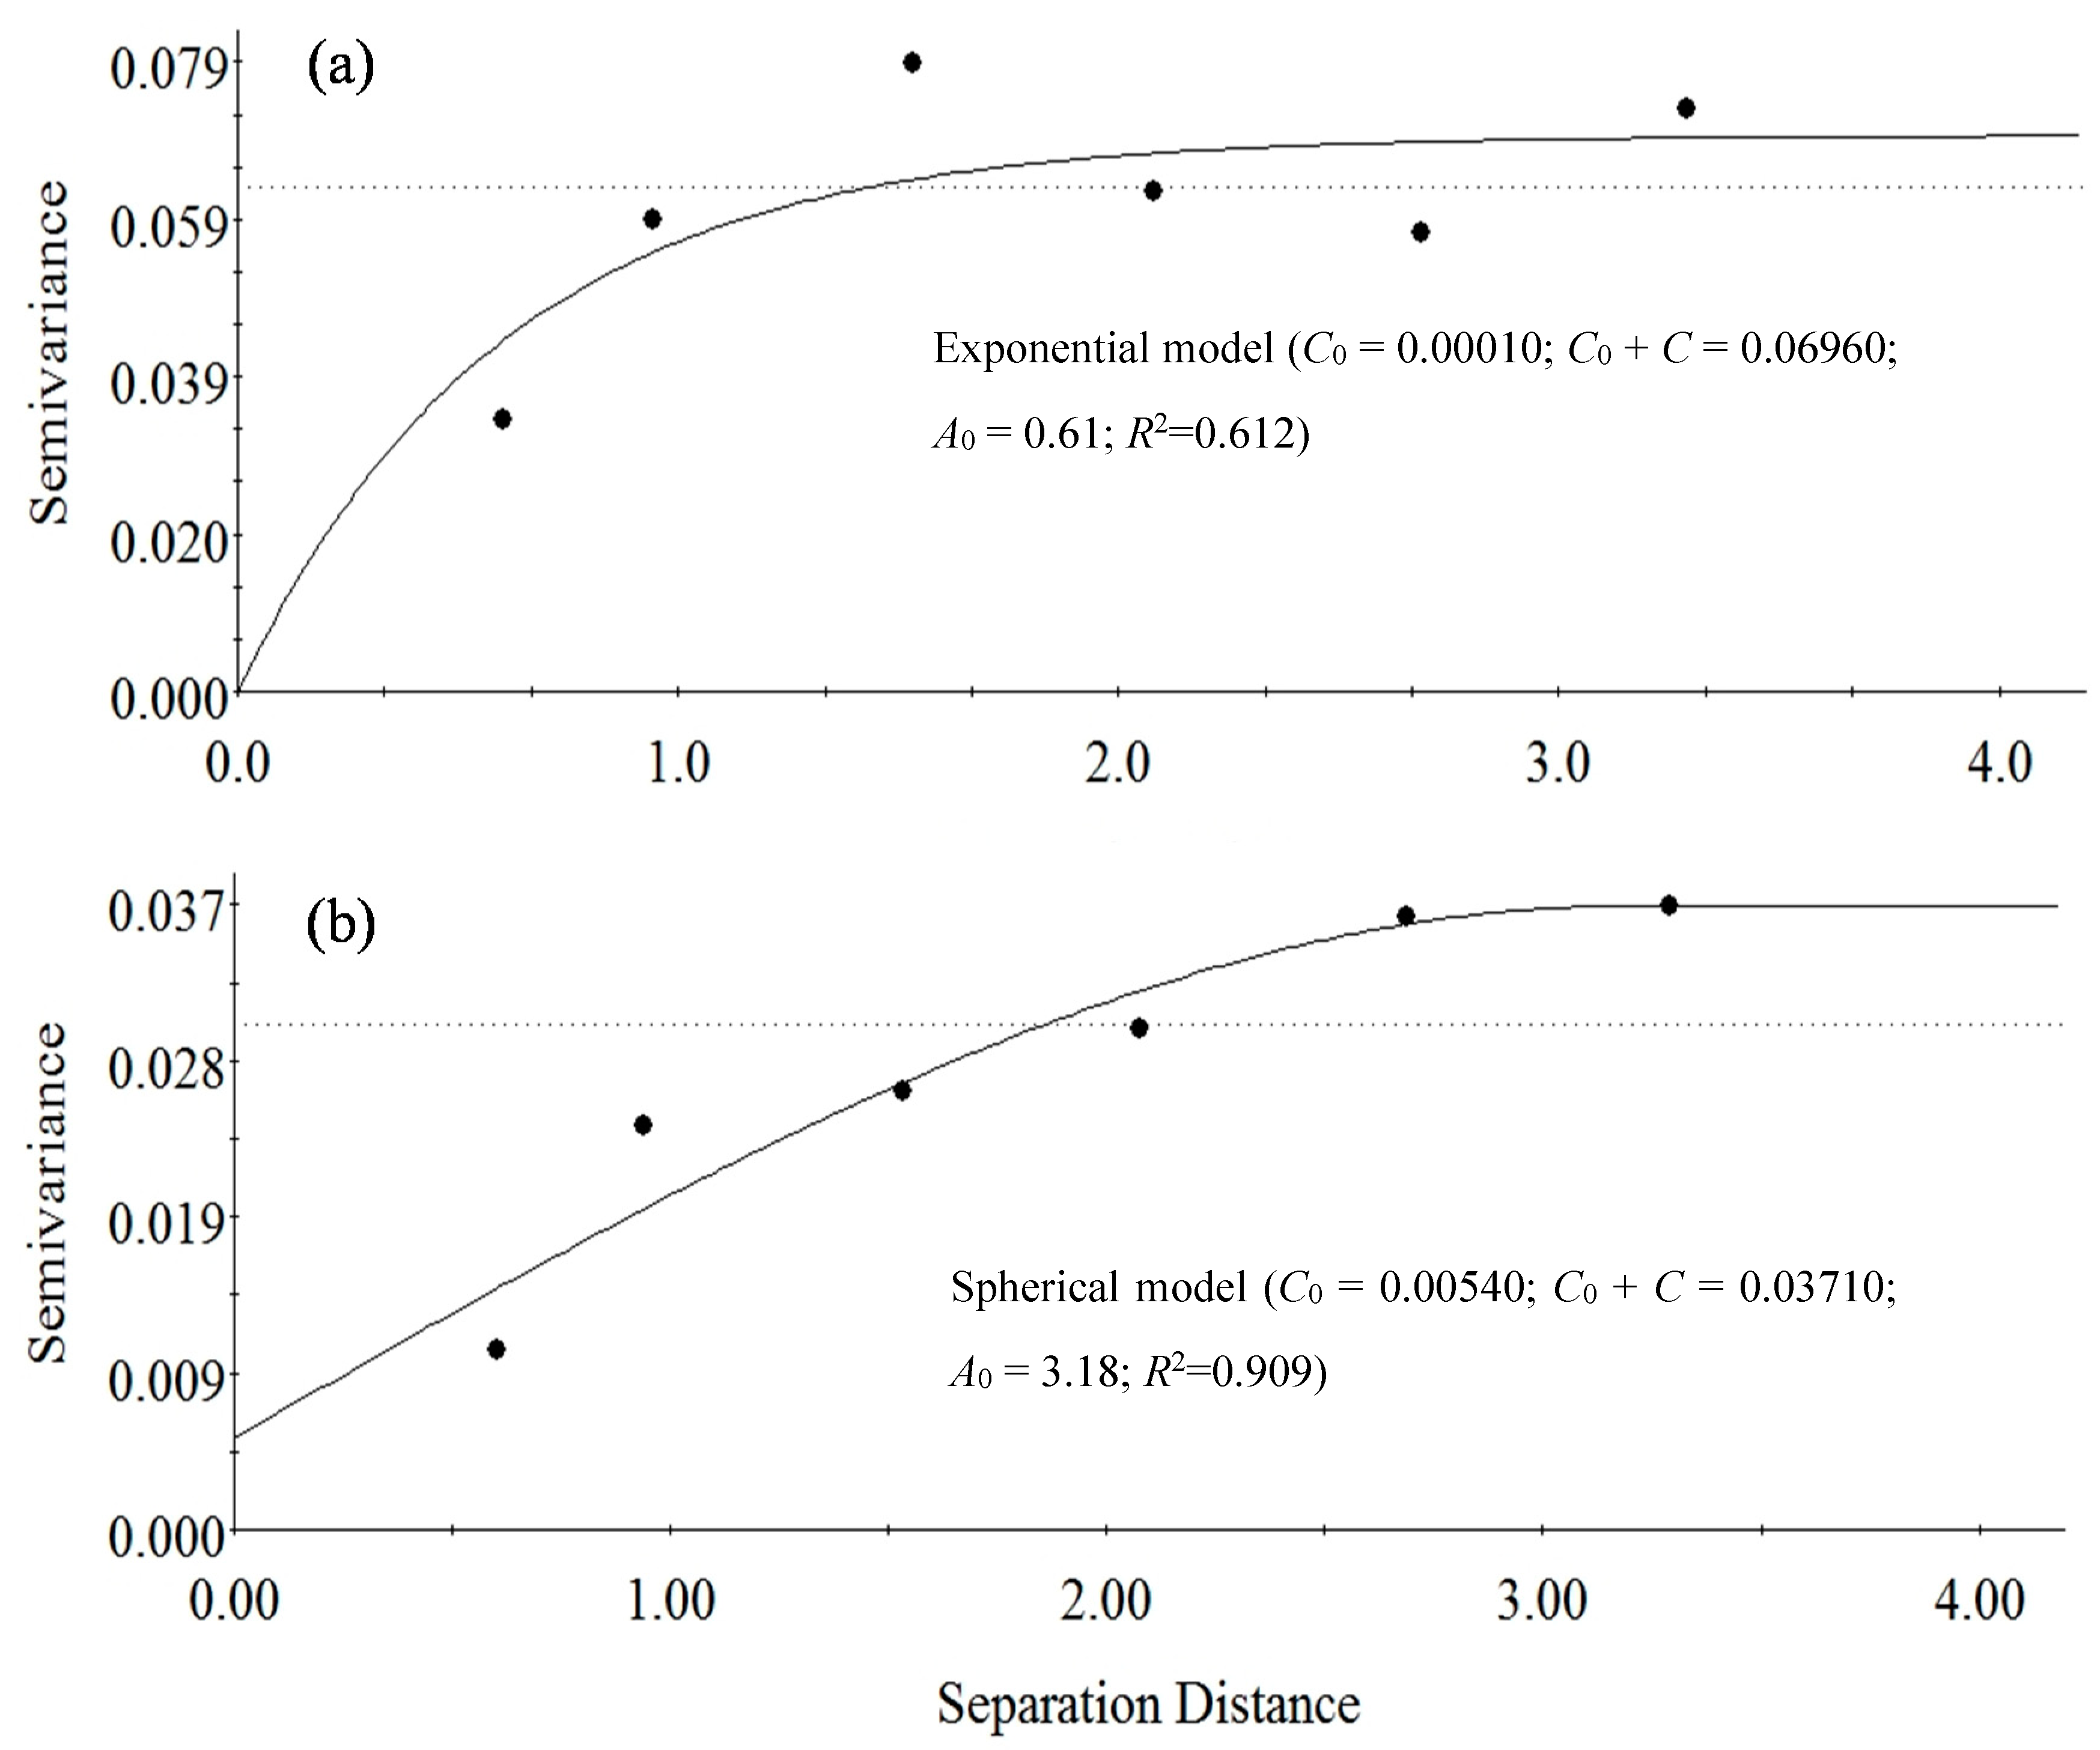
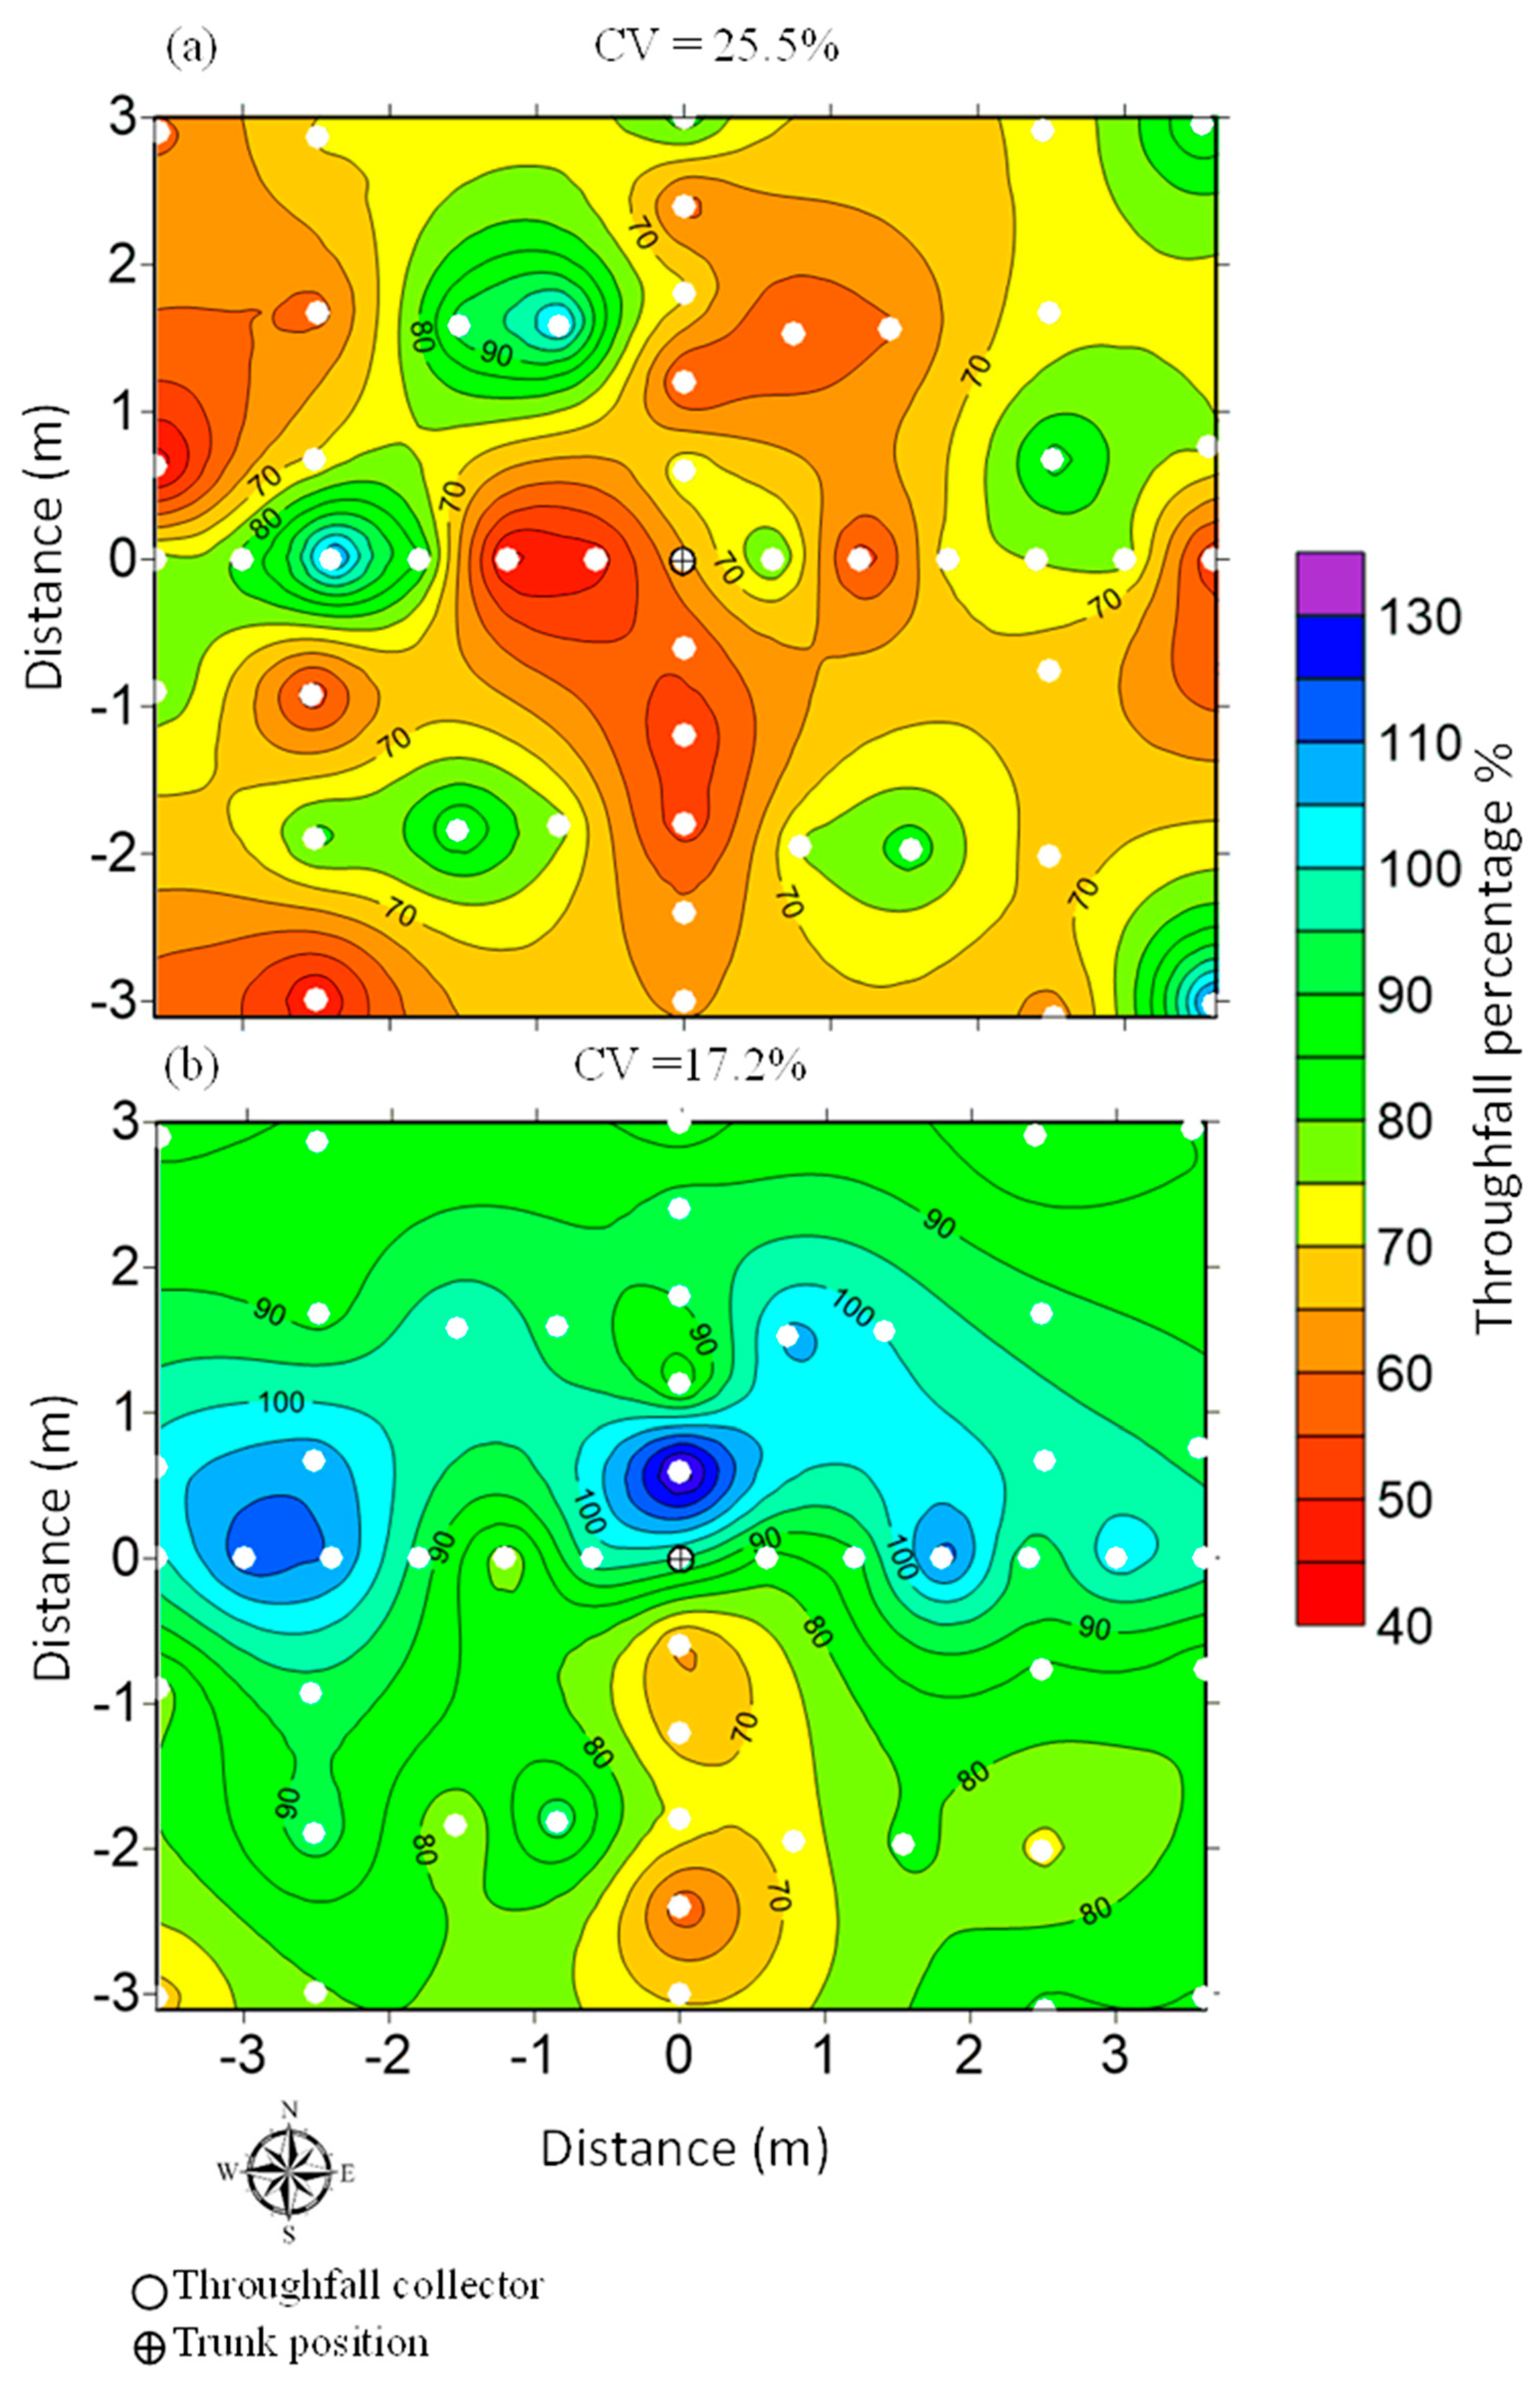
3.2. Spatial Throughfall Variability

The surface variogram maps of TF for both leafed period and leafless period showed zonal anisotropy (Figure 3). The theoretical models were fitted to discribe the change. The best-fitting model for the TF variogram in the leafed period was an exponential model. It displayed a nearly unchanged sill (C) at the range of 2–3 m (i.e., RSS= 4.828 × 10⁻⁴, C0 = 0.0001, C0 + C = 0.0696, C0/C by percenatge = 0.14, R2 = 0.612; Figure 4a). The leafless period was best fitted with a spherical model. It displayed a nearly unchanged sill at the range of 3–4 m (i.e., RSS = 4.296 × 10⁻⁵, C0 = 0.0054, C0 + C = 0.0371, C0/C by percenatge = 17.03, R2 = 0.909; Figure 4b). The low C0/C ratio for the leafed period indicates that the variation due to measurement errors and other nonspatial sources is small compared with the spatial variation in TF. We also used a cross validation to test the quality of the variogram model (Figure 5). For doing cross validation, the variogram model is used to repredict the actual observations from neighboring observations. Our results demonstrated that relative mean absolute error (RMAE) of leafed and leafless periods were 20.4% and 12.0%, respectively (Figure 5).
The kriged maps show that TF concentrated at the canopy edge during both the leafed and leafless periods (Figure 6). The coefficient of variation (CV) of kriged map for estimating TF was higher in the leafed period than leafless period (25.5% vs. 17.2%) (Figure 6).

3.3. Temporal Stability of Spatial Throughfall

Comparing the two phenoseasons, there was no significant correlation between cumulative TF of the leafed and leafless periods (rs = 0.157, p = 0.275) (Table 1). After dividing the rainfall events into three rainfall classes, at the temporal scale of cumulative TF of events, the summed TF amounts per rainfall class within the leafed period were significantly correlated with each other (Table 1). At the rain event level, a significant (p < 0.05, n = 50) and positive Spearman correlation coefficient between event TF was found for 76.4% of the pairs of events (n = 55) in the leafed periods. Of three pairs of events in the leafless period, only one pair (rs = 0.347, p < 0.05) were positively correlated to each other.
The normalized TF volumes for the leafed and leafless periods are ranked by mean values in Figure 7a,b, respectively, indicating a heterogeneous spatial distribution of TF under the canopy. The driest collector was the first in the ranking order and the wettest was the last (Figure 7). During the leafed period, some TF gauges (e.g., number 20, 26, 35, and 50) gather more TF than the mean normalized TF, which would result in relative wet points on the forest floor (Figure 7a), and at the same time, there are also some TF gauges (e.g., number 18, 30, 33, and 48) receiving less TF than the mean normalized TF, which would create dry points (Figure 7a). During the leafless period, some collectors gathered consistently lower TF than the others (e.g., number 15, 47, 16, and 12), while some gathered more TF than the others (e.g., number 1, 8, 29, and 9). The TF collectors with high and low normalized TF during the leafless period were not the same TF collectors with high and low normalized TF during the leafed period (Figure 7b).
The rank-ordered plots of TF collected from each TF gauge during the leafed period showed that TF had high temporal stability. This phenomenon was not associated with rainfall levels (Figure 8). However, some locations may change from dry points to wet points or vice versa. For example, collector 9 received less than the mean TF amount in rainfall classes < 1 mm and 1–5 mm, but received more TF than mean in rainfall class > 5 mm (Figure 8). The slope of the lines in Figure 8 increase with larger rainfall class, indicating there is greater variation in TF in rainfall events with greater TF totals.

3.4. Optimum Number of Collector for Throughfall Sampling

Confidence interval curves for leafed (Figure 9a) and leafless (Figure 9b) periods showed the that the error estimates of total TF over each sampling period decreased with increasing numbers of TF collectors. The error of the cumulative TF mean decreased as sample size increased, so that more TF collectors could reduce TF measurement error. Error magnitudes of 5%, 10%, and 15% of total TF at 95% confidence level for the leafed period required 105, 26, and 12 gauges, respectively. For the leafless period, the numbers of gauges required were 49, 12, and 5, respectively (Table 2).

4. Discussion

4.1. Throughfall Quantity during Canopy Stages

TF totals under the Q. castaneifolia canopy was about 79.9%, 69.3%, and 88.0% of gross rainfall during the annual, leafed, and leafless periods, respectively, and these values were similar to the values reported by other researchers [29,30]. Deciduous trees intercept more rainfall during the leafed period than the leafless period [31,32,33,34,35,36] with TF decreasing as leaf area increases [37,38]. During larger storms, the TF:GR ratio increased probably because the canopy storage capacity reaches the upper limit as storms size increase [29,39,40,41,42,43]. Our findings support the work of other authors that have demonstrated a decline in TF:GR as rainfall magnitude decreased [37,39,40]. The amount of TF for the small rainfall events was frequently zero [4,44]. The smaller TF totals for the small events is a result of a large portion of incident rainfall retained on the canopy, which evaporates during/after the rainfall.
As a rule, the TF:GR generally shows a rapidly decreasing trend with rainfall amount before reaching its maximum canopy storage capacity, then slows down. This justifies the use of exponential or logarithmic regression models to fit the relationships between TF:GR and rainfall magnitude than the power function model [45].

4.2. Spatio-Temporal Throughfall Variability

The kriged maps during the leafed period generally displayed high TF concentrated at the canopy edge, although there was a point of high TF near the trunk (Figure 6a). This was consistent with the finding from studies in a broadleaf-deciduous forest [46] and in a Japanese Cyprus plantation from November to June [47]. A possible explanation for this phenomenon may involve the redistribution of release throughfall, produced after splashing on the vegetative surfaces, channeling away from the trunk because of downward-inclined branches at the edge of the canopy. The branches in the lower canopy can have a higher downward-inclination angle relative to horizontal compared to the upper part of the canopy. This redistribution causes a ring of high TF values around the edge of the tree, especially during the leafed period. In the case of up-facing branches (angle close to 90° from the horizon), the rain is redistributed closer to the trunk, which might increase stemflow [48,49]. During the leafless period, the kriged map generally showed higher TF totals on the northern side of the canopy and lower TF totals on the southern side of the canopy (Figure 6b). Similar to the leafed period, a heterogeneous pattern of drip points and dry points occurred on the forest floor. The drip points likely formed under vegetative surfaces that release throughfall channeled and coalesced in the canopy before falling to the forest floor. The dry points likely represent interception barriers to direct and release TF, such as large branches or clustering of foliage. The time stability plots in Figure 7 affirm the heterogenous pattern of TF and the presence and absence of drip points, especially during the leafless period. During the leafless period, there is a sharp change in the number of throughfall collectors at the extreme wet (drip points) and dry (increased interception) range (Figure 7). Past researches tried to relate TF and position relative to tree trunks and crowns, but the results were inconsistent. Previous investigations have shown an increase in TF with increasing radial distance from the trunk [16,50]. However, other studies have shown no such relationship [19]. The inconsistent results in the relationship between TF amount and the radial distance from the trunk is due to canopy structural parameters, such as tree shape and size, the canopy roughness and depth, the branch architecture, the bark texture and leaf area index (LAI) [51].
The sill (C0 + C) decreased as the rainfall magnitude increased, indicating that a heavy rainfall event caused the spatial heterogeneity of the TF:GR to be uniform, and this finding is similar to other studies [49,52]. The CVTF was 25.5% and 17.2% during the leafed and leafless periods, respectively. These values were similar to those reported in other deciduous forests [47,53,54]. The average CVTF in this study for both phenoseasons periods was lower and more stable than that in most studies. Kato et al. [47] reported that the CVTF was 52% (from 10% to 447%) in a Japanese cypress plantation, and Shen et al. [53] found that CVTF ranged from 25% to 39% in an evergreen broadleaved forest in eastern China. For both periods, the CV of TF at the event level first sharply decreased and then began to be stable with increasing rainfall magnitude. The relationship between TF variability (expressed as CV) and rainfall magnitude had been well studied, and similar results with different threshold values have been reported in literature reviews [19,53,55,56]. This implies that rainstorms with larger magnitude would cause a less heterogeneous redistribution of rainfall beneath the canopy. Spatial variability of TF is generally considered as a consequence of rainfall interacting with the canopy [51], and this interaction are relatively large when rainstorms have a smaller magnitude, causing a higher spatial TF variability [51,57].
Temporal stability plots and kriging interpolation maps of TF implied that some deterministic factors controlled on the persistence of TF variability [20]. Our results showed that TF patterns during the leafed periods showed slightly higher stability than that during the leafless periods, which can be supported by the similar results from a deciduous stand in Northwestern USA [20], a mixed deciduous forest in Northwestern Belgium [22], and a deciduous forest in Eastern China [54]. A possible reason was that foliage states during the leafless periods were more variable, including the leaf-fall, leafless and leaf-out phenophases [38], which would result in a lower temporal stability of TF patterns [54].
Some TF gauges received higher rainfall magnitude than the gross rainfall during both periods. When rainwater passes through the Q. castaneifolia (or any tree) canopy, the rainwater intercepted by leaves and branches tends to drip from the leaf margins and other vegetative surfaces. These drops tend to focus at specific locations, resulting in a few TF measurements that are higher than the gross rainfall measurements in open areas. These concentrated canopy drip points are clearly visible in the kriged maps (Figure 6). Evidence of heterogeneous TF patterns were also observed in other forested ecosystems [55,56,57,58,59].

4.3. Minimum Number of Throughfall Gauges

As is well documented, it is difficult to estimate TF with high precision using a minimum number of collectors due to barriers satisfying the high spatial representation of TF. Kimmins [28] showed that the minimum number of funnel collectors (area = 120.7 cm2) required to obtain an effective estimate of TF was 30. Shen et al. [53] concluded that 16 funnel collectors (415 cm2) would suffice for TF estimates with an error of 10% and a 90% confidence level. Rodrigo and Àvila [60] found that the error in mean TF was around 10% with 9–11 funnel collectors (78.5 cm2). As indicated in Table 2, if the goal is to have 95% of resampled means within 10% error of the overall mean TF, 26 and 12 TF collectors should be used during the leafed and leafless periods, respectively. Based on our study results, more collectors are needed to measure TF during the leafed period than leafless period, due to the high complexity of canopy when leaves are present. The greater canopy surface area with leaves provided opportunities for the presence of more drip points, as demonstrated in the kriged maps during the leafed period compared with the leafless period (Figure 6). Some research has considered that a lower number of collectors could be used to estimate the volume of TF, accepting nevertheless a higher margin of error [61]. Our results demonstrated that a much larger number of TF gauges are necessary to accurately sample rainfall events with lower precipitation volumes than rainfall events with higher precipitation volumes, which is again consistent with previous findings [8,62,63]. There are many reasons for the different minimum numbers of TF collectors that were reported in the different research sites. In addition to the influence of tree species, the difference in the size of TF collectors also may be a major factor in the different minimum numbers of collectors [48]. The measured TF of small collectors are easily influenced by outliers, so if there is a need to minimize the number of TF collectors, the capture area of each TF collectors should be large.

5. Conclusions

Our study advances the understanding of throughfall characteristics in Quercus castaneifolia and provides data for the under-investigated Hyrcanian temperate forests. The successful long-term management of forestry projects in the region requires consideration of TF values, as one of the main water inputs into the system. According to our results, the annual TF quantity under the Q. castaneifolia canopy accounted for 79.9% of gross rainfall, and phenoseason can profoundly influence TF patterns. TF dramatically differed between the leafed and leafless periods, with leaflessness resulting in a 53% increase of TF. This huge disparity should be considered in water resource management. The kriged maps showed that TF concentrated toward the canopy edge during both the leafed and leafless periods. Forest managers should consider the influence of the water balance on tree growth and survival and consider local and distant irrigation needs that rely on rainfall recharging the aquifer in the leafed and leafless periods. TF patterns were highly stable in both of the leafed and leafless periods. On account of the higher canopy complexity during the leafed period, TF temporal patterns were more stable than that during the leafless period. Therefore, more collectors are required to estimate TF during the leafed period compared to the leafless period.
TF quantity under the Q. castaneifolia canopy was 69.3% and 88.0% of gross rainfall during leafed and leafless periods, respectively. Phenoseason influenced TF distribution patterns. TF temporal patterns during the leafed period were slightly more stable than during the leafless periods. We found twenty-six and twelve collectors were needed to yield the minimum representative mean TF with accepted errors of 10% at 95% confidence level for leafed and leafless periods, respectively.

Author Contributions

O.F. conceived the idea and performed the experiment. O.F. and L.S. analyzed data. L.S., O.F., C.D.H., and S.M.M.S. wrote the manuscript. All authors have read and agreed to the published version of the manuscript.

Funding

This work was supported by the National Natural Science Foundation of China (41807158). The authors thankfully acknowledge the University of Tabriz for providing a project grant. We would like to thank Tim Treuer at Princeton University for his assistance with English language and grammatical editing.

Conflicts of Interest

The authors declare no conflict of interest.

References

  1. Fan, Y.; Meijide, A.; Lawrence, D.M.; Roupsard, O.; Carlson, K.M.; Chen, H.Y.; Röll, A.; Niu, F.; Knohl, A. Reconciling Canopy Interception Parameterization and Rainfall Forcing Frequency in the Community Land Model for Simulating Evapotranspiration of Rainforests and Oil Palm Plantations in Indonesia. J. Adv. Model. Earth Syst. 2019, 11, 732–751. [Google Scholar] [CrossRef] [Green Version]
  2. Su, L.; Zhao, C.; Xu, W.; Xie, Z. Hydrochemical Fluxes in Bulk Precipitation, Throughfall, and Stemflow in a Mixed Evergreen and Deciduous Broadleaved Forest. Forests 2019, 10, 507. [Google Scholar] [CrossRef] [Green Version]
  3. Levia, D.F.; Nanko, K.; Amasaki, H.; Giambelluca, T.W.; Hotta, N.; Iida, S.; Mudd, R.G.; Nullet, M.A.; Sakai, N.; Shinohara, Y.; et al. Throughfall partitioning by trees. Hydrol. Process. 2019, 33, 1698–1708. [Google Scholar] [CrossRef] [Green Version]
  4. Sadeghi, S.M.M.; Gordon, A.; Van Stan, J.T. A Global Synthesis of Throughfall and Stemflow Hydrometeorology. In Precipitation Partitioning by Vegetation: A Global Synthesis; Van Stan, J.T., Gutmann, E., Friesen, J., Eds.; Springer: Berlin/Heidelberg, Germany, 2020; pp. 49–70. [Google Scholar]
  5. Van Stan, J.T.; Gordon, D.A. Mini-review: Stemflow as a resource limitation to near-stem soils. Front. Plant Sci. 2019, 9, 248. [Google Scholar] [CrossRef] [Green Version]
  6. Su, L.; Xie, Z.; Xu, W.; Zhao, C. Variability of throughfall quantity in a mixed evergreen-deciduous broadleaved forest in central China. J. Hydrol. Hydromech. 2019, 67, 225–231. [Google Scholar] [CrossRef] [Green Version]
  7. Konishi, S.; Tani, M.; Kosugi, Y.; Takanashi, S.; Sahat, M.M.; Nik, A.R.; Niiyama, K.; Okuda. Characteristics of spatial distribution of throughfall in a lowland tropical rainforest, Peninsular Malaysia. For. Ecol. Manag. 2006, 224, 19–25. [Google Scholar] [CrossRef]
  8. Zimmermann, B.; Zimmermann, A.; Lark, R.M.; Elsenbeer, H. Sampling procedures for throughfall monitoring: A simulation study. Water Resour. Res. 2010, 46, W01503. [Google Scholar] [CrossRef] [Green Version]
  9. Carlyle-Moses, D.E.; Lishman, C.E.; McKee, A.J. A preliminary evaluation of throughfall sampling techniques in a mature coniferous forest. J. For. Res. 2014, 25, 407–413. [Google Scholar] [CrossRef]
  10. Wullaert, H.; Pohlert, T.; Boy, J.; Valarezo, C.; Wilcke, W. Spatial throughfall heterogeneity in a montane rain forest in Ecuador: Extent, temporal stability and drivers. J. Hydrol. 2009, 377, 71–79. [Google Scholar] [CrossRef]
  11. Lloyd, C.R.; de Marques, F. Spatial variability of throughfall and stemflow measurements in Amazonian Rainforest. Agric. For. Meteorol. 1988, 42, 63–73. [Google Scholar] [CrossRef]
  12. Holwerda, F.; Scatena, F.N.; Bruijnzeel, L.A. Throughfall in a Puerto Rican lower montane rain forest: A comparison of sampling strategies. J. Hydrol. 2006, 327, 592–602. [Google Scholar] [CrossRef]
  13. Fan, J.; Oestergaard, K.T.; Guyot, A.; Lockington, D.A. Measuring and modeling rainfall interception losses by a native Banksia woodland and an exotic pine plantation in subtropical coastal Australia. J. Hydrol. 2014, 515, 156–165. [Google Scholar] [CrossRef]
  14. Ford, E.D.; Deans, J.D. The effects of canopy structure on stemflow, throughfall and interception loss in a young Sitka spruce plantation. J. Appl. Ecol. 1978, 15, 905–917. [Google Scholar] [CrossRef]
  15. Herwitz, S.R. Raindrop impact and water flow on the vegetative surfaces of trees and the effects on stemflow and throughfall generation. Earth Surf. Proc. Land 1987, 12, 425–432. [Google Scholar] [CrossRef]
  16. Johnson, R.C. The interception, throughfall and stemflow in a forest in highland Scotland and the comparison with other upland forests in the U.K. J. Hydrol. 1990, 118, 281–287. [Google Scholar] [CrossRef]
  17. Beier, C.; Hansen, K.; Gundersen, P. Spatial variability of throughfall fluxes in a spruce forest. Environ. Poll. 1993, 81, 257–267. [Google Scholar] [CrossRef]
  18. Whelan, M.J.; Sanger, L.J.; Baker, M.; Anderson, J.M. Spatial patterns of throughfall and mineral ion deposition in a lowland Norway spruce (Picea abies) plantation at the plot scale. Atmos. Environ. 1998, 32, 3493–3501. [Google Scholar] [CrossRef]
  19. Loustau, D.; Berbigier, P.; Granier, A.; Moussa, F.E.H. Interception loss, throughfall and stemflow in a maritime pine stand. I. Variability of throughfall and stemflow beneath the pine canopy. J. Hydrol. 1992, 138, 449–467. [Google Scholar] [CrossRef]
  20. Keim, R.F.; Skaugset, A.E.; Weiler, M. Temporal persistence of spatial patterns in throughfall. J. Hydrol. 2005, 314, 263–274. [Google Scholar] [CrossRef]
  21. Fathizadeh, O.; Attarod, P.; Keim, R.F.; Stein, A.; Amiri, G.Z.; Darvishsefat, A.A. Spatial heterogeneity and temporal stability of throughfall under individual Quercus brantii trees. Hydrol. Process. 2014, 28, 1124–1136. [Google Scholar] [CrossRef]
  22. Staelens, J.; De Schrijver, A.; Verheyen, K.; Verhoest, N.E. Spatial variability and temporal stability of throughfall deposition under beech (Fagus sylvatica L.) in relationship to canopy structure. Environ. Poll. 2006, 142, 254–263. [Google Scholar] [CrossRef] [PubMed]
  23. Haghshenas, M.; Mohadjer, M.R.M.; Attarod, P.; Pourtahmasi, K.; Feldhaus, J.; Sadeghi, S.M.M. Climate effect on tree-ring widths of Fagus orientalis in the Caspian forests, northern Iran. For. Sci. Technol. 2016, 12, 176–182. [Google Scholar]
  24. Deljouei, A.; Sadeghi, S.M.M.; Abdi, E.; Bernhardt-Römermann, M.; Pascoe, E.L.; Marcantonio, M. The impact of road disturbance on vegetation and soil properties in a beech stand, Hyrcanian forest. Eur. J. For. Res. 2018, 137, 759–770. [Google Scholar] [CrossRef]
  25. Deljouei, A.; Abdi, E.; Schwarz, M.; Majnounian, B.; Sohrabi, H.; Dumroese, R.K. Mechanical characteristics of the fine roots of two broadleaved tree species from the Temperate Caspian Hyrcanian Ecoregion. Forests 2020, 11, 345. [Google Scholar] [CrossRef] [Green Version]
  26. Rouhi-Moghaddam, E.; Hosseini, S.M.; Ebrahimi, E.; Tabari, M.; Rahmani, A. Comparison of growth, nutrition and soil properties of pure stands of Quercus castaneifolia and mixed with Zelkova carpinifolia in the Hyrcanian forests of Iran. For. Ecol. Manag. 2008, 255, 1149–1160. [Google Scholar] [CrossRef]
  27. Azaryan, M.; MarviMohadjer, M.R.; Etemad, V.; Shirvany, A.; Sadeghi, S.M.M. Morphological characteristics of old trees in Hyrcanian forest (Case study: Pattom and Namkhaneh districts, Kheyrud). J. For. Wood Prod. 2015, 68, 47–59. [Google Scholar]
  28. Kimmins, J.P. Some statistical aspects of sampling throughfall precipitation in nutrient cycling studies in British Columbian coastal forests. Ecology 1973, 54, 1008–1019. [Google Scholar] [CrossRef]
  29. Fathizadeh, O.; Attarod, P.; Pypker, T.G.; Darvishsefat, A.A.; Amiri, G.Z. Seasonal variability of rainfall interception and canopy storage capacity measured under individual oak (Quercus brantii) trees in Western Iran. J. Agric. Sci. Technol. 2013, 15, 175–188. [Google Scholar]
  30. Sadeghi, S.M.M.; Attarod, P.; Pypker, T.G. Differences in rainfall interception during the growing and non-growing seasons in a Fraxinus rotundifolia Mill. plantation located in a semiarid climate. J. Agric. Sci. Technol. 2015, 17, 145–156. [Google Scholar]
  31. Staelens, J.; De Schrijver, A.; Verheyen, K.; Verhoest, N.E.C. Rainfall partitioning into throughfall, stemflow, and interception within a single beech (Fagus sylvatica L.) canopy: Influence of foliation, rain event characteristics, and meteorology. Hydrol. Process. 2008, 22, 33–45. [Google Scholar] [CrossRef]
  32. Mużyło, A.; Llorens, P.; Domingo, F. Rainfall partitioning in a deciduous forest plot in leafed and leafless periods. Ecohydrology 2012, 5, 759–767. [Google Scholar] [CrossRef]
  33. Sadeghi, S.M.M.; Van Stan II, J.T.; Pypker, T.G.; Friesen, J. Canopy hydrometeorological dynamics across a chronosequence of a globally invasive species, Ailanthus altissima (Mill., tree of heaven). Agric. For. Meteorol. 2017, 240, 10–17. [Google Scholar] [CrossRef]
  34. Fathizadeh, O.; Hosseini, S.M.; Zimmermann, A.; Keim, R.F.; Boloorani, A.D. Estimating linkages between forest structural variables and rainfall interception parameters in semi-arid deciduous oak forest stands. Sci. Total Environ. 2017, 601, 1824–1837. [Google Scholar] [CrossRef] [PubMed]
  35. Fathizadeh, O.; Hosseini, S.M.; Keim, R.F.; Boloorani, A.D. A seasonal evaluation of the reformulated Gash interception model for semi-arid deciduous oak forest stands. For. Ecol. Manag. 2018, 409, 601–613. [Google Scholar] [CrossRef]
  36. Hakimi, L.; Sadeghi, S.M.M.; Van Stan, J.T.; Pypker, T.G.; Khosropour, E. Management of pomegranate (Punica granatum) orchards alters the supply and pathway of rain water reaching soils in an arid agricultural landscape. Agric. Ecosyst. Environ. 2018, 259, 77–85. [Google Scholar] [CrossRef]
  37. Sadeghi, S.M.M.; Attarod, P.; Van Stan, J.T.; Pypker, T.G. The importance of considering rainfall partitioning in afforestation initiatives in semiarid climates: A comparison of common planted tree species in Tehran, Iran. Sci. Total Environ. 2016, 568, 845–855. [Google Scholar] [CrossRef]
  38. Sadeghi, S.M.M.; Van Stan, J.T.; Pypker, T.G.; Tamjidi, J.; Friesen, J.; Farahnaklangroudi, M. Importance of transitional leaf states in canopy rainfall partitioning dynamics. Eur. J. For. Res. 2018, 137, 121–130. [Google Scholar] [CrossRef]
  39. Sadeghi, S.M.M.; Attarod, P.; Pypker, T.G.; Dunkerley, D. Is canopy interception increased in semiarid tree plantations? evidence from a field investigation in Tehran, Iran. Turk. J. Agric. For. 2014, 38, 792–806. [Google Scholar] [CrossRef]
  40. Abbasian, P.; Attarod, P.; Sadeghi, S.M.M.; Van Stan, J.T.; Hojjati, S.M. Throughfall nutrients in a degraded indigenous Fagus orientalis forest and a Picea abies plantation in the of North of Iran. For. Syst. 2015, 24, 1–10. [Google Scholar] [CrossRef] [Green Version]
  41. Attarod, P.; Sadeghi, S.M.M.; Pypker, T.G.; Bagheri, H.; Bagheri, M.; Bayramzadeh, V. Needle-leaved trees impacts on rainfall interception and canopy storage capacity in an arid environment. New For. 2015, 46, 339–355. [Google Scholar] [CrossRef]
  42. Attarod, P.; Sadeghi, S.M.M.; Pypker, T.G.; Bayramzadeh, V. Oak trees decline; a sign of climate variability impacts in the west of Iran. Casp. J. Environ. Sci. 2017, 15, 373–384. [Google Scholar]
  43. Nazari, M.; Sadeghi, S.M.M.; Van Stan, J.T.; Chaichi, M.R. Rainfall interception and redistribution by maize farmland in central Iran. J. Hydrol. Reg. Stud. 2020, 27, 100656. [Google Scholar] [CrossRef]
  44. Horton, R.E. Rainfall Interception. Mon. Weather. Rev. 1919, 47, 608–623. [Google Scholar] [CrossRef]
  45. Sheng, H.; Cai, T. Influence of Rainfall on Canopy Interception in Mixed Broad-Leaved—Korean Pine Forest in Xiaoxing’an Mountains, Northeastern China. Forests 2019, 10, 248. [Google Scholar] [CrossRef] [Green Version]
  46. Hsueh, Y.; Allen, S.T.; Keim, R.F. Fine-scale spatial variability of throughfall amount and isotopic composition under a hardwood forest canopy. Hydrol. Process. 2016, 30, 1796–1803. [Google Scholar] [CrossRef]
  47. Kato, H.; Onda, Y.; Nanko, K.; Gomi, T.; Yamanaka, T.; Kawaguchi, S. Effect of canopy interception on spatial variability and isotopic composition of throughfall in Japanese cypress plantations. J. Hydrol. 2013, 504, 1–11. [Google Scholar] [CrossRef]
  48. He, Z.B.; Yang, J.J.; Du, J.; Zhao, W.Z.; Liu, H.; Chang, X.X. Spatial variability of canopy interception in a spruce forest of the semiarid mountain regions of China. Agric. For. Meteorol. 2014, 188, 58–63. [Google Scholar] [CrossRef]
  49. Fang, S.; Zhao, C.; Jian, S. Spatial variability of throughfall in a Pinus tabulaeformis plantation forest in Loess Plateau, China. Scand. J. For. Res. 2016, 31, 467–476. [Google Scholar] [CrossRef]
  50. Whelan, M.J.; Anderson, J.M. Modelling spatial patterns of throughfall and interception loss in a Norway spruce (Picea abies) plantation at the plot scale. J. Hydrol. 2016, 31, 467–476. [Google Scholar] [CrossRef]
  51. Van Stan, J.T.; Hildebrandt, A.; Friesen, J.; Metzger, J.C.; Yankine, S.A. Spatial Variability and Temporal Stability of Local Net Precipitation Patterns. In Precipitation Partitioning by Vegetation: A Global Synthesis; Van Stan, J.T., Gutmann, E., Friesen, J., Eds.; Springer: Berlin/Heidelberg, Germany, 2020; pp. 89–104. [Google Scholar]
  52. Liu, J.; Liu, W.; Li, W.; Zeng, H. How does a rubber plantation affect the spatial variability and temporal stability of throughfall? Hydrol. Res. 2019, 50, 60–74. [Google Scholar] [CrossRef] [Green Version]
  53. Shen, H.; Wang, X.; Jiang, Y.; You, W. Spatial variations of throughfall through secondary succession of evergreen broad-leaved forests in eastern China. Hydrol. Process. 2012, 26, 1739–1747. [Google Scholar]
  54. Zhang, H.X.; Wu, H.W.; Li, J.; He, B.; Liu, J.F.; Wang, N.; Duan, W.L.; Liao, A.M. Spatial-temporal variability of throughfall in a subtropical deciduous forest from the hilly regions of eastern China. J. Mount. Sci. 2019, 16, 1788–1801. [Google Scholar] [CrossRef]
  55. Carlyle-Moses, D.E.; Laureano, J.F.; Price, A.G. Throughfall and throughfall spatial variability in Madrean oak forest communities of northeastern Mexico. J. Hydrol. 2004, 297, 124–135. [Google Scholar] [CrossRef]
  56. Fan, J.; Oestergaard, K.T.; Guyot, A.; Jensen, D.G.; Lockington, D.A. Spatial variability of throughfall and stemflow in an exotic pine plantation of subtropical coastal Australia. Hydrol. Process. 2015, 29, 793–804. [Google Scholar] [CrossRef]
  57. Lin, T.C.; Hamburg, S.P.; King, H.B.; Hsia, Y.J. Spatial variability of throughfall in a subtropical rain forest in Taiwan. J. Environ. Qual. 1997, 26, 172–180. [Google Scholar] [CrossRef]
  58. Zhang, Y.F.; Wang, X.P.; Hu, R.; Pan, Y.X. Throughfall and its spatial variability beneath xerophytic shrub canopies within water-limited arid desert ecosystems. J. Hydrol. 2016, 539, 406–416. [Google Scholar] [CrossRef]
  59. Macinnis-Ng, C.M.O.; Flores, E.E.; Müller, H.; Schwendenmann, L. Rainfall partitioning into throughfall and stemflow and associated nutrient fluxes: Land use impacts in a lower montane tropical region of Panama. Biogeochemistry 2012, 111, 661–676. [Google Scholar] [CrossRef]
  60. Rodrigo, A.; Àvila, A. Influence of sampling size in the estimation of mean throughfall in two Mediterranean holm oak forests. J. Hydrol. 2001, 243, 216–227. [Google Scholar] [CrossRef]
  61. Lawrence, G.B.; Fernandez, I.J. A reassessment of areal variability of throughfall deposition measurements. Ecol. Appl. 1993, 3, 473–480. [Google Scholar] [CrossRef]
  62. Price, A.G.; Carlyle-Moses, D.E. Measurement and modeling of growing-season canopy water fluxes in a mature mixed deciduous forest stand, southern Ontario, Canada. Argic. For. Meteorol. 2003, 119, 69–85. [Google Scholar]
  63. Helvey, J.D.; Patric, J.H. Design criteria for interception studies. Int. Assoc. Sci. Hydrol. 1965, 67, 131–137. [Google Scholar]
Figure 1. Location of the 50 throughfall gauges under the Quercus castaneifolia C.A.Mey. study tree.
Forests 11 00688 g001
Figure 2. Regression analysis between relative throughfall (TF:GR) and gross rainfall (GR) during leafless (triangles) and leafed (circles) phenoseasons. LP= Regression line plotted for the leafed period, Total = Regression line plotted for all leafed and leafless data.
Forests 11 00688 g002
Figure 3. Surface variogram maps of throughfall (mm) in west-east (W-E) and north-south (N-S) directions, calculated for the (a) leafed and (b) leafless periods.
Forests 11 00688 g003
Figure 4. Experimental isotropic semivariograms for throughfall (mm) and fitted models for the (a) leafed and (b) and leafless periods. C0 = Nugget effect, C = Sill, A0 = Range parameter.
Forests 11 00688 g004
Figure 5. The results of cross validation of throughfall estimation during the (a) leafed and (b) leafless periods.
Forests 11 00688 g005
Figure 6. Kriged maps of total throughfall for the (a) leafed and (b) leafless periods. CV = coefficient of variation.
Forests 11 00688 g006
Figure 7. Time stability plots of cumulative throughfall (TF) normalized to zero mean and unit variance for the (a) leafed and (b) leafless periods. The TF gauges are plotted along the horizontal axis and ranked by their means. Error bars represent ±1 standard deviation. The numbers underneath each bar are the gauge identifiers.
Forests 11 00688 g007
Figure 8. Time stability plots for throughfall (TF). Time-average relative deviation of TF amount by collectors for events grouped within three rainfall classes during the study period. Error bars are plus and minus one standard deviation; numbers refer to collector number (n = 50).
Forests 11 00688 g008
Figure 9. Error of cumulative throughfall volume as related to the number of throughfall samplers for different confidence intervals in the (a) leafed and (b) leafless periods.
Forests 11 00688 g009
Table 1. Spearman rank correlation coefficients (rs) between the cumulative throughfall (TF) of rain events within rainfall classes (for the leafed period) and between the cumulative TF of leafed and leafless periods (+ time-stable pairs of events by percentage can be observed in the leafed period).
Rainfall ClassesSummed TF of Events within Rainfall ClassesBetween Two Periods+ Time-Stable Pairs of Events (%)
No. events 4440.15776.4
(<1 mm)(1–5 mm)(>5 mm)
(<1 mm) 0.562 **0.494 **
(1–5 mm) 0.776 **
+ The percentage of pairs of events that was significantly (p ≤ 0.05) positively correlated. ** Correlation is significant at the 0.01 level (two-tailed).
Table 2. The estimated number of required throughfall (TF) gauges for the individual Quercus castaneifolia C.A.Mey. tree.
Leafed PeriodLeafless Period
Error of Cumulative TF Mean (%)Confidence Interval (%)
909599909599
573105186344987
1018264681222
15812204510

