Article

The Climatic Response of Tree Ring Width Components of Ash (Fraxinus excelsior L.) and Common Oak (Quercus robur L.) from Eastern Europe

1
Forest Biometrics Laboratory – Faculty of Forestry, ”Stefan cel Mare” University of Suceava, Universității street no. 13, 720229 Suceava, Romania
2
Department of silviculture and public parks, State Agrarian University of Moldova, Mircești street no. 44, MD2049 Chișinău, Republic of Moldova
3
Alfred Wegener Institute for Polar and Marine Research, Am Handelshafen street no. 12, 27570 Bremerhaven, Germany
4
Department of Geography, ”Stefan cel Mare” University of Suceava, Universității street no. 13, 720229 Suceava, Romania
5
National Research and Development Institute for Silviculture ”Marin Drăcea”, Calea Bucovinei no. 76bis, 725100 Câmpulung Moldovenesc, Romania
6
Center of Mountain Economy -INCE - CE-MONT Vatra Dornei, Petreni street no 49, 725700 Vatra Dornei, Romania
*
Author to whom correspondence should be addressed.
Forests 2020, 11(5), 600; https://doi.org/10.3390/f11050600
Submission received: 22 April 2020 / Revised: 18 May 2020 / Accepted: 22 May 2020 / Published: 25 May 2020
(This article belongs to the Special Issue Radial Tree-Ring Traits Variation in Relation to Climate Factors)

Abstract

:
This paper aims to develop the first differentiated (earlywood—EW, latewood—LW, and total ring width—RW) dendrochronological series for ash (Fraxinus excelsior L.) and oak (Quercus robur L.) trees from the Republic of Moldova, and to analyze their climatic response and their spatio-temporal stability. For this, 18 ash and 26 oak trees were cored from the Dobrușa protected area, Republic of Moldova, Eastern Europe, and new EW, LW, and RW chronologies were developed for ash and oak covering the last century. The obtained results showed that the RW and LW have a similar climatic response for both species, while EW is capturing interannual climate variations and has a different reaction. The analyses performed with monthly climatic data revealed a significant and negative correlation with the mean air temperature and a significant and positive correlation with precipitation and the Standardized Precipitation-Evapotranspiration Index (SPEI) for both ash and oak. The temperature during the vegetation period has a strong influence on all tree-ring components of ash, while for oak the strong correlation was found only for LW. The positive and significant correlation between LW and RW with precipitation for both species, suggests that ash and oak are sensitive to the hydrological component and the precipitation is the main tree growth-limiting factor. Despite the significant correlation with precipitation and temperature for the whole analyzed period, the 25-year moving correlation analyses show that they are not stable in time and can switch from positive to negative or vice versa, while the correlation with SPEI3 drought index, which is a integration of both climatic parameters, is stable in time. By employing the stability map analysis, we show that oak and ash tree ring components, from the eastern part of the Republic of Moldova, have a stable and significant correlation with SPEI3 and scPDSI drought indices from February (January) until September, over the eastern part of Europe.

1. Introduction

Climate models predict an increase of mean surface temperature over large regions of Europe, including the Republic of Moldova (Eastern Europe) [1]. As a consequence, the intensity, frequency, and duration of extreme events, especially heatwaves and drought, will increase and can lead to forest ecosystems stability degradation, which can contribute to increased risk of desertification. This process has already been observed in Central-Eastern Europe [2] and has serious consequences for forest ecosystems, in terms of ecological stability and productivity [3]. Forest susceptibility to climate change has increased and the adaptive capacity has dropped mainly due to increasing frequency and intensity of drought events [4,5]. Future climate changes have the potential to induce shifts in species composition and distribution, highly affecting biodiversity and specific ecological amplitude and overall forest services [3,5,6,7,8,9].
In the Republic of Moldova, oak species (Quercus sp.) are the most spread species reaching 44.1% from the total forest area, while ash (Fraxinus sp.) represents only 5.7%, and it is found mostly in oak mixed forests [10]. Both species are vulnerable to climate changes and reports of forest growth decline and mortality linked to climate change have been recorded and studied throughout Europe [4,6,8,9,11,12,13,14], as well as in North America [15,16,17] and Japan [18] being a worldwide phenomenon.
Oaks are widely studied in most of the dendro-related domains (dendrochronology, dendroclimatology, dendroarcheology, dendroecology, etc.) due to its longevity, spreading, climate sensitivity, timber use, and being widely chosen as construction wood since the dawn of harvesting tools development. In Europe, there are several studies regarding the oak reaction to climate, highlighting specific dendroclimatic patterns [3,14,19,20,21,22,23,24,25,26,27]. The main outcomes from all these studies show that ash and oak are highly sensitive to precipitation and this is the main limiting growth factor. In general, oak tree rings chronologies correlate positively with precipitation from spring to summer, while the summer temperature response is unstable from site to site and the correlation can be found as either negative or positive.
In the 21st century, an increase of studies regarding ash forest decline and/or death phenomena has been reported, all induced by climate forcing, fungi (Hymenoscyphus fraxineus), or insect outbreaks [28,29,30,31]. Even if ash is widely spread, there are only a few dendrochronological studies in Europe, and the in-depth information on its response to climate and behavior is scarce and most studies have a dendroecological approach [32,33,34]. Several authors managed to compare oak and ash, using tree rings widths as a response to environmental conditions, in floodplains and river terraces [26,35,36,37], and all pointed to the fact that ash is more sensitive to environmental changes. In this context, it is necessary to enhance our knowledge related to those species’ responses in distinctive climate conditions. These climate-induced changes have to be faced and counterbalanced with adaptive silvicultural measures derived from a scientific-based management strategy [4,38,39]. Thus, to develop scientific-based decision support tools, it is necessary to gather new information regarding how main forest tree species respond to climate variability. This new information needs to be focused on both the response patterns, as well as its temporal stability.
The Republic of Moldova represents an unstudied area in dendrochronological studies, and this contribution intends to complete the overall image of oak and ash behavior by adding the required information for this specific area, characterized by excessive climate influences, with severe and frequent drought events [40]. As a consequence, it is necessary to fill in this knowledge gap and provide valuable information that can be used for future management strategies. As such, the main objectives of this study are (i) to develop the first differentiated (earlywood, latewood, and total ring width) dendrochronological series for ash and oak from the Republic of Moldova, Eastern Europe; (ii) to test the climate response of ash and oak; (iii) to analyze of the spatio-temporal stability of the climate–growth relationship.

2. Materials and Methods

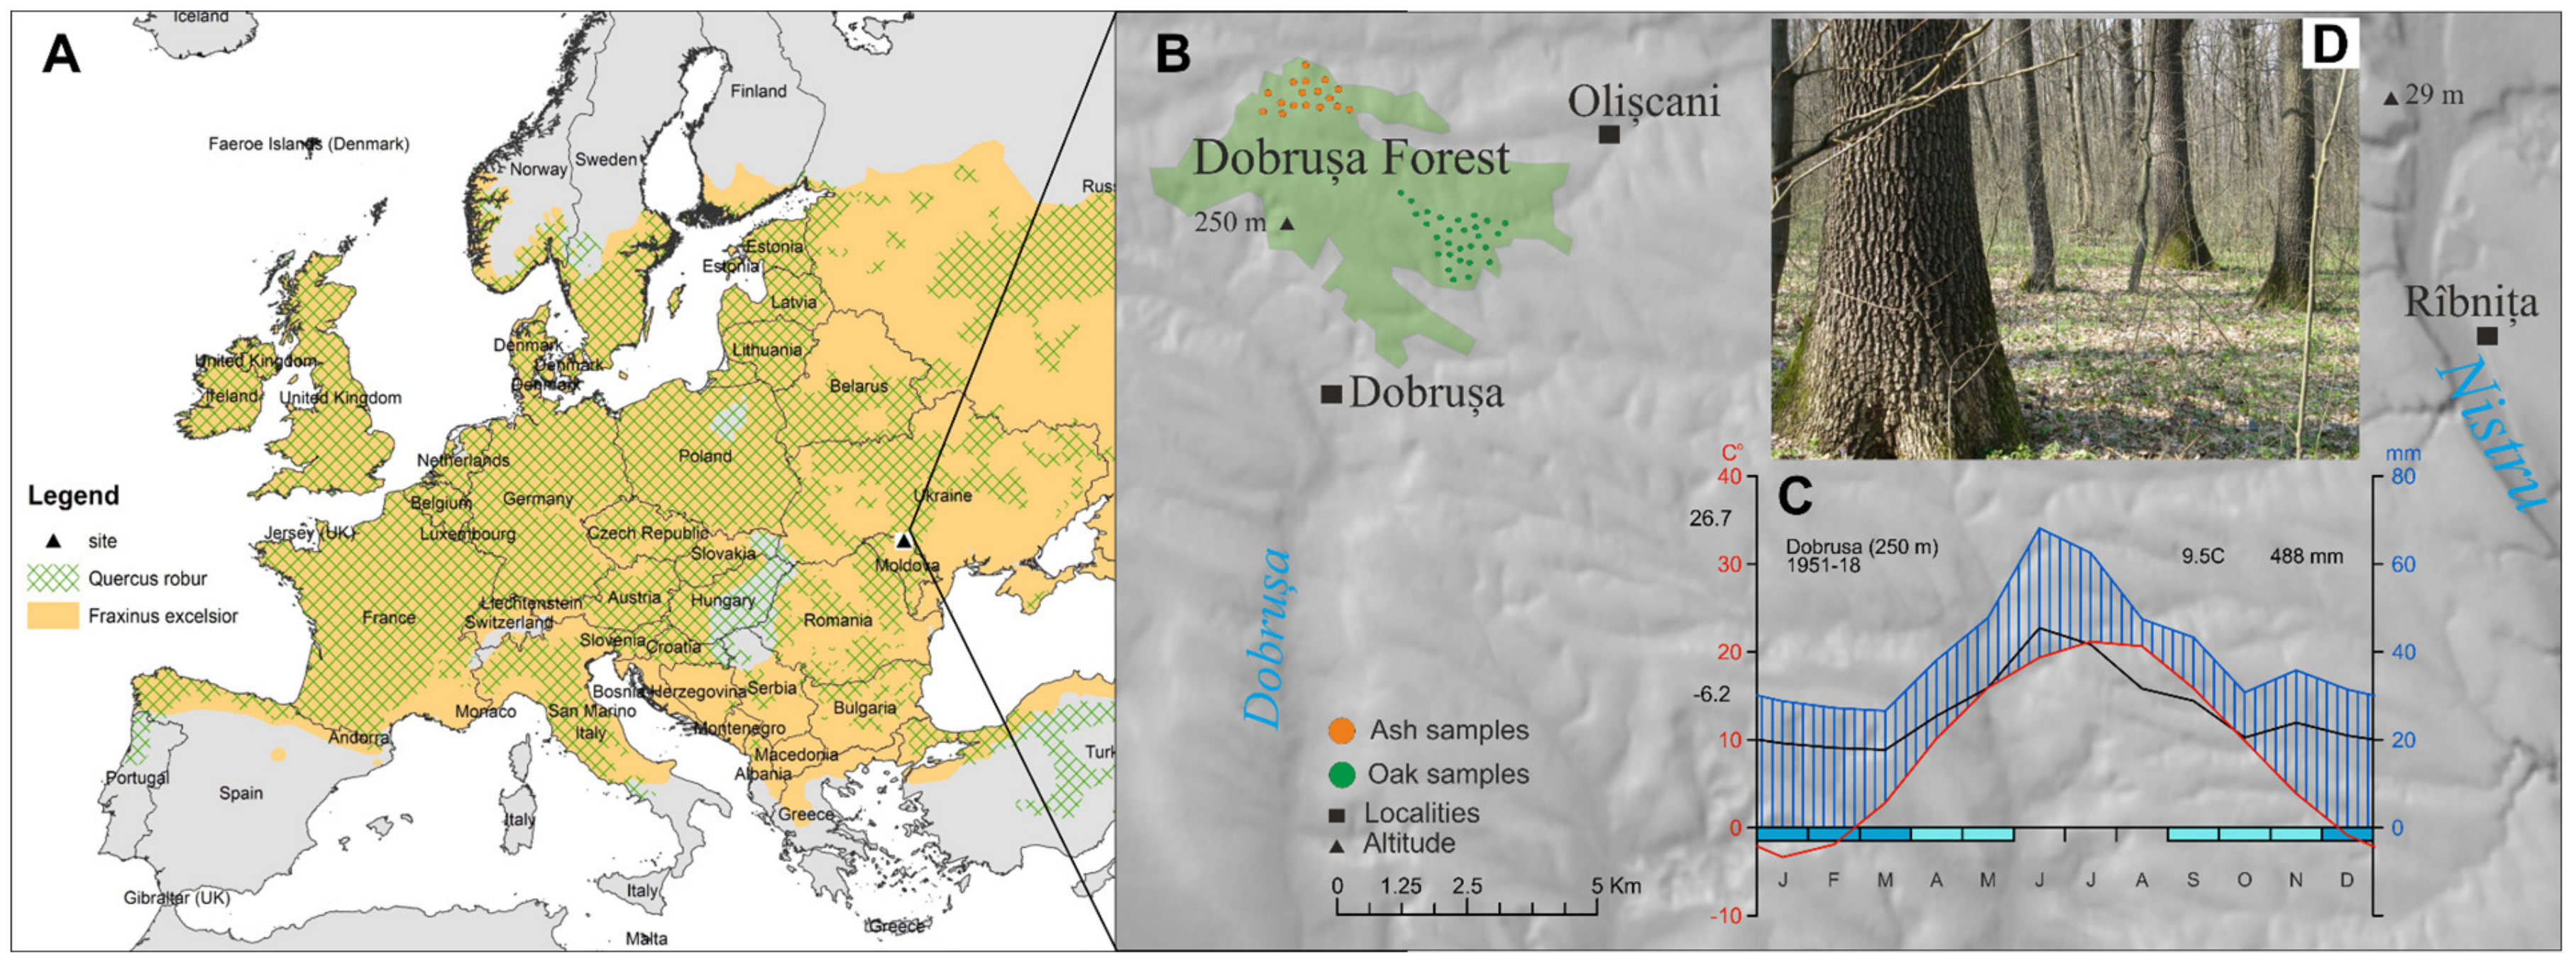
2.1. Site Description

Ash (Fraxinus excelsior) and oak (Quercus robur) are among the most distributed tree species in Europe covering large areas with contrasting environmental conditions (Figure 1A) [41]. As we move forward in the Eastern European plain, many tree species have to face more excessive continental influences, thus growing conditions being suboptimal [42]. The sampling site is located in the Dobrușa protected area, part of Nistru Plateau, the Eastern part of the Republic of Moldova (Figure 1A). The study site is located at an altitude of 250 m a.s.l. with a mean slope of 12° (Figure 1A,B). The bedrock is represented by Sarmatian deposits covered with a layer of soft loam and phaeozem soil. The vegetation type is a mixed forest of oak, ash, and other broadleaf species (hornbeam, lime tree, Norway maple) [43]. The climate is characterized by a temperate continental climate (dry and hot summers and harsh winters) [40] (Figure 1A–C). The multiannual mean temperature is +8.7 °C and the annual precipitation amount is 445 mm, with high variability during the year. From the total precipitation amount, around 380 mm (85%) are recorded from April to October (≈196 days) and only 15% throughout the rest of the year (November to March). The Walter–Lieth climatic diagram shows a dry period at the end of the vegetation season (July and August) (Figure 1C).

2.2. Chronology Development

In 2019, we selected 18 ash and 26 oak dominant healthy trees. Each tree was cored with Pressler borer at breast high (1.30 m), one core per tree. The increment cores were processed and measured in Forest Biometrics Laboratory, “Stefan cel Mare” University of Suceava (https://erris.gov.ro/Forest-Biometrics-Laboratory). Surface preparation of increment cores was made by cutting plane surfaces using the WSL core microtome [44]. The increment cores were scanned using Silverfast v.8.1 software and an EPSON 11000 XL flatbed scanner with 1600 dpi true resolution and saved in a 48bit color image format. CooRecorder v.9.31 software [45] was used to measure tree ring-widths (RW) as well as earlywood (EW) and latewood widths (LW) from the imagines, according to IAWA classification [46]. All measurements were individually cross-dated using TSAPwin [47] and statistically verified with COFECHA [48] using correlation analysis of 50-year intervals with 25-year overlaps [48,49]. To evaluate the agreement between different tree ring components and between species, standard dendrochronological statistics like Gleichläufigkeit-glk [50] and modified t value (tVBP) [51] were applied.
To remove the biological and potential non-climatically induced low- to medium-term growth trends, each individual raw data series was transformed into a growth index series. All tree ring components series (EW, LW, and RW) were detrended using an age dependent-spline [52] in ARSTAN v.48 software [53]. The initial spline stiffness related to tree age was set at 20 yrs., after that, the spline rigidity increases year by year. The mean chronologies (standard chronology) for each species and tree ring components were obtained using a bi-weight mean [54,55]. The strength of the chronological signal was evaluated with the expressed population signal (EPS) parameter, using a 30-yrs. window length with 15-yrs. overlap [56]. The EPS threshold value was set to 0.85, as it is widely accepted [57]. Additionally, the standard dendrochronological statistics (e.g., mean sensitivity (MS), first-order autocorrelation (AC1), inter-series correlation (rbar), variability explained by first principal component (%var) and signal to noise ratio (SNR)) were computed.

2.3. Climate–Growth Relationship

The dendroclimatic response of ash and oak from the Dobrușa region was evaluated using different climatic variables: precipitation amount (PP), mean air temperature (Tmean), maximum air temperature (Tmax), minimum air temperature (Tmin), the Standardized Precipitation-Evapotranspiration Index (SPEI), and Self-calibrated Palmer drought severity index (scPDSI). Monthly climatic gridded data from CRU TS 4.03 with 0.5 × 0.5° spatial resolution [58] were obtained from ClimateExplorer (https://climexp.knmi.nl), [59] for the 1901–2018 period. SPEI monthly values for the period 1900–2015 with different time scales (1–24 months), which represent the cumulative water balances over the previous periods, were downloaded from the global SPEI database and used for dendroclimatic analysis (SPEIbase v2.5) [60].
The climate growth relationship was performed based on monthly climatic variables and each differentiated chronology for both species. The correlations coefficients were computed for a time interval between June, the previous year, until September, the current year. The statistical significance of the correlations was evaluated by bootstrap methods (p = 0.05) using R environment [61] with the treeclim package [62]. Additionally, the Pearson correlation coefficients were calculated for SPEI values over the cumulative time-scale spectrum (from 1 to 24 months) and presented as correlation heat maps in ggplot2 library [63].
To test the dendroclimatic temporal stability, we computed the moving correlations for seasonal periods, from the previous autumn (August to November, ason), the current spring (March to May, MAM) and the current summer (June to August, JJA) for both mean temperature and precipitation. The moving correlation was also performed for the August SPEI index, for 3, 6, 12, and 18 months of cumulative periods. The analysis was made using a 25-years moving window with a one-year step.

2.4. Stability Maps

To examine the stationarity of the long-term relationship between the tree-ring based proxies and the gridded climate parameters (e.g., maximum, mean and minimum temperature, precipitation, drought indices—SPEI3 and scPDSI) we made use of stability maps, a method successfully used in the seasonal forecast of European rivers and Arctic sea ice [64,65]. To detect stable relationships, the variability of the correlation between the tree ring proxies and the climate parameters was investigated within a 31-year moving window within the analyzed period. The correlation was considered stable for those regions where the tree rings proxies and climate parameters were significantly correlated at the 90% or 80% level for more than 80% of the moving window. A detailed description of the methodology is given in [66]. This methodology has been successfully used for the first time in dendroclimatological studies by [67]. The advantage of this methodology, when compared with traditional correlation analysis, is that is able to identify just the regions which have a stable relationship in time with our tree rings-based proxies.

3. Results and Discussion

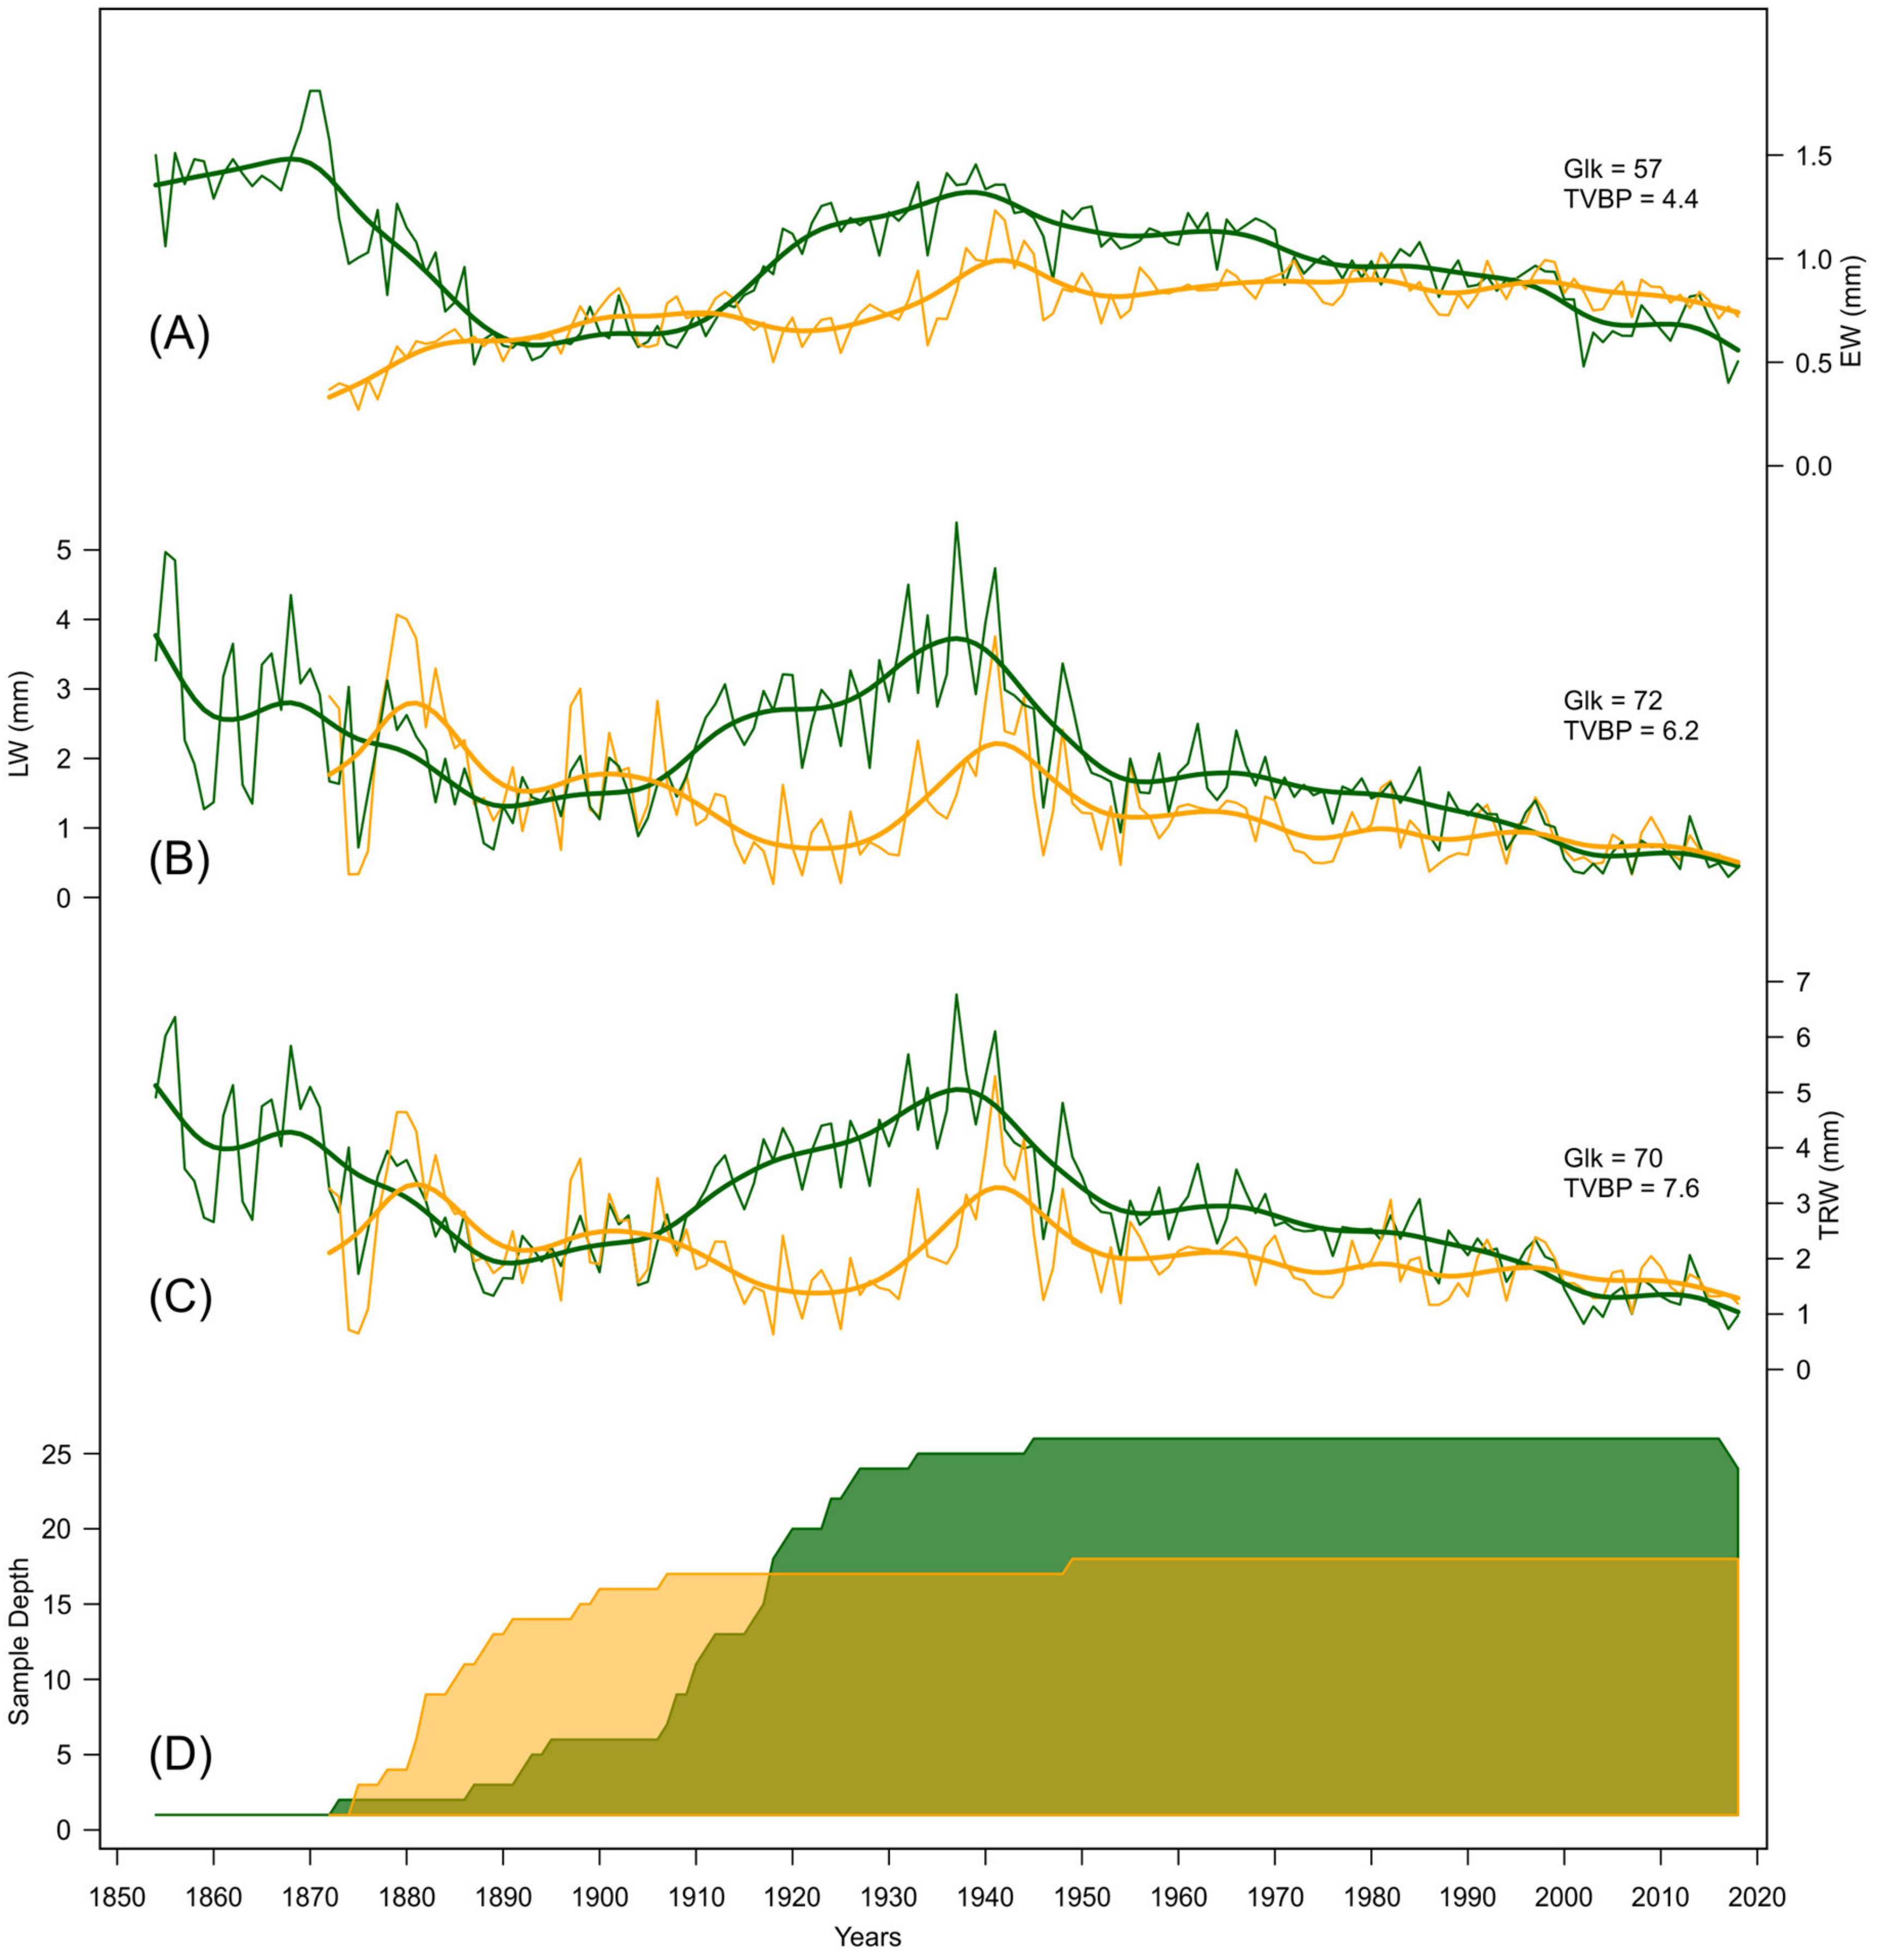
3.1. Chronologies Characteristics

In this study, we developed the first EW, LW, and RW oak chronologies for the Republic of Moldova, and one of the first EW-LW chronologies for ash in Europe (Figure 2D). The maximum period covers the 1871–2018 period for ash and the 1853–2018 period for oak. The mean tree age is 130 years for ash and 109 years for oak. In terms of growth performance, oak RW is higher (2.98 ± 1.61mm) compared to ash (2.01 ± 0.98mm), these differences being preserved for all tree ring components (Table 1).
The EW proportion from RW is almost similar for oak (36%) and ash (38%). The 20 yrs. low pass filters have shown similar growth trends for both LW and RW chronologies without obvious differences between the two species, while EW recorded a different growth pattern for ash. Ash EW shows an increasing trend over time, while oak EW shows certain trend similarities to LW and RW. We identified periods with growth releases and reductions for both species and all tree-ring components (Figure 2). The first period with accelerated growth was identified during the juvenile period (the first 15–20 rings from the pith). After that period, the growth process levels lowered until the 1910s, due to competition. Between 1910 and 1940 a growth release was identified, more evident for oak than for ash. This period is overlapping with a new tree generation, with juvenile intense growth processes, possibly induced by a silvicultural intervention. After this growth release, both species have a normal negative trend, age-induced, more evident for oak (Figure 2).
The inter-series correlation shows a high similarity of growth trends among individual trees, for RW and LW for both species, even if the sample depth for ash is not very high (e.g., for ash 0.728 RW/0.650 LW; oak 0.633 RW/0.590 LW), while EW indicates a growth incoherence in the datasets (0.330 for oak and 0.448 for ash). The variability explained by the first principal component decreases from 61.1% for ash RW to 47.1% for oak RW, the lowest values being recorded for EW (33.9%—ash, 21.8%—oak) (Table 1). The agreement between the oak and ash RW series is highly significant (tVBP = 7.6, Glk = 70%), with a small decrease for LW (tVBP = 6.2, and Glk = 72%) and with minimum values recorded for EW (tVBP = 4.3, Glk = 60%). Most of the RW variability is induced by LW, showing that these two variables share the same information (tVBP = 50.4 for oak; tVBP = 52.6 for ash). The similarities between RW and EW are lower comparing with LW (tVBP = 5.1 for oak and tVBP = 7.1 for ash) (Figure 2). Year by year growth variation, expressed by mean sensitivity (MS) is higher for ash than oak, and for LW, than it is for RW and EW. The AC1 values, as an indicator of previous year environmental condition influence upon growth, are significant and higher for oak, compared to ash, and it is present in all tree ring width variables (RW, LW, EW) (Table 1).
Mean chronology quality statistics (EPS, %var) reveal an evident difference between studied species, being lower for oak compared with ash, for all tree ring component chronologies. The chronologies’ statistical parameters are similar to other studies in Central and Eastern Europe, for oak and ash [14,33,36,68,69]. Besides the limitations induced by local climatic conditions, anthropic forcing (silvicultural interventions) and/or insect outbreaks can have a major impact on growth processes and forest dynamics. These non-climatic factors could cause synchronic changes in radial growth, increasing common signal and autocorrelation, but blurring the chronology climatic signal [69].
The running EPS values for ash are equal or higher than the 0.85 value, which is usually used as a threshold for the reliability of chronologies [57,70], indicating a strong and stable common signal for all ash tree ring width components (Figure 3). For oak, the EPS value decreases below 0.85 threshold around 1900 for EW, around 1930 for LW, and around 1920 for total ring width, pointing out a strong common signal after these periods.
The obtained chronology statistics are similar to those from other studies on separate analyses of tree-ring components [68,69,71,72]. Overall, the dendrochronological series statistics suggest that EW and LW record different dendrochronological and climatic signals, while the RW signal relies on LW variability.

3.2. Climate–Growth Relationship

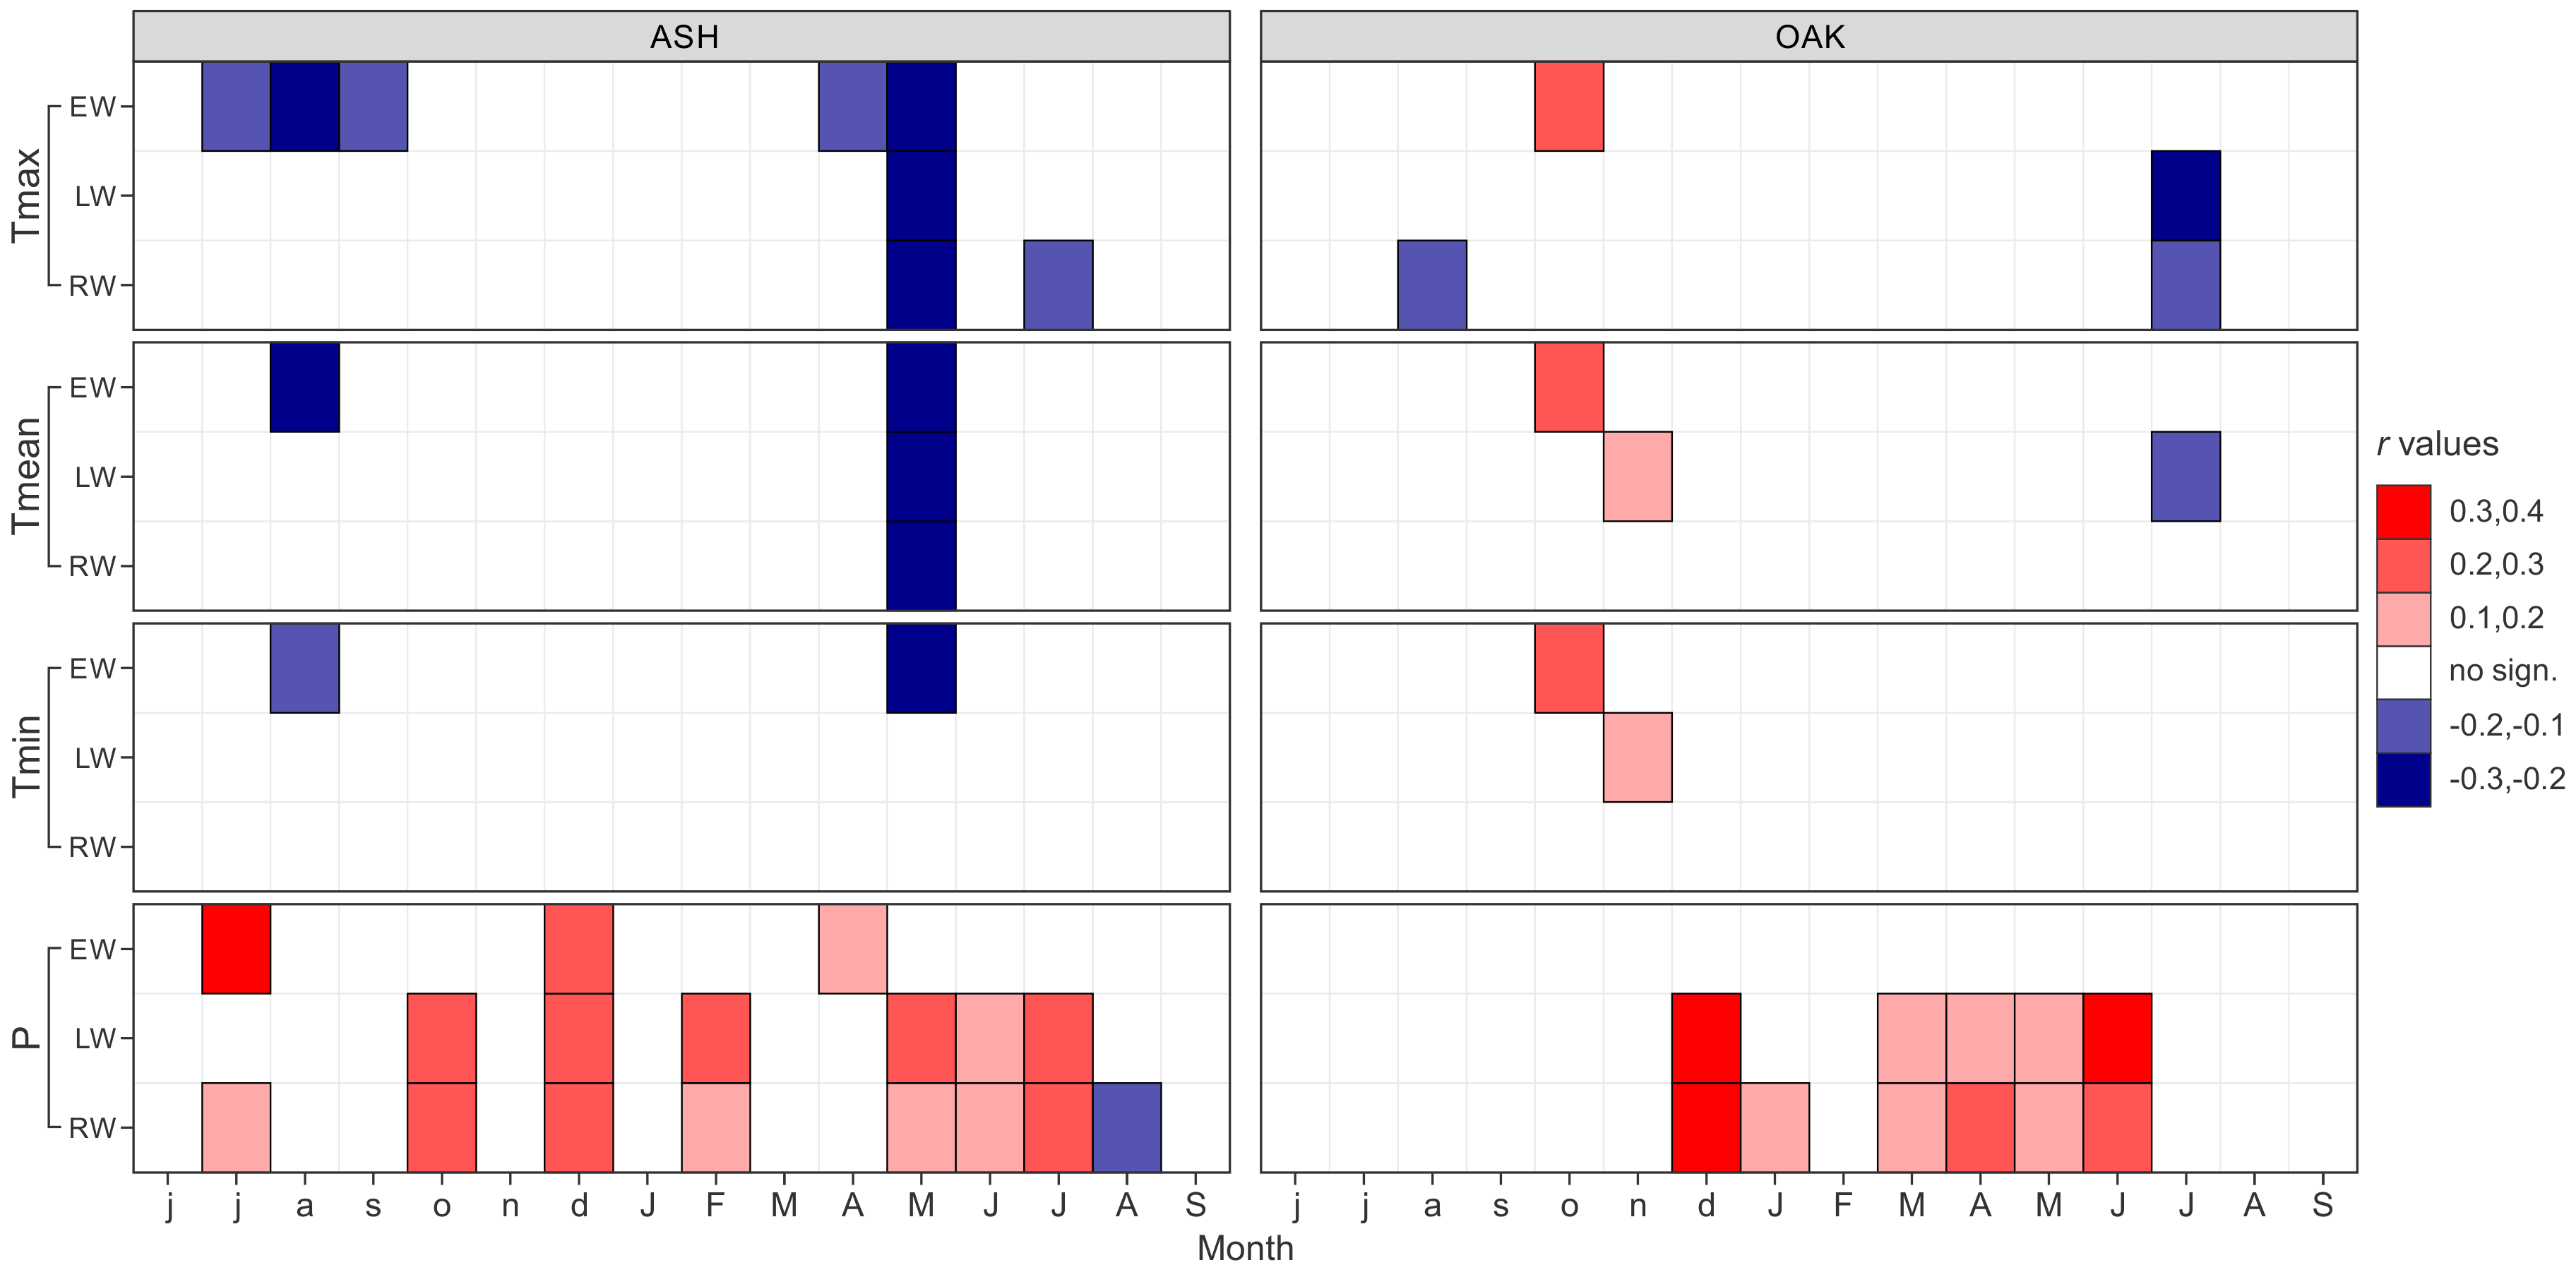
3.2.1. Correlation with Temperature and Precipitation

The present study provides valuable information that fills the knowledge gap regarding the climate–growth relationship of those two species in Eastern Europe. To quantify the climatic signal, we computed the correlation coefficients for all tree ring components of both species, with different monthly climatic parameters. The performed analyses reveal a general pattern characterized by a significant negative correlation with temperature and a significant positive correlation with precipitation for both species (Figure 4). The ash EW index is significantly negatively correlated with the minimum and mean temperature from August previous year (py) (r = −0.16; r = −0.21) and current May (r = −0.22 and r = −0.26) and with maximum temperature from the July-August-September py (r = −0.19), and current April and May (r = −0.23). Additionally, the ash EW is significantly positively correlated with precipitation from the July py (r = 0.37) and December py (r = 0.23). The ash LW and RW share similar climatic signal: negative correlations with maximum and mean temperature from May (r = −0.21) and positive correlation with precipitation from py October and December (r = 0.30; r = 0.25), current February, May, and July (r = 0.21; r = 0.21 and r = 0.27).
The oak EW is significantly correlated with mean, minimum, and maximum temperature from the py October (r = 0.23). As it was found for ash, the oak LW registers a similar climate signal as RW, still, in oak’s case, the correlation coefficients are lower for RW than for LW. The oak LW and RW is significantly negatively correlated with maximum temperature from July (r = −0.23, r = −0.19) and positively correlated precipitation from py December (r = 0.33) and current March–June, with the highest coefficient for June (r = 0.30) (Figure 4).
The obtained results indicate obvious differences in the climate response between ash and oak. As a general pattern, ash tree ring widths are more sensitive to climate than oak, for all studied climate variables, results consistent with similar studies in Europe [26,33]. The temperature during the vegetation period has a strong influence on all tree-ring components of ash, while for oak, the LW indicates the highest correlation values. High May temperatures for ash, and from July for oak, induces an increased transpiration rate, inhibition of chloroplast function, and stomatal closure [73]. These phenomena determine a photosynthesis reduction and radial growth decline, therefore a narrower EW, LW for ash, and LW in oak’s case. The low climatic response of oak EW can be explained by the starting growth point of EW, before the bud burst [74]. A similar climatic response of the oak EW was recorded in different studies in Hungary [68] and Switzerland [69].
The climate–growth relationship analysis for ash shows, in general, a negative correlation with the previous summer temperature, while the oak response shows a positive correlation with temperatures from the previous autumn. These differences are associated with the physiological processes which affect the climate–growth relationship differently for both species. The ash negative correlation with previous summer temperature is induced by high evapotranspiration and respiration rates, which decrease the amount of carbohydrates. Likewise, the oak positive correlation with temperature from the last autumn represents the influence of carbohydrate reserves: a warm autumn could foster the accumulation of carbohydrates which will contribute to EW growth in the next spring [75]. In the ≈20 days between the earlywood growth starting point and the bud burst, up to 30% of EW width is already formed [22,76], thus earlywood growth in oak is more linked to pre-growing season conditions. Favorable autumn and winter conditions will have a positive effect on the earlywood formation process [77,78]. The usage of these reserves in the next spring is conditioned by vessel hydraulic capacity. If the previous EW vessels are affected by winter and spring cavitation [72,79], trees compensate with intensive production of new large EW vessels before leaf development, to recover the hydraulic architecture. This negative response to growing season temperatures is similar to others from Eastern Hungarian [25,68], NW Romania [23], and in the Alps [69,80]. The ash negative response to late spring and early summer temperatures was also reported by Koprowski, et al. [81] and Heklau, Jetschke, Bruelheide, Seidler and Haider [37].
The significant positive correlation between LW (RW) and precipitation for both species suggests that the hydrological component and precipitation are the main tree growth factors [82]. The water availability in the previous autumn and current growth season (May–July for ash and March–June for oak) leads to high photosynthetic rates, which determine a wider LW and, respectively, total ring width. Especially for the ash case, water deficit does not only affect directly the EW width but also impair indirectly the hormone concentrations [83]. Consequently, high auxin concentrations are linked to rapid cell differentiation which also affects cell development and EW width [71]. Additionally, ash EW development can be affected by severe winter-spring droughts or intense frost events [71]. Our findings regarding the oak RW/LW positive response to previous autumn and current spring to summer precipitation agree with other studies from Western [72], Southern [3,14,26,69], and Eastern Europe [24,25,68,84,85], where the water availability is considered the main driving factor for oak growth. Even if these oak trees are growing in a steppe environment, EW does not retain a significant response to precipitation, having a similar reaction with oaks in different environmental conditions from Europe [68,69].
Unlike oak, for ash, there is a scarcity of dendroclimatological studies in Europe, even though it has great dendroclimatological potential and ecological plasticity [26,33]. Nevertheless, similar pronounced sensitivity of ash to summer precipitation was reported in floodplains forests in Croatia [26], Central Germany [37], and Poland [81]. It is necessary to mention that, compared with these floodplain forests, in our region ash has a wide window of response to precipitation (from previous to current summer), as a consequence of water limitation (steppe climate) and soil conditions.

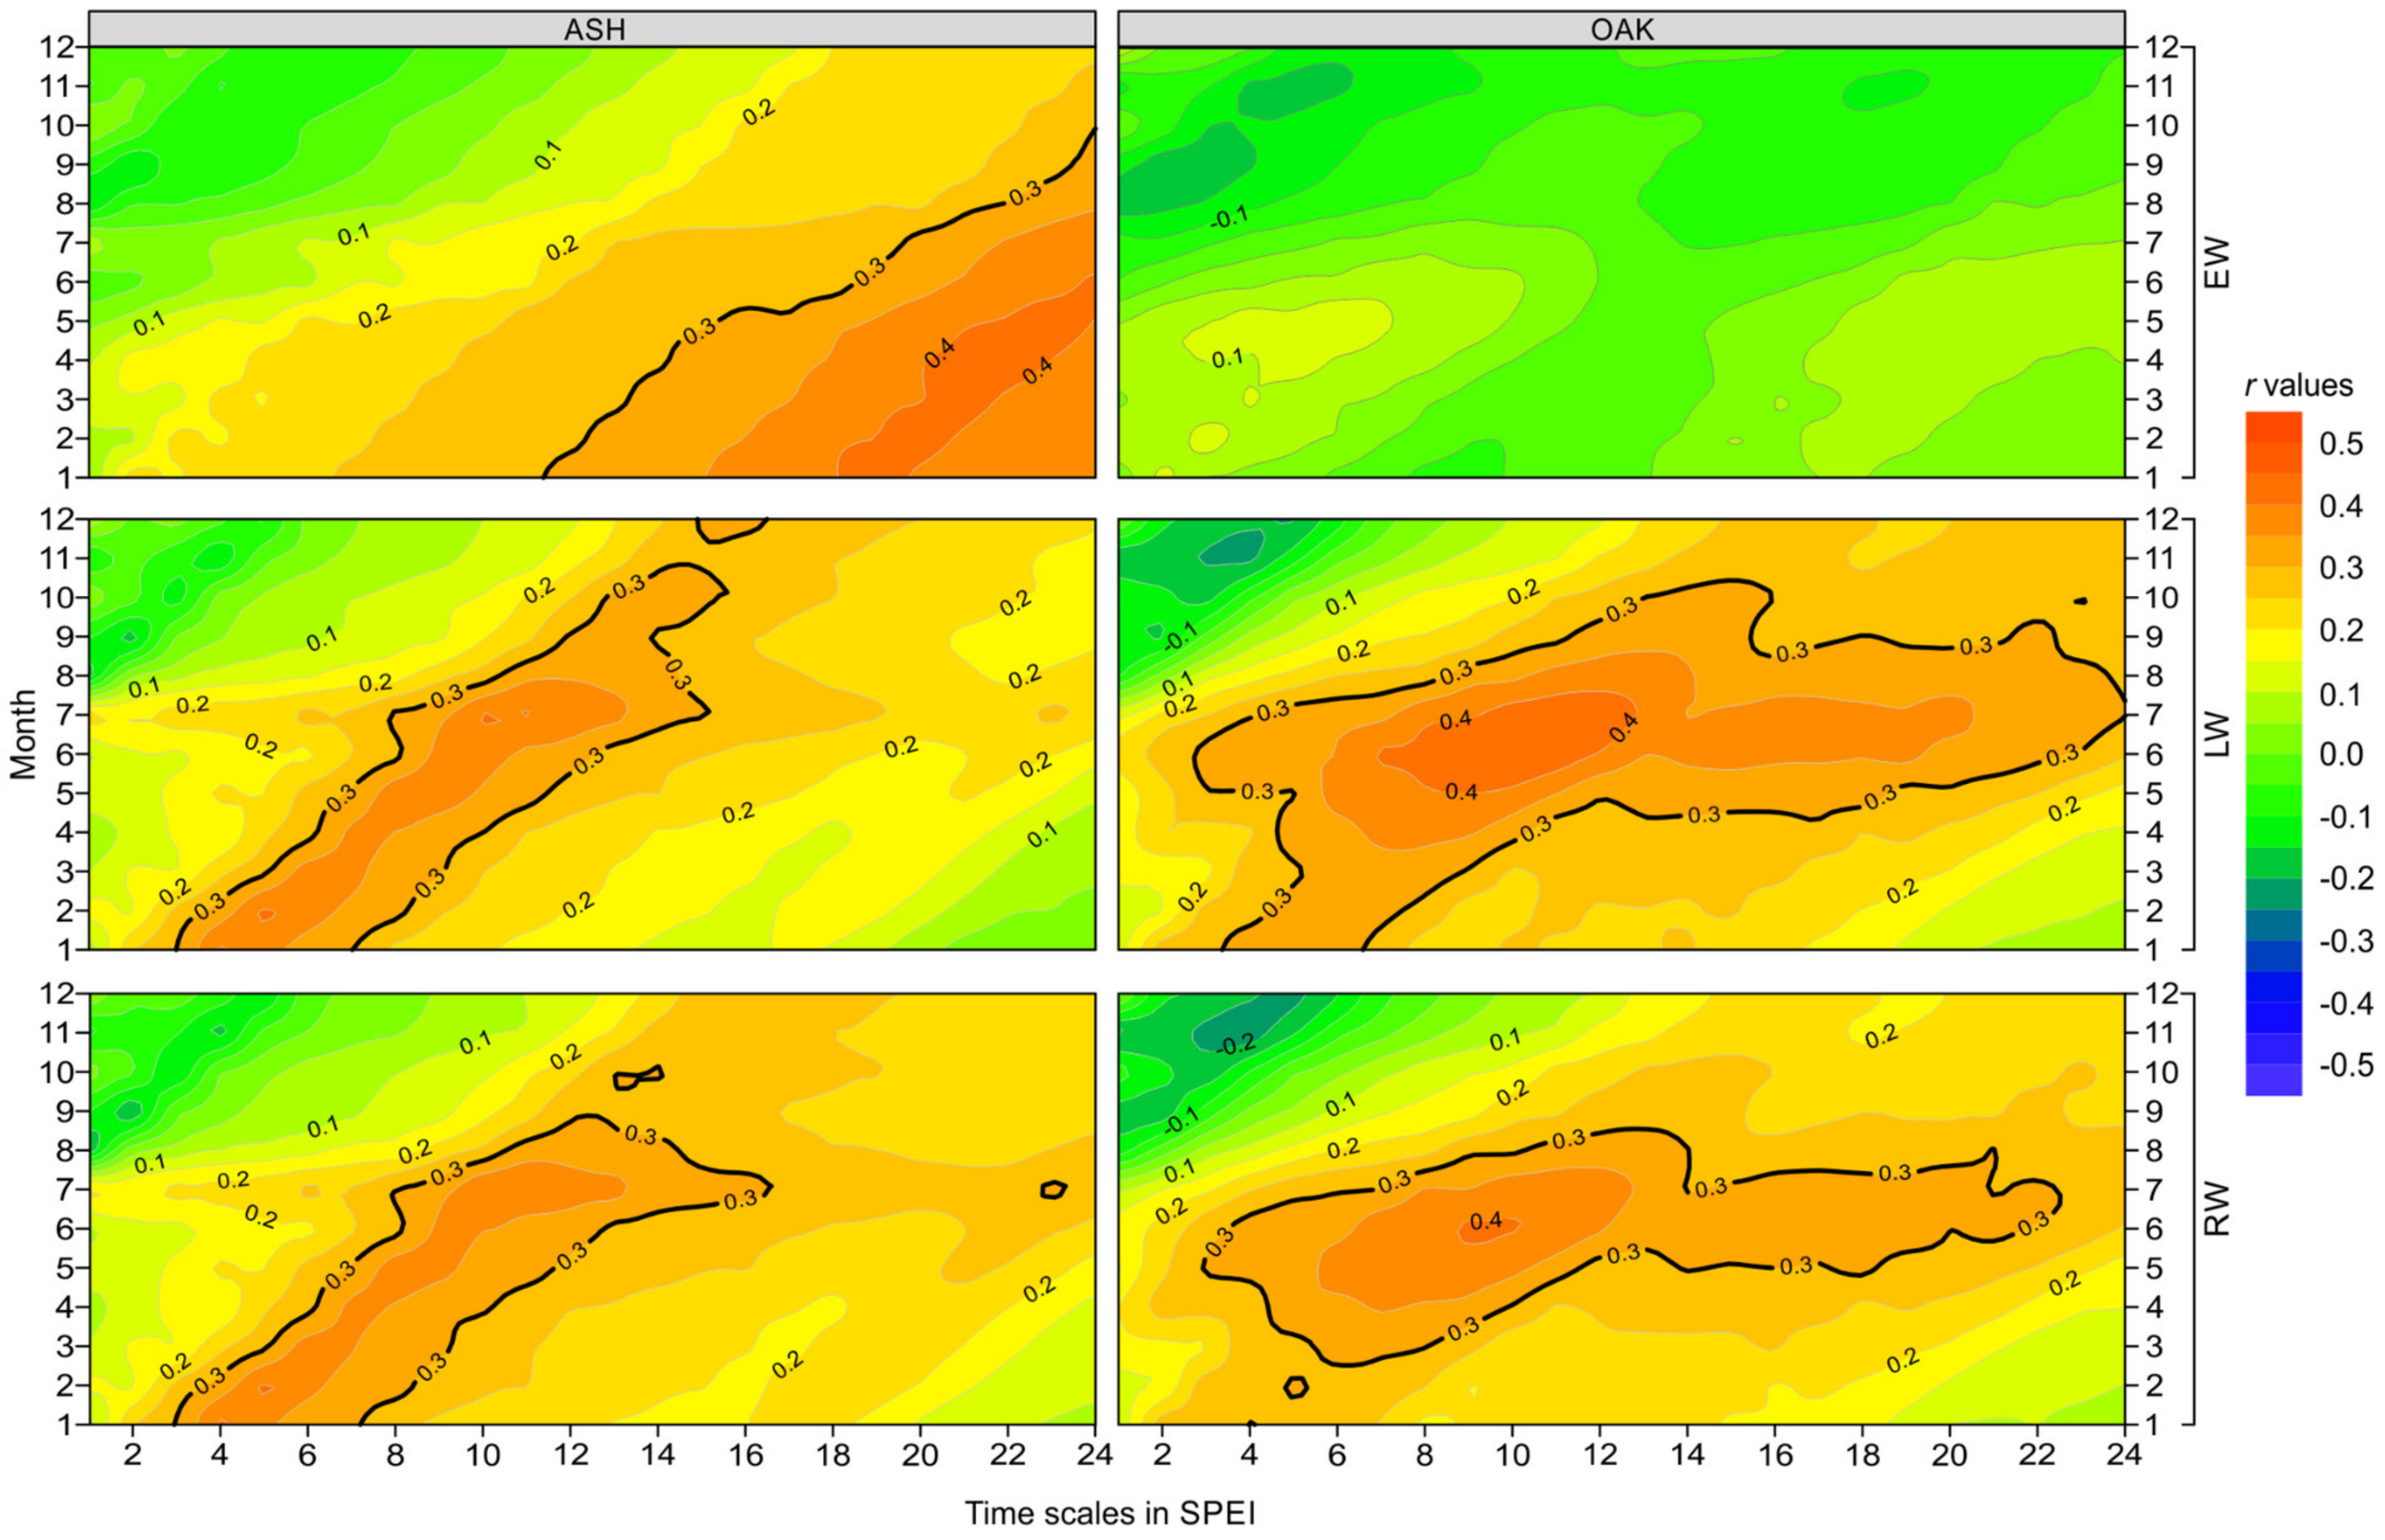
3.2.2. Correlation with the Drought Index

Analysis of the climate–growth relationship using a drought index (e.g., SPEI) has the advantage of combining the influences of the water deficit and temperature on tree growth into a single climate parameter. The obtained insignificant correlation for oak EW with the SPEI index, comparable to the other climatic parameters, confirms the low potential of the oak EW in dendroclimatological studies. Ash EW is sensitive to cumulative drought only on a time scale higher than 12 months. The correlation between LW and SPEI reveals distinct responses for ash and oak on both short and long term cumulative SPEI. For ash, the correlation begins to be significant only when the previous autumn conditions are included in the cumulative SPEI index. For oak LW, in addition to a similar response as for ash LW, we found a significant correlation with the current summer SPEI index, for cumulative periods higher than 3 months (Figure 5). The ash and oak RW reflect a similar SPEI response as LW (Figure 5).
Being a floodplain forest species, ash is well adapted to high levels of groundwater and it is negatively influenced by low soil humidity in the drought periods [26]. Ash response to long drought periods is in line with the general assumption that the species has a typical plate root system with endo-mycorrhizae [30], which allows exploitation of the upper horizons of the soil and being sensitive to decreasing soil humidity, a limitation set by the permanent groundwater level [86]. In dry sites, the ash water requirements are moderate, due to a lower maximum stomatal conductance and better control of stomatal activity [30] and due to elastic adjustments of cell walls, that can tolerate dehydration [29,87], a strategy similar to trees from dry sites [30].
Unlike ash, oak has a deeper roots system with ectomycorrhizae [88]. The deep roots allow access to groundwater, while the fine roots and mycorrhizal hyphae utilize surface water infiltrated from heavy rain events during summer. In this way, oak can access groundwater and nutrients from deeper layers during long drought periods when the soil surface is extremely dry [88,89]. Several authors have shown that floodplain oaks forests, from the south-eastern part of Europe, were affected by the annual successive extreme drought events, which led to ”a significant increase of sensitivity to increasing temperatures and decreasing river levels” [13,26,90]. As drought frequency will increase, tree species will become even more sensitive and this might lead to a general ecophysiological weakening of forest ecosystems. Although, the expected warmer climate will be, most likely, the first driver of growth decline, in species with creeping roots like beech and spruce [91,92], cases in which the absorbent fine roots are present in the top layer of the soil.

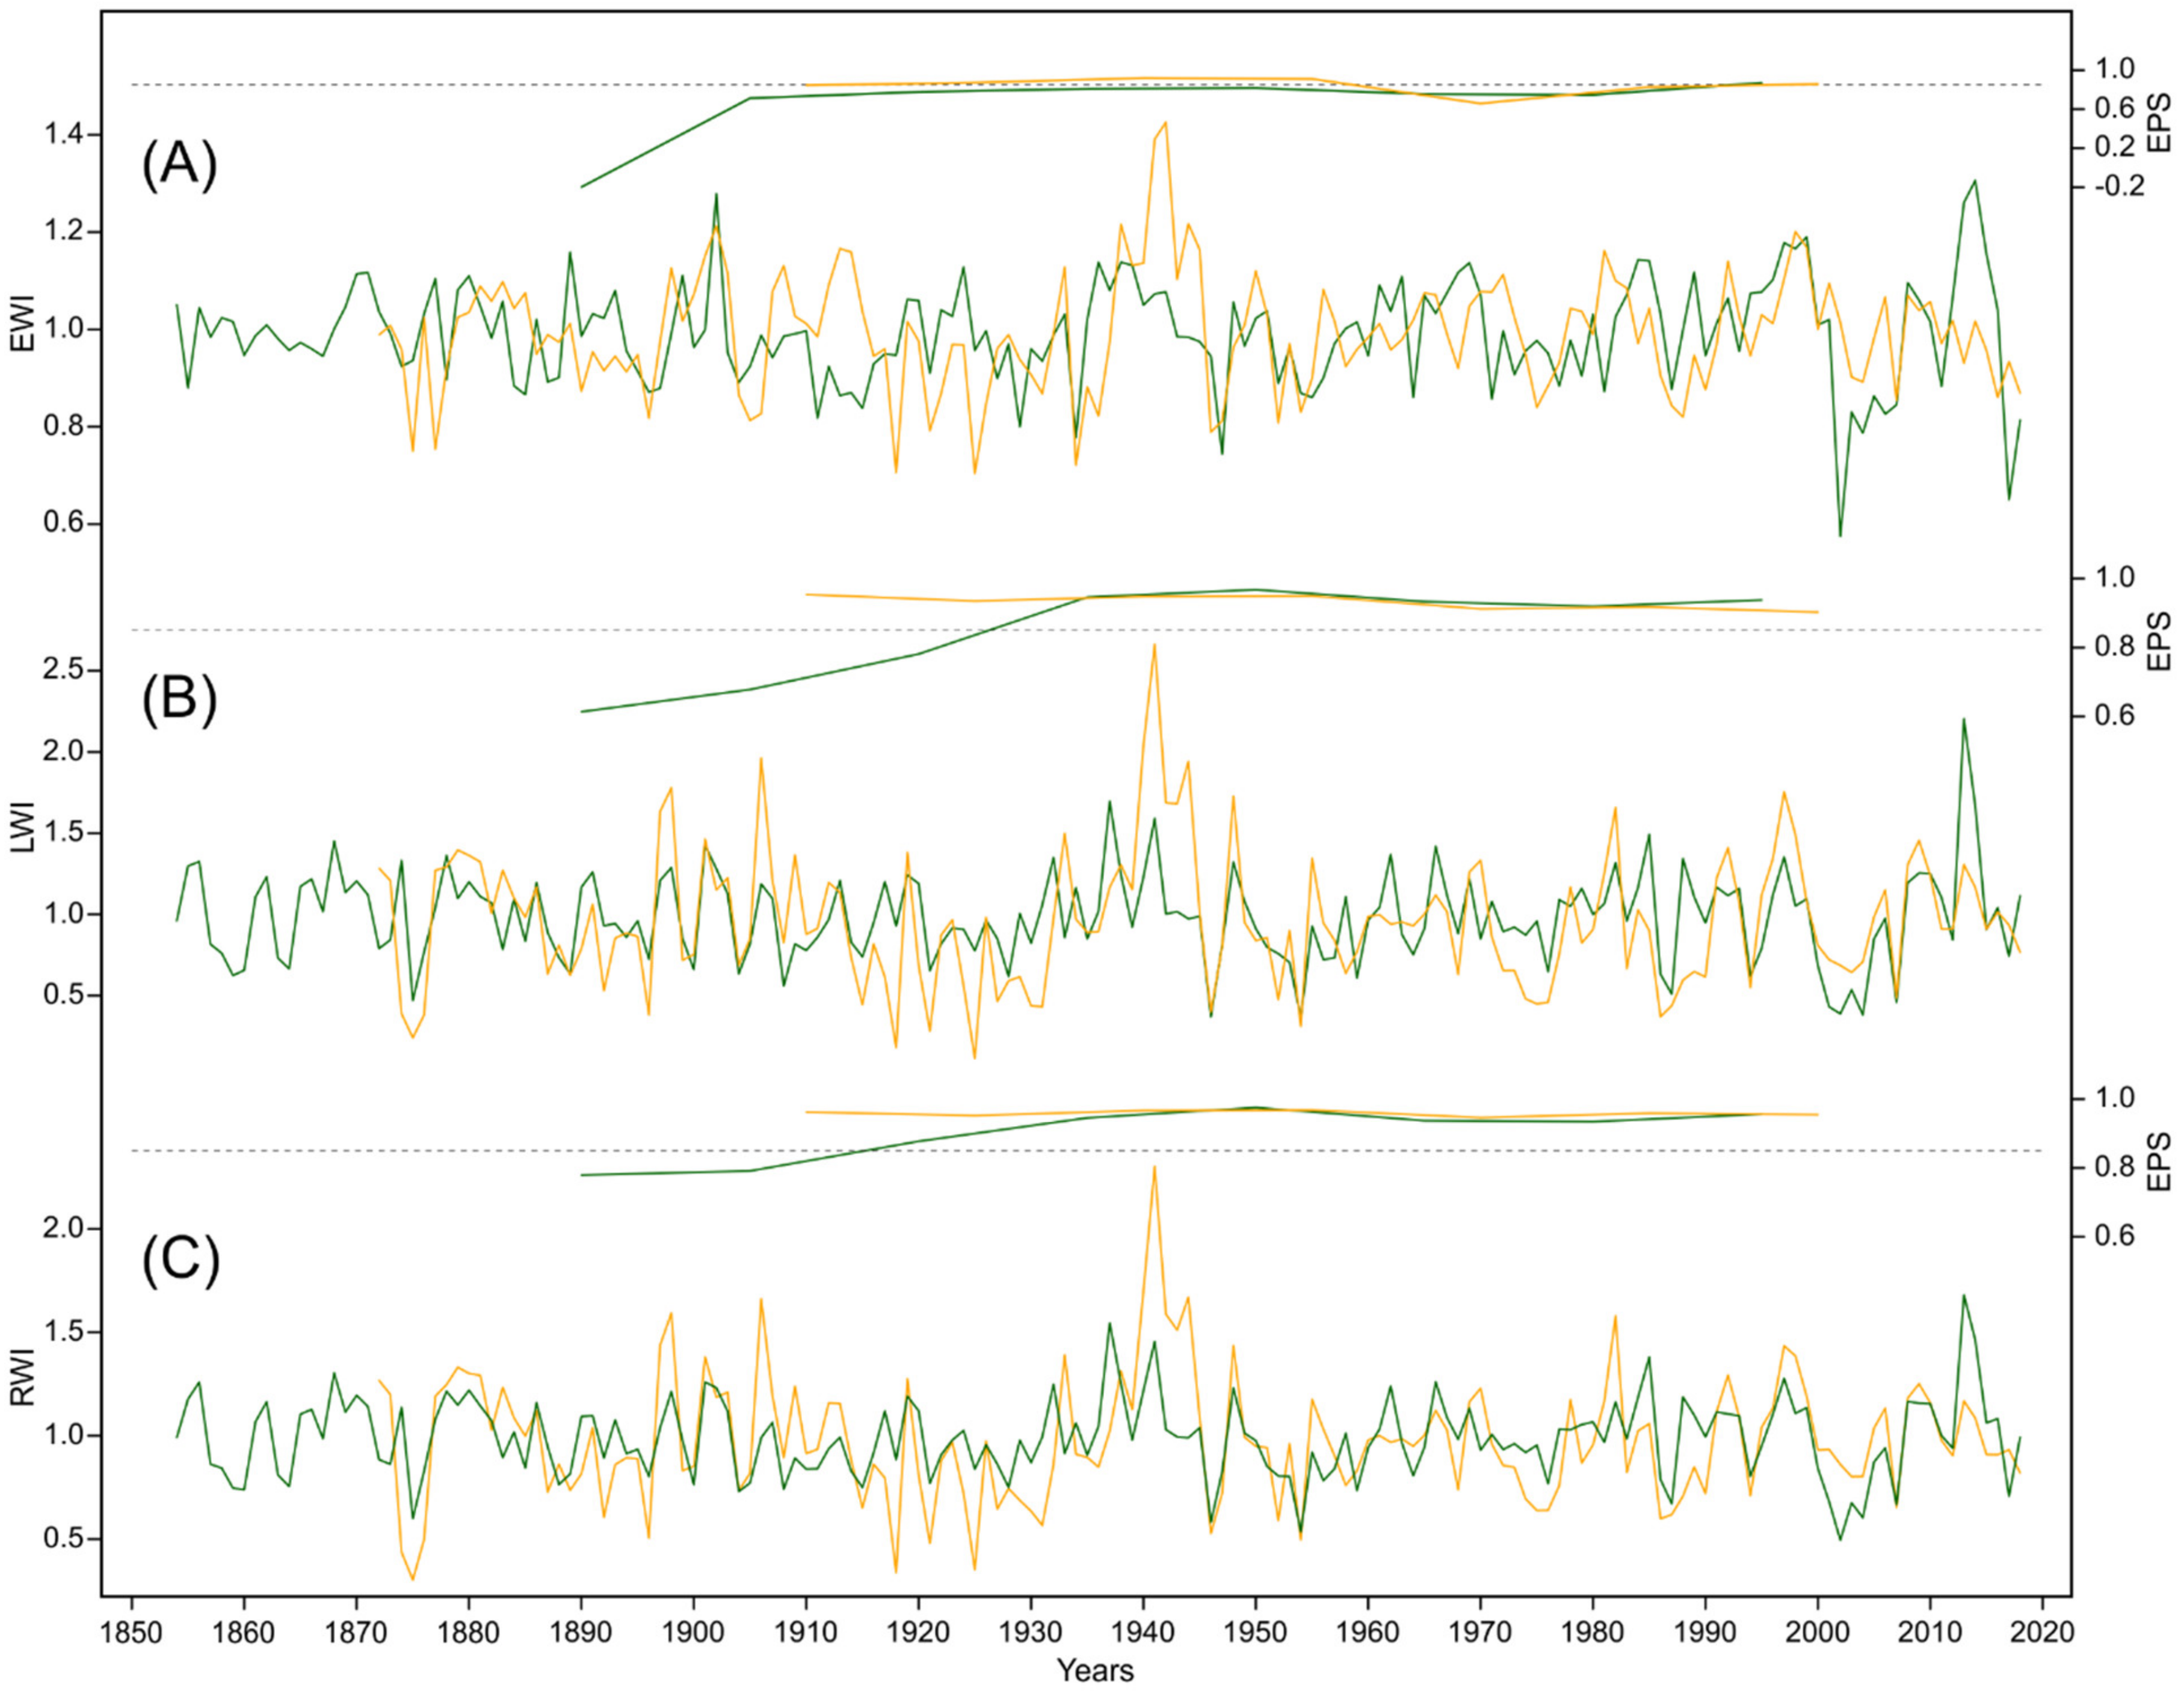
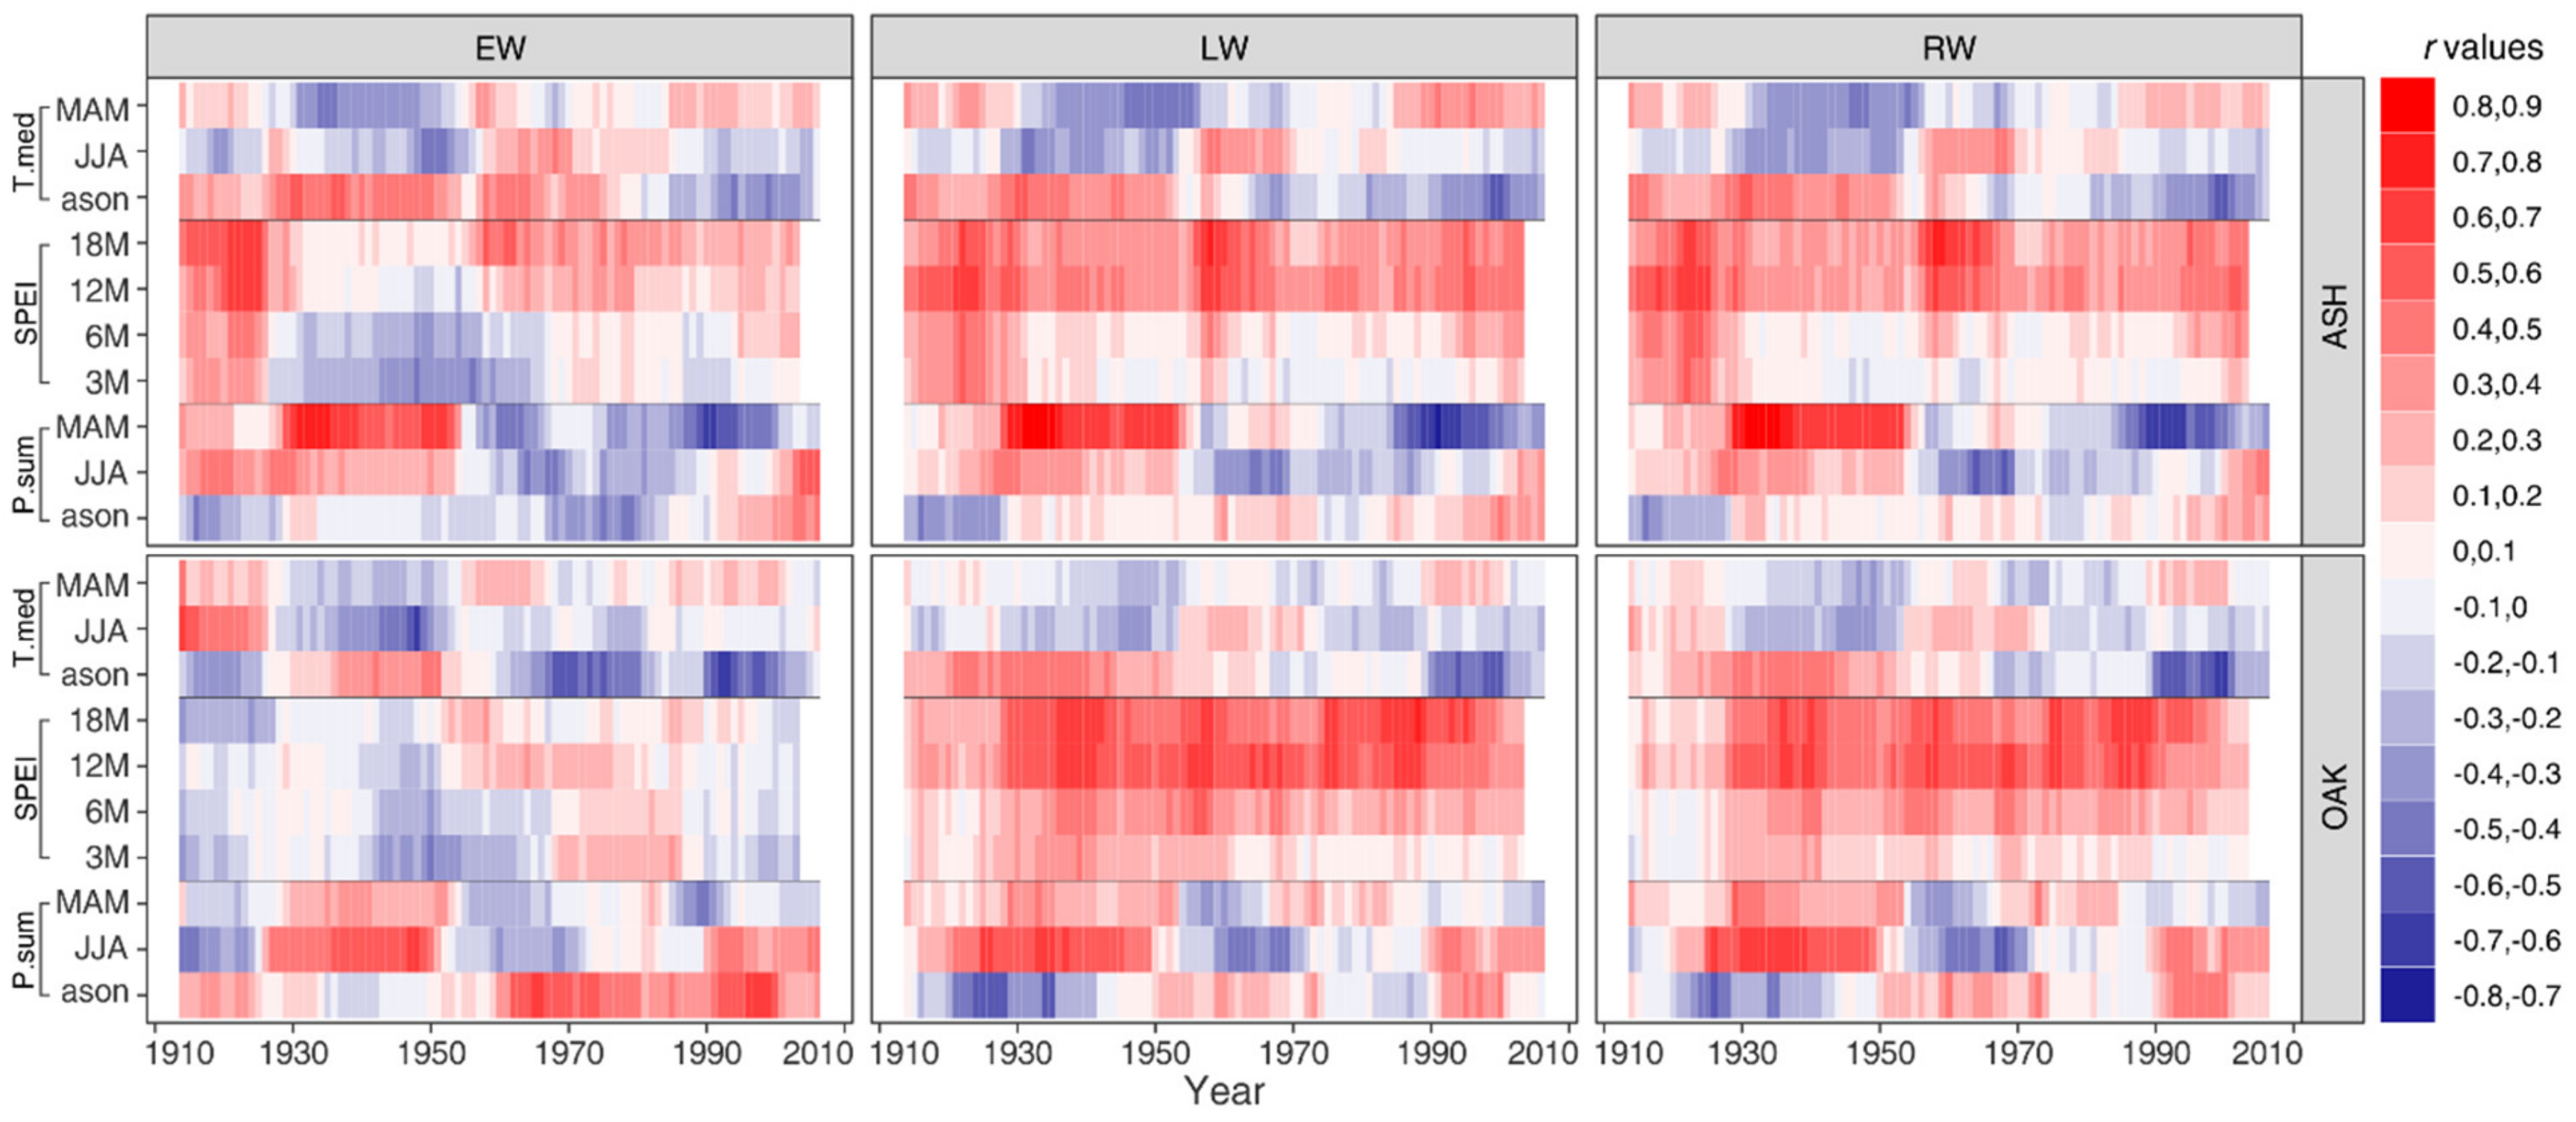
3.2.3. Temporal Stability of the Dendroclimatic Response
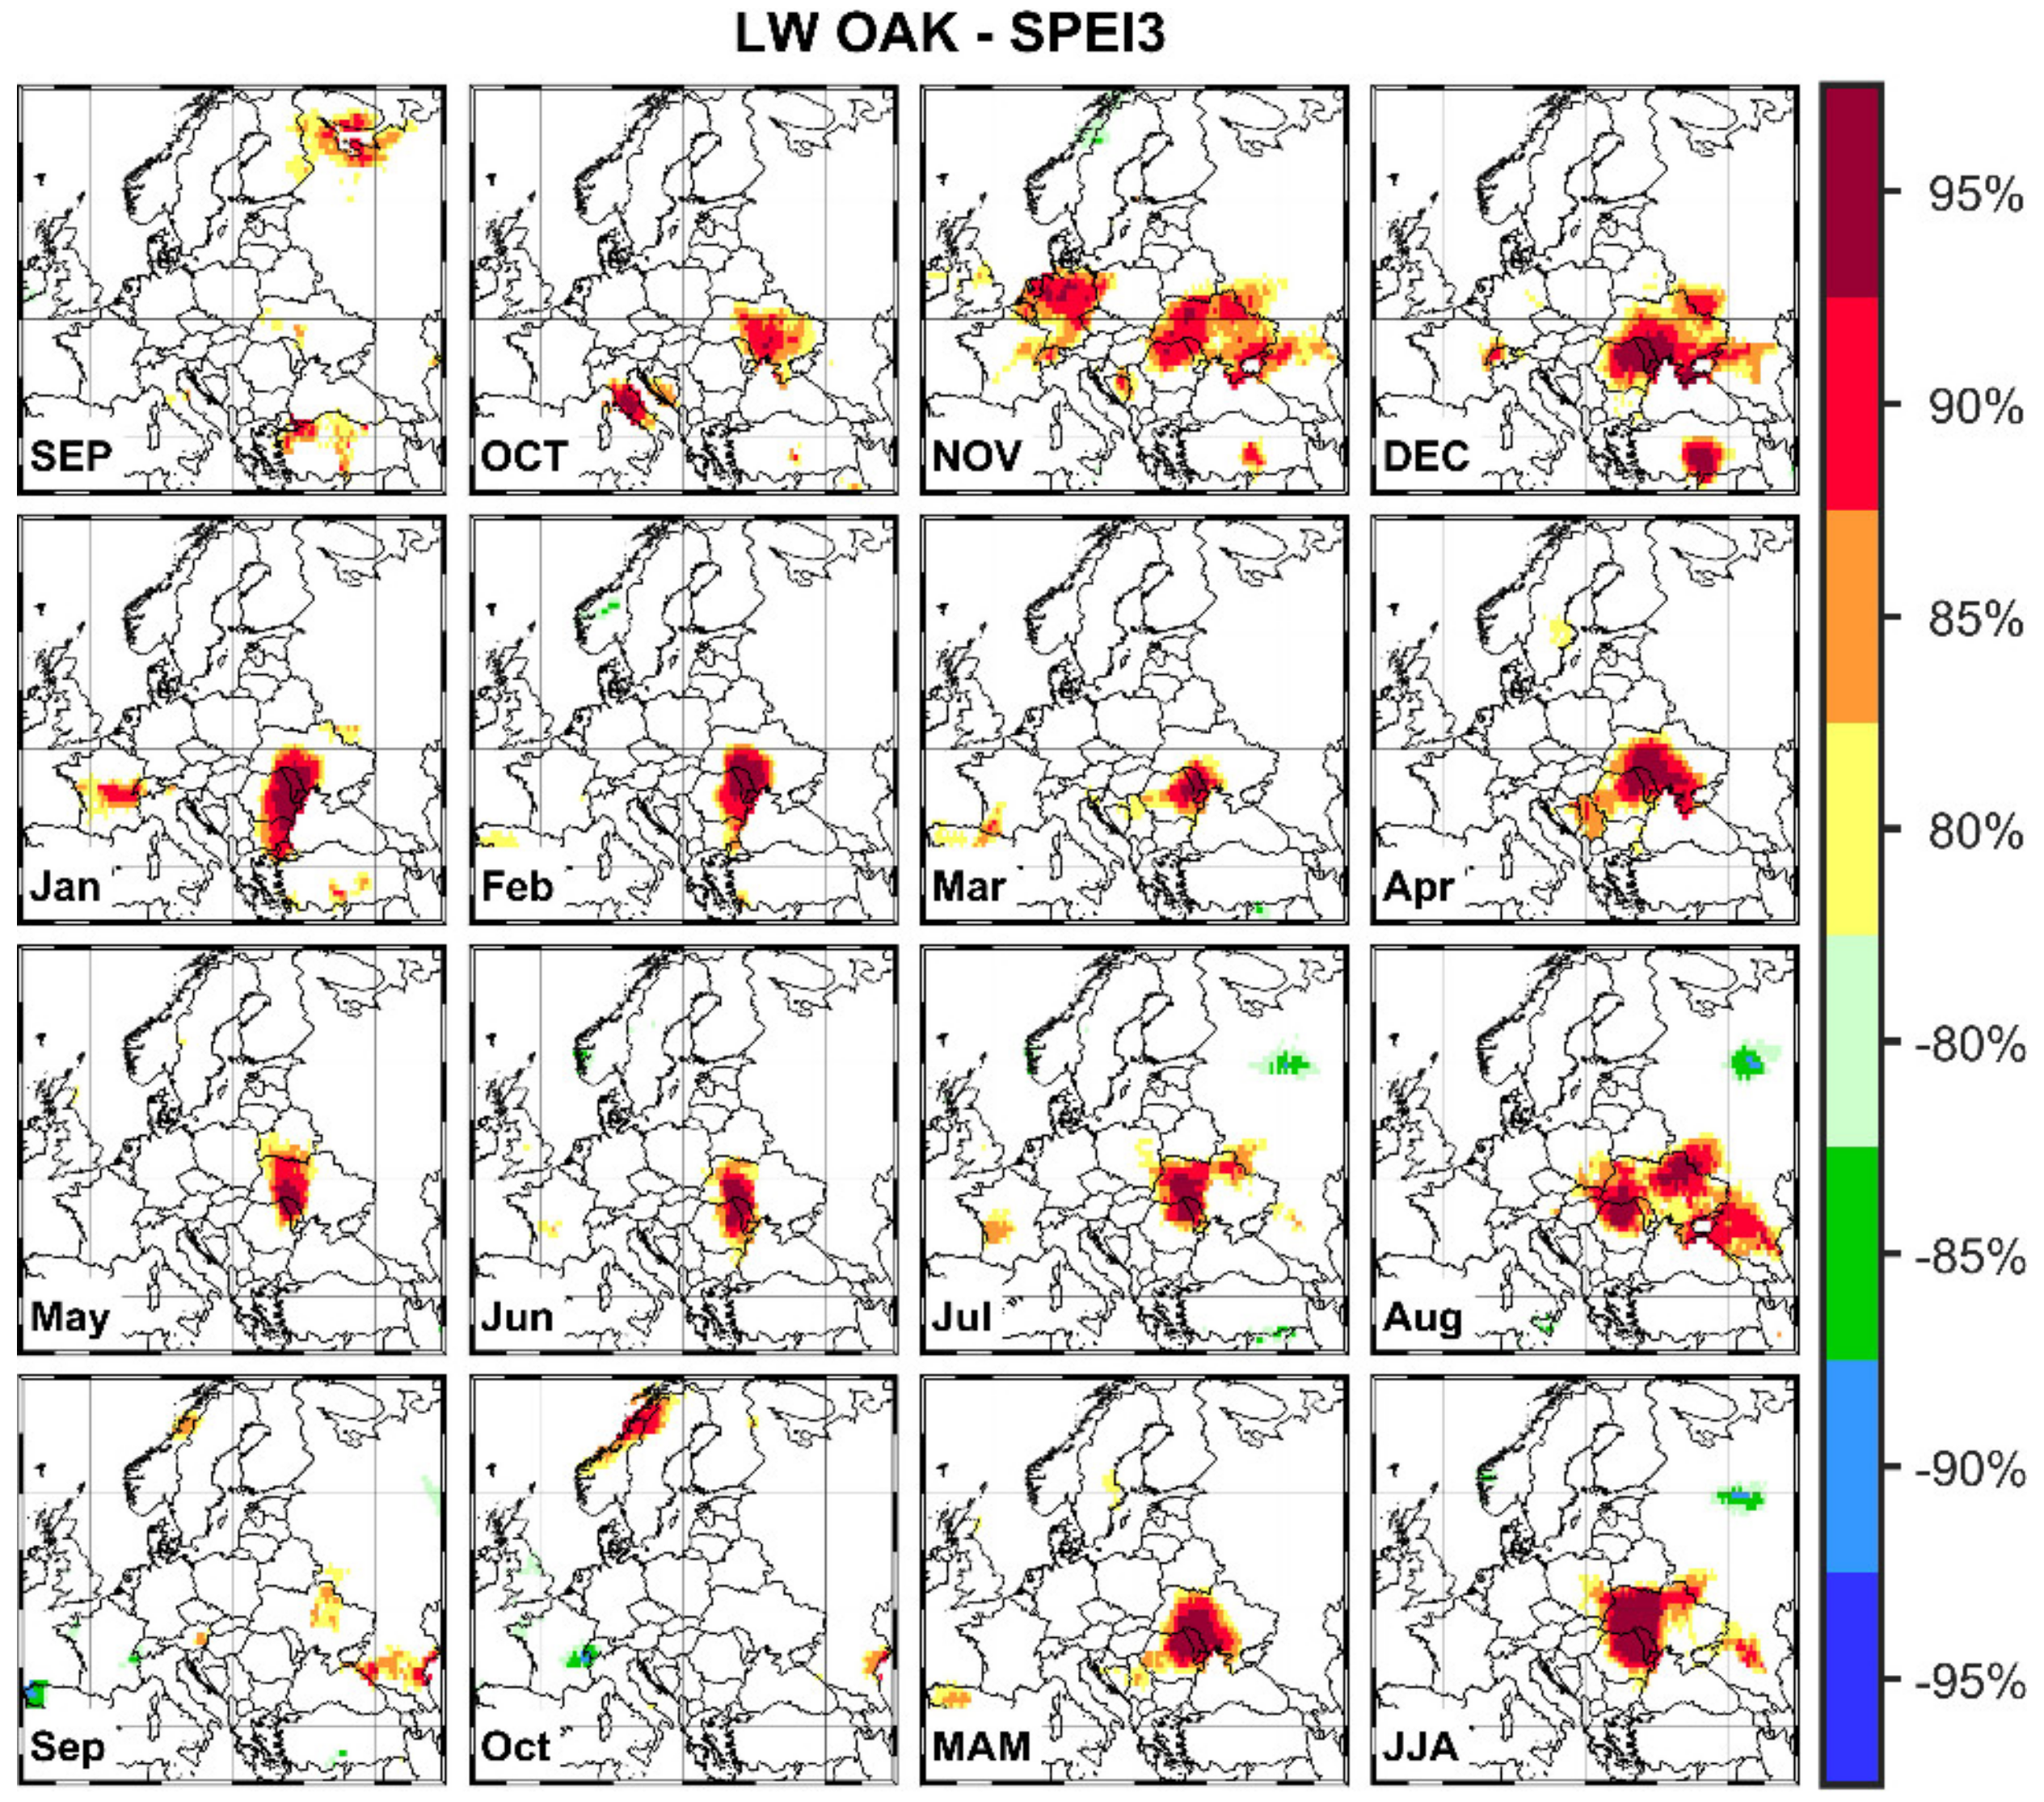
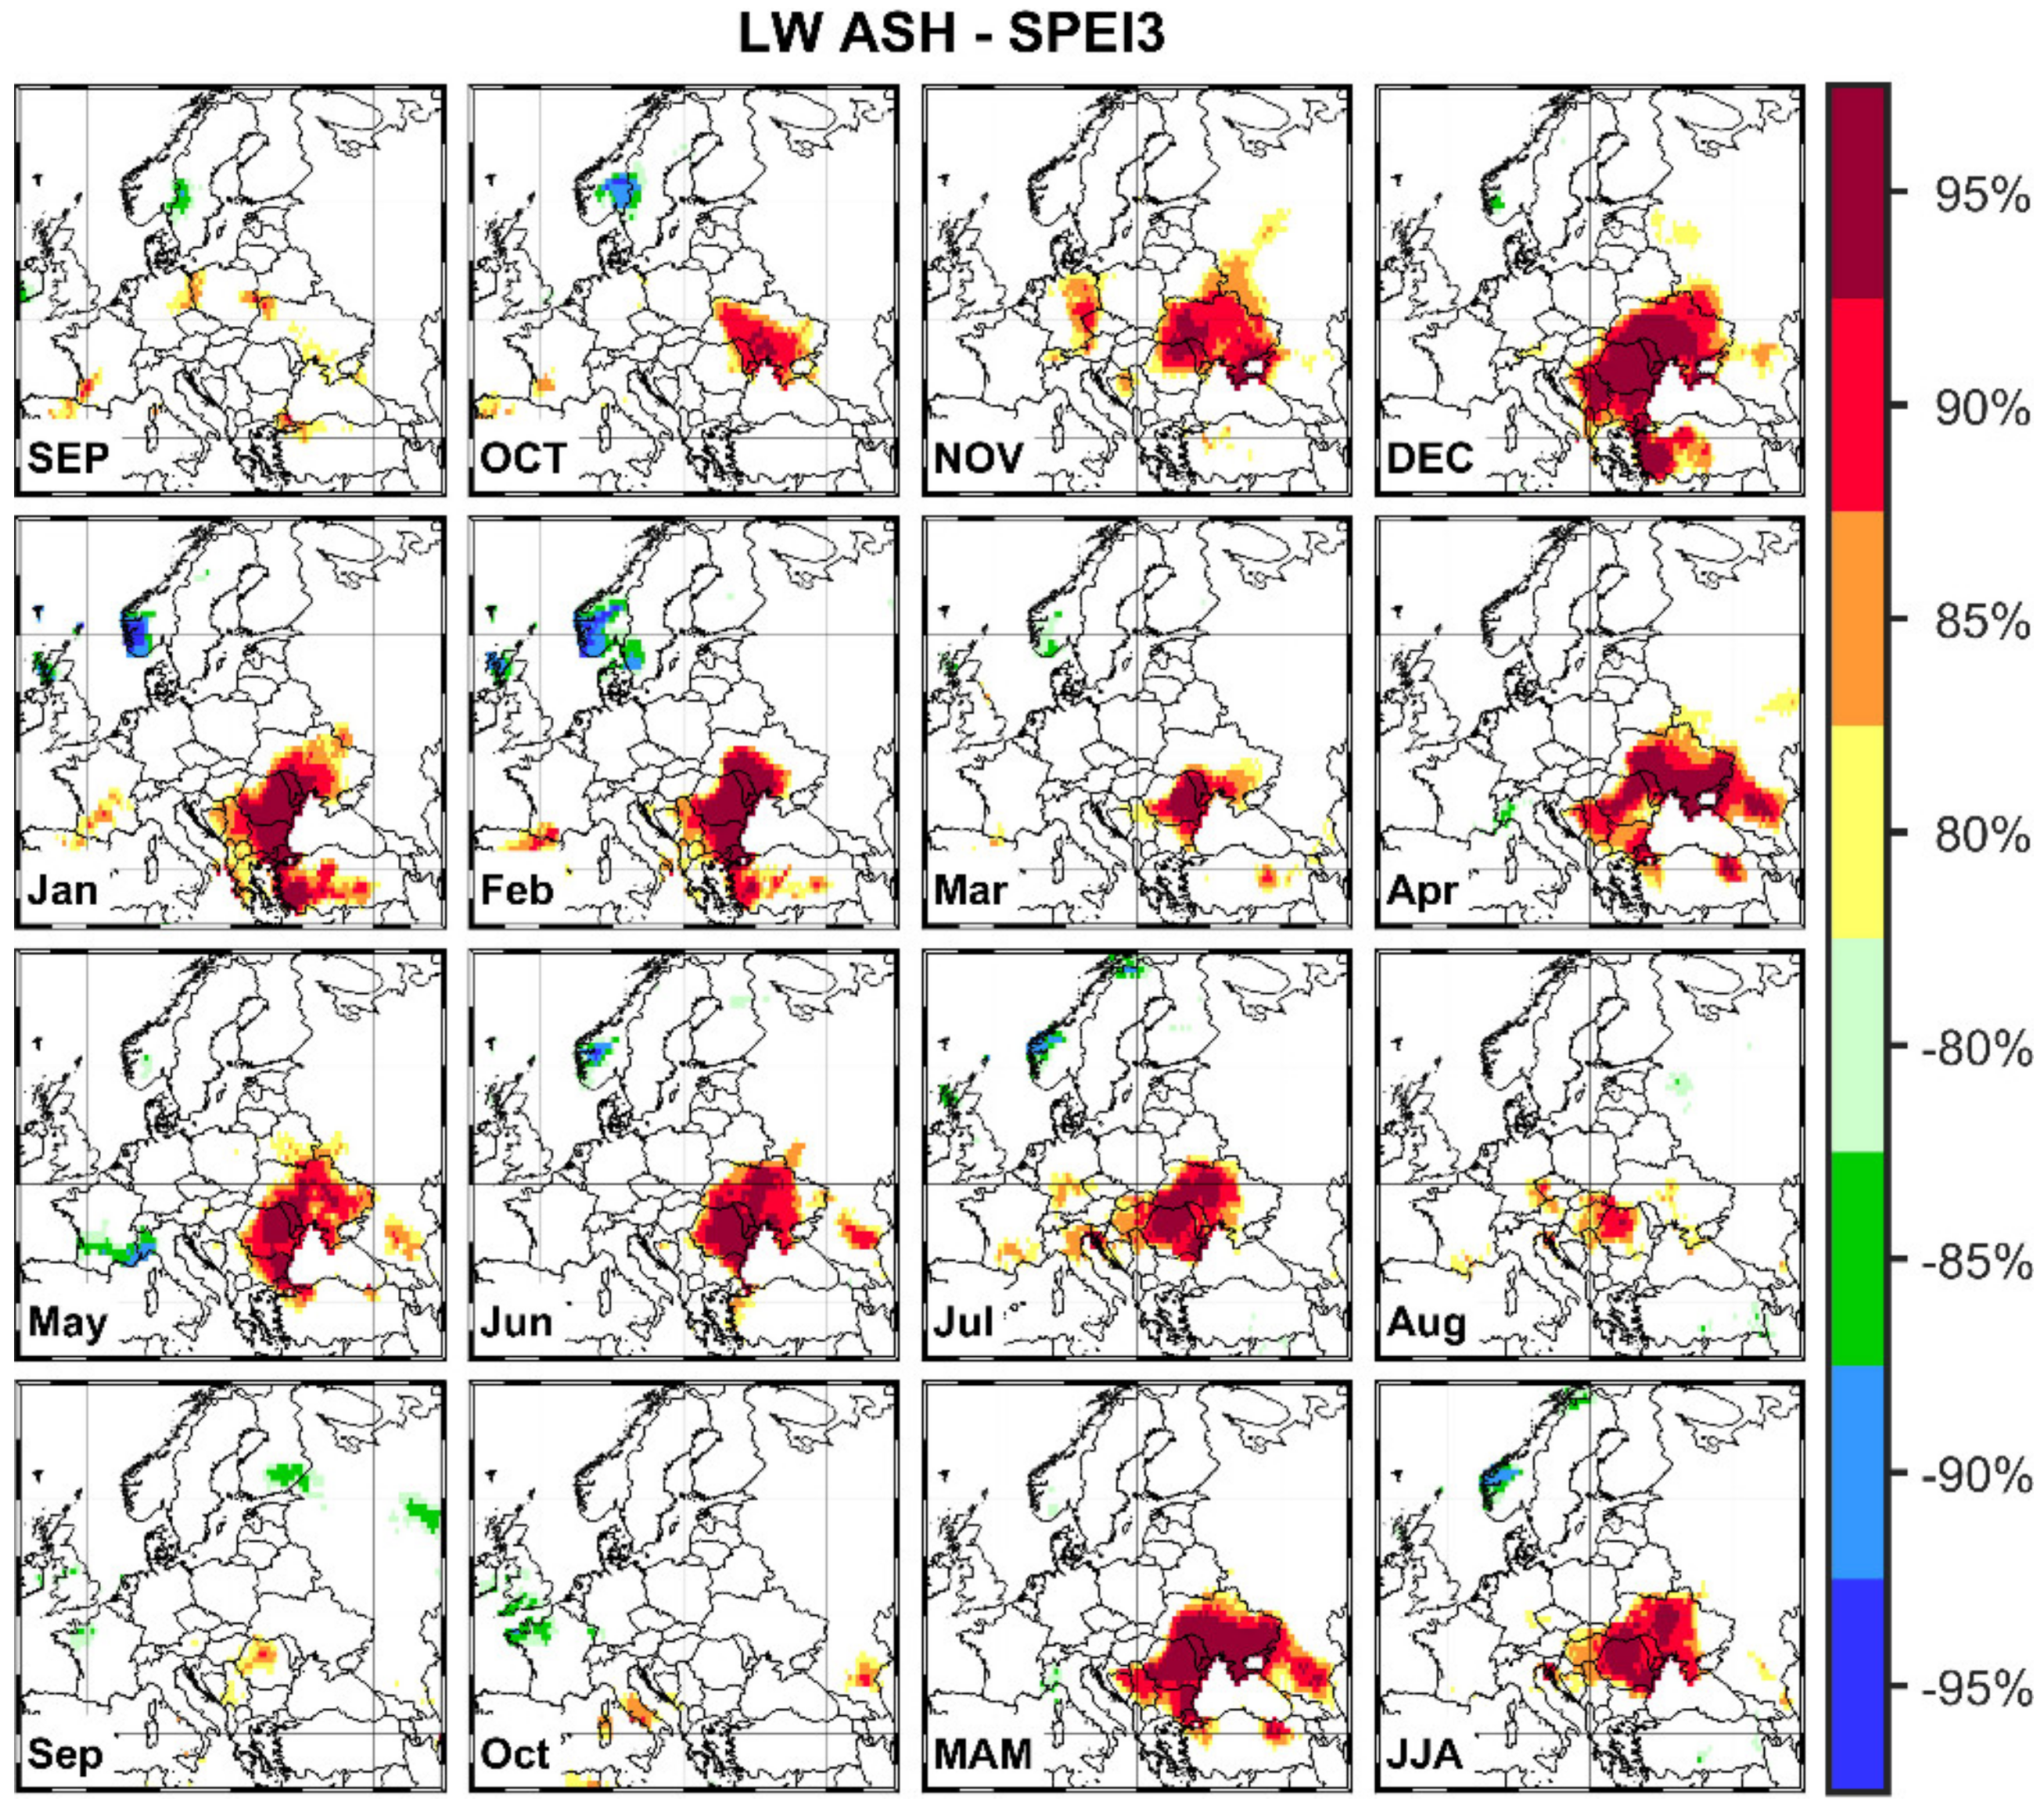
The seasonal climate growth relationship presents different temporal stability. The significant positive response of both species to spring precipitation at the beginning of the last century changes into a negative correlation in the last 40 years. The shift in the response is more evident for ash compared to oak (Figure 6). Additionally, for oak EW, starting in 1960 appears a significant correlation with precipitation from the previous autumn. The significant positive influence of previous autumn temperature present in the first half of the 20th century has changed into a low-significance negative influence in the last decades for all tree ring components for both species except for oak EW, which does not present the significant correlations as usual. The LW and RW for both species present a strong and constant temporal stability to the SPEI index over the analyzed period.
Changes in response patterns were identified in diverse conditions in Europe or as a result of severe drought periods [24,26,93]. As climate change intensified in the last decades, some trees’ physiological boundaries may be exceeded and could induce temporal changes in dendroclimatic response patterns. The extreme warm springs and summers are characterized by very high vapor pressure and low precipitation amounts, which indicate high atmospheric humidity and low soil water availability. In these conditions, the vapor pressure deficit between leaves and air decreases, and trees reduce the transpiration rates and increase the CO2 intake, through high stomatal conductance [94,95]. The soil nutrients play an important role in tree recovery after water stress periods. The phaeozem soil type has a high nutrient availability and this can increase water use efficiency thus minimizing negative feedback between carbon and nutrient balance [96]. Otherwise, pedological droughts induce soil compaction by decreasing soil porosity, aeration, and water infiltration capacity. These factors could lead to physiological dysfunctions in plants, influencing root development, making them unable to support physiological growth requirements [97], which could affect the temporal stability of the dendroclimatic pattern. Additionally, uncertainties induced by climatic data sets can obscure the dendroclimatic response [98], taking into account that, in the Republic of Moldova, there are few meteorological stations with short climatic records, which offer a low representativity in the gridded CRU database. The exogenous disturbance signals (like insects or fungi outbreaks, pollutants), although these factors were not observed in our data, can modify tree reactions to climate conditions [99,100]. Another reason behind the climate–growth response pattern might be due to the abrupt decrease in the snow cover in the last decades, over the analyzed region [101] and an increase in winter precipitation. A shift in the melt season date, due to less snow cover and more precipitation, can affect the initiation of cambial activity (necessary for the wood cells division and development). The authors of [102] have shown that delays in the snowmelt date, corroborated with increased winter precipitation can induce temporal changes in climate–growth response.

3.3. Stability Maps

Tree ring-based proxies (e.g., RW, MXD, stable oxygen, and carbon isotopes) are largely used to study the long-term climate variability [67,103,104,105]. Nevertheless, one big challenge in dendroclimatological studies is the stationarity of the relationship between the tree ring proxies and climate-related variables [67,103,106,107]. Furthermore, a stable relationship between proxy-based data and climate is essential to develop further adaptative silvicultural measurements. In order to be able to test the stability, in time, of the relationship between our proxy data and climate-related variables, in this study, we computed the stability maps between EW, LW, and RW in oak and ash and PP, Tmax, scPDSI, and SPEI3 over the period 1902–2018. The basic idea of the stability maps is to identify regions where the correlation between the proxy data and the climate variables does not change over time. The oak EW does not show any stable and significant correlations with any of the analyzed variables. The oak LW shows positive stable and significant correlations with SPEI3 (scPDSI) from February until September over the eastern part of Europe (Figure 7 and Figure S1) and negative stable and significant correlation with the summer maximum temperature close to the location of our sampling area (Figure S3).
Similar results (positive and stable correlations with SPEI3/scPDSI and negative and stable correlations with Tmax over the eastern part of Europe) are found also in the case of ash RW (Figure 8, Figures S2 and S4). One interesting aspect of the analysis of the stability maps for oak is that the stable correlations with scPDSI (Figure S1) are extending over a larger area and throughout the whole year when compared with SPEI3 drought index (Figure 7), indicating that LW and RW in oak are very sensitive to the soil moisture conditions (a parameter used in the computation of scPDSI drought index). The sensitivity to the soil moisture conditions might be due to the fact that oak has very deep rooting systems which facilitate a good uptake of the nutrients and soil moisture even from the deep soil in conditions of a lack of precipitation, thus the soil moisture is a key element in the development of tree ring-based proxies with a deep rooting system.
In the case of ash, positive, stable, and significant correlations, throughout the year (January to September) are found for all the analyzed parameters: EW, LW, and RW (not shown). Ash LW and RW show also positive and stable correlations with spring (MAM) precipitation and spring (MAM) maximum temperature in the eastern part of Europe. A general outcome of the stability maps analysis is that both oak and ash respond stably and significantly to SPEI3 drought index, over the eastern part of Europe. The response to maximum temperature is seasonally dependent and just LW and RW show significant and stable correlations with the maximum temperature.

4. Conclusions

In this study, we developed and presented the first differentiated earlywood and latewood oak chronologies for the Eastern part of the Republic of Moldova, and one of the first differentiated ash chronologies in Europe. This study allows us to cover the knowledge gap of temporal stability and the climatic response of oak and ash over the analyzed region. The differentiated analyses show that the ash EW records a different climatic signal compared to LW, while the oak EW does not register a significant climatic signal. The RW, for both ash and oak, shares a similar climatic response as LW.
Analysis of the climate–growth relationship reveals a significant negative correlation with the mean temperature and a significant positive correlation with precipitation and SPEI drought index for both ash and oak tree ring width components. Despite the significant correlation with precipitation and temperature for the whole period, the 25-year moving correlation analyses show that they are not stable in time and can switch from positive to negative or vice versa, while the correlation with SPEI drought index, which is a reflection of both climatic parameters, is stable over time.
Based on the stability map analyses, we show that oak (and ash) tree ring components from the eastern part of the Republic of Moldova have a stable and significant correlation with SPEI3 and scPDSI drought indices from February (January) until September, over the eastern part of Europe. The correlation between oak LW and scPDSI is extended over a larger area throughout the whole year when compared with the SPEI3 drought index, indicating that oak LW is very sensitive to the soil moisture conditions (a parameter used in the computation of scPDSI drought index). Additionally, ash LW shows positive and stable correlations with spring (MAM) precipitation and spring (MAM) maximum temperature in the eastern part of Europe, and oak LW shows a negative, stable, and significant correlation with the summer maximum temperature close to the location of our sampling area. The response to maximum temperature is seasonally dependent and just LW and RW show significant and stable correlations with the maximum temperature.
The different, but high sensibility of the oak and ash tree species to long term droughts events, which directly affect the tree growth, can be used as an early-warning sign of the necessity to adopt proper forest management plans and strategies, which are crucial to increase forest resilience and resistance to upcoming future extreme events.

Supplementary Materials

The following are available online at https://www.mdpi.com/1999-4907/11/5/600/s1, Figure S1. Stability map of the correlation between oak LW and scPDSI from the previous year September until the current year October. Regions, where the correlation is stable, positive, and significant for at least 80% of windows, are shaded with dark red (95%), red (90%), orange (85%), and yellow (80%). The corresponding regions where the correlation is stable, but negative, are shaded with dark blue (95%), blue (90%), green (85%), and light green (80%). SEP—September previous year, OCT—October previous year, NOV—November previous year, DEC—December previous year, Jan—January, Feb—February, Mar—March, Apr—April, May—May, Jun—June, Jul—July, Aug—August, Sep —September, Oct—October, MAM—March/April/May, and JJA—June/July/August. Analyzed period: 1902–2018. Figure S2. As in Figure S1, but for Tmax. Figure S3. As in Figure S1, but for ash. Figure S4. As in Figure S1, but for ash and Tmax.

Author Contributions

C.-C.R. and V.S. designed the study and wrote the article draft; C.-C.R., I.P. and M.I. designed methodology and analyzed the data; V.S. and I.L. collected and measured the cores; V.N., A.M., M.I. and F.C. helped with the writing of the original draft, interpreting the results, and review. All the authors contributed critically to the draft writing and gave the final acceptance for publication. All authors have read and agreed to the published version of the manuscript.

Funding

C.-C.R. was partially supported from contract no. 18PFE/16.10.2018 funded by Ministry of Research and Innovation within Program 1—Development of national research and development system, Subprogram 1.2—Institutional Performance, RDI excellence funding projects. C.-C.R. was, also partially supported by the EU cross-border project ”Promote deadwood for resilient forests in the Romanian-Ukrainian cross border region” (RESFOR), no. 2SOFT/1.2/13. M.I. was funded by the AWI Strategy Fund Project—PalEX and by the Helmholtz Climate Initiative—REKLIM. P.I. was partially supported by project PN19070502.

Acknowledgments

We want to thank the anonymous reviewers for their constructive comments, which helped us to improve the manuscript. Also, we thank to Florentin Scorțesco for his support and for assistance in the fieldwork.

Conflicts of Interest

The authors declare no conflict of interest.

References

  1. IPCC. Global Warming of 1.5 °C. An IPCC Special Report on the Impacts of Global Warming of 1.5°C above Pre-Industrial Levels and Related Global Greenhouse Gas Emission Pathways, in the Context of Strengthening the Global Response to the Threat of Climate Change, Sustainable Development, and Efforts to Eradicate Poverty; IPCC: Geneva, Switzerland, 2018. [Google Scholar]
  2. Alexandrov, V.; Gajdusek, M.; Knight, C.; Yotova, A. Global Environmental Change: Challenges to Science and Society in Southeastern Europe: Selected Papers presented in the International Conference, Sofia Bulgaria, 19–21 May 2008; Springer Netherlands: Dorleck, The Netherlands, 2010. [Google Scholar] [CrossRef]
  3. Di Filippo, A.; Alessandrini, A.; Biondi, F.; Blasi, S.; Portoghesi, L.; Piovesan, G. Climate change and oak growth decline: Dendroecology and stand productivity of a Turkey oak (Quercus cerris L.) old stored coppice in Central Italy. Ann. Forest Sci. 2010, 67, 706–706. [Google Scholar] [CrossRef] [Green Version]
  4. Gentilesca, T.; Camarero, J.; Colangelo, M.; Nole, A.; Ripullone, F. Drought-induced oak decline in the western Mediterranean region: An overview on current evidences, mechanisms and management options to improve forest resilience. iForest Biogeosci. For. 2017, 10, 796–806. [Google Scholar] [CrossRef] [Green Version]
  5. Lindner, M.; Maroschek, M.; Netherer, S.; Kremer, A.; Barbati, A.; Garcia-Gonzalo, J.; Seidl, R.; Delzon, S.; Corona, P.; Kolström, M.; et al. Climate change impacts, adaptive capacity, and vulnerability of European forest ecosystems. For. Ecol. Manag. 2010, 259, 698–709. [Google Scholar] [CrossRef]
  6. Helama, S.; Sohar, K.; Läänelaid, A.; Mäkelä, H.M.; Raisio, J. Oak Decline as Illustrated Through Plant–Climate Interactions Near the Northern Edge of Species Range. Bot. Rev. 2016, 82, 1–23. [Google Scholar] [CrossRef]
  7. Mette, T.; Dolos, K.; Meinardus, C.; Bräuning, A.; Reineking, B.; Blaschke, M.; Pretzsch, H.; Beierkuhnlein, C.; Gohlke, A.; Wellstein, C. Climatic turning point for beech and oak under climate change in Central Europe. Ecosphere 2013, 4, art145. [Google Scholar] [CrossRef]
  8. Führer, E. Oak Decline in Central Europe: A Synopsis of Hypotheses. In Proceedings of the Population Dynamics, Impacts, and Integrated Management of Forest Defoliating Insects, BanskA Stiavnica, Slovak Republic, 18–23 August 1996; USDA Forest Service General Technical Report NE-247. USDA Forest Service: Newtown Square, PA, USA, 1998. [Google Scholar]
  9. Colangelo, M.; Camarero, J.; Ripullone, F.; Gazol, A.; Sanchez-Salguero, R.; Oliva, J.; Redondo, M. Drought Decreases Growth and Increases Mortality of Coexisting Native and Introduced Tree Species in a Temperate Floodplain Forest. Forests 2018, 9, 205. [Google Scholar] [CrossRef] [Green Version]
  10. ICAS. Raport Privind Starea Fondului Forestier şi Rezultatele Activităţii Agenţiei Moldsilva în Perioada Anilor 2010–2015; ICAS: Chișinau, Moldova, 2016. [Google Scholar]
  11. Thomas, F.M.; BLANK, R.; Hartmann, G. Abiotic and biotic factors and their interactions as causes of oak decline in Central Europe. For. Pathol. 2002, 32, 277–307. [Google Scholar] [CrossRef]
  12. Sohar, K.; Helama, S.; Läänelaid, A.; Raisio, J.; Tuomenvirta, H. Oak decline in a southern Finnish forest as affected by a drought sequence. Geochron 2014, 41, 92–103. [Google Scholar] [CrossRef] [Green Version]
  13. Stojanović, D.B.; Levanič, T.; Matović, B.; Orlović, S. Growth decrease and mortality of oak floodplain forests as a response to change of water regime and climate. Eur. J. For. Res. 2015, 134, 555–567. [Google Scholar] [CrossRef]
  14. Cufar, K.; Grabner, M.; Morgos, A.; Martinez del Castillo, E.; Merela, M.; De Luis, M. Common climatic signals affecting oak tree-ring growth in SE Central Europe. Trees 2014, 28, 1267–1277. [Google Scholar] [CrossRef]
  15. Starkey, D.A.; Oliveria, F.; Mangini, A.; Mielke, M. Oak decline and red oak borer in the interior highlands of Arkansas and Missouri: Natural phenomena, severe occurrences. In Upland Oak Ecology Symposium: History, Current Conditions, and Sustainability; Southern Research Station: Asheville, NC, USA, 2004; pp. 217–222. [Google Scholar]
  16. Catton, H.; St., George, S.; Remphrey, W. An Evaluation of Bur Oak (Quercus macrocarpa) Decline in the Urban Forest of Winnipeg, Manitoba, Canada. Arboric. Urban For. 2007, 33, 22. [Google Scholar]
  17. Elliott, K.J.; Swank, W.T. Impacts of drought on tree mortality and growth in a mixed hardwood forest. J. Veg. Sci. 1994, 5, 229–236. [Google Scholar] [CrossRef] [Green Version]
  18. Nakajima, H.; Ishida, M. Decline of Quercus crispula in abandoned coppice forests caused by secondary succession and Japanese oak wilt disease: Stand dynamics over twenty years. For. Ecol. Manag. 2014, 334, 18–27. [Google Scholar] [CrossRef]
  19. Čufar, K.; De Luis, M.; Zupančič, M.; Eckstein, D. A 548-Year Tree-Ring Chronology of Oak (Quercus spp.) for Southeast Slovenia and its Significance as a Dating Tool and Climate Archive. Tree-Ring Res. 2008, 64, 3–15. [Google Scholar] [CrossRef]
  20. Kern, Z.; Grynaeus, A.; Morgos, A. Reconstructed precipitation for southern Bakony Mountains (Transdanubia, Hungary) back to 1746 AD based on ring width of oak trees. Időjárás 2009, 113, 299–314. [Google Scholar]
  21. Popa, I.; Caisîn, V. Comparative response of beech and oak to drought in Codrii Natural Reserve (R. Moldova). Bucov. For. 2015, 15, 45–53. [Google Scholar]
  22. Prokop, O.; Kolar, T.; Büntgen, U.; Kyncl, J.; Kyncl, T.; Bošeľa, M.; Choma, M.; Barta, P.; Rybníček, M. On the palaeoclimatic potential of a millennium-long oak ring width chronology from Slovakia. Dendrochronologia 2016, 40, 93–101. [Google Scholar] [CrossRef]
  23. Nechita, C.; Popa, I.; Eggertsson, Ó. Climate response of oak (Quercus spp.), an evidence of a bioclimatic boundary induced by the Carpathians. Sci. Total Environ. 2017, 599–600, 1598–1607. [Google Scholar] [CrossRef]
  24. Netsvetov, M.; Sergeyev, M.; Nikulina, V.; Korniyenko, V.; Prokopuk, Y. The climate to growth relationships of pedunculate oak in steppe. Dendrochronologia 2017, 44, 31–38. [Google Scholar] [CrossRef]
  25. Arvai, M.; Morgos, A.; Kern, Z. Growth-climate relations and the enhancement of drought signals in pedunculate oak (Quercus robur L.) tree-ring chronology in Eastern Hungary. iForest Biogeosciences For. 2018, 11, 267–274. [Google Scholar] [CrossRef] [Green Version]
  26. Mikac, S.; Žmegač, A.; Trlin, D.; Paulić, V.; Oršanić, M.; Anić, I. Drought-induced shift in tree response to climate in floodplain forests of Southeastern Europe. Sci. Rep. 2018, 8, 16495. [Google Scholar] [CrossRef] [PubMed]
  27. Nagavciuc, V.; Ionita, M.; Perșoiu, A.; Popa, I.; Loader, N.J.; McCarroll, D. Stable oxygen isotopes in Romanian oak tree rings record summer droughts and associated large-scale circulation patterns over Europe. Clim. Dyn. 2019, 52, 6557–6568. [Google Scholar] [CrossRef] [Green Version]
  28. Coker, T.L.R.; Rozsypálek, J.; Edwards, A.; Harwood, T.P.; Butfoy, L.; Buggs, R.J.A. Estimating mortality rates of European ash (Fraxinus excelsior) under the ash dieback (Hymenoscyphus fraxineus) epidemic. Plants, People, Planet 2019, 1, 48–58. [Google Scholar] [CrossRef] [Green Version]
  29. Dobrowolska, D.; Hein, S.; Oosterbaan, A.; Wagner, S.; Clark, J.; Skovsgaard, J.P. A review of European ash (Fraxinus excelsior L.): Implications for silviculture. Forestry 2011, 84, 133–148. [Google Scholar] [CrossRef] [Green Version]
  30. Kerr, G.; Cahalan, C. A review of site factors affecting the early growth of ash (Fraxinus excelsior L.). For. Ecol. Manag. 2004, 188, 225–234. [Google Scholar] [CrossRef]
  31. Lygis, V.; Vasiliauskas, R.; Larsson, K.-H.; Stenlid, J. Wood-inhabiting fungi in stems of Fraxinus excelsior in declining ash stands of northern Lithuania, with particular reference to Armillaria cepistipes. Scand. J. For. Res. 2005, 20, 337–346. [Google Scholar] [CrossRef]
  32. Bochenek, G.M.; Eriksen, B. Annual growth of male and female individuals of the Common Ash (Fraxinus excelsior L.). Plant Ecol. Divers. 2010, 3, 47–57. [Google Scholar] [CrossRef]
  33. Pušpure, I.; Gerra-Inohosa, L.; Matisons, R.; Laiviņš, M. Tree-ring width of European ash differing by crown condition and its relationship with climatic factors in Latvia. Balt. For. 2017, 23, 244–252. [Google Scholar]
  34. Matisons, R.; Inohosa, L.G.; Laiviņš, M. Pointer Years in Tree-Ring Width of European Ash with Different Crown Condition and Their Relationships with Climatic Factors in Latvia. Proc. Latv. Acad. Sci. Sect. B Nat. Exact Appl. Sci. 2016, 70, 116. [Google Scholar] [CrossRef]
  35. Giagli, K.; Baar, J.; Fajstavr, M.; Gryc, V.; Vavrčík, H. Tree-ring width and Variation of Wood Density in Fraxinus excelsior L. and Quercus robur L. Growing in Floodplain Forests. Bioresourse 2017, 13, 804–819. [Google Scholar] [CrossRef]
  36. Okoński, B. Radial growth of pedunculate oak and European ash on active river terraces. Hydrologic and climatic controls. Infrastrukt. Ekol. Teren. Wiej. 2017, III/1, 1075–1091. [Google Scholar]
  37. Heklau, H.; Jetschke, G.; Bruelheide, H.; Seidler, G.; Haider, S. Species-specific responses of wood growth to flooding and climate in floodplain forests in Central Germany. iForest Biogeosci. For. 2019, 12, 226–236. [Google Scholar] [CrossRef]
  38. Bolte, A.; Ammer, C.; Löf, M.; Nabuurs, G.-J.; Schall, P.; Spathelf, P. Adaptive Forest Management: A Prerequisite for Sustainable Forestry in the Face of Climate Change. Plant-Fire Interactions 2010. [Google Scholar] [CrossRef]
  39. Yousefpour, R.; Temperli, C.; Jacobsen, J.; Thorsen, B.; Meilby, H.; Lexer, M.; Lindner, M.; Bugmann, H.; Borges, J.; Palma, J.; et al. A framework for modeling adaptive forest management and decision making under climate change. Ecol. Soc. 2017, 22. [Google Scholar] [CrossRef]
  40. Metzger, M.J.; Bunce, R.G.H.; Jongman, R.H.G.; Mücher, C.A.; Watkins, J.W. A climatic stratification of the environment of Europe. Glob. Ecol. Biogeogr. 2005, 14, 549–563. [Google Scholar] [CrossRef]
  41. Caudullo, G.; Welk, E.; San-Miguel-Ayanz, J. Chorological maps for the main European woody species. Data Brief 2017, 12, 662–666. [Google Scholar] [CrossRef]
  42. Ellenberg, H. Vegetation Ecology of Central Europe; Cambridge University Press: Cambridge, UK, 2009. [Google Scholar]
  43. Sfeclă, V. Tipuri de pădure din Rezervaţia peisagistică “Dobruşa”. Lucrări ştiinţifice, UASM (partea a II-Horticultură, Viticultură şi Vinificație, Silvicultură şi Grădini Publice. Protecţia plantelor 2013, 36, 158–162. [Google Scholar]
  44. Gärtner, H.; Nievergelt, D. The core-microtome: A new tool for surface preparation on cores and time series analysis of varying cell parameters. Dendrochronologia 2010, 28, 85–92. [Google Scholar] [CrossRef]
  45. Cybis Elektronik. CDendro and CooRecorder. 2010. Available online: http://www.cybis.se/forfun/dendro/index.htm.
  46. Wheeler, E.A.; Baas, P.; Gasson, P.E. IAWA List of Microscopic Features for Hardwood Identification with an Appendix on Non-anatomical Information; National Herbarium of the Netherlands: Leiden, The Netherlands, 1989; pp. 219–332. [Google Scholar]
  47. Rinn, F. TSAP-Win User Reference; Rinntech: Heidelberg, Germany, 2003. [Google Scholar]
  48. Holmes, R.L. Computer-assisted quality control in tree-ring dating and measurement. Tree Ring Bulletin 1983, 43, 69–75. [Google Scholar]
  49. Grissino-Mayer, H.D. Evaluating Crossdating Accuracy: A Manual and Tutorial for the Computer Program COFECHA. Tree-Ring Res. 2001, 57, 205–221. [Google Scholar]
  50. Eckstein, D.; Bauch, J. Beitrag zur Rationalisierung eines dendrochronologischen Verfahrens und zur Analyse seiner Aussagesicherheit. Forstwiss. Cent. 1969, 88, 230–250. [Google Scholar] [CrossRef]
  51. Baillie, M.G.L.; Pilcher, J.R. A Simple Crossdating Program for Tree-Ring Research; Tree-Ring Bulletin: Loveland, CO, USA, 1973. [Google Scholar]
  52. Melvin, T.M.; Briffa, K.R.; Nicolussi, K.; Grabner, M. Time-varying-response smoothing. Dendrochronologia 2007, 25, 65–69. [Google Scholar] [CrossRef]
  53. Cook, E.R.; Krusic, P.J. ARSTAN4.1b_XP. Available online: http://www.ldeo.columbia.edu (accessed on 23 May 2020).
  54. Fritts, H.C. Tree Rings and Climate; Academic Press: London, UK, 1976. [Google Scholar]
  55. Popa, I. Fundamente Metodologice şi Aplicaţii de Dendrocronologie; Editura Tehnică Silvică: Bucureşti, Romania, 2004. [Google Scholar]
  56. Briffa, K.; Jones, P. Basic chronology statistics and assessment. In Methods of Dendrochronology:Applications in the Environmental Sciences; Cook, E., Kairiukstis, L., Eds.; Kluwer Academic Publishers: Dordrecht, Germany, 1990; pp. 137–152. [Google Scholar]
  57. Wigley, T.M.L.; Briffa, K.R.; Jones, P.D. On the Average Value of Correlated Time Series, with Applications in Dendroclimatology and Hydrometeorology. J. Clim. Appl. Meteorol. 1984, 23, 201–213. [Google Scholar] [CrossRef]
  58. Harris, I.; Jones, P.D.; Osborn, T.J.; Lister, D.H. Updated high-resolution grids of monthly climatic observations–the CRU TS3.10 Dataset. Int. J. Climatol. 2014, 34, 623–642. [Google Scholar] [CrossRef] [Green Version]
  59. Van Oldenborgh, G.J.; Drijfhout, S.; van Ulden, A.; Haarsma, R.; Sterl, A.; Severijns, C.; Hazeleger, W.; Dijkstra, H. Western Europe is warming much faster than expected. Clim. Past 2009, 5, 1–12. [Google Scholar] [CrossRef] [Green Version]
  60. Vicente-Serrano, S.M.; Beguería, S.; López-Moreno, J.I.; Angulo, M.; Kenawy, A.E. A New Global 0.5° Gridded Dataset (1901–2006) of a Multiscalar Drought Index: Comparison with Current Drought Index Datasets Based on the Palmer Drought Severity Index. J. Hydrometeorol. 2010, 11, 1033–1043. [Google Scholar] [CrossRef] [Green Version]
  61. R Development Core Team R: A Language an Environment for Statistical Computing; R Foundation for Statistical Computing: Vienna, Austria, 2010.
  62. Zang, C.; Biondi, F. Dendroclimatic calibration in R: The bootRes package for response and correlation function analysis. Dendrochronologia 2012, 31, 68–74. [Google Scholar] [CrossRef]
  63. Wickham, H. ggplot2: Elegant Graphics for Data Analysis; Springer: Berlin/Heidelberg, Germany, 2009. [Google Scholar]
  64. Ionita, M.; Dima, M.; Lohmann, G.; Scholz, P.; Rimbu, N. Predicting the June 2013 European Flooding Based on Precipitation, Soil Moisture, and Sea Level Pressure. J. Hydrometeorol. 2015, 16, 598–614. [Google Scholar] [CrossRef] [Green Version]
  65. Ionita, M.; Grosfeld, K.; Scholz, P.; Treffeisen, R.; Lohmann, G. September Arctic sea ice minimum prediction- A skillful new statistical approach. Earth Syst. Dyn. 2019, 10, 189–203. [Google Scholar] [CrossRef] [Green Version]
  66. Ionita, M. Mid Range Forecasting of the German Waterways Streamflow Based on Hydrologic, Atmospheric and Oceanic Data. Rep. Polar Marine Res. 2017. [Google Scholar] [CrossRef]
  67. Nagavciuc, V.; Roibu, C.-C.; Ionita, M.; Mursa, A.; Cotos, M.-G.; Popa, I. Different climate response of three tree ring proxies of Pinus sylvestris from the Eastern Carpathians, Romania. Dendrochronologia 2019, 54, 56–63. [Google Scholar] [CrossRef] [Green Version]
  68. Kern, Z.; Patkó, M.; Kázmér, M.; Fekete, J.; Kele, S.; Pályi, Z. Multiple tree-ring proxies (earlywood width, latewood width and δ13C) from pedunculate oak (Quercus robur L.), Hungary. Quat. Int. 2013, 293, 257–267. [Google Scholar] [CrossRef]
  69. Fonti, P.; García-González, I. Earlywood vessel size of oak as a potential proxy for spring precipitation in mesic sites. J. Biogeogr. 2008, 35, 2249–2257. [Google Scholar] [CrossRef]
  70. Methods of dendrochronology. Applications in the Enviromnental Science; Cook, E.R., Kairiukstis, L.A., Eds.; Kluwer: South Holland, The Netherlands, 1990. [Google Scholar]
  71. González, I.G.; Eckstein, D. Climatic signal of earlywood vessels of oak on a maritime site. Tree Physiol. 2003, 23, 497–504. [Google Scholar] [CrossRef] [PubMed]
  72. Lebourgeois, F.; Cousseau, G.; Ducos, Y. Climate-tree-growth relationships of Quercus petraea Mill. stand in the Forest of Bercé (“Futaie des Clos”, Sarthe, France). Ann. For. Sci. 2013, 61, 361–372. [Google Scholar] [CrossRef] [Green Version]
  73. Pallardy, G.S. Physiology of Woody Plants, 3rd ed.; Elsevier Academic Press: Amsterdam, The Netherlands, 2008. [Google Scholar]
  74. Bréda, N.; Granier, A. Intra- and interannual variations of transpiration, leaf area index and radial growth of a sessile oak stand (Quercus petraea). Ann. For. Sci. 1996, 53, 521–536. [Google Scholar] [CrossRef] [Green Version]
  75. Yang, Z.; Midmore, D.J. Modelling plant resource allocation and growth partitioning in response to environmental heterogeneity. Ecol. Model. 2005, 181, 59–77. [Google Scholar] [CrossRef]
  76. Vincent-Barbaroux, C.; Breda, N. Contrasting distribution and seasonal dynamics of carbohydrate reserves in stem wood of adult ring-porous sessile oak and diffuse-porous beech trees. Tree Physiol. 2003, 22, 1201–1210. [Google Scholar] [CrossRef]
  77. Fonti, P.; Eilmann, B.; García-González, I.; von Arx, G. Expeditious building of ring-porous earlywood vessel chronologies without losing signal information. Trees 2009, 23, 665–671. [Google Scholar] [CrossRef] [Green Version]
  78. García-González, I.; Fonti, P. Selecting earlywood vessels to maximize their environmental signal. Tree Physiol. 2006, 26, 1289–1296. [Google Scholar] [CrossRef] [Green Version]
  79. Hacke, U.; Sauter, J.J. Xylem dysfunction during winter and recovery of hydraulic conductivity in diffuse-porous and ring-porous trees. Oecologia 1996, 105, 435–439. [Google Scholar] [CrossRef] [PubMed]
  80. Weber, P.; Bugmann, H.; Rigling, A. Radial growth responses to drought of Pinus sylvestris and Quercus pubescens in an inner-Alpine dry valley. J. Veg. Sci. 2007, 18, 777–792. [Google Scholar] [CrossRef]
  81. Koprowski, M.; Okoński, B.; Gričar, J.; Puchałka, R. Streamflow as an ecological factor influencing radial growth of European ash (Fraxinus excelsior (L.)). Ecol. Indic. 2018, 85, 390–399. [Google Scholar] [CrossRef]
  82. Song, B.; Niu, S.; Wan, S. Precipitation regulates plant gas exchange and its long-term response to climate change in a temperate grassland. J. Plant Ecol. 2016, 9, 531–541. [Google Scholar] [CrossRef] [Green Version]
  83. Kozlowski, T.T.; Pallardy, G. Growth Control in Woody Plants; Elsevier: Amsterdam, The Netherlands, 1997; p. 641. [Google Scholar]
  84. Popa, I.; Leca, S.; Craciunescu, A.; Sidor, C.; Badea, O.N. Dendroclimatic Response Variability of Quercus species in the Romanian Intensive Forest Monitoring Network. Not. Bot. Horti Agrobot. Cluj-Napoca 2013, 41. [Google Scholar] [CrossRef] [Green Version]
  85. Nechita, C.; Chiriloaei, F. Interpreting the effect of regional climate fluctuations on Quercus robur L. trees under a temperate continental climate (southern Romania). Dendrobiology 2018, 79, 77–89. [Google Scholar] [CrossRef] [Green Version]
  86. Rust, S.; Savill, P.S. The root systems of Fraxinus excelsior and Fagus sylvatica and their competitive relationships. Forestry 2000, 73, 499–503. [Google Scholar] [CrossRef]
  87. Marigo, G.; Peltier, J.-P.; Girel, J.; Pautou, G. Success in the demographic expansion of Fraxinus excelsior L. Trees 2000, 15, 1–13. [Google Scholar] [CrossRef]
  88. Allen, M.F. How oaks respond to water limitation. In Proceedings of the seventh California Oak Symposium: Managing oak Woodlands in a Dynamic World, Berkeley, CA, USA, 10 December 2015; Department of Agriculture, Forest Service, Pacific Southwest Research Station: Berkeley, CA, USA, 2015. [Google Scholar]
  89. Kuster, T.; Arend, M.; Günthardt-Goerg, M.; Schulin, R. Root growth of different oak provenances in two soils under drought stress and air warming conditions. Plant Soil 2012, 369. [Google Scholar] [CrossRef] [Green Version]
  90. Tumajer, J.; Treml, V. Response of floodplain pedunculate oak (Quercus robur L.) tree-ring width and vessel anatomy to climatic trends and extreme hydroclimatic events. For. Ecol. Manag. 2016, 379, 185–194. [Google Scholar] [CrossRef]
  91. Rybníček, M.; Čermák, P.; Žid, T.; Kolar, T. Radial Growth and Health Condition of Norway Spruce (Picea Abies (L.) Karst.) Stands in Relation to Climate (Silesian Beskids, Czech Republic). Geochron 2010, 36. [Google Scholar] [CrossRef] [Green Version]
  92. Kolar, T.; Giagli, K.; Trnka, M.; Bednářová, E.; Vavrčík, H.; Rybníček, M. Response of the leaf phenology and tree-ring width of European beech to climate variability. Silva Fenn. 2016, 50. article id 1520. [Google Scholar] [CrossRef] [Green Version]
  93. Friedrichs, D.; Buntgen, U.; Frank, D.; Esper, J.; Neuwirth, B.; Loffler, J. Complex climate controls on 20th century oak growth in Central-West Germany. Tree Physiol. 2008. [Google Scholar] [CrossRef] [PubMed] [Green Version]
  94. Bréda, N.; Huc, R.; Granier, A.; Dreyer, E. Temperate forest trees and stands under severe drought: A review of ecophysiological responses, adaptation processes and long-term consequences. Ann. For. Sci. 2006, 63, 625–644. [Google Scholar] [CrossRef] [Green Version]
  95. Oren, R.; Sperry, J.; Katul, G.; Pataki, D.; Ewers, B.; Phillips, N.; Schafer, K. Survey and synthesis of intra- and interspecific variation in stomatal sensitivity to vapour pressure deficit. Plant Cell Environ. 1999, 22, 1515–1526. [Google Scholar] [CrossRef] [Green Version]
  96. Gessler, A.; Schaub, M.; McDowell, N.G. The role of nutrients in drought-induced tree mortality and recovery. New Phytol. 2017, 214, 513–520. [Google Scholar] [CrossRef] [Green Version]
  97. Dinis, C.; Surovy, P.; Ribeiro, N.; Oliveira, M. The effect of soil compaction at different depths on cork oak seedling growth. New Forests 2014, 46. [Google Scholar] [CrossRef]
  98. Frank, D.; Büntgen, U.; Böhm, R.; Maugeri, M.; Esper, J. Warmer early instrumental measurements versus colder reconstructed temperatures: Shooting at a moving target. Quat. Sci. Rev. 2007, 26, 3298–3310. [Google Scholar] [CrossRef]
  99. Esper, J.; Büntgen, U.; Frank, D.C.; Nievergelt, D.; Liebhold, A. 1200 years of regular outbreaks in alpine insects. Proc. R. Soc. B Biol. Sci. 2007, 274, 671–679. [Google Scholar] [CrossRef] [Green Version]
  100. Rozas, V. Detecting the impact of climate and disturbances on tree-rings of Fagus sylvatica L. and Quercus robur L. in a lowland forest in Cantabria, Northern Spain. Ann. For. Sci. 2000, 58, 237–251. [Google Scholar] [CrossRef] [Green Version]
  101. Birsan, M.-V.; Dumitrescu, A. Snow variability in Romania in connection to large-scale atmospheric circulation. Int. J. Climatol. 2014, 34, 134–144. [Google Scholar] [CrossRef]
  102. Vaganov, E.A.; Hughes, M.; Kirdyanov, A.V.; Schweingruber, F.; Silkin, P. Influence of snowfall and melt timing on tree growth in Subarctic Eurasia. Nature 1999, 400, 149–151. [Google Scholar] [CrossRef]
  103. Nagavciuc, V.; Kern, Z.; Ionita, M.; Hartl, C.; Konter, O.; Esper, J.; Popa, I. Climate signals in carbon and oxygen isotope ratios of Pinus cembra tree-ring cellulose from the Călimani Mountains, Romania. Int. J. Climatol. 2020, 40, 2539–2556. [Google Scholar] [CrossRef]
  104. Yang, F.; Wang, N.; Shi, F.; Ljungqvist, F.C.; Wang, S.; Fan, Z.; Lu, J. Multi-Proxy Temperature Reconstruction from the West Qinling Mountains, China, for the Past 500 Years. PLoS ONE 2013, 8, e57638. [Google Scholar] [CrossRef] [Green Version]
  105. McCarroll, D.; Loader, N.J. Stable isotopes in tree rings. Quat. Sci. Rev. 2004, 23, 771–801. [Google Scholar] [CrossRef]
  106. Coppola, A.; Leonelli, G.; Salvatore, M.C.; Pelfini, M.; Baroni, C. Weakening climatic signal since mid-20th century in European larch tree-ring chronologies at different altitudes from the Adamello-Presanella Massif (Italian Alps). Quat. Res. 2012, 77, 344–354. [Google Scholar] [CrossRef]
  107. Bale, R.; Robertson, I.; Leavitt, S.; Loader, N.J.; Harlan, T.P.; Gagen, M.; Young, G.H.F.; Csank, A.; Froyd, C.; McCarroll, D. Temporal stability in bristlecone pine tree-ring stable oxygen isotope chronologies over the last two centuries. Holocene 2010, 20, 3–6. [Google Scholar] [CrossRef]
Figure 1. Site location. (A) ash (Fraxinus excelsior) and oak (Quercus robur) distribution in Europe; (B) sampling site; (C) Walter–Lieth climatic diagram for Rîbnița weather station: blue line: precipitation divided by 2 and the black line represents precipitation divided by 3; red line: temperature; blue bars: the appearance of daily minimum negative temperatures), (D) image from Dobrușa protected area.
Forests 11 00600 g001
Figure 2. Mean growth widths chronologies: (A) earlywood (EW), (B) latewood (LW), (C) tree ring-widths (TRW), (D) sample depth; (ash—orange, oak—dark green, the thicker line refers to a 20 years low pass filter).
Forests 11 00600 g002
Figure 3. Tree ring index chronologies for ash—orange, and oak—dark green; (A) earlywood (EW), (B) latewood (LW), (C) tree ring-widths (RW).
Forests 11 00600 g003
Figure 4. Climate–growth relationship for ash and oak, using monthly climatic data: maximum, minimum and mean temperature (Tmax, Tmin, and Tmean) and precipitation amount (PP), and tree-ring indices earlywood (EW), latewood (LW), and tree ring-widths (RW), over the period 1901–2018.
Forests 11 00600 g004
Figure 5. Correlation between growth indices and monthly Standardized Precipitation-Evapotranspiration Index (SPEI) using different time scales (black line—95% significance level).
Forests 11 00600 g005
Figure 6. Twenty-five-year moving correlation analysis between main climatic drivers and tree-ring indexes.
Forests 11 00600 g006
Figure 7. Stability map of the correlation between oak LW and SPEI3 from the previous year September until the current year October. Regions, where the correlation is stable, positive, and significant for at least 80% of windows, are shaded with dark red (95%), red (90%), orange (85%), and yellow (80%). The corresponding regions where the correlation is stable, but negative, are shaded with dark blue (95%), blue (90%), green (85%), and light green (80%). SEP—September previous year, OCT—October previous year, NOV—November previous year, DEC—December previous year, Jan—January, Feb—February, Mar—March, Apr—April, May—May, Jun—June, Jul—July, Aug—August, Sep—September, Oct—October, MAM—March/April/May, and JJA—June/July/August. Analyzed period: 1902–2018.
Forests 11 00600 g007
Figure 8. As in Figure 7, but for ash LW.
Forests 11 00600 g008
Table 1. Statistical parameters for ash (Fraxinus excelsior) and oak (Quercus robur) chronologies (AGR—annual growth rate; MS—mean sensitivity; AC1—first-order autocorrelation; rbar—inter-series correlation; EPS—expressed population signal; %var—explained variance; SNR—signal-to-noise-ratio).
SpeciesRing TypeMean Age (Max)AGR ± SD (mm)MSAC1rbar EPS %varSNR
AshEW130 ± 17 (147)0.77 ± 0.200.170.5310.2750.83133.94.93
LW1.24 ± 0.910.490.5570.5330.92658.112.54
RW2.01 ± 0.980.310.5780.5720.94661.117.41
OakEW109 ± 18 (165)1.03 ± 0.370.210.5900.1590.77321.83.41
LW1.95 ± 1.390.390.7060.4150.92346.712.06
RW2.98 ± 1.610.250.7620.4220.92947.113.14

