Article

Mechanisms by Which Pre-Commercial Thinning Increases Black Spruce Growth in Different Climates and Soil Types

1
Département de Biologie, Université de Sherbrooke, Sherbrooke, QC J1K 2R1, Canada
2
Direction de la Recherche Forestière—Ministère des Forêts, de la Faune et des Parcs, QC G1P 4P3, Canada
*
Author to whom correspondence should be addressed.
Forests 2020, 11(5), 599; https://doi.org/10.3390/f11050599
Submission received: 27 March 2020 / Revised: 20 May 2020 / Accepted: 21 May 2020 / Published: 25 May 2020
(This article belongs to the Section Forest Ecology and Management)

Abstract

:
In the province of Québec (Canada), pre-commercial thinning (PCT) is a common silvicultural practice applied to young black spruce (Picea mariana (Mill.) BSP) stands. PCT removes some of the competing vegetation and smaller black spruce stems, in order to improve growth rates and reduce forest rotation intervals. It is uncertain whether this positive response in black spruce growth is primarily due to lower competition for resources or to other mechanisms, which may vary according to climate or edaphic conditions. We sampled soils and black spruce needles in PCT-treated and non-treated control plots occurring in two climate regimes, as well as on two contrasting soil parent materials within one of these two climate regimes (i.e., three “site types”). We performed our sampling approximately 20 years after treatment. Paired treatment plots (i.e., PCT vs. control) were replicated at four independent sites in each of the three site types, for a total of 24 plots. Over two consecutive years, we measured stand structural characteristics, indices of soil N fertility, soil microbial activity, indices of soil moisture availability, canopy openness, and foliar characteristics in each plot. In each site type, PCT decreased total basal area but increased radial growth of individual trees. Across all plots, soil N mineralization rates measured in 2016 were positively related to foliar N concentrations of one-year-old needles collected in 2017. Annual precipitation, drainage class, potential evapotranspiration, and climate moisture index all indicated that plots occurring in the drier climate and on glacial till deposits were more prone to summer moisture deficits. Accordingly, PCT increased forest floor moisture only in this site type, which may benefit tree growth. In the wetter climate and on poorly drained soils, however, we found evidence that PCT reduces soil N fertility, presumably by increasing the spread of ericaceous shrubs in the understory. In the dry fertile site type, the range in canopy openness was substantially higher (12–37%) and correlated negatively with tree diameter, suggesting that greater light availability did not improve tree growth. Taken collectively, our data suggest that PCT increases black spruce growth across a broad range of site conditions found in Québec, presumably by lowering intraspecific competition for resources. However, on drier sites, PCT may also benefit trees by increasing soil moisture availability, whereas wetter climates may mitigate the beneficial effect of PCT due to a loss of soil N fertility.

1. Introduction

In the province of Québec (Canada), managed boreal forests cover 21% of the total land mass and 57% of the continuous boreal forest sub-zone [1]. Within these forests, black spruce (Picea mariana (Mill.) BSP) is the most economically important tree species because of its high abundance and its structural properties that make it appropriate for both lumber and pulpwood [2]. To sustainably manage boreal black spruce forests, the province employs an independent Chief Forester whose mandate is to calculate the Annual Allowable Cut (AAC). AAC is the maximum volume of wood that can be harvested in a given year while maintaining total standing wood volume over future forest rotations. In calculating AAC, the prediction models consider not only the natural growth rate of forests based on previous mensuration data, but also the predicted impacts of various silvicultural treatments. A common silvicultural practice that is used to optimize merchantable wood volume is pre-commercial thinning (PCT), which was implemented in Québec approximately 25 years ago and has since been applied to 1,500,000 ha of regenerating forests [3]. PCT consists of removing non-crop tree species as well as reducing the density of regenerating black spruce stands, approximately 15–20 years after the previous clearcut. This reduces competition for resources among the remaining residual stems [4]. While PCT might decrease the overall wood volume of a forest stand, its goal is to increase the average stem diameter resulting in more valuable wood, as well as to reduce the forest rotation interval [5,6].
In the most recent version of the province’s forestry manual, it was concluded that the long-term effects of PCT on forest growth was the least understood and the least predictable silvicultural treatment in Québec [7]. For example, since 1995, the forest research unit of the Ministry of Forests, Wildlife and Parks (MFWP) has closely monitored 750 thinned forest plots [3]. Results have shown that the long-term growth response on some of these plots is insignificant whereas the yields on other plots exceed those that are predicted from forest growth curves currently used to calculate AAC. Various hypotheses could explain these discrepancies. For example, research by Brockley [8] showed that the relative growth response of lodgepole pine (Pinus contorta Dougl. ex Loud. var. latifolia Engelm.) to fertilization decreases with stand thinning. This led us to hypothesize that PCT may favor the growth response of black spruce on nutrient poor sites more so than on nutrient rich sites. Alternatively, Sohn et al. [9] showed that stand thinning could mitigate drought stress for Norway spruce (Picea abies (L.) Karst.). This led us to hypothesize that stand thinning might favor a growth response of black spruce in drier climates, by decreasing competition for soil moisture. Hence, it is important to assess possible PCT × site fertility and PCT × climate interactions that might control forest growth. This objective is consistent with recommendations from the Chief Forester, to conduct more research towards understanding site-specific mechanisms that account for the varying responses of black spruce stands to PCT [10].
PCT might affect the long-term growth response of black spruce through several ecological mechanisms, which we could corroborate through indirect measurements. For example:
  • Cuttings left on site after thinning could potentially provide a pulse of available soil nutrients, especially if decomposition is stimulated by warmer soil temperature due to canopy gaps [11,12,13]. Even if such a litter nutrient pulse was transitory, there is evidence that it may still improve long-term site fertility. For example, Bradley et al. [14] described an improvement of nutritional site quality 13 years after a single application of fertilizer in regenerating conifer cutovers on northern Vancouver Island (Canada). They proposed that fertilizer had accelerated canopy closure, which in turn improved litter quality and soil nutrition. Such a mechanism can be verified by comparing rates of soil nutrient cycling and soil microbial activity in PCT and non-thinned forest plots.
  • As previously mentioned, PCT may benefit tree growth in dry regions by reducing competition for soil water [15]. By alleviating soil water limitations, PCT may reduce the ratio of net photosynthesis to stomatal conductance, better known as the water use efficiency (WUE) [16,17,18]. This can be verified either through leaf-level gas exchange measurements, or by testing for a positive relationship between δ13C and δ 18O of spruce needle tissues [19]. Conversely, PCT may be detrimental to spruce growth on poorly drained sites, if the reduction in overall evapotranspiration results in waterlogged soils.
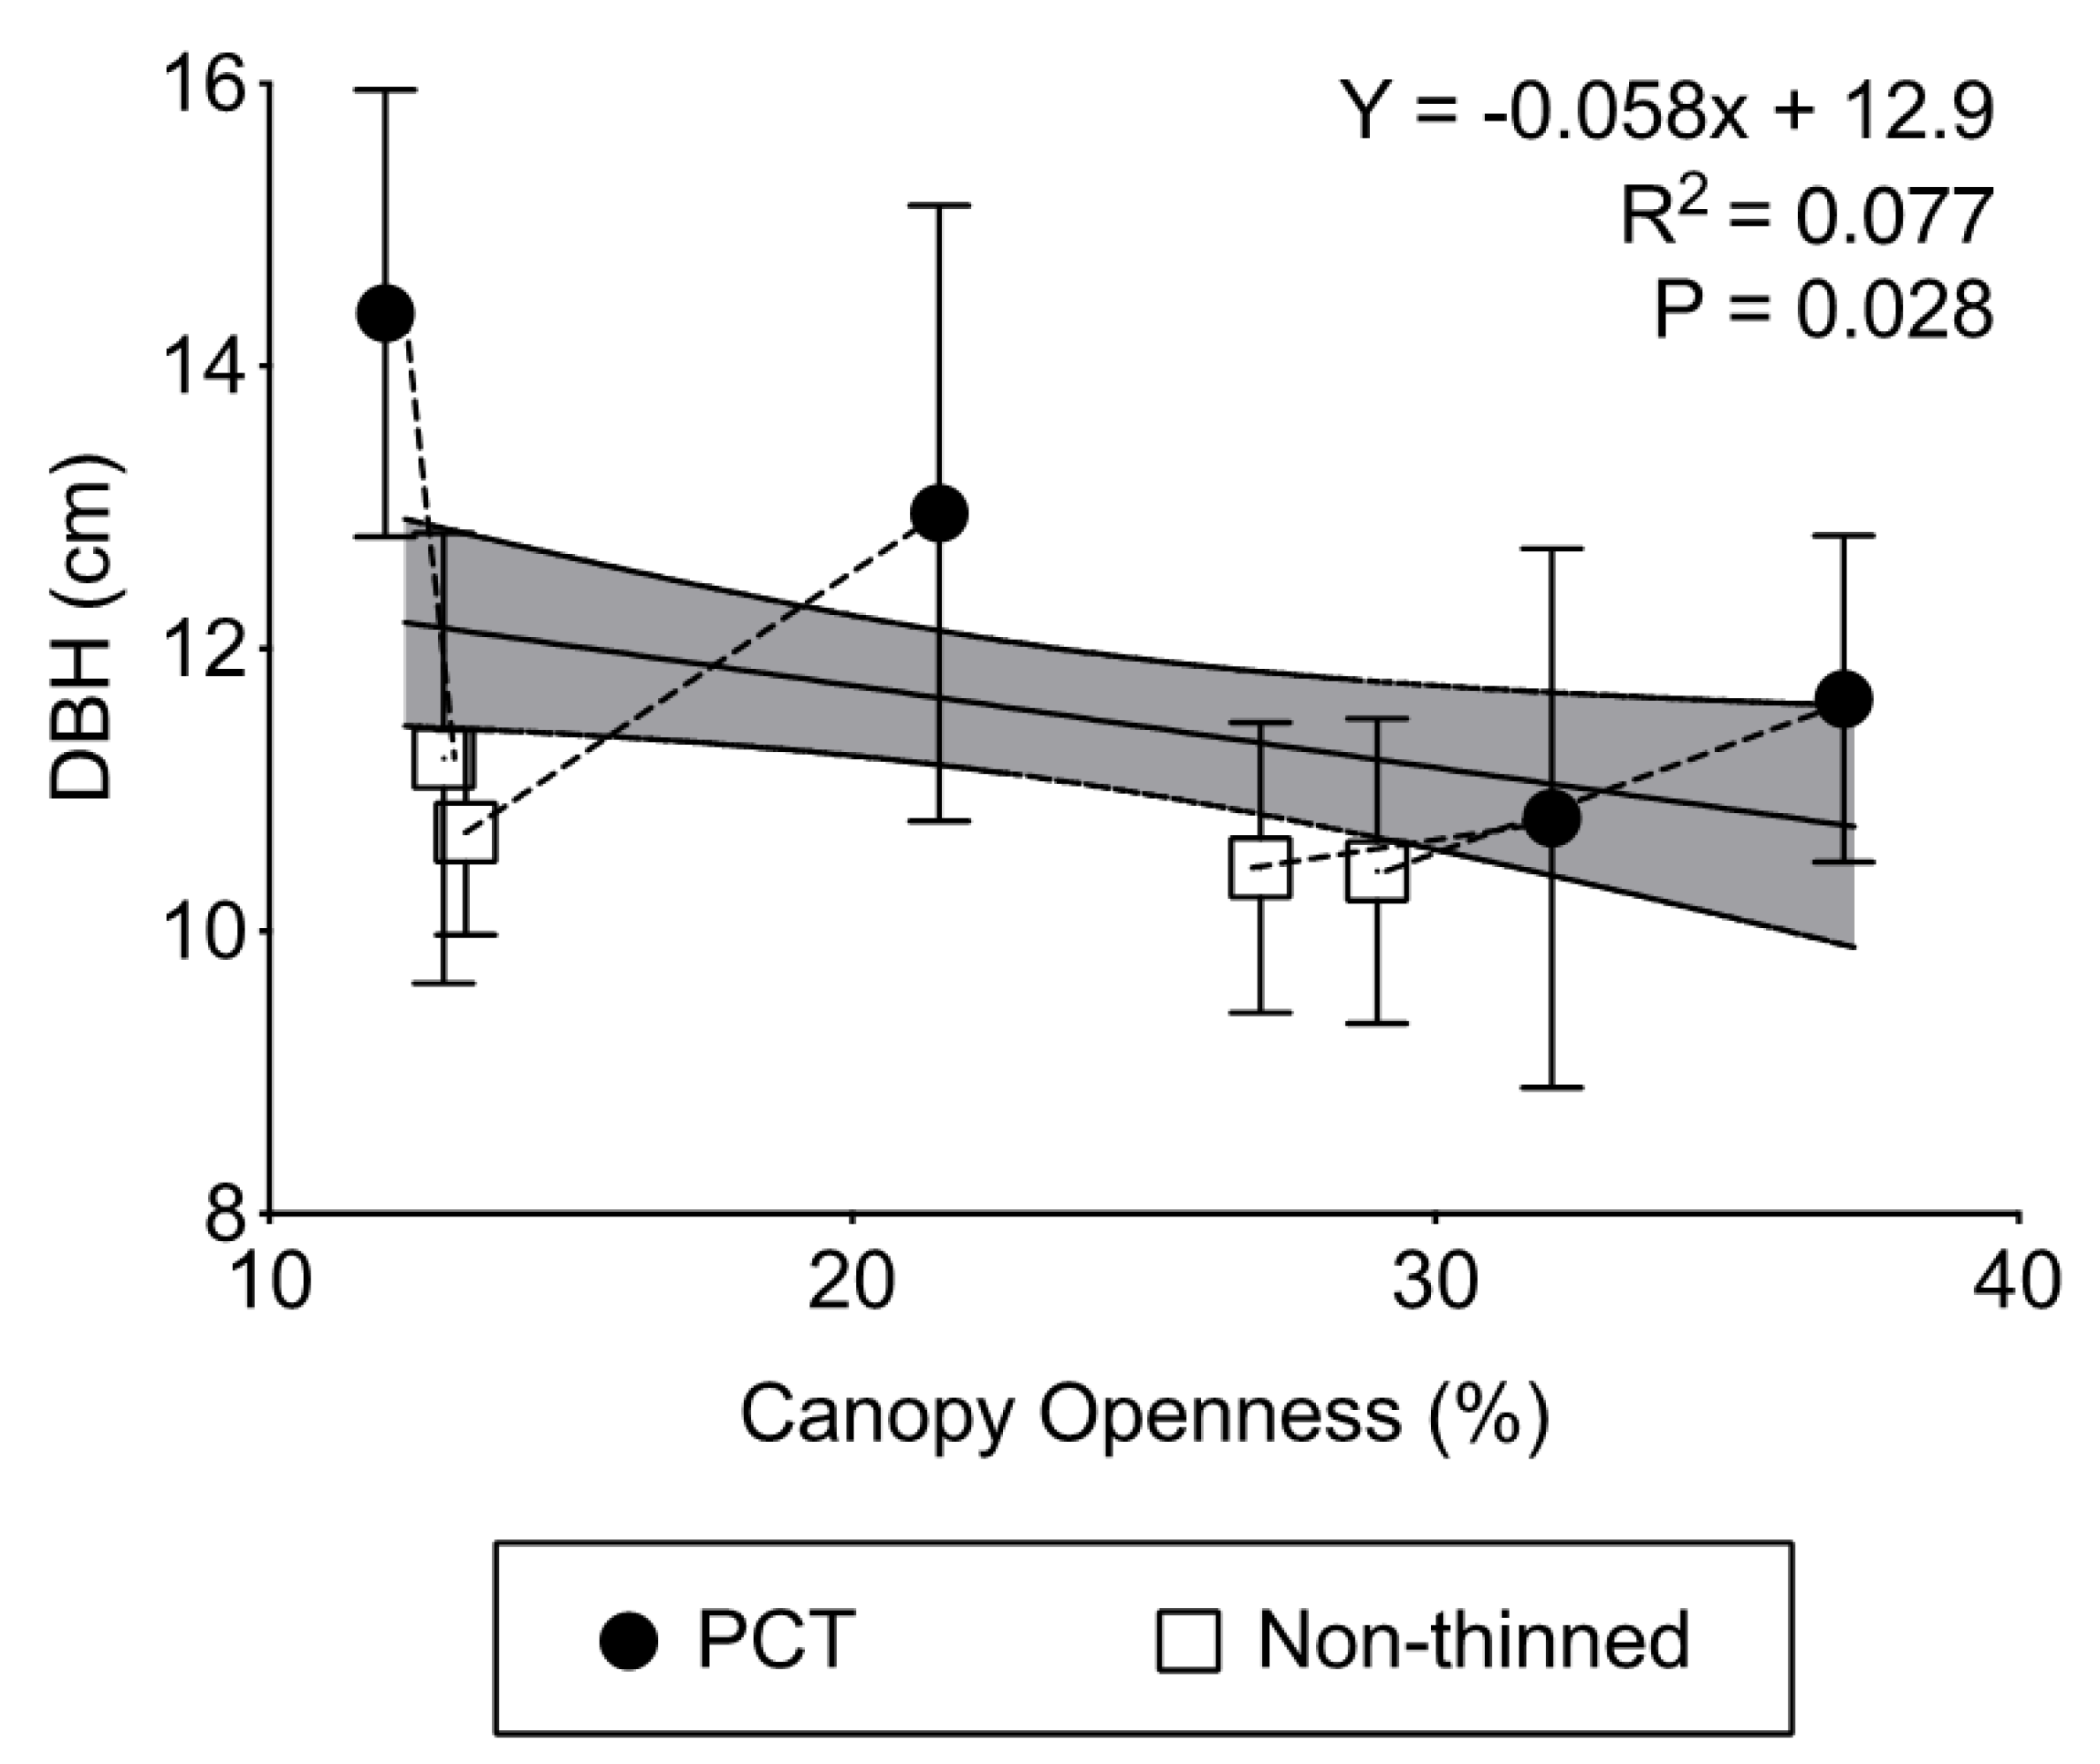
  • Finally, it is unclear if PCT may increase growth rates of black spruce by increasing the capture of available light. Black spruce is a self-pruning species that regularly sheds lower branches as light intensity decreases below the canopy. By creating canopy gaps, PCT might promote the retention of subcanopy branches and needles [20], which would translate into a higher net assimilation of carbon. On the other hand, PCT plots that retain a high level of canopy openness many years after treatment may be indicative of poor growth rates resulting in slow rates of canopy closure [21]. Both of these possibilities can be verified by comparing tree growth in PCT and non-thinned plots across sites with different levels of canopy openness.
We report on a study in which we established research plots in PCT and non-thinned (control) black spruce forest plots, approximately 20 years after treatment. Our experimental design included replicated plots in two climatic regions, as well as on two geological deposits within one of the climatic regions (i.e., three ‘site types’). Including these three site types in our experimental design allowed us to test for PCT × climate and PCT × fertility interactions. During the 2016 and 2017 growing seasons, we measured stand structural characteristics, indices of soil N fertility and soil microbial activity, indices of soil moisture availability, canopy openness, and foliar characteristics. Our objective was to provide insights on whether PCT improves long-term forest growth rates primarily through lower intraspecific competition for resources, or whether any of the mechanisms discussed above play a role as well.

2. Materials and Methods

2.1. Study Area and Experimental Design

Sampling plots were established in two boreal forest regions of Québec with distinct climates. The Côte-Nord region has a 30-year mean annual temperature of −1.0 °C and an annual precipitation range of 1100–1300 mm [22]. The region has a 30-year mean temperature of 14.2 °C during the three warmest months of the year (June to August), and the growing season is estimated at 140 days. The Côte-Nord study sites were all found on undifferentiated glacial till. The Abitibi region has a 30-year mean annual temperature of 2.5 °C and an annual precipitation range of 800–900 mm [23]. The region has a 30-year mean temperature of 16.0 °C during the months of June to August, and the growing season is estimated at 150–160 days. Within the Abitibi region, our study extended over two contrasting geological deposits, namely an undifferentiated glacial till and a lacustrine clay deposited by proglacial lakes Barlow and Ojibway following the Laurentide ice margin retreat [24]. Hence, our study identified and compared the effects of PCT on three site types, hereafter referred to as Abitibi clay (warmer drier climate and higher soil fertility), Abitibi till (warmer drier climate and lower soil fertility), and Côte-Nord (cooler wetter climate and lower soil fertility). Four independent sites, located 1 to 45 km apart, were sampled within each site type. The four Abitibi clay plots were located approximately 125 km further west than the four Abitibi till plots. Soils at the four Abitibi clay sites are classified as podzolic luvisols [25], whereas those at the four Abitibi till sites as well as the four Côte-Nord sites have a sandy loam texture and are classified as humo-ferric podzols [25].
The twelve sampling sites (i.e., 3 site types × 4 sampling sites) were selected in 2015 based on overstory species composition, age-class, and site characteristics (Table 1), using the MFWP’s provincial eco-forest map. Each sampling site had originated from a clearcut approximately 40 years prior to our study and had a minimum of 80% black spruce basal area, with the remaining forest canopy species consisting of white spruce (Picea glauco (Moench) Voss), jack pine (Pinus banksiana Lamb.), and/or balsam fir (Abies balsamea (L.) Mill). The clearcutting method that had been used is referred to as “careful logging”, which minimizes the area over which machinery is allowed to pass and protects the advance growth in the understory. Thus, the forest stands at each site had naturally regenerated without planting. The understory ericaceous shrub layer was dominated by sheep laurel (Kalmia angustifolia L.), Labrador tea (Rhododendron groenlandicum (Oeder) Kron and Judd), and various blueberry species (Vaccinium spp.). The remaining understory vegetation included speckled alder (Alnus rugosa (Du Roi) R.T. Clausen) and leatherleaf (Chamaedaphne calyculata (L.) Moench). The ground cover was dominated by red-stemmed feather moss (Pleurozium schreberi (Brid.) Mitt.), with occasional peat moss (Sphagnum L.) on the wettest sites and occasional reindeer lichen (Cladonia spp.) on the driest sites. At each of the twelve sampling sites, a portion (ca. 20 ha) of the regenerating even-aged forest had been treated with PCT approximately 20 years after the original clearcut, whereas the remaining area was not treated. In the same year the PCT treatments were applied, a 22 m diameter circular plot was established within both the PCT-treated and the adjacent non-treated area (i.e., control plot). The distance between treated and control plots on each site varied between 100–300 m, and each plot had a similar aspect and elevation. Thus, our sampling design consisted of paired sampling plots (PCT vs. control) in each of the 12 sampling sites, for a total of 24 sampling plots.

2.2. Tree Mensuration

MFWP personnel collected tree mensuration data every five years after treatment. From this databank, we noted the stem density and total basal area (BA) of each plot 15 years after PCT treatment, from which we calculated the quadratic mean diameter (QMD) [26]. QMD is the more commonly used measure by foresters because it is a measure of central tendency and directly related to total basal area. In mid-July 2016, we measured the diameter at breast height (DBH) and the height of eight dominant black spruce trees in each sampling plot, using a Forestry 550 Hypsometer (Nikon Inc., Melville, NY, USA).

2.3. Canopy Openness

Canopy openness in each plot was estimated from hemispherical photos taken with a digital Coolpix 5000 camera equipped with a FC-E8 0.21 fisheye converter lens (Nikon Canada Inc., Mississauga, Canada). Six upward-facing vertical photos were taken from 1 m above the ground (i.e., above the understory vegetation), at 5 m intervals along each of two perpendicular transects. The 12 canopy photos from each plot were then analyzed for percent canopy openness using Gap Light Analyzer (Version 2.0) software [27].

2.4. Forest Floor Sampling and Analyses

In mid-July 2016 and 2017, forest floor samples were collected from the forest floor F horizon [25] in each plot. Given that the soil surface of mid-successional black spruce stands is typically littered with 10–80 Mg ha−1 of coarse woody debris [28], a systematic sampling grid was used in order to remove bias and achieve accurate population mean estimates of the measured variables. In 2016, we excavated forest floor from 12 quadrats (30 × 30 cm2) in each plot and measured the depth of the F horizon at the four corners of each quadrat. From these data, we calculated the average forest floor depth in each plot. Forest floor subsamples from the same plot were bulked into a single sample. In 2017, we repeated this procedure but collected three bulk samples per plot. In both years, forest floor samples were sieved on site through a 5 mm metal mesh, placed into 3.8 L plastic bags, transported under ice packs in coolers to the laboratory (U. Sherbrooke), and stored at 4 °C.
A moist subsample (ca. 15 g) of forest floor material was dried at 60 °C in an air-draft laboratory oven and reweighed in order to calculate the gravimetric moisture content. The oven-dried subsamples were then ground with a ball mill and analyzed for total C and N using a Vario Macro CN Analyzer (Elementar GmbH, Hanau, Germany). Mineralizable N was measured as the concentration of NH4+-N following 30-day aerobic incubations of field-moist forest floor (5 g dry wt equiv.). After incubation, NH4+-N was extracted with 100 mL of 1 N KCl solution, shaken for 1 h on a flatbed shaker, and filtered through Fisher P5 filter paper. Extracts were analyzed colorimetrically for NH4+-N (salicylate–nitroprusside-hypochlorite assay) using an Astoria2 Autoanalyzer (Astoria-Pacific, Clackamas, OR, USA). For each plot, mineralizable N was calculated on an oven-dry soil weight basis as well as on a land area basis, based on the measured forest floor depth and a bulk density value of 0.14 g cm−3 [29].
Microbial activity in each forest floor sample was assessed by measuring basal respiration and microbial biomass. Basal respiration was determined by placing field moist forest floor subsamples (5 g dry wt equiv.) in 120 mL containers and allowing these to condition to room temperature for five days. Headspace within each container was then flushed with ambient air for 5 min and the containers were then sealed with airtight lids equipped with rubber septa. Air within the headspace was sampled after 6 h with a needle and syringe, and analyzed for CO2 concentration using a Varian 431-GC gas chromatograph (Varian Analytical Instruments, Walnut Creek, CA, USA). Microbial biomass was determined by amending field moist forest floor subsamples (5 g dry wt equiv.) with 500 mg of a glucose–talc (3:97 ratio) mixture. These were transferred into 120 mL containers, left uncovered for 105 min to reach optimum respiration rates, sealed for 30 min with air-tight lids and analyzed for CO2 as previously described. Glucose-induced respiration rates were then converted to microbial biomass using equations developed by Anderson and Domsch [30].

2.5. Foliar Sampling and Analyses

In the fall of both sampling years, one-year-old needle samples from eight trees in each plot were collected from the top third of the canopy, in all orientations around the tree, using telescopic pruning shears. These foliar samples were stored under ice packs, transported to the laboratory, and oven-dried at 60 °C. Dried foliar samples were ground with a ball mill and analyzed for total C and N using a Vario Macro CN Analyzer (Elementar GmbH, Hanau, Germany). In 2016, foliar material from the eight selected trees was pooled into a single bulk foliar sample from each plot, and these were sent to the G.G. Hatch Stable Isotopes Laboratory at the University of Ottawa (Canada). These 24 subsamples were flash combusted at 1800 °C (Dumas combustion) and the resulting gas products were analyzed for their δ13C and δ18O isotope ratios using a Delta V Advantage isotope ratio mass spectrometer (Thermo Scientific, Bremen, Germany).

2.6. Indices of Soil Moisture Availability

Annual precipitation for the Abitibi and Côte-Nord regions was obtained from Environment Canada weather stations in the towns of Val d’Or (48°06′ N, 77°47′ W) and Baie Comeau (49°13′ N, 68°09′ W), respectively. Potential evapotranspiration (PET) values for each site type were estimated using BioSIM software (version 11.4.8), based on the Thornwaite method [31,32]. From these values, we calculated the climate moisture index (CMI) as the difference between precipitation and PET. The drainage class of each plot was obtained from the MFWP databank. Finally, we used forest floor moisture content (see Section 2.4) averaged over both sampling years as another index of moisture availability.

2.7. Statistical Analyses

The effects of PCT, site type, and sampling year (when applicable), as well as their interactions, were tested using mixed effects models, with site ID and sampling date coded as random variables. When significant interactions were found between PCT and site type, we tested the effects of PCT within each individual site type. When a significant effect of sampling year was found, the analysis was repeated within each sampling year. Single degree of freedom orthogonal contrasts were used to test the effect of PCT across selected treatments. Linear regression analysis was used to test the relationships between soil N mineralization and foliar N concentration, between canopy openness and DBH, and between δ13C and δ 18O values of spruce needles. All statistical analyses were performed using R statistical software (Version 3.2.2, R Development Core Team, 2015). Significance was set at α = 0.05, however we also report a few results approaching significance (0.05 < p < 0.10), as these may still be ecologically significant and important to foresters.

3. Results

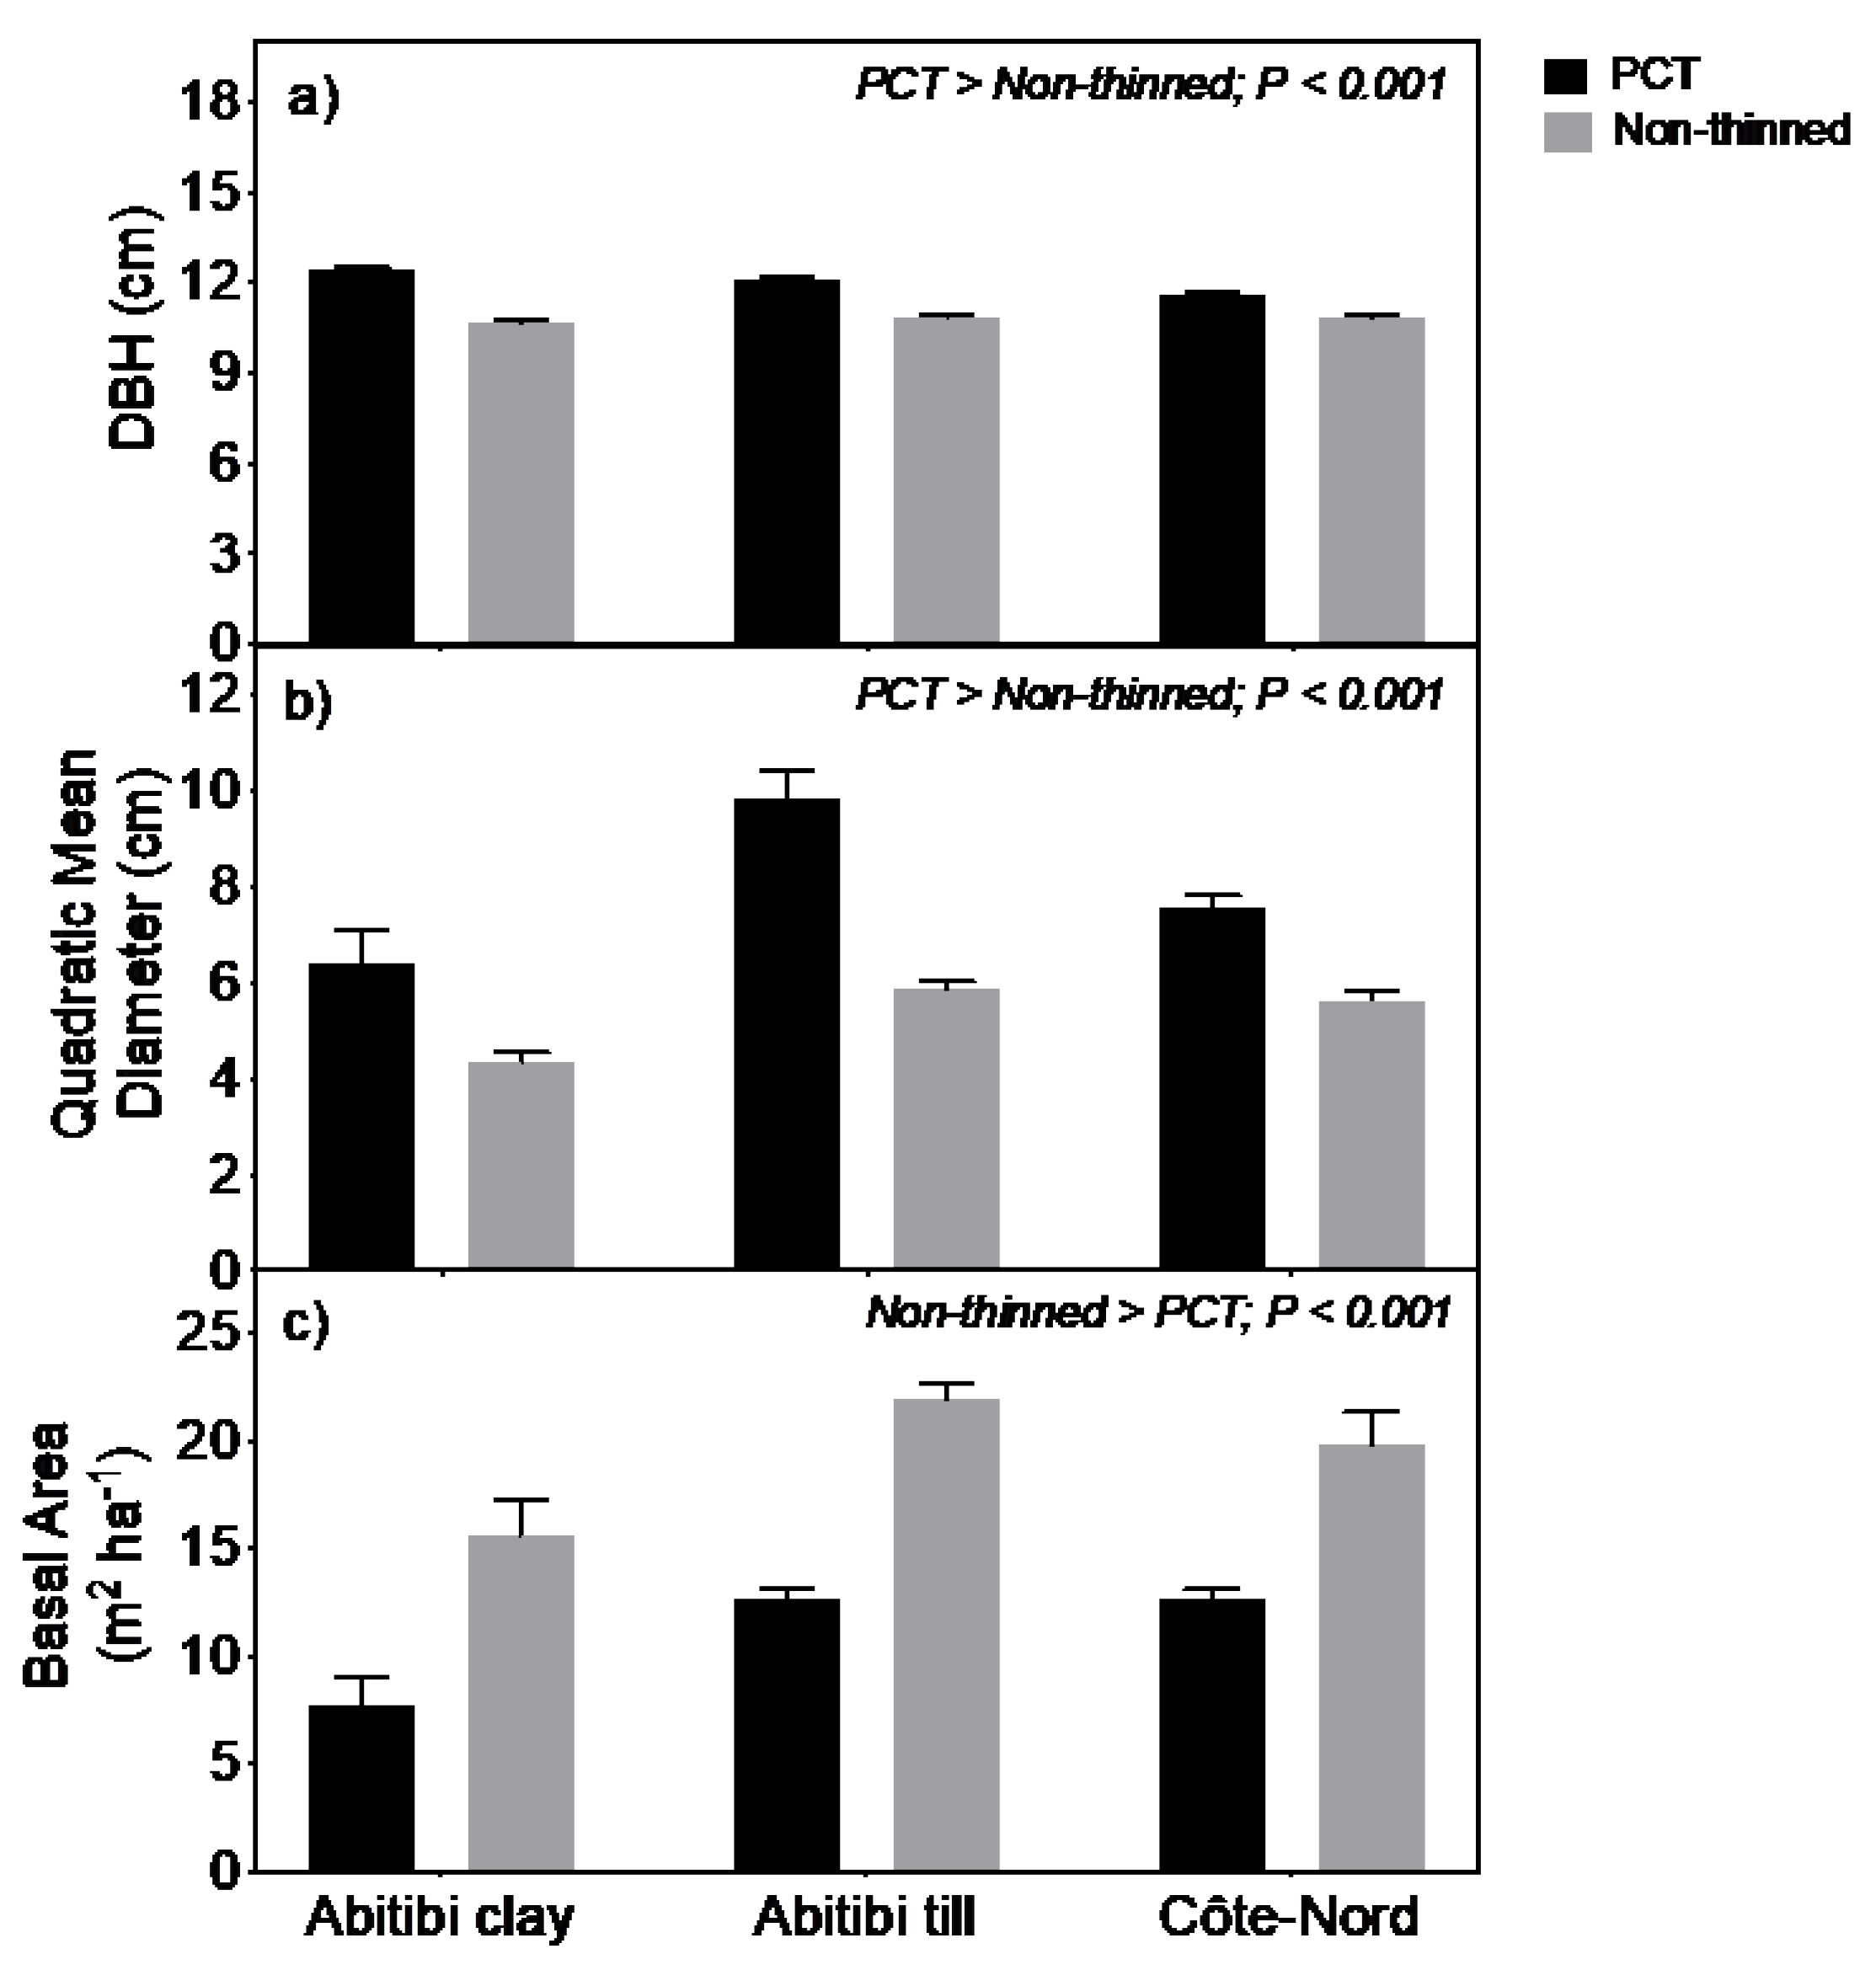
3.1. Structural Characteristics of Forest Stands

PCT had a significant (p < 0.001) effect on stand density. More specifically, stand density in PCT plots were 41%, 54%, and 35% lower than in control plots in the Abitibi clay, Abitibi till, and Côte-Nord sites, respectively (Table 1). Average tree height was significantly (p = 0.039) higher in Abitibi till (8.9 m) than in Côte-Nord (7.7 m), but not affected by PCT (Table 1). By contrast, there was no effect of site type on DBH or QMD, but average DBH and QMD across all site types was significantly (p < 0.001) higher in PCT than in control plots (Figure 1a,b). Total BA across site types was significantly (p < 0.001) lower in PCT than in control plots (Figure 1c).
Across all sites, canopy openness in PCT plots was significantly (p = 0.052) higher than in control plots. More specifically, average canopy openness of PCT plots in the Abitibi clay, Abitibi till, and Côte-Nord sites were respectively 25%, 14%, and 9% higher than in control plots. The range of canopy openness values was 2–3 times greater in the Abitibi clay (12–37%) than in the other two site types (data not shown). Across the Abitibi clay plots, there was a significant (p < 0.028) negative relationship between canopy openness and DBH (Figure 2).
Forest floor depth was significantly (p = 0.011) higher in Côte-Nord than in the other two site types (Table 1).

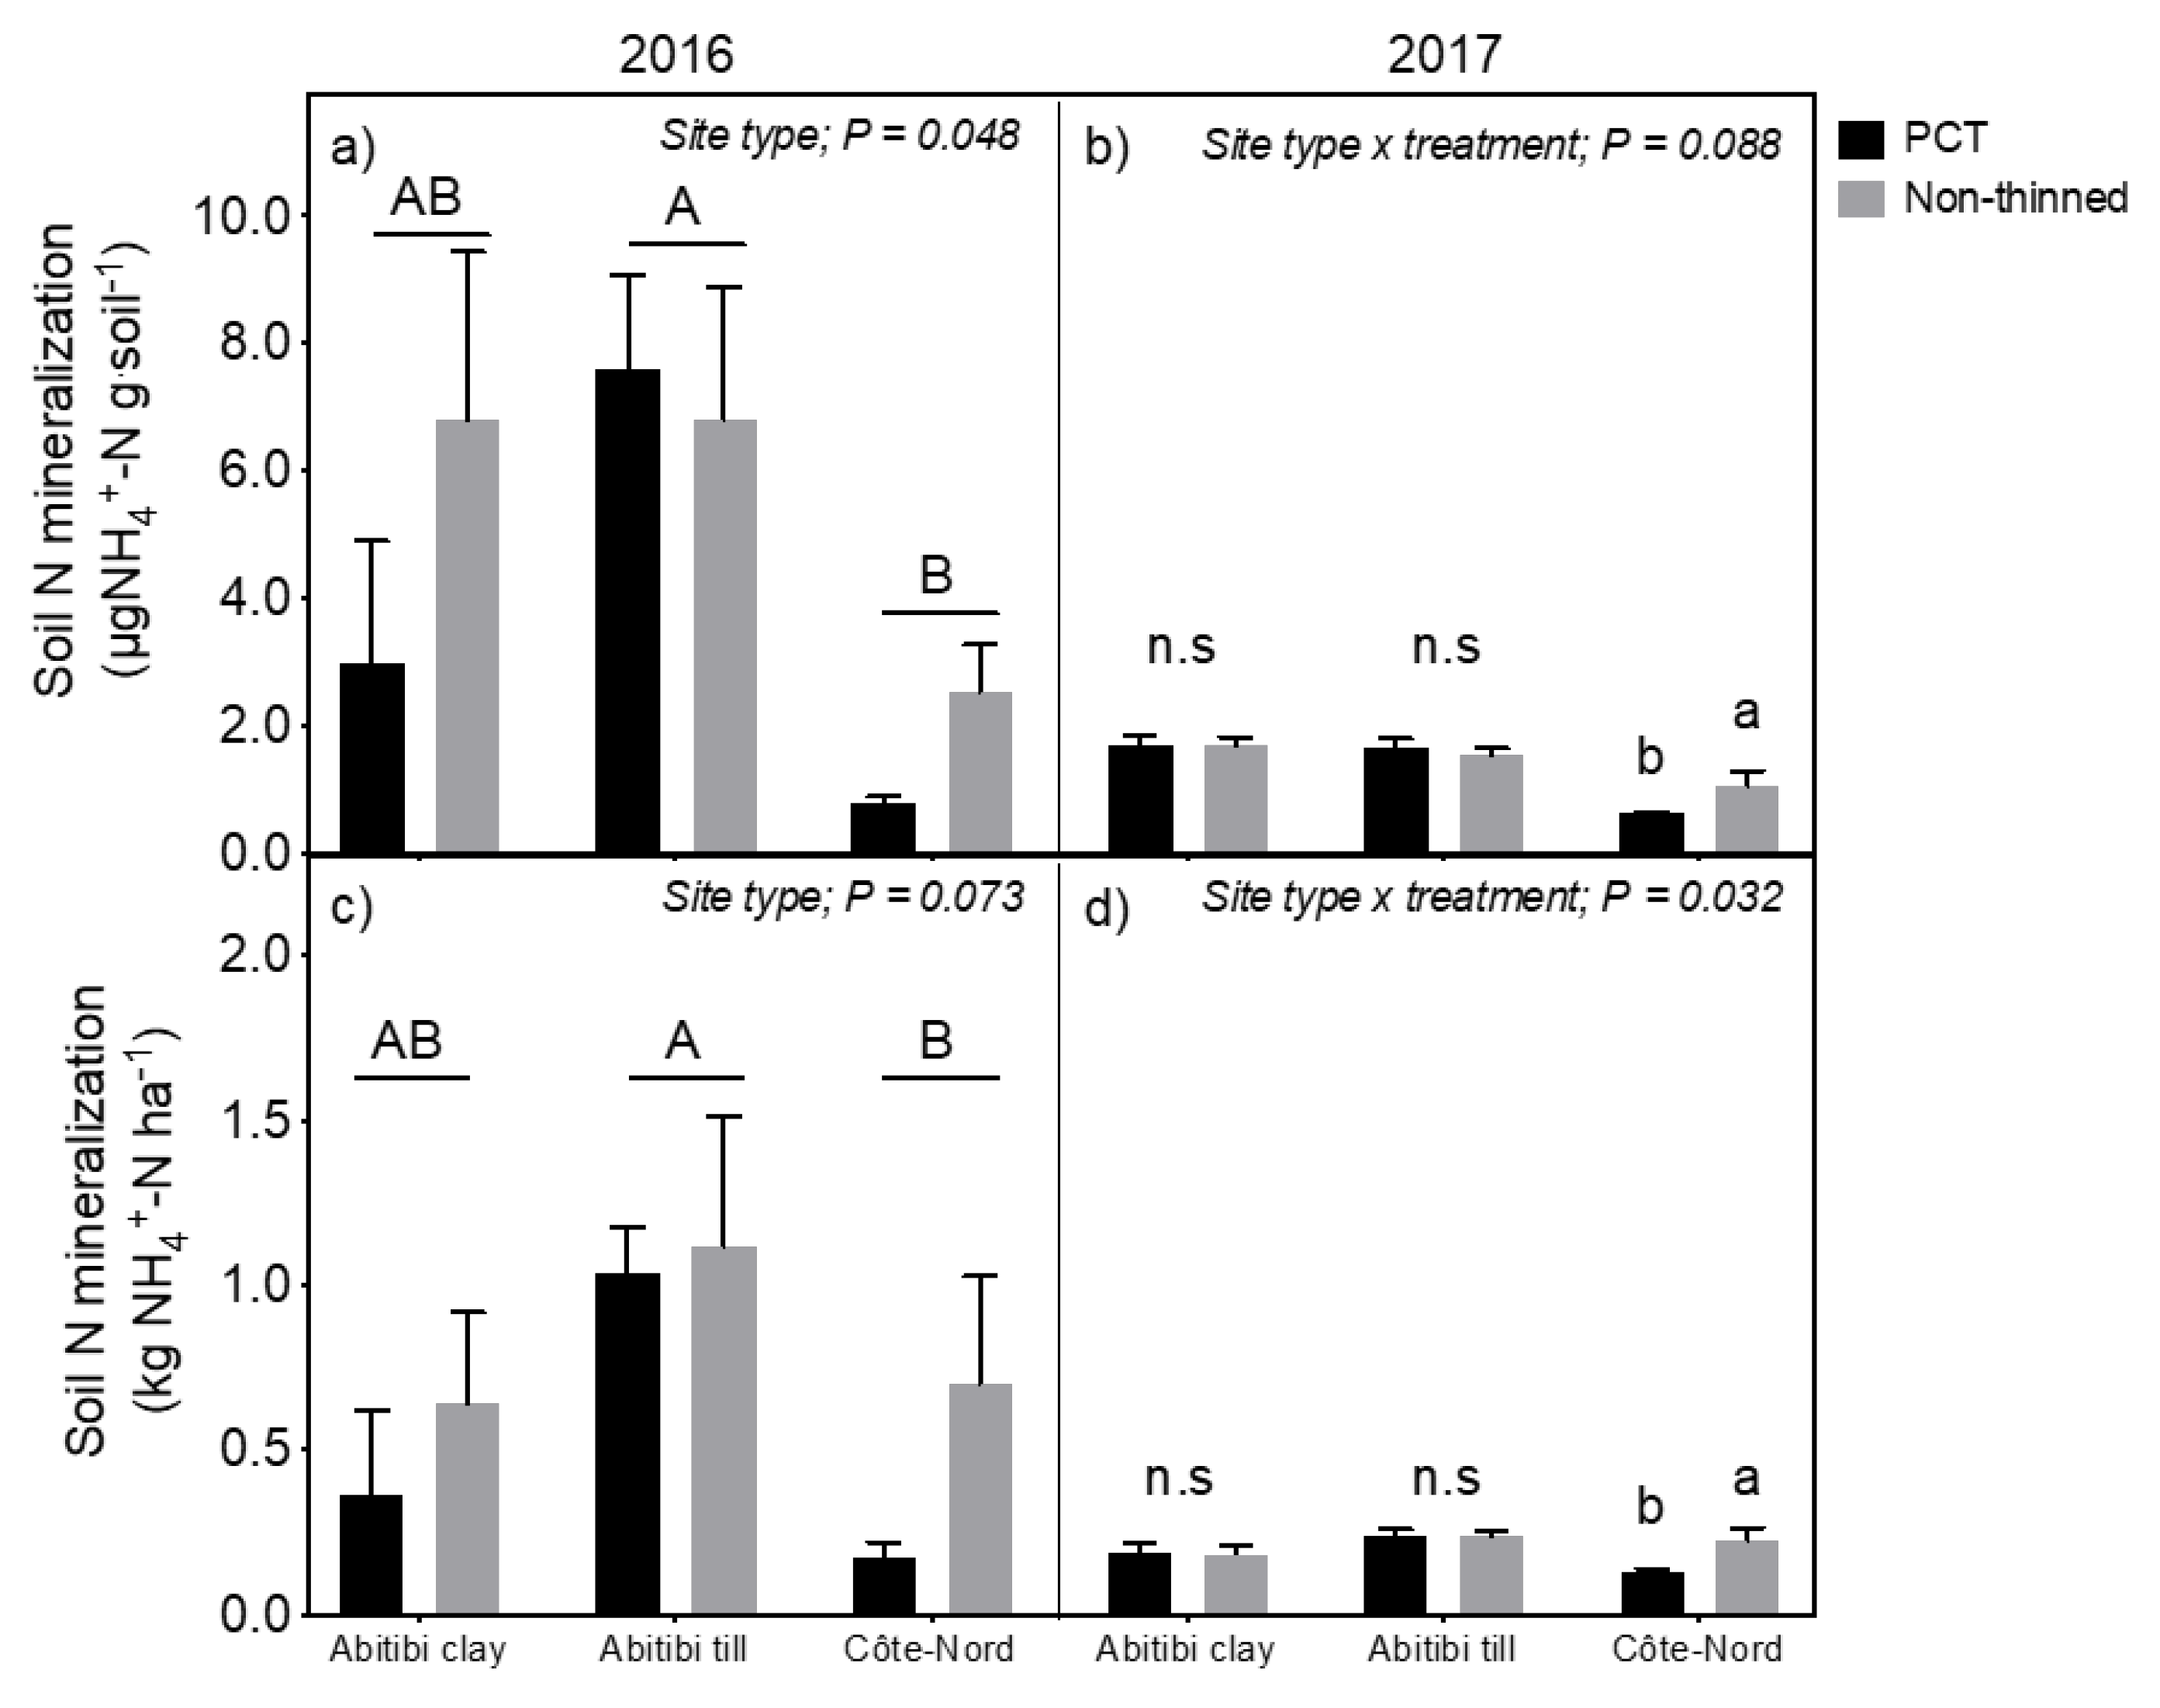
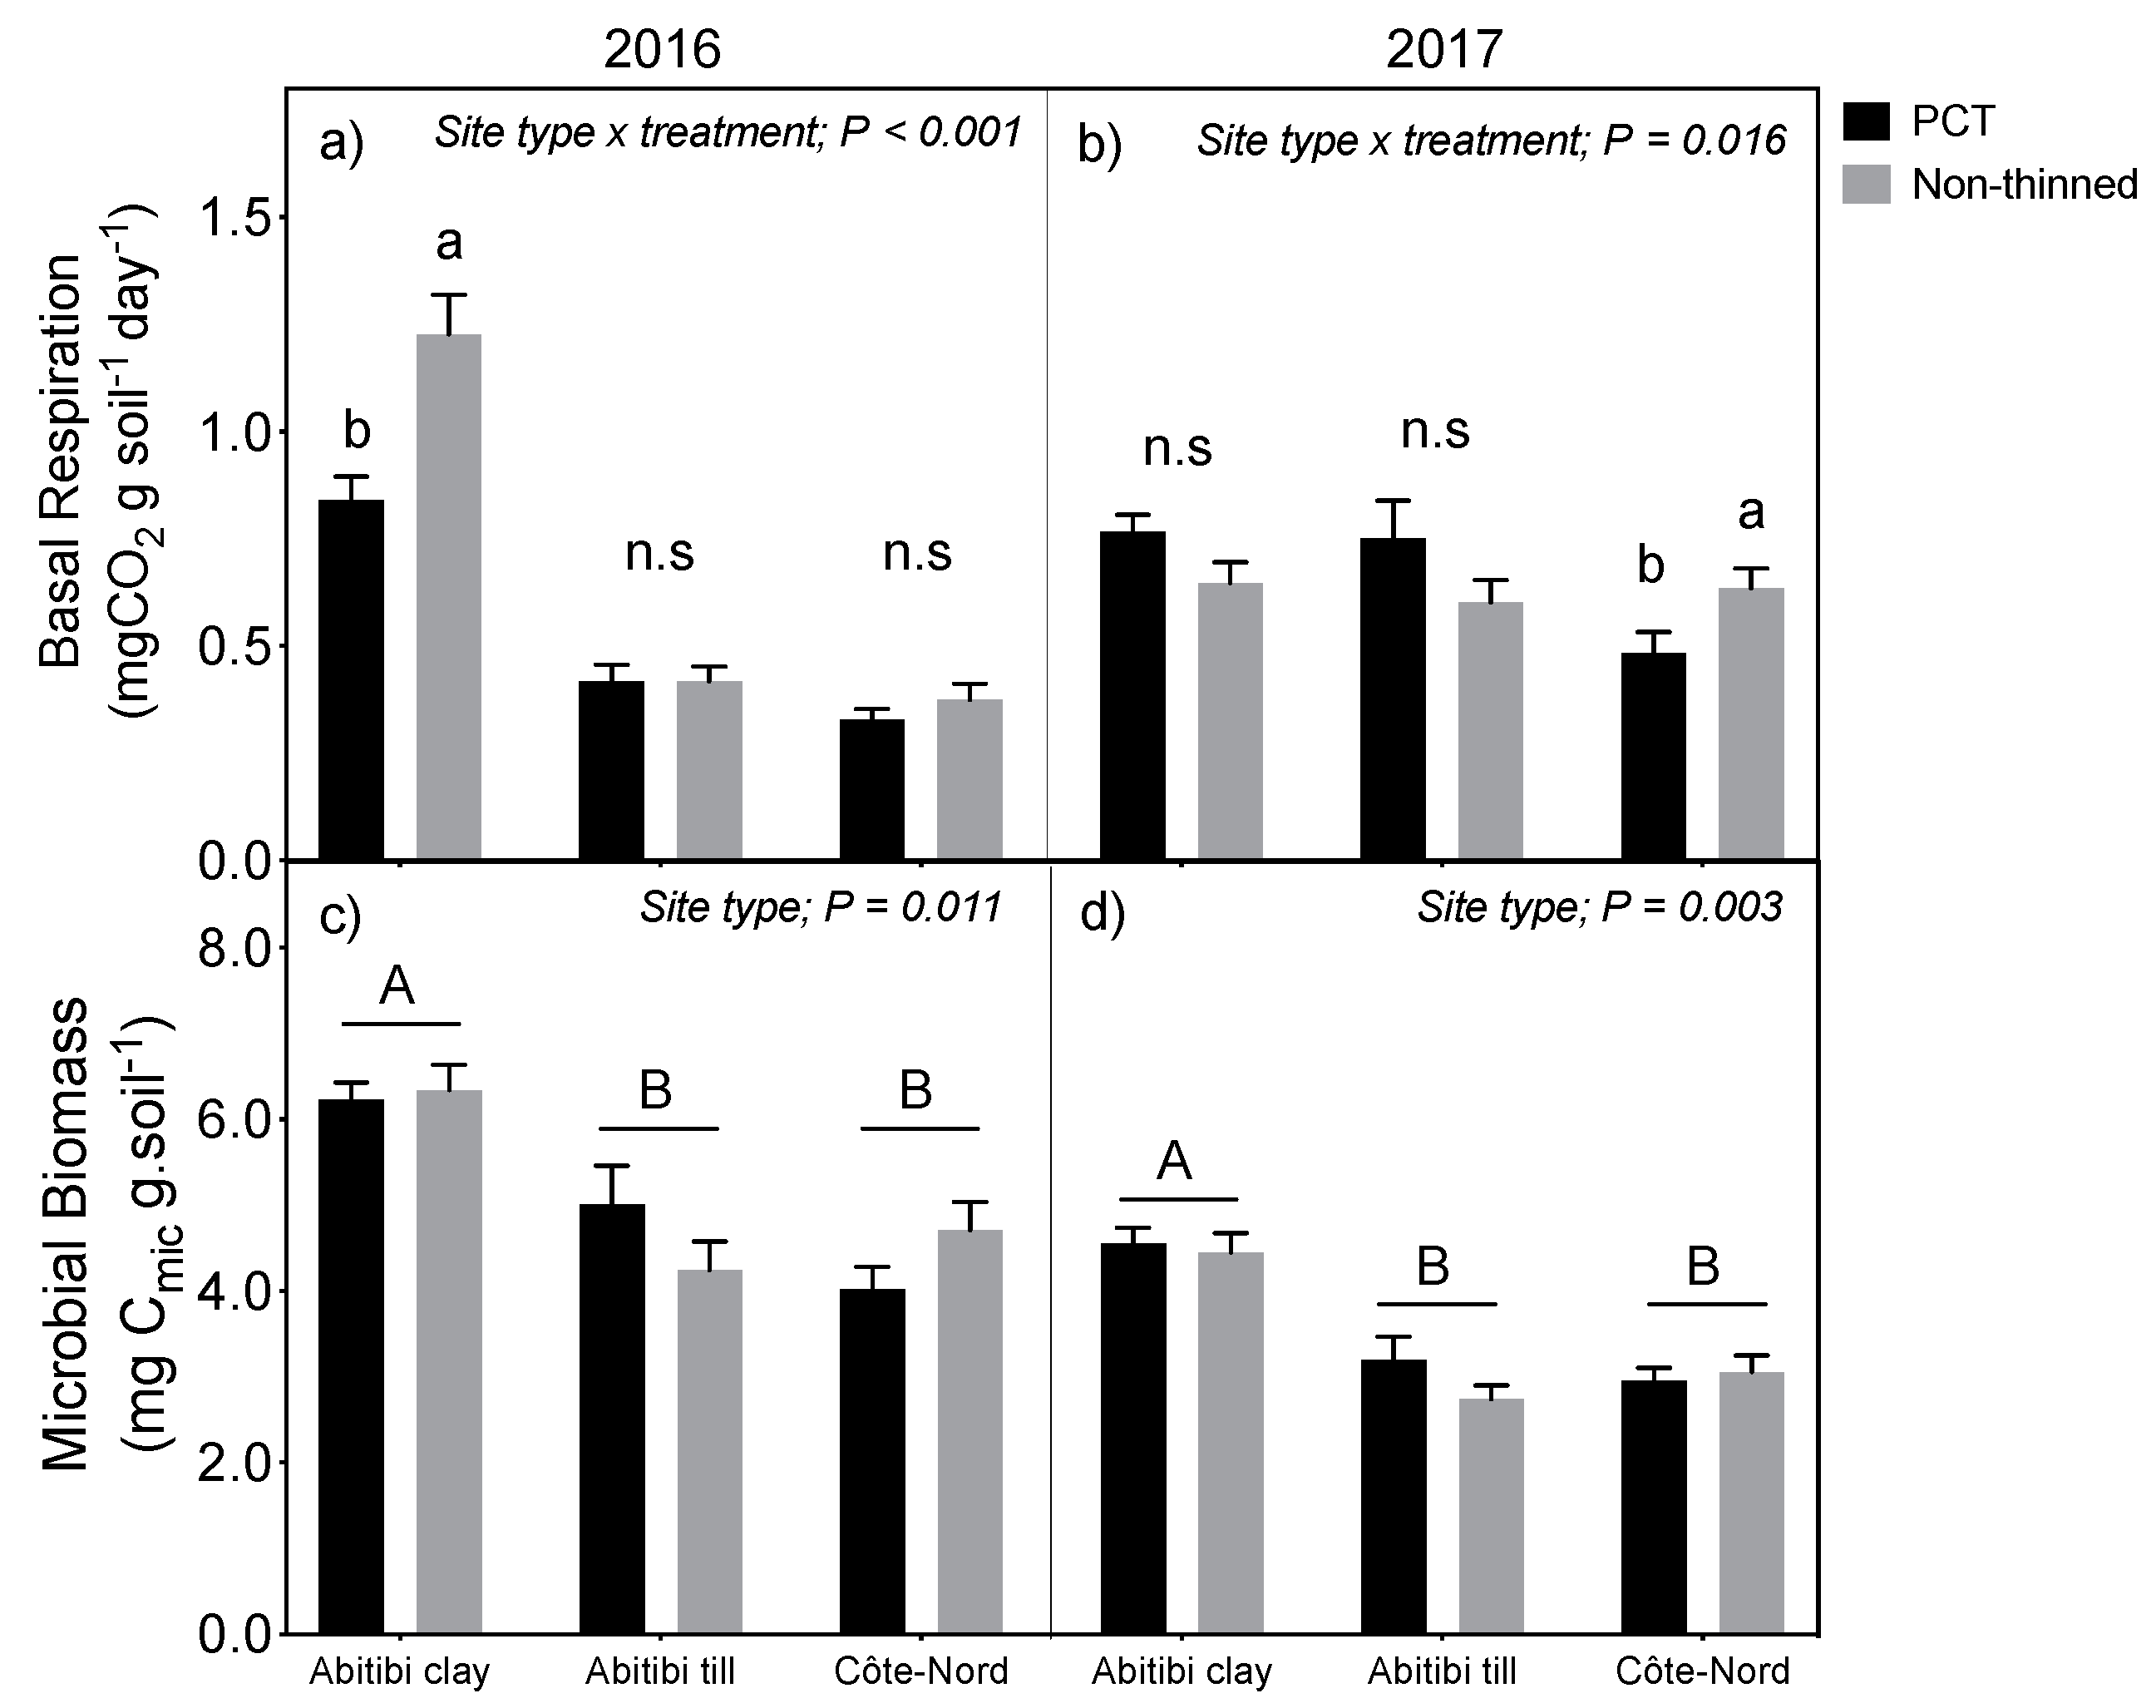
3.2. Forest Floor Nitrogen and Microbial Dynamics

We found significant interactions between treatment, site-type, and sampling year on soil N mineralization data. For this reason, data from each sampling year were analyzed separately. In 2016, N mineralization rate per soil mass was significantly (p = 0.048) higher in Abitibi till than in Côte-Nord (Figure 3a). A similar trend (p = 0.073) was found in 2016 when N mineralization was calculated on a land surface area basis (Figure 3c). In 2017, we found a near significant (p = 0.088) treatment × site type interaction on N mineralization rate per soil mass, and a significant (p = 0.032) treatment × site type interaction on N mineralization rate per land surface area. On both a soil mass and land surface area basis, N mineralization rates in Côte-Nord were significantly (p = 0.046 and p = 0.023, respectively) lower in PCT than in control plots, whereas PCT had no effect on N mineralization rates in the other site types (Figure 3b,d).
Across all plots, there was a significant (p = 0.001) positive relationship between forest floor N mineralization rate per land surface area measured in 2016, and foliar N concentration of 1 year old needles collected in 2017 (Supplementary Data File—S2).
In both sampling years, there were significant (p < 0.001 in 2016; p = 0.016 in 2017) PCT × site type interactions on microbial basal respiration (Figure 4a,b). More specifically, basal respiration in 2016 was significantly (p = 0.002) lower in PCT than in control plots within Abitibi clay sites; a similar effect (p = 0.030) was found in 2017 within Côte-Nord sites. In both sampling years, soil microbial biomass was significantly (p = 0.011 in 2016; p = 0.003 in 2017) higher in Abitibi clay than in the other two site types (Figure 4c,d).

3.3. Foliar Chemistry

Foliar N concentration was significantly (p = 0.008) higher, and foliar C:N significantly (p = 0.023) lower in Abitibi till than in Côte-Nord (Table 2). There was no effect of PCT treatment on foliar chemistry in any of the site types. There was no effect of site type, nor of PCT treatment, on foliar δ13C values. For foliar samples collected in the Côte-Nord region, there were minor differences in foliar δ18O values (relative standard deviation (RSD) = 1.19%), resulting in a flat slope when plotting δ18O against δ 13C values. By contrast, the RSD of foliar δ18O values in Abitibi clay and Abitibi till were 3.50% and 3.61%, respectively. Across Abitibi plots, we found a positive relationship between δ18O and δ13C values, however this relationship was not significant (p = 0.20).

3.4. Indices of Soil Moisture Availability

Total annual precipitation (Table 3) in the Abitibi region in both sampling years was low (i.e., 664 and 684 mm) relative to the 30-year (1980–2010) mean for the Val d’Or weather station (929 mm). Conversely, total annual precipitation in the Côte-Nord region in both sampling years was high (i.e., 1036 and 1159 mm) relative to the 30-year (1980–2010) mean for the Baie Comeau weather station (1001 mm). In both sampling years, BioSim simulations revealed higher PET in Abitibi till, followed by Abitibi clay and Côte-Nord (Table 3). Conversely, CMI in both sampling years was highest in Côte-Nord, followed by Abitibi clay and Abitibi till. Data provided by the MFWP revealed that Abitibi clay sites were imperfectly drained, whereas those from Abitibi till and Côte-Nord were moderately to rapidly drained (Table 3). Average forest floor moisture over the two sampling years was significantly (p = 0.004) higher in Abitibi clay (303%) than in Abitibi till (188%). Forest floor moisture in the Abitibi till sites was higher (i.e., approaching significance at p = 0.058) in PCT than in control plots (Table 3).

4. Discussion

Although PCT resulted in lower total basal area, our data suggest that it also resulted in bigger trees, as evidenced by higher QMD and DBH values on PCT plots. However, higher QMD values may not necessarily reflect higher growth rates on PCT plots, because QMD is a measure of the central tendency in the population. In other words, the removal of smaller stems due to PCT automatically results in a higher QMD value, even if the remaining trees remain the same size. For this reason, we also calculated the arithmetic mean DBH of the eight dominant trees on each plot, as this value is free of numerical artifact. The significantly higher DBH values of dominant trees on PCT plots confirmed that PCT had a positive effect on tree radial growth in all three site types. The fact that we did not observe PCT effects on tree height calls into question the use of height measurements for assessing the response of boreal trees to overstory removal. This topic was discussed in a review article by Ruel et al. [33], where the authors pointed out inconsistencies in the height response of black spruce to stand thinning. They proposed that advance regeneration less than 2 m tall is more likely to increase in height after stand thinning than taller regeneration.
Foliar N concentrations of one-year-old needles are generally less variable than those of current-year needles [34], and are thus commonly used as reliable indicators of site nutritional quality (e.g., Hebert et al. [35]). Thus, the positive significant relationship between soil N mineralization rates in 2016 and one-year-old needle N concentrations in 2017 (i.e., needles formed in 2016) is validation that N mineralization rates during laboratory soil incubations are reliable indices of site N fertility. Our data thus suggest that N fertility in Abitibi till was higher than in Côte-Nord. It should be noted that N mineralization rates per unit mass is indicative of soil organic matter quality, whereas N mineralization rates per land surface area is indicative of soil N availability to trees. In 2017, we found a significant negative effect of PCT on both of these indices in Côte-Nord. A similar, albeit non-significant, trend (p ≤ 0.15 based on orthogonal contrasts) was also found in Côte-Nord and Abitibi clay sites in 2016. The effect size in Côte-Nord was actually larger in 2016 than in 2017, but the non-significance of the effect in 2016 arises from the lower sampling intensity resulting in lower statistical power. A drop in soil N mineralization following PCT may arise from increased sunlight reaching the forest floor, thereby increasing the spread of ericaceous shrubs in the understory [36]. These shrubs, such as sheep laurel and Labrador tea, are known to produce litters that substantially reduce soil N mineralization [37]. There is evidence that the competitive ability of ericaceous shrubs increases on wetter sites [36], as in Côte-Nord where precipitation is high and in Abitibi clay where soil drainage is poor. Hence, while PCT may increase tree radial growth by decreasing intraspecific competition for resources, our results suggest that PCT may also reduce soil nutrient cycling on wetter sites. This drop in nutrient cycling due to a decrease in soil organic matter quality is further corroborated by lower basal respiration rates on PCT plots in Abitibi clay (2016) and Côte-Nord (2017).
As we earlier hypothesized, PCT may reduce competition for soil water by reducing whole-stand evapotranspiration. Based on values of annual precipitation, PET, CMI, and drainage class, it is likely that Abitibi till is the site type that is most apt to experience summer soil moisture deficits. Therefore, we expect PCT to release trees from moisture stress in Abitibi till plots more so than in other site types. This is corroborated by a positive effect of PCT on soil moisture in Abitibi till, but not in the other two site types. While this evidence is not overwhelming, it is consistent with expectations. However, the positive slope between foliar δ13C and δ18O values on Abitibi till plots was not statistically significant, thereby preventing us from further asserting that photosynthesis in this drier site type is controlled by stomatal conductance. This may be because our needle samples were from a single year and may not necessarily reflect the demand vs. supply of soil water over an entire forest rotation. We suggest that future research use a dendrochronological approach to correlate tree ring increments with annual summer moisture deficits over the lifespan of trees, to determine whether PCT improved growth in abnormally dry years.
Average stand density of PCT plots across all 12 sites was 35–54% of stand density on control plots. It is likely therefore, that PCT substantially increased canopy openness and light availability in the first years following treatment. It is unclear, however, whether higher canopy openness plays a part in improving growth, since black spruce is a shade tolerant species whose light saturation point lies between 10–50% incident light [38]. This was corroborated by Goudiaby et al. [39] who showed that stand thinning does not increase rates of photosynthesis of black spruce needles. However, higher canopy openness could have increased the capture of available light by increasing the retention of subcanopy branches [20], in other words, by increasing the total needle surface area of individual trees. We have little way of verifying this, as our study was undertaken 20 years after treatment, when canopy gaps on most sites had time to close. This is especially the case in Abitibi till and Côte-Nord sites, where average canopy openness of PCT plots was only 1–2% higher than control plots. However, canopy openness on three of the four Abitibi clay sites was 5–10% higher on PCT than on control plots, and the total range of canopy openness values across Abitibi clay sites was 12–37%. The fact that we see a significant negative relationship between canopy openness and DBH across Abitibi clay sites (Figure 2), even though PCT generally increases DBH within sites, is more presumptive evidence that light availability does not drive productivity of black spruce on PCT plots.

5. Conclusions

In summary, our study showed a positive growth response of black spruce to PCT in three contrasting site types. Our results suggest that most of this growth response resulted from lower competition for soil resources due to a substantial reduction in stand density. Paradoxically, we found evidence that PCT may actually reduce soil nutrient cycling on the wetter sites. Conversely, we found evidence that PCT may release trees from moisture stress on drier sites. We conclude that PCT achieves its stated short-term objectives in regenerating black spruce stands, but is best suited to drier sites. Given that climate models project increasingly drier conditions in Quebec’s southern boreal region [40], the use of PCT appears to be an appropriate adaptive management strategy in the context of climate change.

Supplementary Materials

The following are available online at https://www.mdpi.com/1999-4907/11/5/599/s1, Figure S1: Duplication of Figure 2 with all 64 data points, Figure S2: Linear regression between soil mineralizable N and foliar N, Tables S3: Results of mixed-model ANOVAs, Figure S4: Correlation matrix between measured variables.

Author Contributions

Conceptualization, A.W., R.L.B., D.H.; methodology, A.W., R.L.B., D.H., S.T., M.B., K.R.; validation, R.L.B.; formal analysis, A.W.; investigation, A.W., K.R.; resources, R.L.B., D.H., S.T., M.B.; data curation, A.W., K.R.; writing—original draft preparation, A.W.; writing—reviewing and editing, A.W., R.L.B., D.H., S.T., M.B., K.R.; visualization, A.W.; supervision, R.L.B., D.H.; project administration, R.L.B.; funding acquisition, R.L.B. All authors have read and agreed to the published version of the manuscript.

Funding

This research was funded by a Natural Sciences and Engineering Research Council of Canada (NSERC) Strategic Project Grant awarded to R.L. Bradley.

Acknowledgments

The authors thank M.-C. Lambert (MFWP) for BioSim climate data, F. Rousseau for advice on statistical analyses, as well as W. Parsons, T. Audet and S. Cloutier for technical assistance.

Conflicts of Interest

The authors declare no conflict of interest.

References

  1. Ministère des Ressources naturelles et de la Faune. Sustainable Management in the Boreal Forest: A Real Response to Environmental Challenges; Ministère des Ressources naturelles et de la Faune, Direction de l’environnement et de la protection des forêts: Québec City, QC, Canada, 2008. [Google Scholar]
  2. Liu, C.; Zhang, S.Y.; Cloutier, A.; Rycabel, T. Modeling lumber bending stiffness and strength in natural black spruce stands using stand and tree characteristics. For. Ecol. Manag. 2007, 242, 648–655. [Google Scholar] [CrossRef]
  3. Laflèche, V.; Tremblay, S. Reésultats De Cinq Ans De La Mesure Des Effets Reéels Du Traitement d’Eéclaircie Preécommerciale De Peuplements À Dominance Reésineuse; Ministère des Ressources Naturelles et de la Faune, Direction de la Recherche Forestière: Roberval, QC, Canada, 2008. [Google Scholar]
  4. Bell, F.W.; Parton, J.; Stocker, N.; Joyce, D.; Reid, D.; Wester, M.; Stinson, A.; Kayahara, G.; Towill, B. Developing a silvicultural framework and definitions for use in forest management planning and practice. For. Chron. 2008, 84, 678–693. [Google Scholar] [CrossRef] [Green Version]
  5. Pothier, D. Twenty-year results of precommercial thinning in a balsam fir stand. For. Ecol. Manag. 2002, 168, 177–186. [Google Scholar] [CrossRef]
  6. Brissette, J.C.; Frank, R.M.; Stone, T.L.; Skratt, T.A. Precommercial thinning in a northern conifer stand: 18-Year results. For. Chron. 1999, 75, 967–972. [Google Scholar] [CrossRef] [Green Version]
  7. Poulin, J. Éducation au stade gaulis. In Bureau Du Forestier En Chef. Manuel De Détermination Des Possibilités Forestières 2013–2018; Gouvernement du Québec: Roberval, QC, Canada, 2013; pp. 83–85. [Google Scholar]
  8. Brockley, R.P. Effects of post-thinning density and repeated fertilization on the growth and development of young lodgepole pine. Can. J. For. Res. 2005, 35, 1952–1964. [Google Scholar] [CrossRef]
  9. Sohn, J.A.; Gebhardt, T.; Ammer, C.; Bauhus, J.; Häberle, K.H.; Matyssek, R.; Grams, T.E.E. Mitigation of drought by thinning: Short-term and long-term effects on growth and physiological performance of Norway spruce (Picea abies). For. Ecol. Manag. 2013, 308, 188–197. [Google Scholar] [CrossRef]
  10. Bureau Du Forestier En Chef. Prévisibilité, Stabilité Et Augmentation Des Possibilités Forestières; Bureau Du Forestier En Chef: Roberval, QC, Canada, 2017. [Google Scholar]
  11. Thibodeau, L.; Raymond, P.; Camiré, C.; Munson, A.D. Impact of precommercial thinning in balsam fir stands on soil nitrogen dynamics, microbial biomass, decomposition, and foliar nutrition. Can. J. For. Res. 2000, 30, 229–238. [Google Scholar] [CrossRef]
  12. Gray, A.N.; Spies, T.A.; Easter, M.J. Microclimatic and soil moisture responses to gap formation in coastal Douglas-fir forests. Can. J. For. Res. 2002, 32, 223–343. [Google Scholar] [CrossRef] [Green Version]
  13. Ritter, E. Litter decomposition and nitrogen mineralization in newly formed gaps in a Danish beech (Fagus sylvatica) forest. Soil Biol. Biochem. 2005, 27, 1237–1247. [Google Scholar] [CrossRef]
  14. Bradley, R.L.; Titus, B.D.; Preston, C.M.; Bennett, J. Improvement of nutritional site quality 13 years after single application of fertiliser N and P on regenerating cedar-hemlock cutovers on northern Vancouver Island, BC. Plant Soil 2000, 223, 195–206. [Google Scholar] [CrossRef]
  15. Chase, C.W.; Kimsey, M.J.; Shaw, T.M.; Coleman, M.D. The response of light, water, and nutrient availability to pre-commercial thinning in dry inland Douglas-fir forests. For. Ecol. Manag. 2016, 363, 98–109. [Google Scholar] [CrossRef]
  16. Kolb, T.E.; Holmberg, J.M.; Wagner, M.R.; Stone, J.E. Regulation of ponderosa pine foliar physiology and insect resistance mechanisms by basal area treatments. Tree Physiol. 1998, 18, 375–381. [Google Scholar] [CrossRef] [PubMed] [Green Version]
  17. Kolb, T.E.; Stone, J.E. Differences in leaf gas exchange and water relations among species and tree sizes in an Arizona pine-oak forest. Tree Physiol. 2000, 12, 1–12. [Google Scholar] [CrossRef] [PubMed]
  18. McDowell, N.; Brooks, J.R.; Fitzgerald, S.A.; Bond, B.J. Carbon isotope discrimination and growth response of old Pinus ponderosa trees to stand density reductions. Plant Cell Environ. 2003, 26, 631–645. [Google Scholar] [CrossRef]
  19. Farquhar, G.; O’Leary, M.; Berry, J. On the Relationship between Carbon Isotope Discrimination and the Intercellular Carbon Dioxide Concentration in Leaves. Aust. J. Plant Physiol. 1982, 9, 121–137. [Google Scholar] [CrossRef]
  20. Landsberg, J.; Sands, P. The 3-PG Process-Based Model. In Physiological Ecology of Forest Production; Terrestrial, Ecology; Landsberg, J., Sands, P., Eds.; Elsevier: Amsterdam, The Netherlands, 2011; Volume 4, pp. 241–282. [Google Scholar]
  21. Pacé, M.; Barrette, M.; Fenton, N.J.; Paré, D.; Bergeron, Y. Ground-Layer Composition May Limit the Positive Impact of Precommercial Thinning on Boreal Stand Productivity. For. Sci. 2017, 63, 559–568. [Google Scholar] [CrossRef] [Green Version]
  22. Morneau, C.; Landry, Y. Guide De Reconnaissance Des Types écologique De La Région écologique 6j—Hautes Collines Du Lac Cacaoui; Ministère des Ressources naturelles et de la Faune, Forêt Québec, Direction des inventaires forestiers, Division de l’analyse et de la diffusion des informations forestières et écologiques: Roberval, QC, Canada, 2010. [Google Scholar]
  23. Blouin, J.; Berger, J.-P. Guide De Reconnaissance Des Types écologiques De La Région écologique 5a—Plaine De L’Abitibi; Ministère des Ressources naturelles du Québec, Forêt Québec, Direction des inventaires forestiers, Division de la classification écologique et productivité des stations: Québec, QC, Canada, 2002. [Google Scholar]
  24. Vincent, J.-S.; Hardy, L. L’évolution et l’extension des lacs glaciaires Barlow et Ojibway en territoire québécois Article abstract. Géographie Phys. Quat. 1977, 31, 357–372. [Google Scholar] [CrossRef] [Green Version]
  25. Soil Classification Working Group. The Canadian System of Soil Classification, 3rd ed.; Agriculture and Agri-Food Canada Publication, Ed.; NRC Research Press: Ottawa, ON, Canada, 1998. [Google Scholar]
  26. Curtis, R.O.; Marshall, D.D. Technical note: Why quadratic mean diameter? West. J. Appl. For. 2000, 15, 137–139. [Google Scholar] [CrossRef] [Green Version]
  27. Frazer, G.W.; Canham, C.D.; Lertzman, K.P. Gap Light Analyzer (GLA), Version 2.0: Imaging Software to Extract Canopy Structure and Gap Light Transmission Indices from True-Colour Fisheye Photographs, Users Manual and Program Documentation; Copyright © 1999: Simon Fraser University, Burnaby, British Columbia, and the Institute of Ecosystem Studies: Millbrook, NY, USA, 1999. [Google Scholar]
  28. Bond-Lamberty, B.; Gower, S.T. Decomposition and fragmentation of coarse woody debris: Re-visiting a boreal black spruce chronosequence. Ecosystems 2008, 11, 831–840. [Google Scholar] [CrossRef]
  29. Shaw, C.H.; Bhatti, J.S.; Sabourin, K.J. An Ecosystem Carbon Database for Canadian Forests; Canadian Forest Service, Northern Forestry Centre: Edmonton, AB, Canada, 2005. [Google Scholar]
  30. Anderson, J.P.E.; Domsch, K.H. A physiological method for the quantitative measurement of microbial biomass in soils. Soil Biol. Biochem. 1978, 10, 215–221. [Google Scholar] [CrossRef]
  31. Régnière, J. Generalized Approach to Landscape-Wide Seasonal Forecasting with Temperature-Driven Simulation Models. Environ. Entomol. 1996, 25, 869–881. [Google Scholar] [CrossRef]
  32. Régnière, J.; St-Amant, R. Stochastic simulation of daily air temperature and precipitation from monthly normals in North America north of Mexico. Int. J. Biometeorol. 2007, 51, 415–430. [Google Scholar] [CrossRef] [PubMed]
  33. Ruel, J.-C.; Messier, C.; Doucet, R.; Claveau, Y.; Comeau, P. Morphological indicators of growth response of coniferous advance regeneration to overstorey removal in the boreal forest. For. Chron. 2000, 76, 633–642. [Google Scholar] [CrossRef] [Green Version]
  34. Linder, S. Foliar analysis for detecting and correcting nutrient imbalances in Norway spruce. Ecol. Bull. 1995, 44, 178–190. [Google Scholar]
  35. Hebert, F.; Thiffault, N.; Munson, A.D. Field Photosynthesis Measurements on Black Spruce (Picea mariana): Does Needle Age Matter? Commun. Soil Sci. Plant Anal. 2011, 42, 2738–2750. [Google Scholar] [CrossRef]
  36. Reicis, K.; Bradley, R.L.; Joanisse, G.; Houle, D.; Tremblay, S.; Barrette, M.; Wotherspoon, A. Pre-commercial thinning enhances competitive traits of boreal ericaceous shrubs and reduces soil fertility. For. Ecol. Manag. 2020, 458, 117801. [Google Scholar] [CrossRef]
  37. Joanisse, G.D.; Bradley, R.L.; Preston, C.M.; Bending, G.D. Sequestration of soil nitrogen as tannin-protein complexes may improve the competitive ability of sheep laurel (Kalmia angustifolia) relative to black spruce (Picea mariana). New Phytol. 2009, 181, 187–198. [Google Scholar] [CrossRef]
  38. Lamhamedi, M.; Bernier, P. Ecophysiology and field performance of black spruce (Picea mariana): A review. Ann. Des Sci. For. 1994, 51, 529–551. [Google Scholar] [CrossRef] [Green Version]
  39. Goudiaby, V.; Brais, S.; Grenier, Y.; Berninger, F. Thinning effects on jack pine and black spruce photosynthesis in Eastern boreal forests of Canada. Silva Fenn. 2011, 45, 595–609. [Google Scholar] [CrossRef] [Green Version]
  40. Houle, D.; Bouffard, A.; Duchesne, L.; Logan, T.; Harvey, R. Projections of Future Soil Temperature and Water Content for Three Southern Quebec Forested Sites. J. Clim. 2012, 25, 7690–7701. [Google Scholar] [CrossRef]
Figure 1. Forest mensuration data for pre-commercial thinning (PCT) and non-thinned plots in each of three site types: (a) mean diameter at breast height (DBH) of eight dominant trees measured in 2016, (b) quadratic mean diameter (QMD) of each plot calculated at 15 years after PCT treatment, and (c) mean total basal area (BA) calculated at 15 years after PCT treatment. Vertical lines denote one standard error of the mean (n = 32 for DBH; n = 4 for QMD and BA).
Forests 11 00599 g001
Figure 2. Results of linear regression analysis testing the relationship between canopy openness and mean diameter at breast height (DBH) in Abitibi clay plots. Only Abitibi clay plots are shown because differences in canopy openness values between PCT and control plots on the other two site-types varied by less than 2%. Solid circles and white squares represent the mean DBH (n = 8) of PCT and non-thinned plots, respectively, on each of 8 plots. PCT and non-thinned plots from the same site are linked by dashed lines. The linear regression model includes all 64 data points (see Supplementary Data File—S1). The grey shaded area represents the 95% confidence interval of the predicted regression slope. Vertical lines represent the standard error of DBH within sites.
Forests 11 00599 g002
Figure 3. Potential N mineralization rates (a,b) per gram of forest floor, and (c,d) per hectare. Significant (p < 0.05) differences between treatments (within site type) are denoted by lower-case letters; significant, or close to significant (0.05 < p < 0.09), differences between site types are denoted by underlined upper-case letters; significant interactions between site types and treatments are indicated in the upper right corner of the frame. Vertical lines denote one standard error of the mean (n = 4).
Forests 11 00599 g003
Figure 4. Basal respiration (a,b) and microbial biomass (c,d) in forest floors. Significant (p < 0.05) differences between treatments (within site type) are denoted by lower-case letters; significant differences between site types are denoted by upper-case letters; significant interactions between site types and treatments are indicated in the upper right corner of the frame. Vertical lines denote one standard error of the mean (n = 4).
Forests 11 00599 g004
Table 1. Site characteristics of pre-commercial thinning (PCT) and non-thinned black spruce stands on three site types (N = 24). Values in parentheses denote one standard error of the mean (n = 4).
Abitibi ClayAbitibi TillCôte-Nord
Year of clear-cut 1974–19781979–19821974–1979
Year of PCT1995–19991996–19991997–1999
Understory communityKalmia angustifolia, Ledum groenlandicum, Vaccinium spp., Sphagnum spp., Alnus rugosaKalmia angustifolia, Vaccinium spp., Pleurozium schreberi, Diervilla loniceraKalmia angustifolia, Ledum groenlandicum, Pleurozium schreberi, Sphagnum spp.
PCTNon-
Thinned
PCTNon-
Thinned
PCTNon-
Thinned
Stand density 15 y after treatment (stems ha−1)13,912
(1574)
23,319
(373)
8856
(1667)
19,644
1924)
9100
(1572)
17,381
(3738)
Tree height (m)8.1
(0.22)
8.3
(0.16)
8.9
(0.30)
8.9
(0.21)
7.8
(0.22)
7.7
(0.21)
Canopy openness (%)25.8
(5.6)
20.6
(4.3)
16.5
(2.3)
14.5
(0.5)
22.3
(1.5)
20.5
(1.6)
Forest floor depth (cm)8.0
(1.2)
7.6
(1.1)
10.5
(0.8)
11.3
(0.47)
15.6
(1.4)
17.4
(2.1)
Table 2. One-year-old needle properties in PCT and non-thinned stands across three site types. Values are means of two sampling years, except δ13C isotope ratios that are for 2016 only. Values in parentheses denote one standard error of the mean (n = 4).
Abitibi ClayAbitibi TillCôte-NordSignificant Effects
PCTNon-
Thinned
PCTNon-
Thinned
PCTNon-
Thinned
Foliar N (mg g−1)9.19
(0.17)
9.09
(0.16)
9.94
(0.12)
9.95
(0.11)
8.63
(0.11)
8.31
(0.11)
Abitibi till > Côte Nord (p = 0.008)
Foliar C:N53.59
(1.02)
54.01
(0.087)
50.74
(0.60)
49.96
(0.56)
56.23
(0.71)
58.60
(0.73)
Côte Nord > Abitibi till (p = 0.023)
δ13C−28.31
(0.10)
−28.55
(0.07)
−28.40
(0.07)
−28.26
(0.10)
−28.56
(0.13)
−28.23
(0.08)
None
Table 3. Indices of moisture availability across site types, sorted either by sampling year or treatment. Precipitation values for the Abitibi and Côte-Nord regions were obtained from Environment Canada weather stations in the towns of Val d’Or and Baie Comeau, respectively. Potential evapotranspiration and climate moisture index values were estimated using BioSIM software. The drainage class of each plot was obtained from the Ministry of Forests, Wildlife and Parks (MFWP) databank. Significant (p < 0.05) differences in gravimetric moisture content between PCT and control treatments (within site types), are denoted by lower-case letters. Values in parentheses denote one standard error of the mean (n = 4).
Abitibi ClayAbitibi TillCôte-Nord
Total annual precipitation (mm)
20166646641036
20176846841159
Potential evapotranspiration (mm)
2016408445339
2017404440395
Climate moisture index (mm)
2016256219637
2017280244764
Drainage class
PCTImperfectModerate to rapidModerate to rapid
Non-thinnedImperfectModerate to rapidModerate to rapid
Gravimetric moisture content (%)
PCT393.7 a (18.0)247.9 a (15.8)250.1 a (8.6)
Non-thinned407.1 a (24.9)169.9 b (11.0)258.0 a (8.8)

