Article

Impact of Number of Operators and Distance to Branch Piles on Woodchipper Operation

Institute of Machine Design, Faculty of Mechanical Engineering, Poznan University of Technology, 60-965 Poznan, Poland
*
Author to whom correspondence should be addressed.
Forests 2020, 11(5), 598; https://doi.org/10.3390/f11050598
Submission received: 16 April 2020 / Revised: 13 May 2020 / Accepted: 20 May 2020 / Published: 25 May 2020
(This article belongs to the Section Wood Science and Forest Products)

Abstract

:
Branch chipping machines with low-power engines are distinguished with an intermittent operation due to a periodical supply of branches. A conventional drive speed control of these machines is not adapted to adjust the operating mode depending on frequency of material supply for shredding. This article discusses the issues related to the assessment of the application of adaptive systems similar in design to start–stop systems used in vehicles, as necessary in the driving of this type machine. During testing, an impact of a distance between a branch pile from the woodchipper, a number of operators on frequency of drive unit operating condition changes, and the mass and volume output (productivity) were considered. A percentage ratio of the active and passive (idle) operation in selected conditions of use was also determined. A low-power 9.5 kW engine-powered cylindrical-type woodchipper was used for testing. Material chopped in the chipper was freshly cut branches of oaks (Quercus L. Sp. Pl. 994. 1753) with a diameter in the largest cross-section ca. 80 mm and moisture content ca. 25%. Piles of branches were located at three different distances from the chipper, i.e., 3 m, 9 m and 15 m. Branches to the chipper were fed by one or two operators. It was demonstrated that the idle run time in tested conditions with one operator could be from 43% to 71% of the entire operating time. Frequency of operating condition changes when only one operator worked and fluctuated from ca. 6 to 2 times per minute. Increasing the number of operators from one to two had a slight impact on the frequency of operating condition changes (by ca. 7%) at the shortest distance from the chipper (3 m). However, at larger distances, the additional operator may increase the frequency of operating condition changes of the chipper by 77% for 9 m distance and 85% for 15 m distance. The mass and volumetric output of the cylindrical chipper in the most advantageous case is equal to 0.66 t/h and 3.5 m3/h, respectively. The increase of the branch pile distance from the chipper causes a drop in mass output by 32%, and volumetric output by 33.5%. The results of the tests confirmed the necessity for the development of low-power chipping machines designed for clearing operations rather than industrial production of biomass. A direction for development could be systems that adapt driving units to operating conditions, depending on a demand for the chipping process.

1. Introduction

The output (productivity) of wood chipping machines strongly depends on the raw material to be chipped, the size of chips, the type of working unit and its settings, wear of knife blades, the size of sieves and the feeding system [1]. Tests of the material for chipping refer mostly to parts of a tree (trunk or branches) [2,3,4,5,6,7,8,9,10], tree species (softwood or hardwood) [2,3,4,5,11,12,13,14,15,16] and moisture content in wood (fresh or dry) [2,5,6]. Tests referring to the machine itself focus on the type of working unit [4,8,10,17,18], the drive unit (high-power industrial types or low-power types) [4,10,19,20], wear of knives blades [3,4,13,14,15,17,18,21,22,23], the size of sieves [3,7,16,20,24] and average productivity [1,5,8,13,19,25,26,27,28,29,30]. Setting of sieve sizes translates to the size of chips obtained, which are also a subject of many studies [2,3,6,8,16,25,26,27,30,31]. The issue that is the least recognized in the literature is the impact of branch supply frequency to the chipper on its productivity. Some articles describe factors which affect the supply rate of branches or trees, e.g., indication of delivery method: a loader [8,12] or an operator [32], and in some cases the number of loaders and operators. Another way to describe productivity of chipping machines with consideration of the factors responsible for the wood supply is to express these results with indication of a percentage delay time ratio [5,19,25]. Furthermore, the topography of the terrain affects the supply of wood to chippers, which may limit a number of loaders or extend the time of their movement [33]. All these methods allow for the estimation of the impact of factors associated with the branch supply on productivity of chipping machines. However, they are not sufficient to analyse productivity of chipping machines equipped with systems that adapt to operating conditions, similar to start–stop systems used in motorized vehicles [34]. Such systems are applied mainly in chippers driven by low-power engines. Because the branches are fed by operators, it is not possible to supply a significant excess quantity of wood to the chipper (for instance, by feeding systems). This is in contrast with high-power industrial chippers, where loaders supply quite large amounts of material that are often difficult to be chipped (such as trunks and logs), thus extending the chipping process time.
The term “small engines” applies only to spark ignition engines when they are used in shredding machines (due to operating conditions) of power lower than 19 kW [35,36]. Provisions regarding nonroad mobile equipment with compression-ignition (CI) engines apply to engines without defined restrictions regarding the power of the power unit. Instead, they introduce a division into different research cycles depending on the power of the engine [35]. However, in the literature, there are available research results for woodchippers defined as low power (209 kW) and medium power (559 kW) [20]. Investigation of factors concerning the impact on branch delivery by operators is essential due to application of systems that adapt the chipper rotational speed to the demands of the chipping process [37,38]. Conventional speed control of the woodchipper driven by a spark-ignition engine equipped with a carburettor (such drives are most often available on the market [39,40]) is provided by means of a speed control lever. Once the machine is started, a high speed is set that allows the drive operation within a range of a maximum torque or rating. Such a system responds only to changes of motor loads through mechanisms of centrifugal controllers and the set points selected by the operator by means of the lever. Such a solution does not allow one to identify the demand for the rotational speed essential for proper operation of the working unit. It is beneficial, in terms of qualitative emission of flue gas and fuel consumption, to make the machine work at a high speed during the chipping of branches and at a low speed during the waiting time (idle operation).
As it is technically possible to develop adaptative systems for this type of device, evaluation of operating conditions of these machines is necessary, focused on measurements of factors affecting the frequency of branch supply to the chipper and their influence on productivity.
Legislative bodies impose obligations to use start–stop systems in motorized vehicles [36], which, as shown in studies of Cieślik et al., are used in 20% of vehicles while driving in a city cycle [41]. Studies published in Polish, inaccessible for most scientists, indicated that in branch chipping machines, the idle run time ratio may be much higher [32].
This article presents results of tests for delivery of branches from piles at three different distances (3 m, 9 m, 15 m), while the machine was operated by one or two operators. During tests, the frequency (interval) of branch delivery, as well as the mass and volumetric productivity of a cylindrical chipper were determined. These values will determine if the application of adaptation systems in low-power chipping machines is justified. Test results of the cylindrical chipper productivity may be used for economic calculations associated with operating costs of this type of machine.

2. Materials and Methods

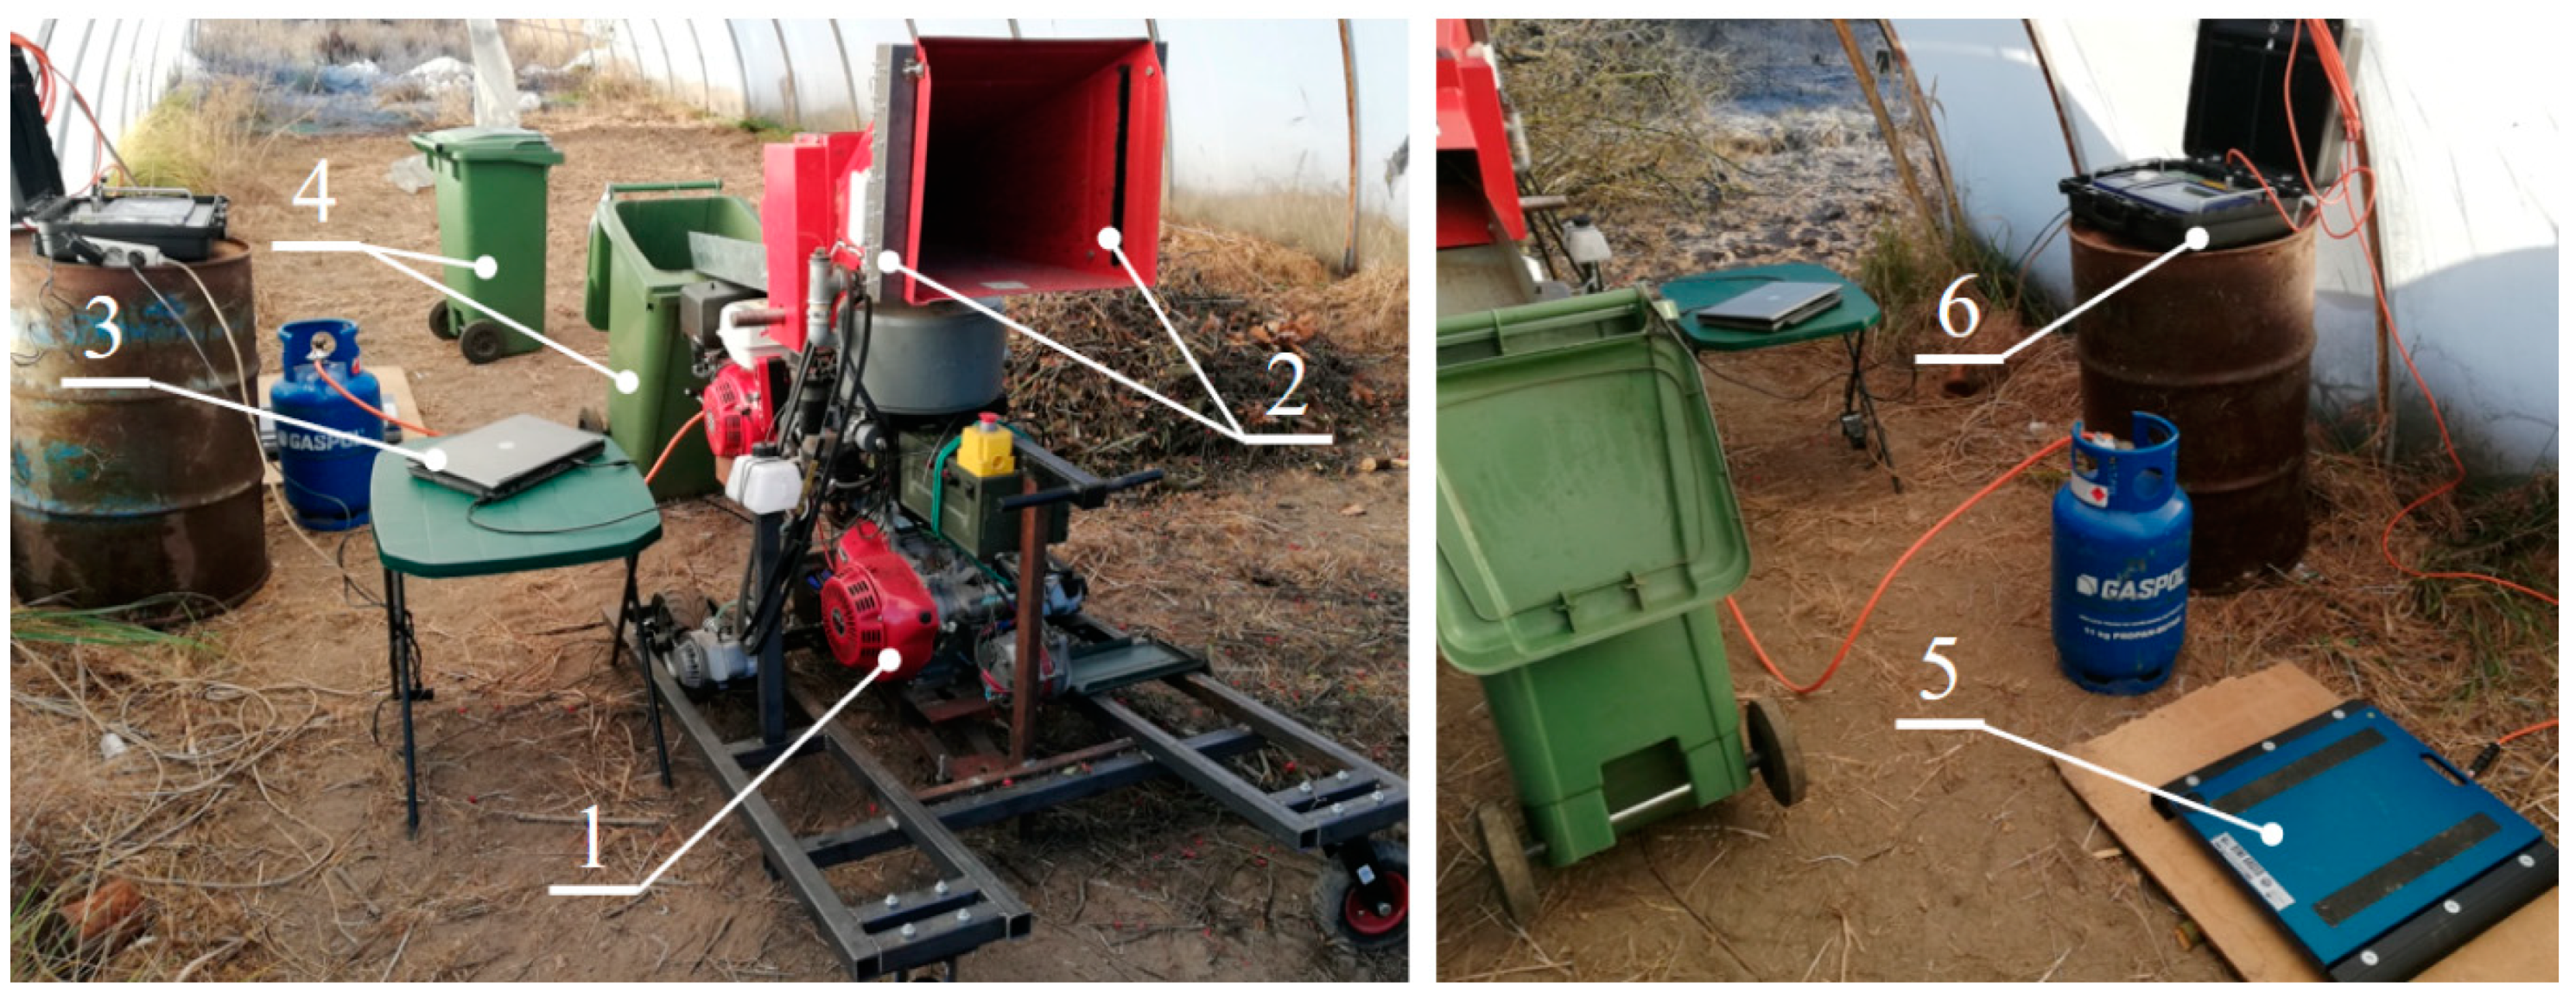
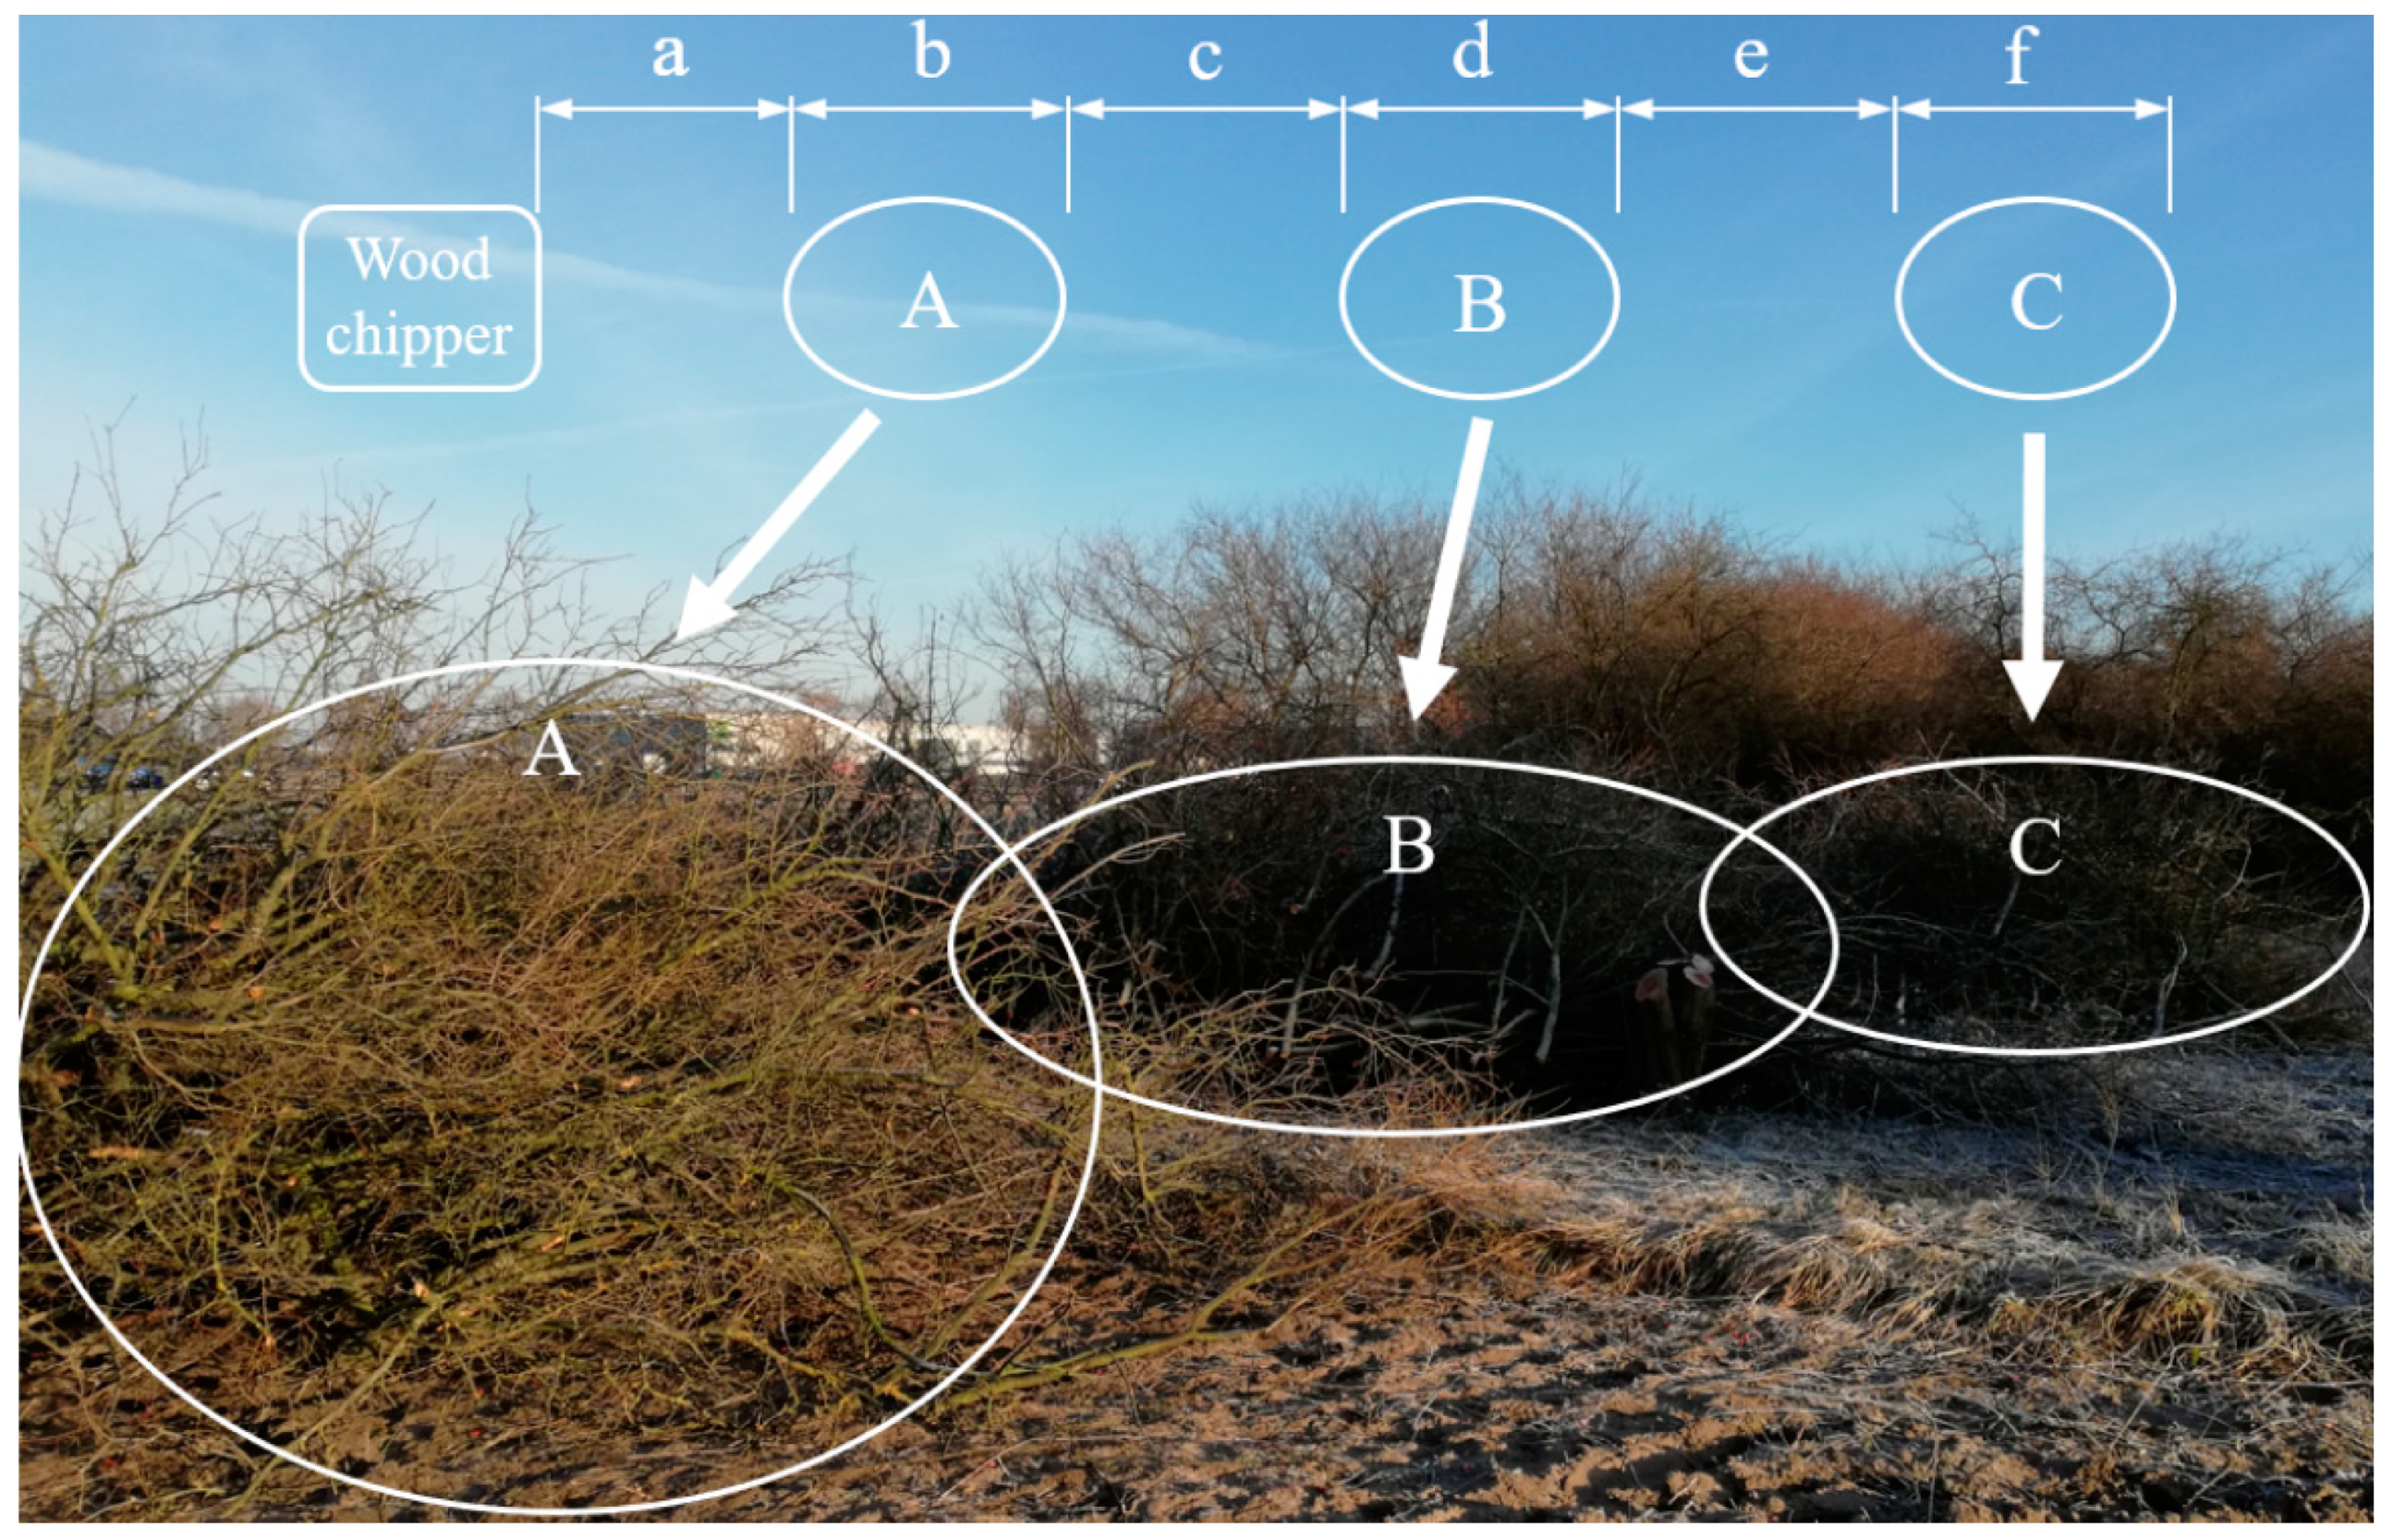
2.1. Raw Material and Subject of Testing

Testing was conducted with a Red Dragon RS-100 woodchipper driven by a German GX 390 OHV (9.5 kW) four-stroke spark-ignition engine (Figure 1). The cylindrical-type woodchipper is designed to shred branches with a diameter of up to 80 mm. “Tests were performed with the use of freshly cut oak branches (Quercus L. Sp. Pl. 994. 1753) with the diameter in the largest cross-section ca. 80 mm, a length of approximately 3 m and the moisture content ca. 25%. Branches were selected for similar dimensions to unify the chipper’s working conditions. This gave rise to the impact of other variable analysis. Branches with such parameters are characterized by a chipping time in a cylindrical chopper of about 4.5 s [32] and present a similar difficulty when pulling branches from the pile. Branches of similar diameter and length generated a similar machine load, which translated into a more uniform length of chipping time. These were branches that should be considered typical. They put a heavy load on the machine. Shorter and thinner branches will increase idle work time. The same will apply to branches that due to their shape will tangle or get stuck in the machine’s feed channel. The trees came from areas that were prepared for building plots. The specimens that underwent the tests were representative of hard wood species in accordance with Janka classification [42].” The Janka hardness test measures the resistance of a sample of wood to denting and wear. It measures the force required to embed an 11.28-millimetre (0.444 in) diameter steel ball halfway into a sample of wood [43,44]. Piles of branches were arranged at three distances from the chipper 3 m, 9 m and 15 m (Figure 2). The distance below 1 m is considered by operators to be uncomfortable because it makes it difficult to pull branches out of the pile. In addition, in this space there are branches subjected to chipping, which protrude from the chipper’s feed channel. The distance from 1 m to 3 m is the most common distance during actual works (distances below 3 m were tested by Warguła et al. In 2019 [32]). Topographic and urban conditions, as well as the exclusion of the possibility of work in selected areas by clients, may increase the distance that machine operators must travel with the branches.
Piles of branches are not created in some situations. Instead, operators bring the cut branches straight from under the tree to the chipper. In such cases, the distances may have values closer to 9 m and 15 m. Longer distances allow observing the impact of an additional operator, because at small distances branches are usually provided by one operator due to the dangerous movements of the branches in the feed channel. Branches were supplied to the chipper by one or two operators, depending on the test case. Operators had experience and were characterized by high commitment to maximize efficiency.

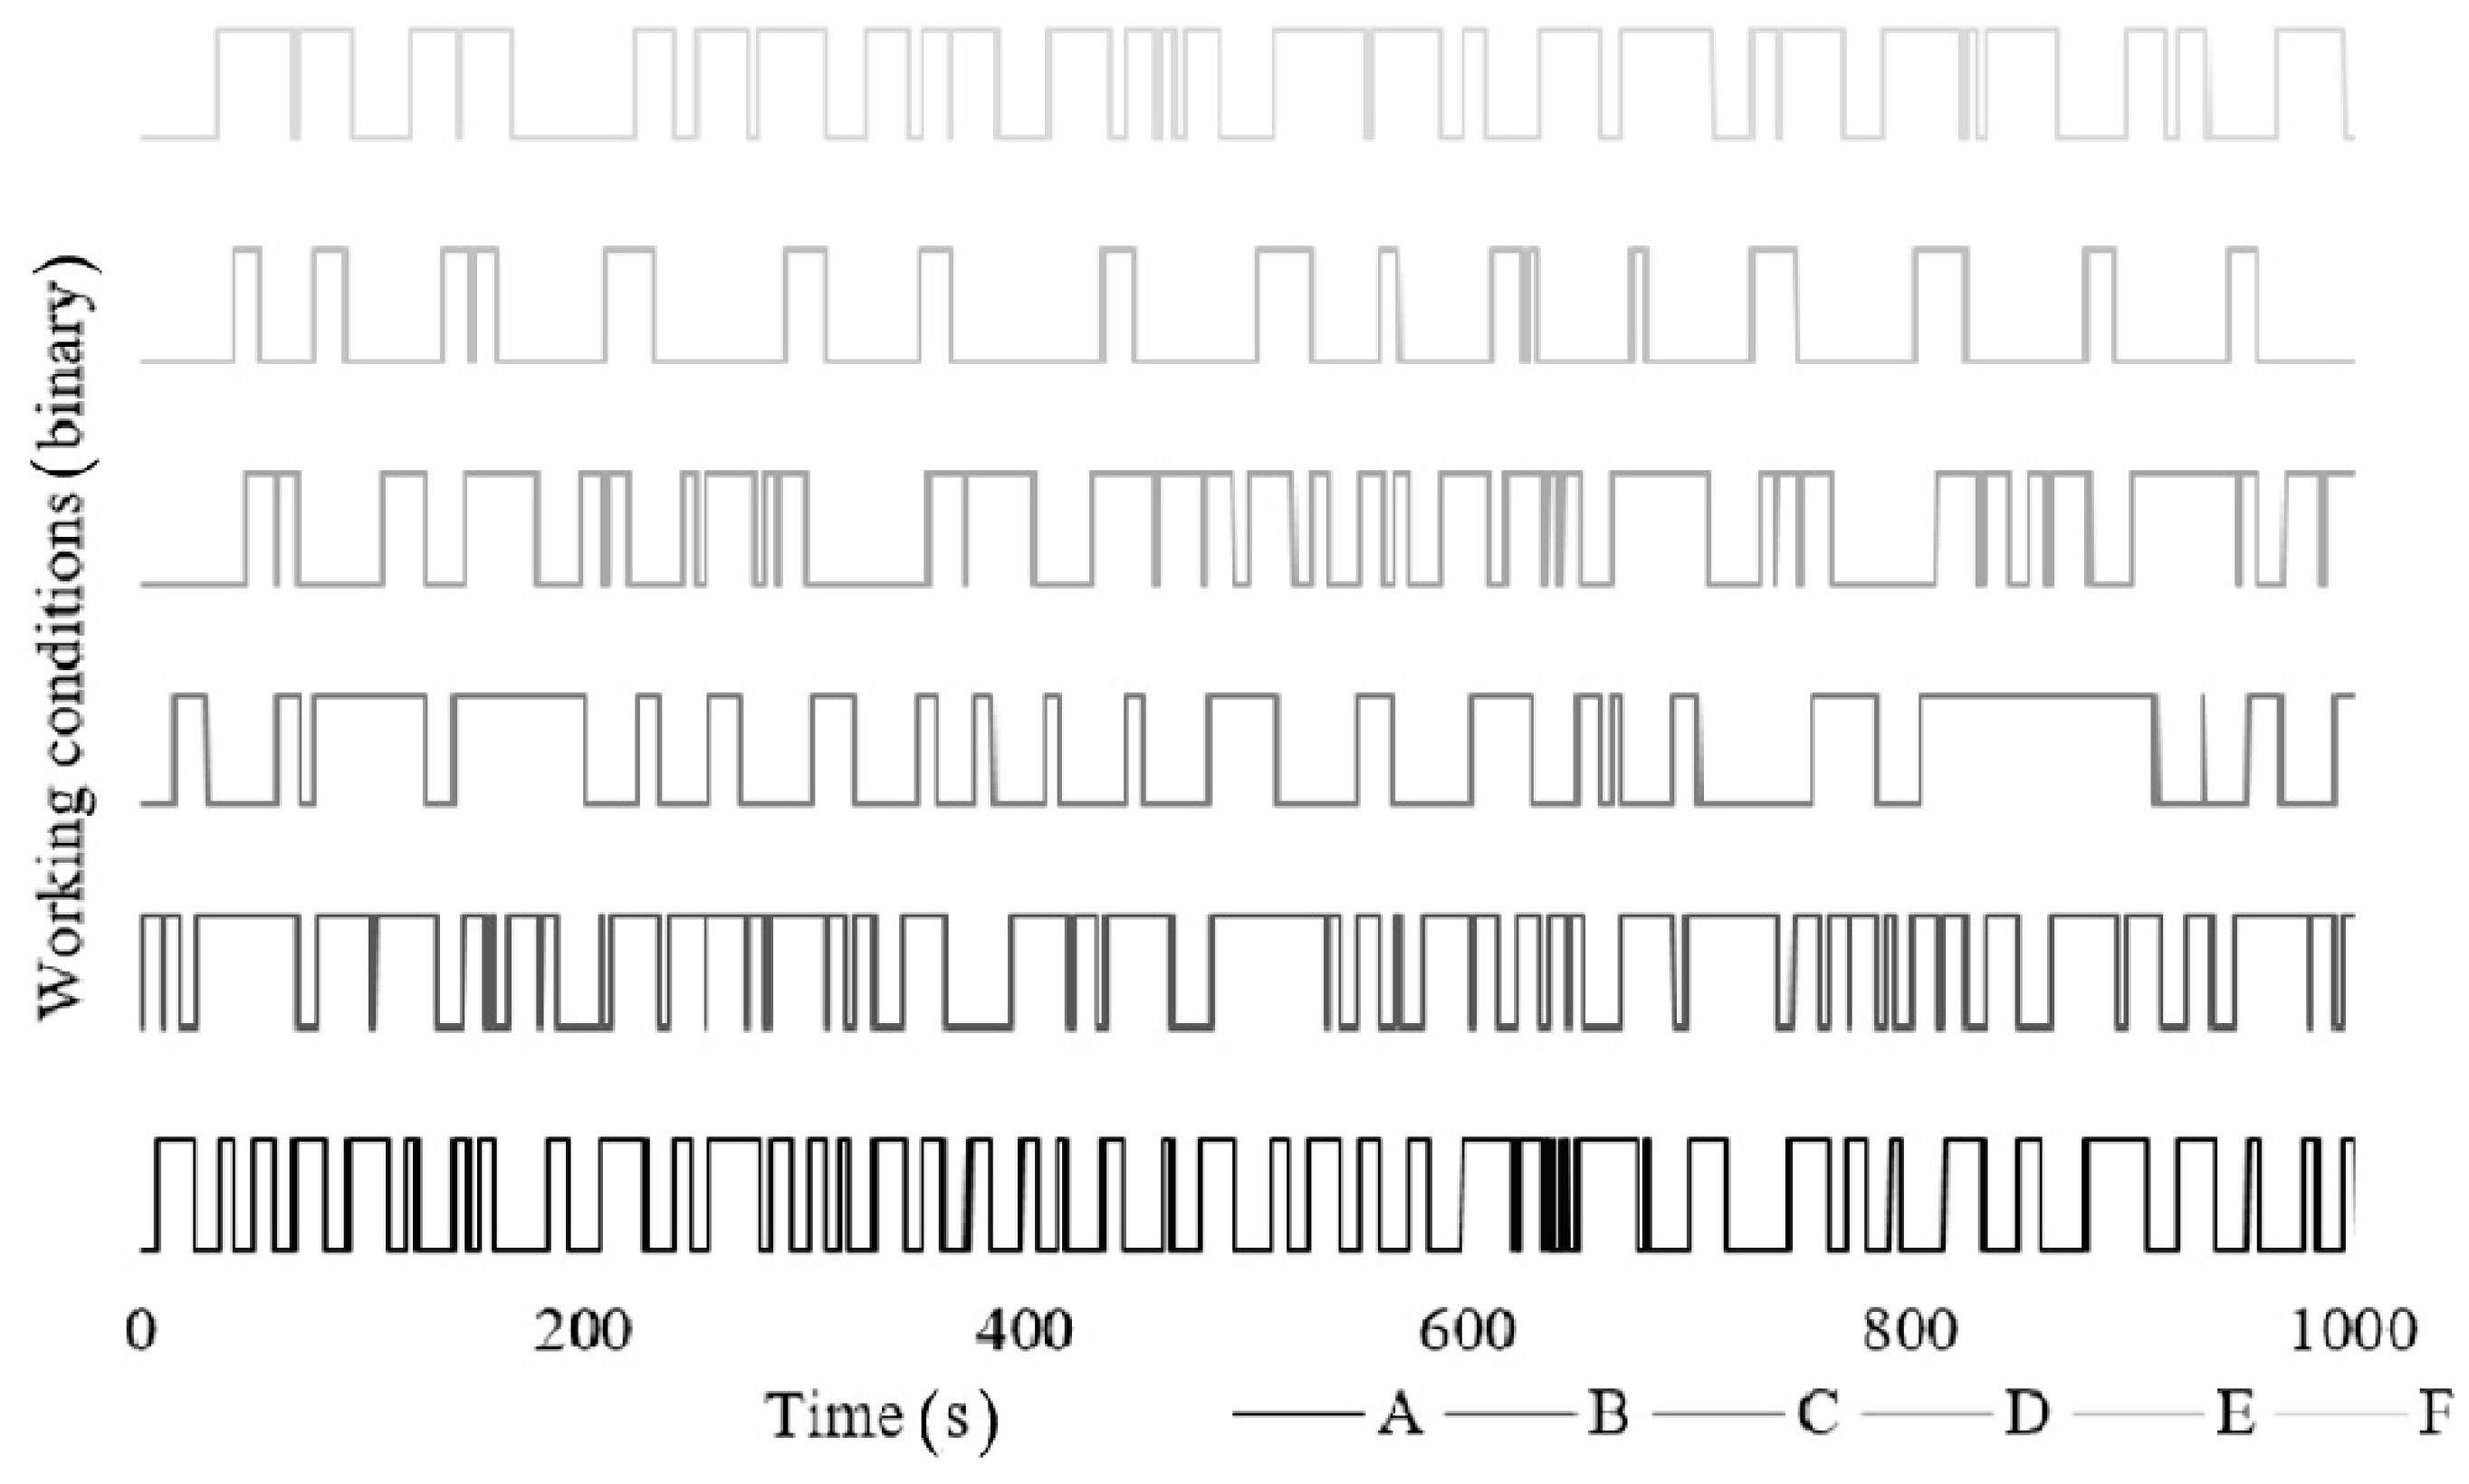
2.2. Operating Conditions of Chipper

Frequency of changes of operating conditions resulting from the noncontinuous delivery of branches was recorded by optical detection of branches in the feeding chute (an original photocell-based optical barrier 120452 SYSTEC). They were connected with a PC-class computer (Figure 1), which allowed acquisition of values measured. As a result, a signal trend (curve) was obtained from detectors (a binary signal defining a moment, when the detector was obscured) as a function of time during the entire experiment. Based on that signal, the percentage ratio of active to idle run time was determined during operation of the device.
It was assumed that the change in the operating condition is a signal change indicating the detection of branches in the feed channel. On this basis, the trailing edges of the signal were counted and then the frequency of idle work signal occurrence was determined. Identification of branches in the feed channel with an adaptive drive could signal a change in rotational speed of the machine from low (idle) to high. The high rotational speed allows work with maximum torque, which is necessary for chipping branches. Lack of branch detection in the feed channel may cause a reduction in rotational speed. This information is readable in a binary signal.
The total machine work time t m is the sum of the active work time t w and idle work time t j , which can be expressed as Equation (1):
t m = t w + t j
Idle work time ratio was determined in accordance with Equation (2):
Idle   work   time   ratio = t j t m · 100 %
Idle work time decrease ratio was determined according to Equation (3):
Idle   work   time   decrease   ratio = ( t A t B ) t A · 100 % ,
where t A is idle work time ratio for one operator service and t B is idle work time ratio for two operators service.
Operating conditions frequency changes were determined on the basis of binary signals. The number of signals trailing edges were counted during 1 min. This can be represented by Expression (4):
Operating   conditions   frequency   changes =   n 1 · 60 1   ( min 1 ) ,
where n 1 is number of signals trailing edges.
Operating conditions frequency changes ratio during two operators service was determined according to Equation (5):
Operating   conditions   frequency   changes   ratio   during   two   operators = ( f A f B ) f A   · 100 % ,
where f A and f B are operating conditions frequency changes for one and two operators service respectively.
The theoretical time needed to deliver branches to the chipper without additional complications depends on the time needed to travel the distance between the branch pile and the chipper in both directions, the time necessary to lift and remove the branch from the pile, and the time spent on inserting the branch into the feed channel. The described relationship can be presented in the form of Equation (6):
t s = t r 1 + t r 2 + t l + t c   ( s ) .
Individual markings in Equation (6) are as follows: t s —time to deliver branches to the woodchipper, t r 1 —time to travel from the chipper to the pile of branches, t r 2 —time to travel from the pile of branches to the chipper, t l —time to lift and remove the branches from the pile, t c —time to insert the branches into the feed channel. If the time of branch delivery to the chipper t s greater than the time of chipping t c p then it is reasonable to use adaptive systems, which can be represented by the Inequality (7):
t c p < t s
Literature research shows that the average time to process 3 m long branches (i.e., similar in dimensions to those used in the study) is about 4.5 s [32]. The average human walking speed is 1.34 m s−1 [45]. The remaining times are estimated by the authors on the basis of their own experience as values 1 s for supplying the branch to the chipper and 3 s for lifting the branch (assuming that it is not tangled). The characteristics of the theoretical time of branch delivery are shown in Figure 3. It refers to an almost ideal situation. The presented time values may be longer if the branches are tangled at the pile or if they become stuck in the chipper’s feed channel. Furthermore, the assumed time values resulting from the operator’s movement speed may be increased. This value does not take into account changes in speed that may result from terrain type or its unevenness. Thus, the assumed time values should be treated as one of the lowest possible in reality—they are a kind of reference point. Extending these times will further increase the efficiency of using adaptive systems.

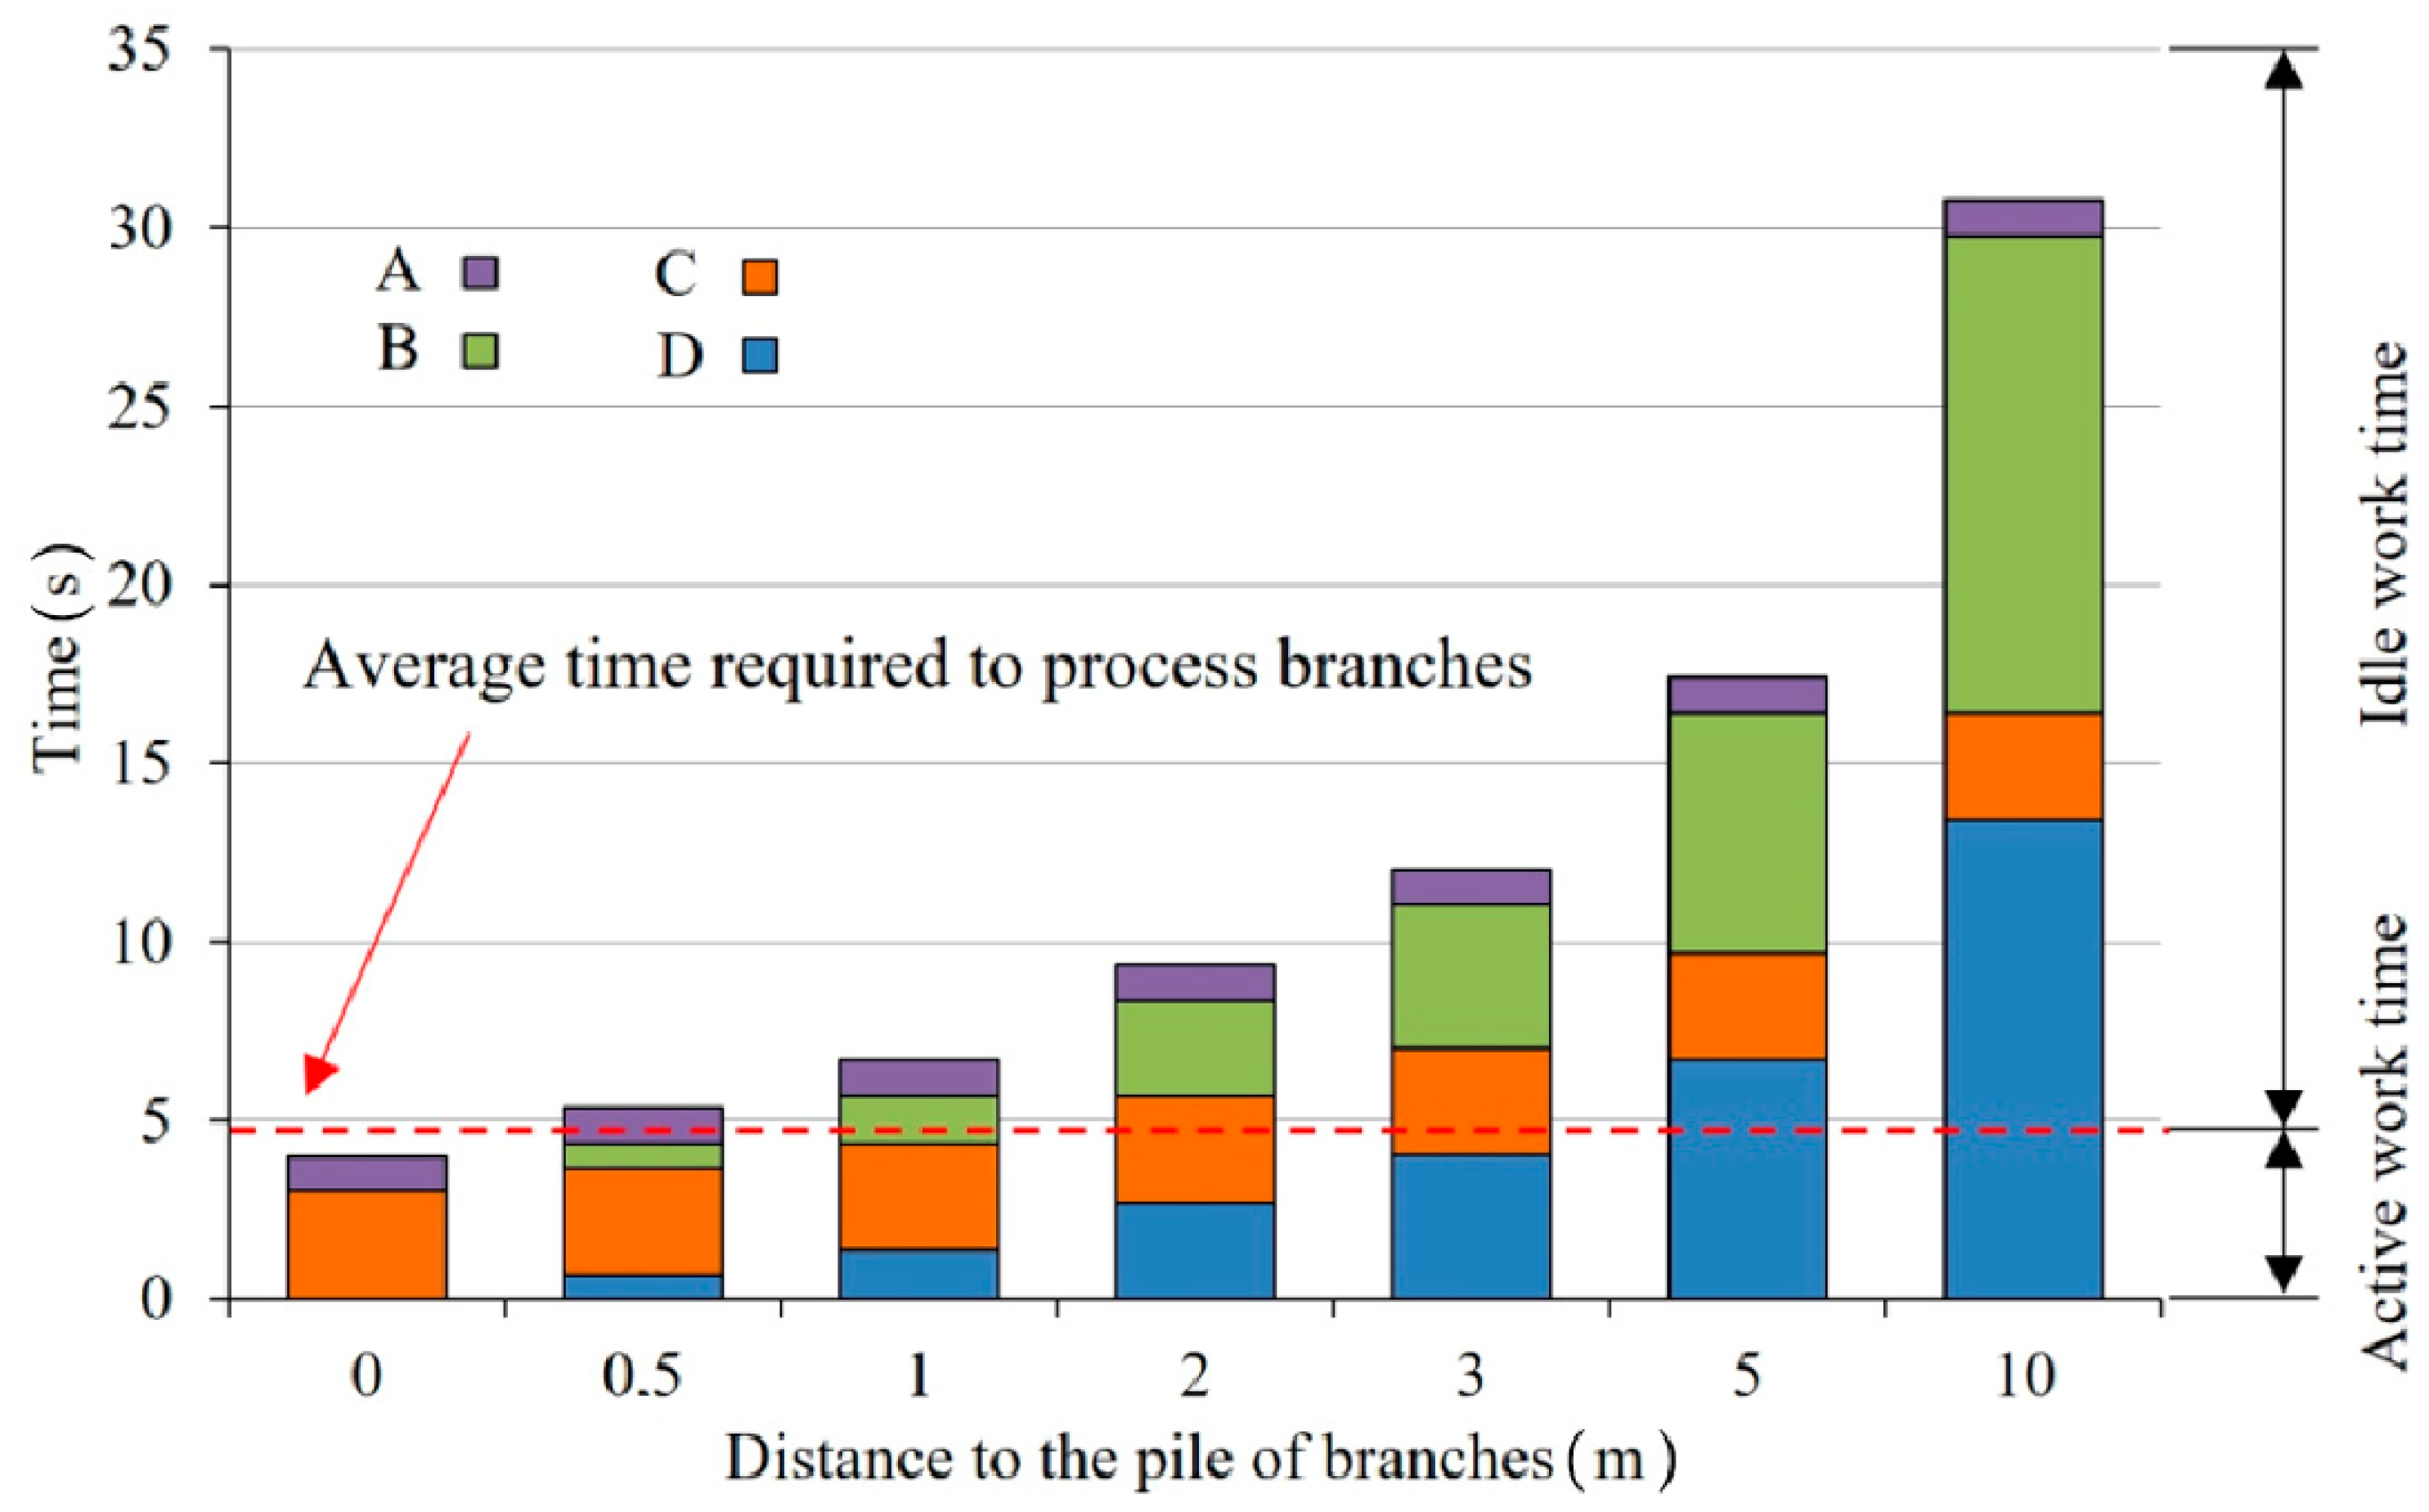
2.3. Productivity of Chipper Operation

During the experiment, the production rate of chips was measured with the use of two methods. The first method was based on measurement of time t needed to fill a container with volume V = 120 L, while the other method on the weight measurement m of full containers. The volume was measured by filling a container made in accordance with the European standard PN-EN 840-1 (Movable waste containers) where the first part of this standard presents dimensions and construction. Two containers of the same design were used in the study. The filling of the container was controlled by one of the researchers. He arranged the chips evenly with the outer edge of the container so that they do not form a cone. After filling the container, he stopped time measurement and blocked the chippers output channel, giving a signal to replace the container. After replacement, he opened the chipper’s output channel. The moment of stopping time measurement was the reference point for the next measurement, for which chips were already gathering in the output channel. The filled container was then weighed. Time was measured manually with a stopwatch. The weight was measured using a portable weighing scale (Radlastplattform up to 1500 kg meeting requirements of ISO 9001). In result, after calculations were made, the results of volumetric Q and mass Qm productivity of the cylindrical chipper tested were obtained. Tests were repeated 10 times. A statistical analysis of all measurements was performed with a significance level established at α = 0.05. An Anderson–Darling test was used to determine normality distribution of data measured. Then, a two-factor analysis of variance (ANOVA) was applied to determine the impact of a change of the operator and the distance between the pile of branches and the chipper on dependent variables, which in the first case was the time to fill the container, and in the second case the weight of 120 l full container.
Volumetric Q and mass productivity Q m of the chipping process during testing was determined with the use of the following Relations (8) and (9):
Q = V t   [ m 3 · h 1 ] ,
Q m = m t   [ kg · h 1 ] .
Increase ratio of mass flow rate was calculated as follows (10):
Increase   ratio = Q 2 Q 1 Q 2 · 100 % ,
where: I R is increase ratio, Q 2 is mass flow rate for two operators and Q 1 is mass flow rate for one operator. Increase ratio of volumetric flow rate were calculated in the same way (ratio of values before and after changing the number of operators).

3. Results

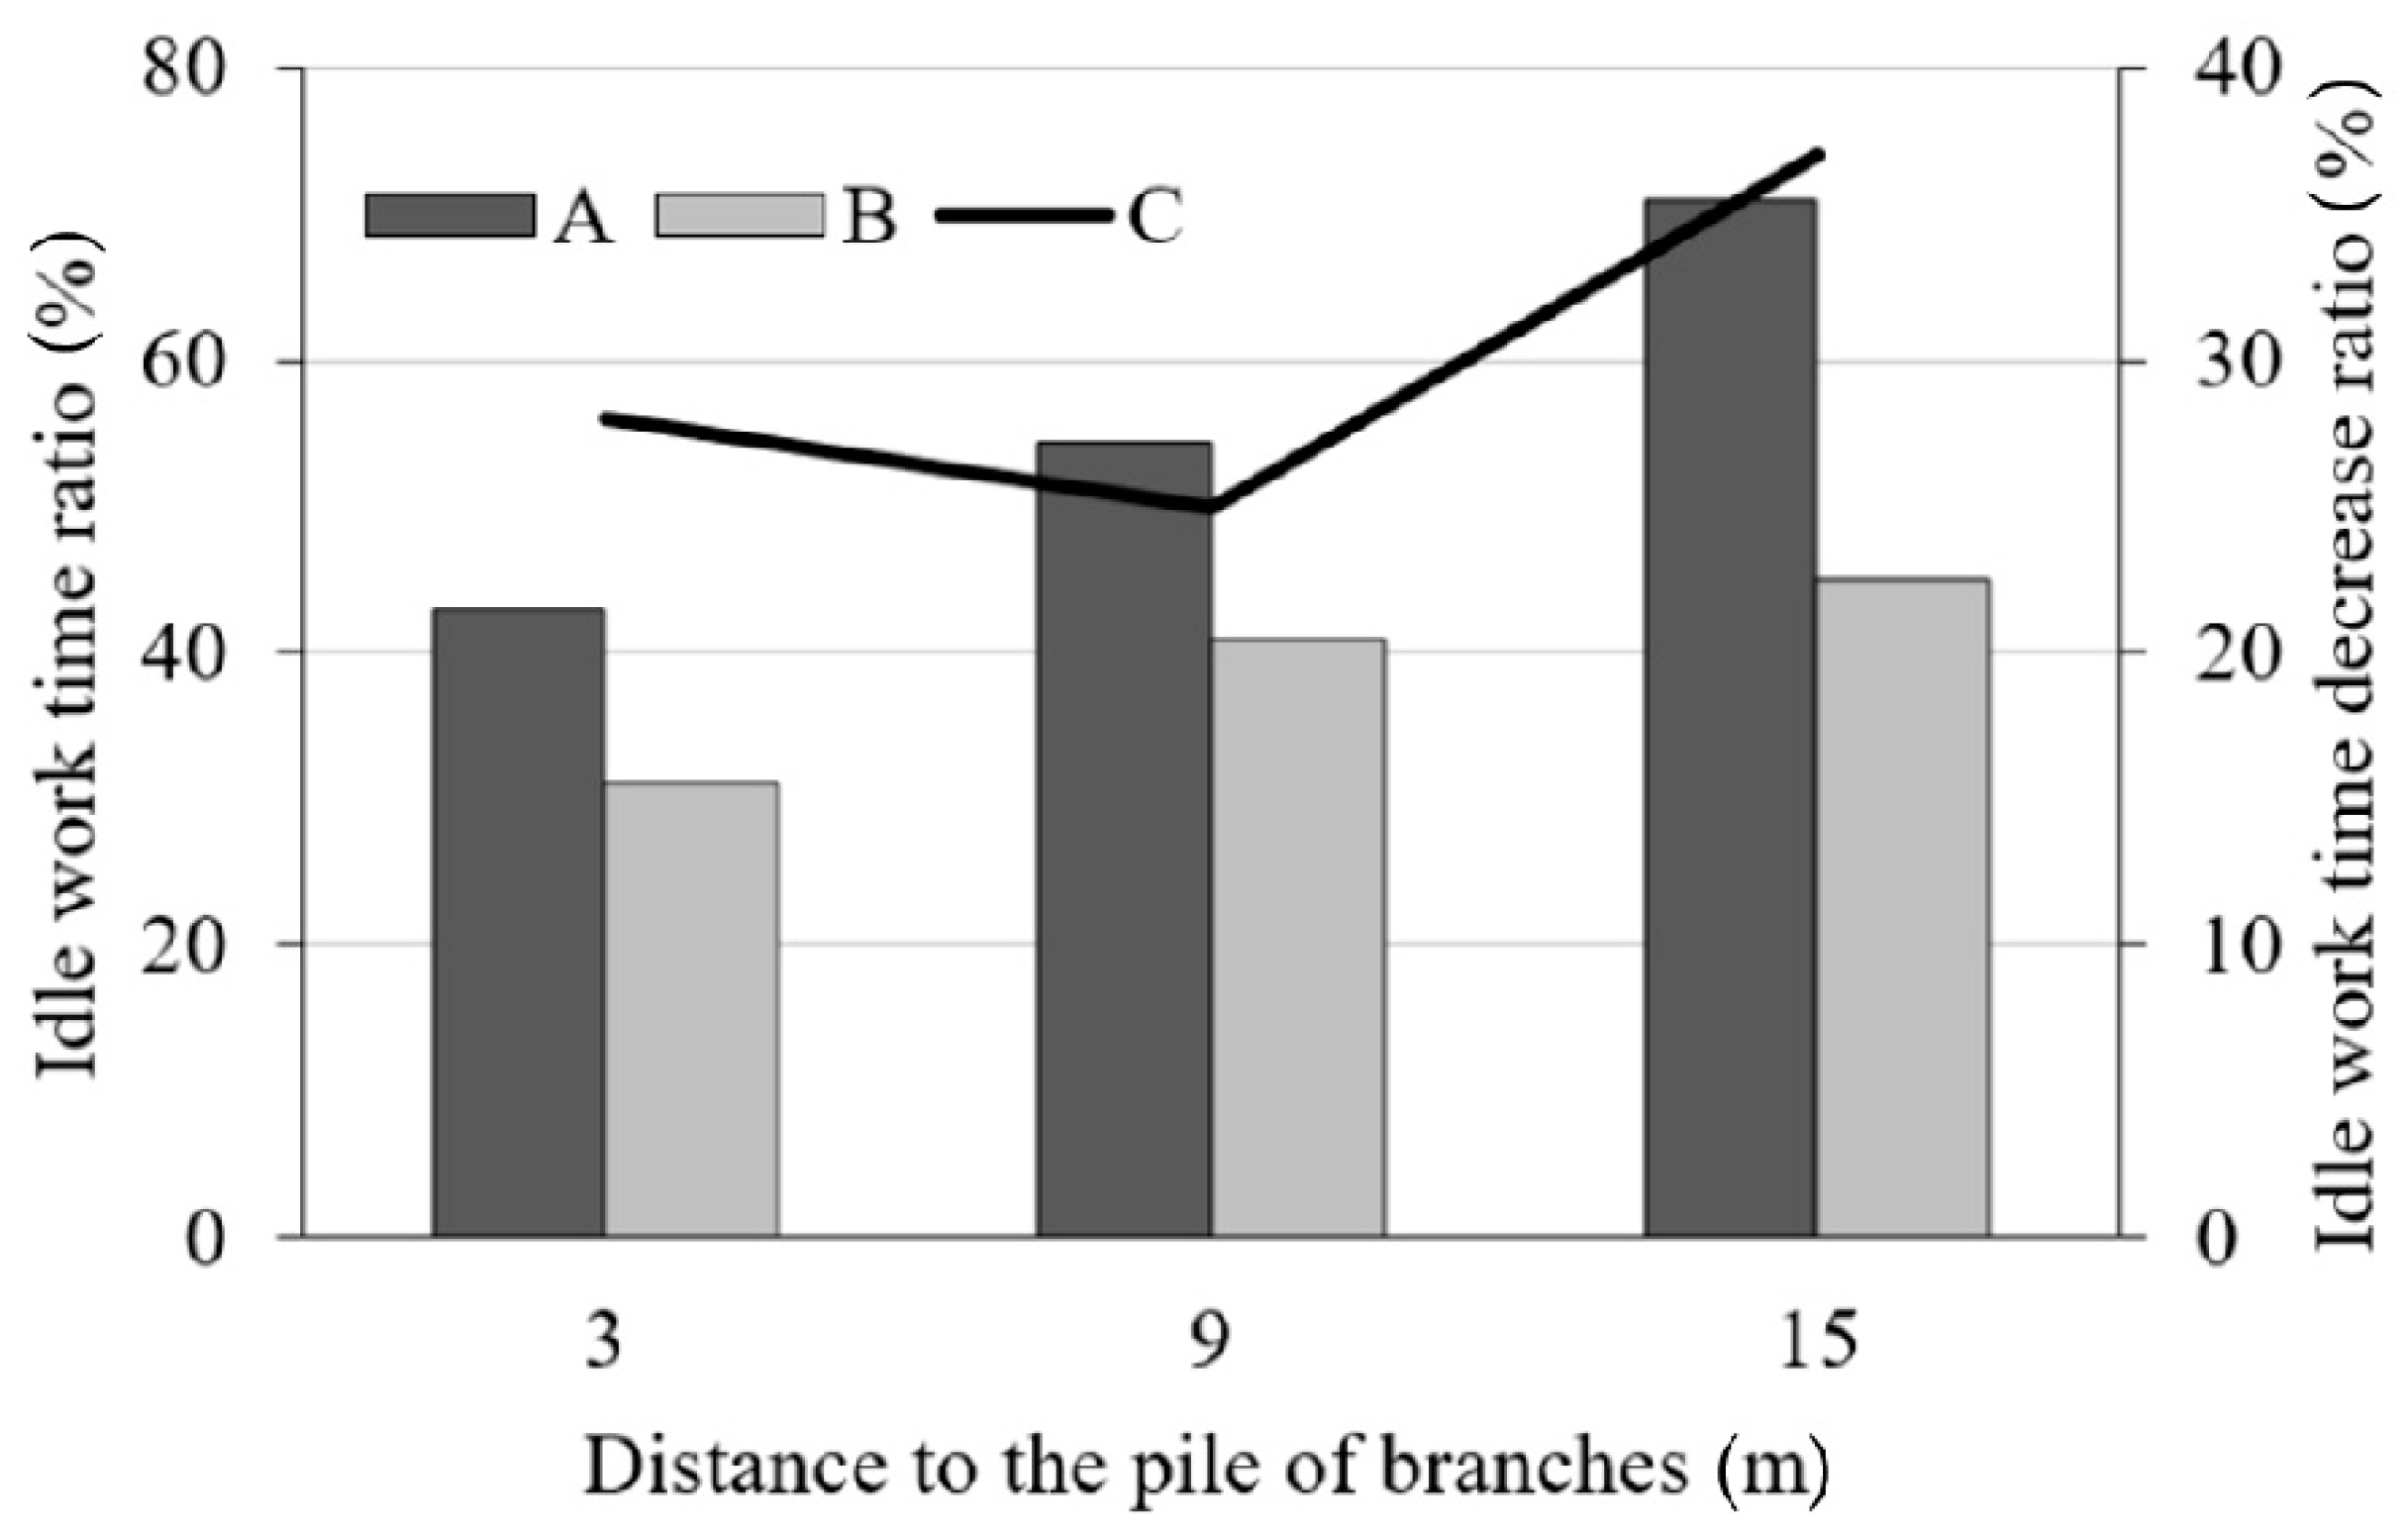
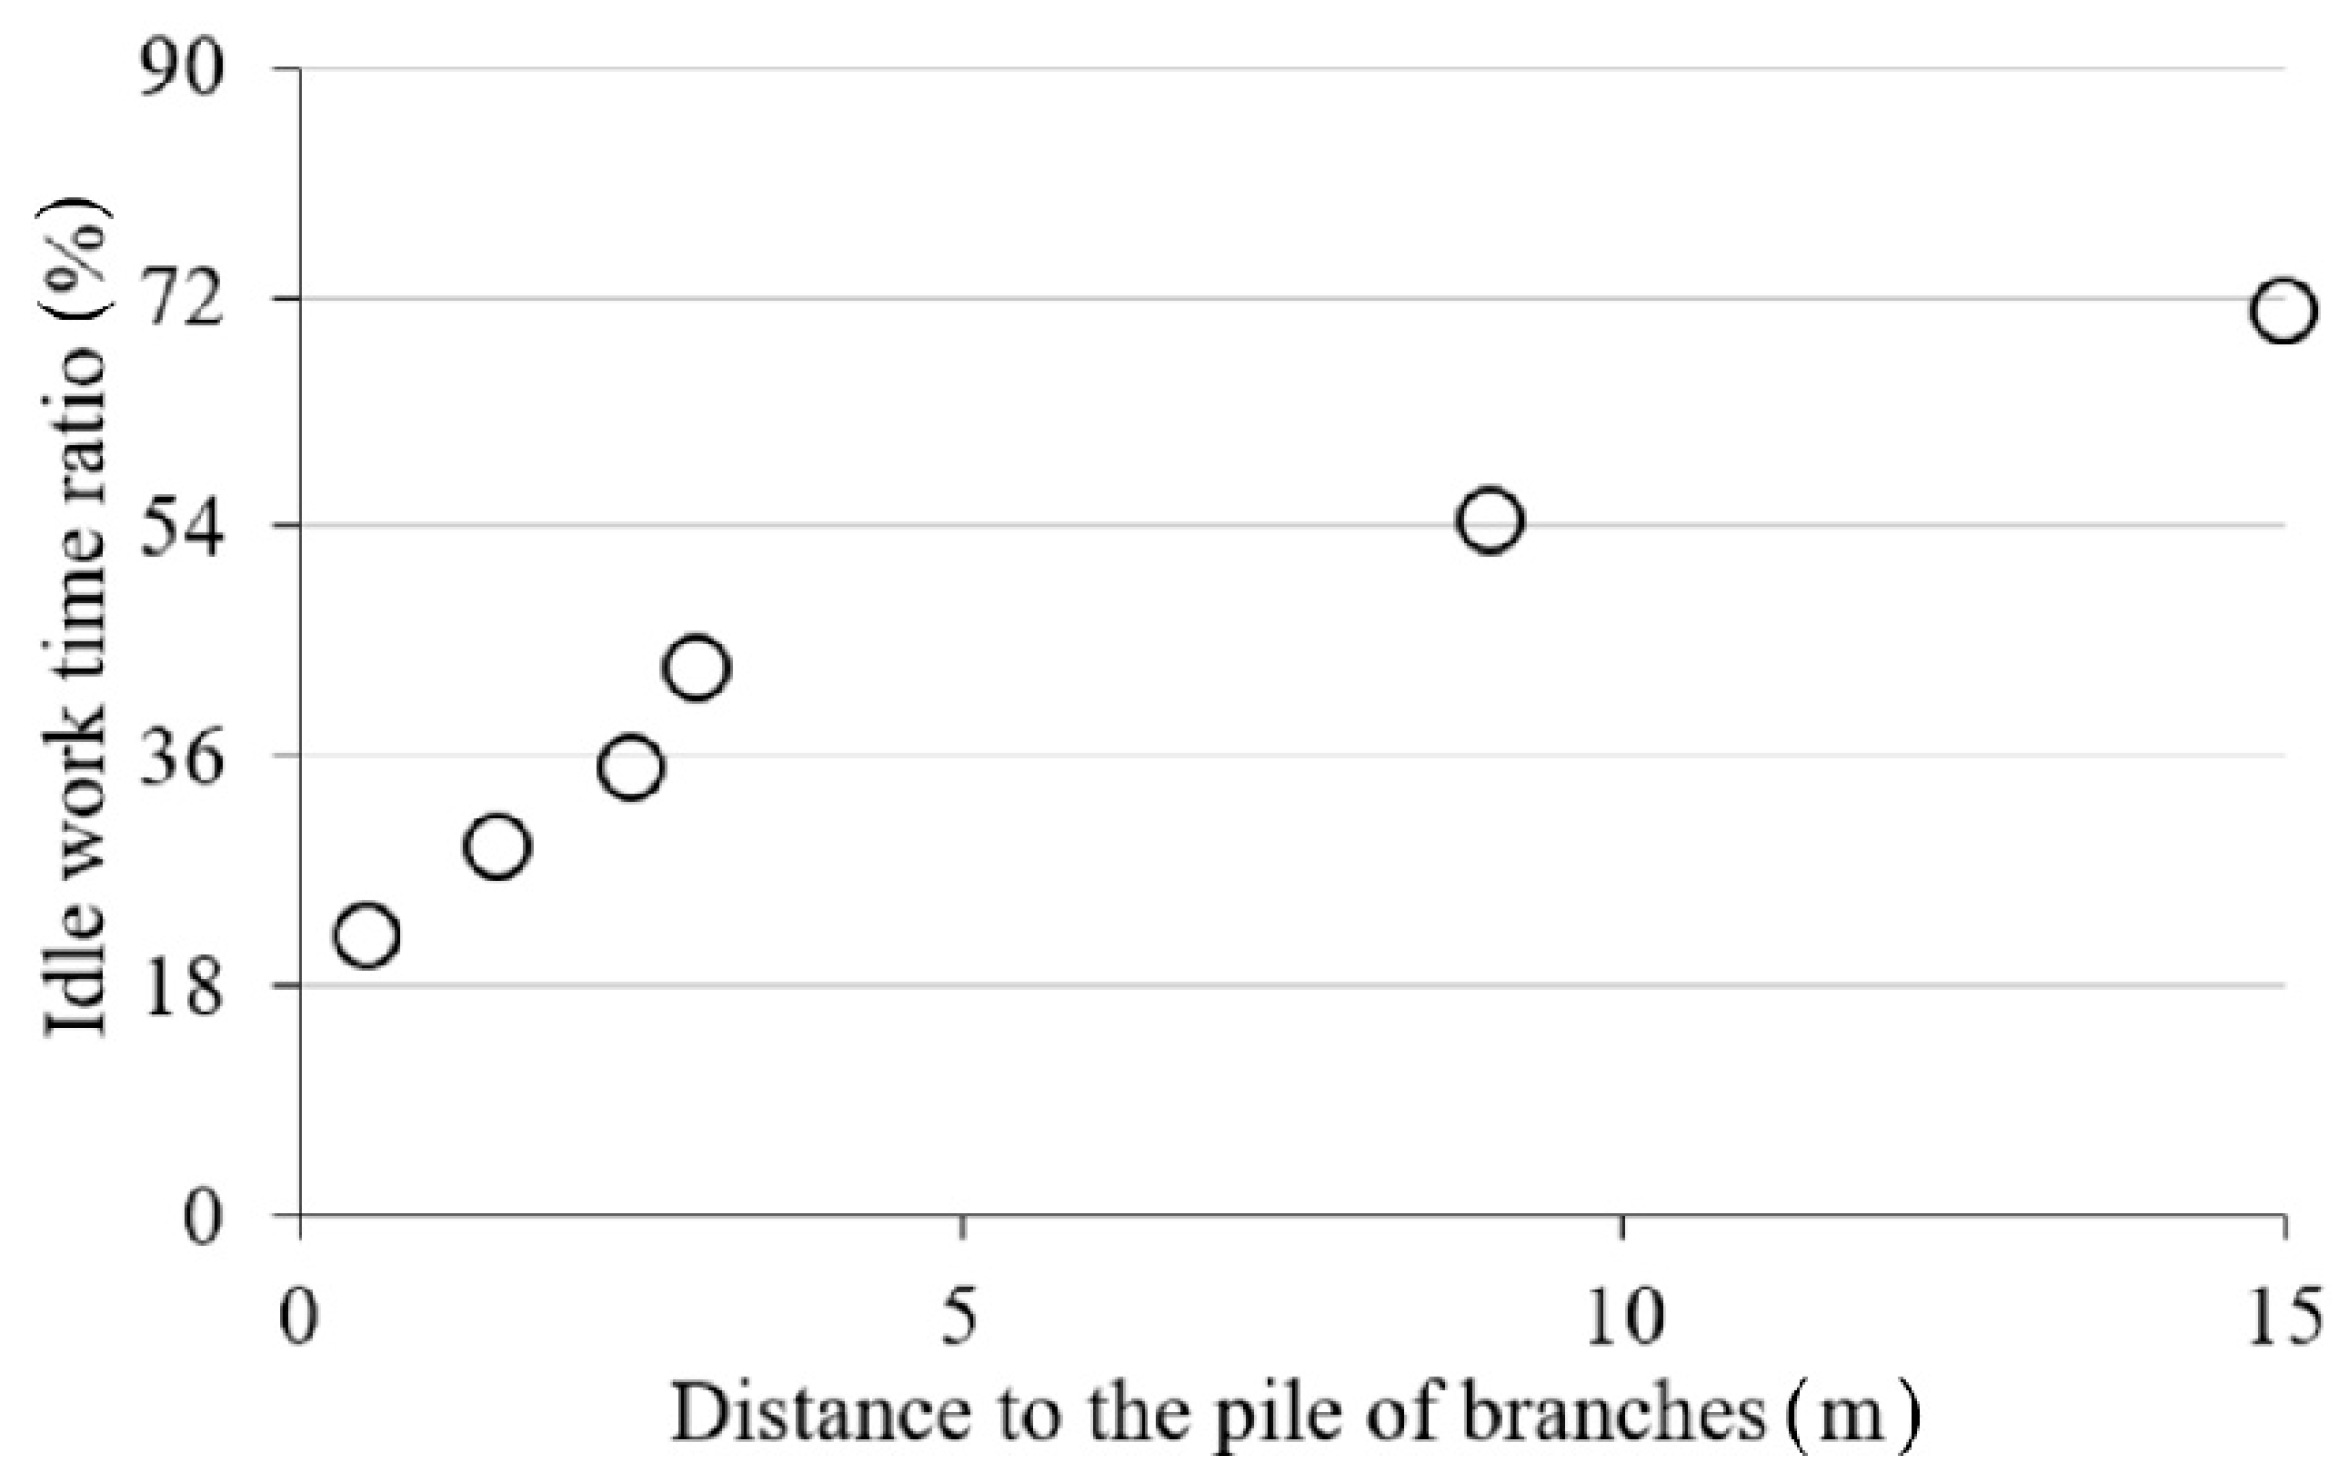
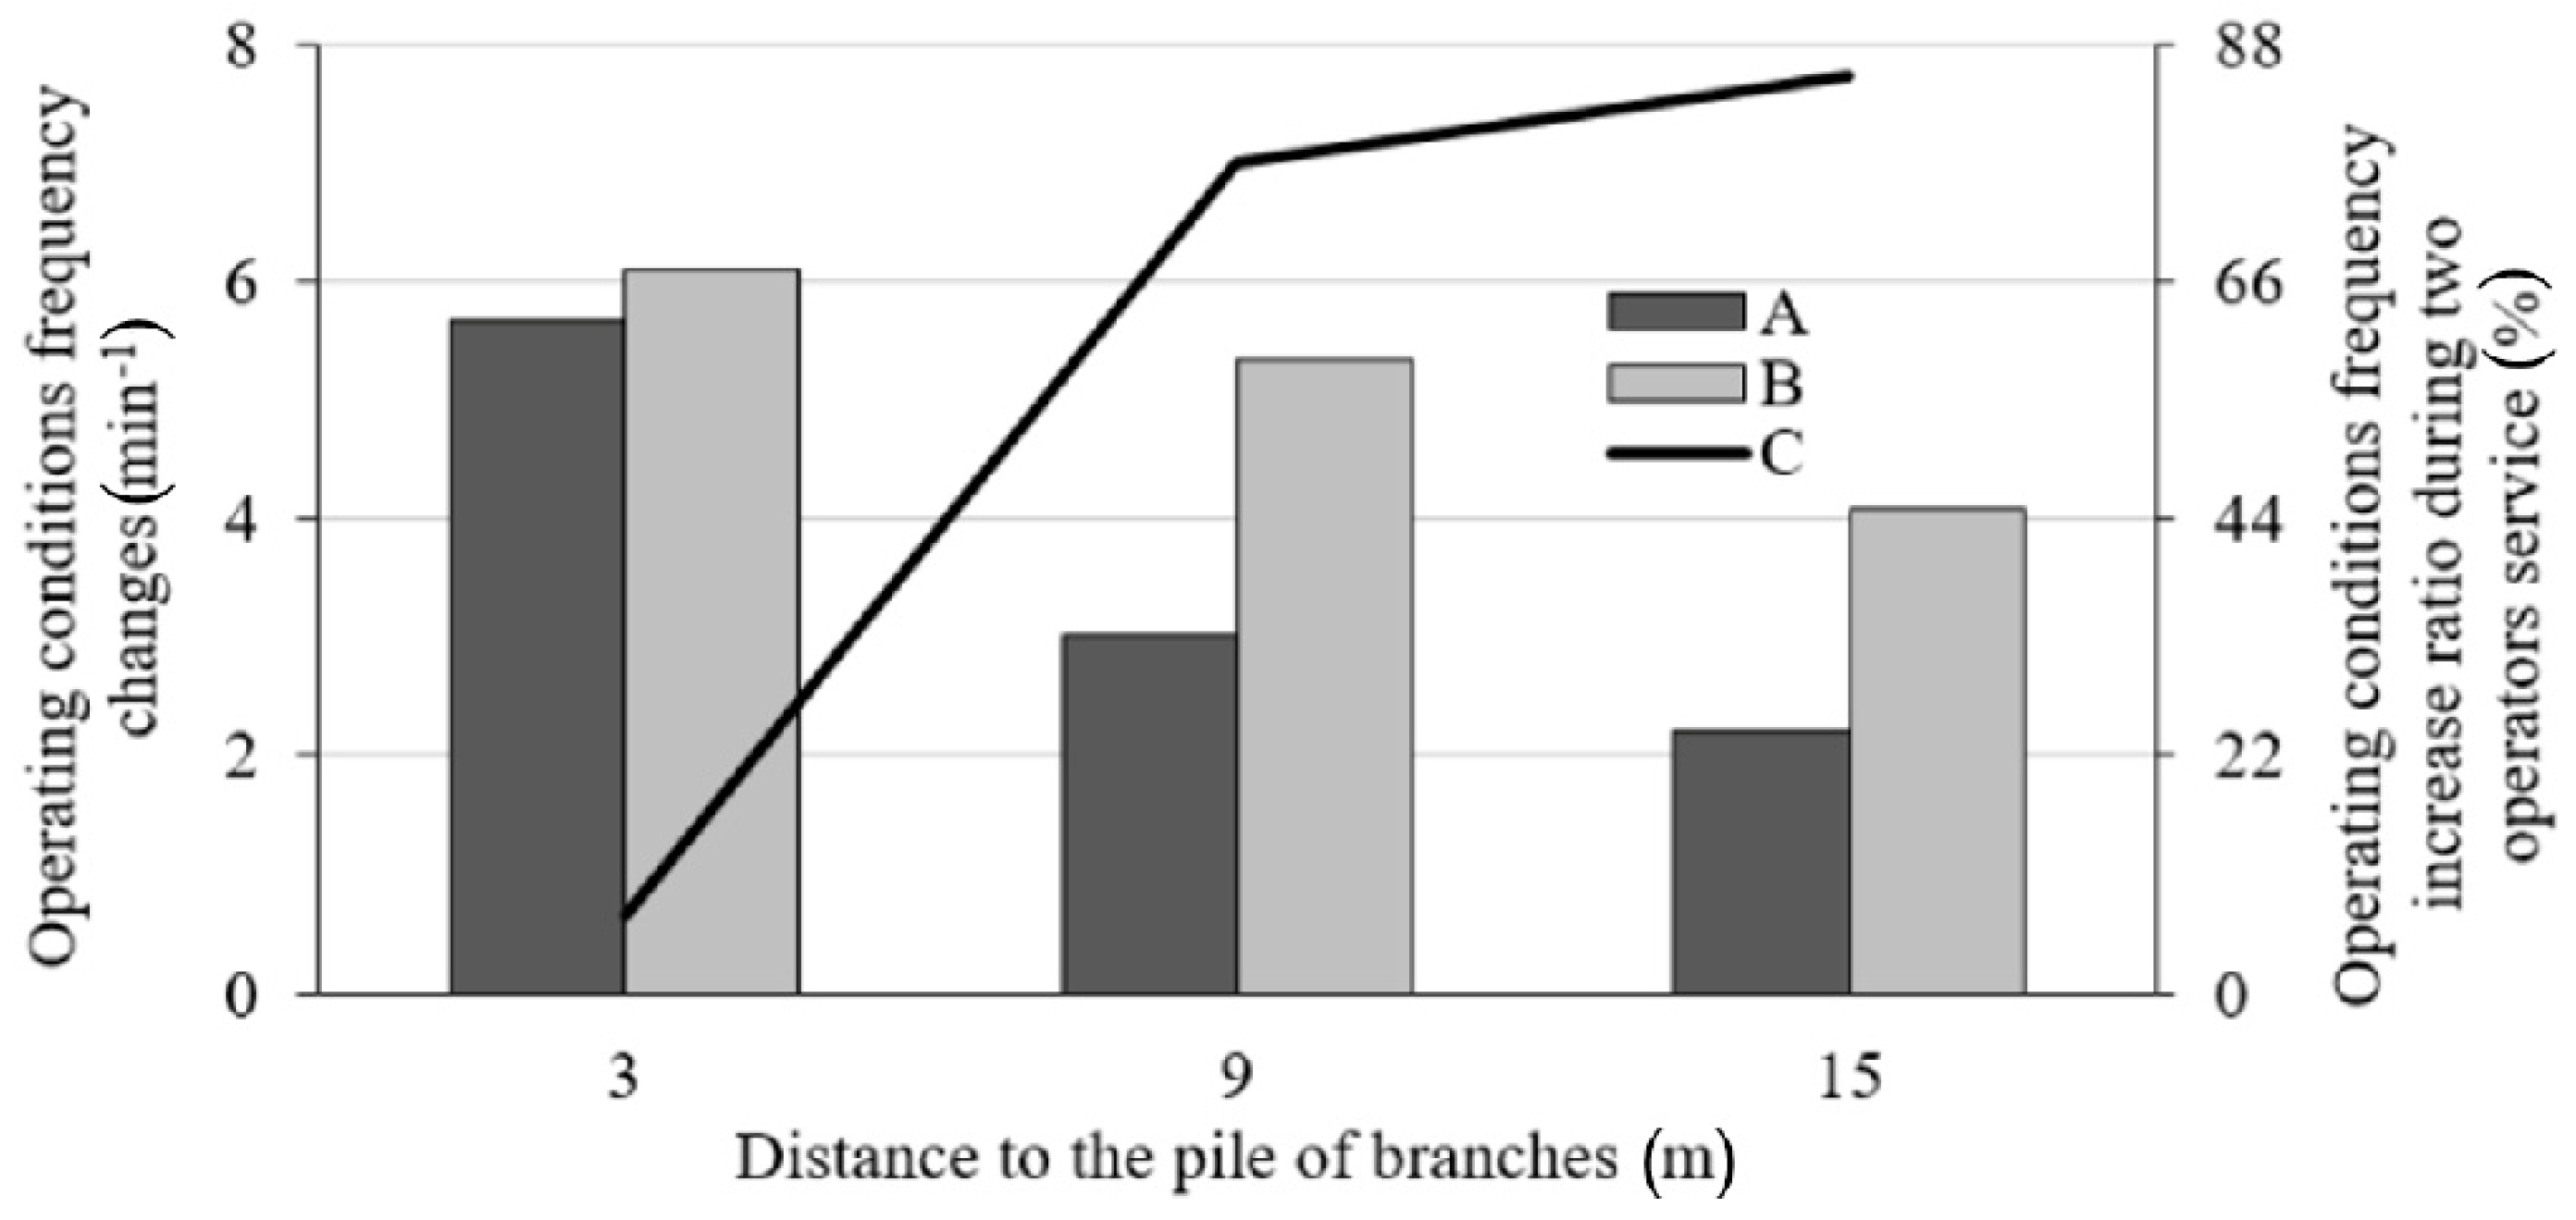
3.1. Change in Frequency of Operating Conditions

Test results of frequency in changes of operating conditions, as well as the percentage ratio of active and idle operation in selected conditions of use, were determined based on signals from the detection system in the feeding chute. Examples of signal changes curves depending on operating conditions are shown in Figure 4. Test results of idle run time percentage and frequency of operating condition changes are shown in Table 1. The change of the idle run percentage in the total operation time of the cylindrical chipper vs. the number of operators and branch pile distance from the chipper is presented in Figure 5. Characteristics of the impact of branch pile distance from the chipper on the idle run time ratio during chipping are presented in Figure 6. Frequency of operating condition changes of the cylindrical chipper vs. the number of operators and branch pile distance from the chipper is presented in Figure 7.

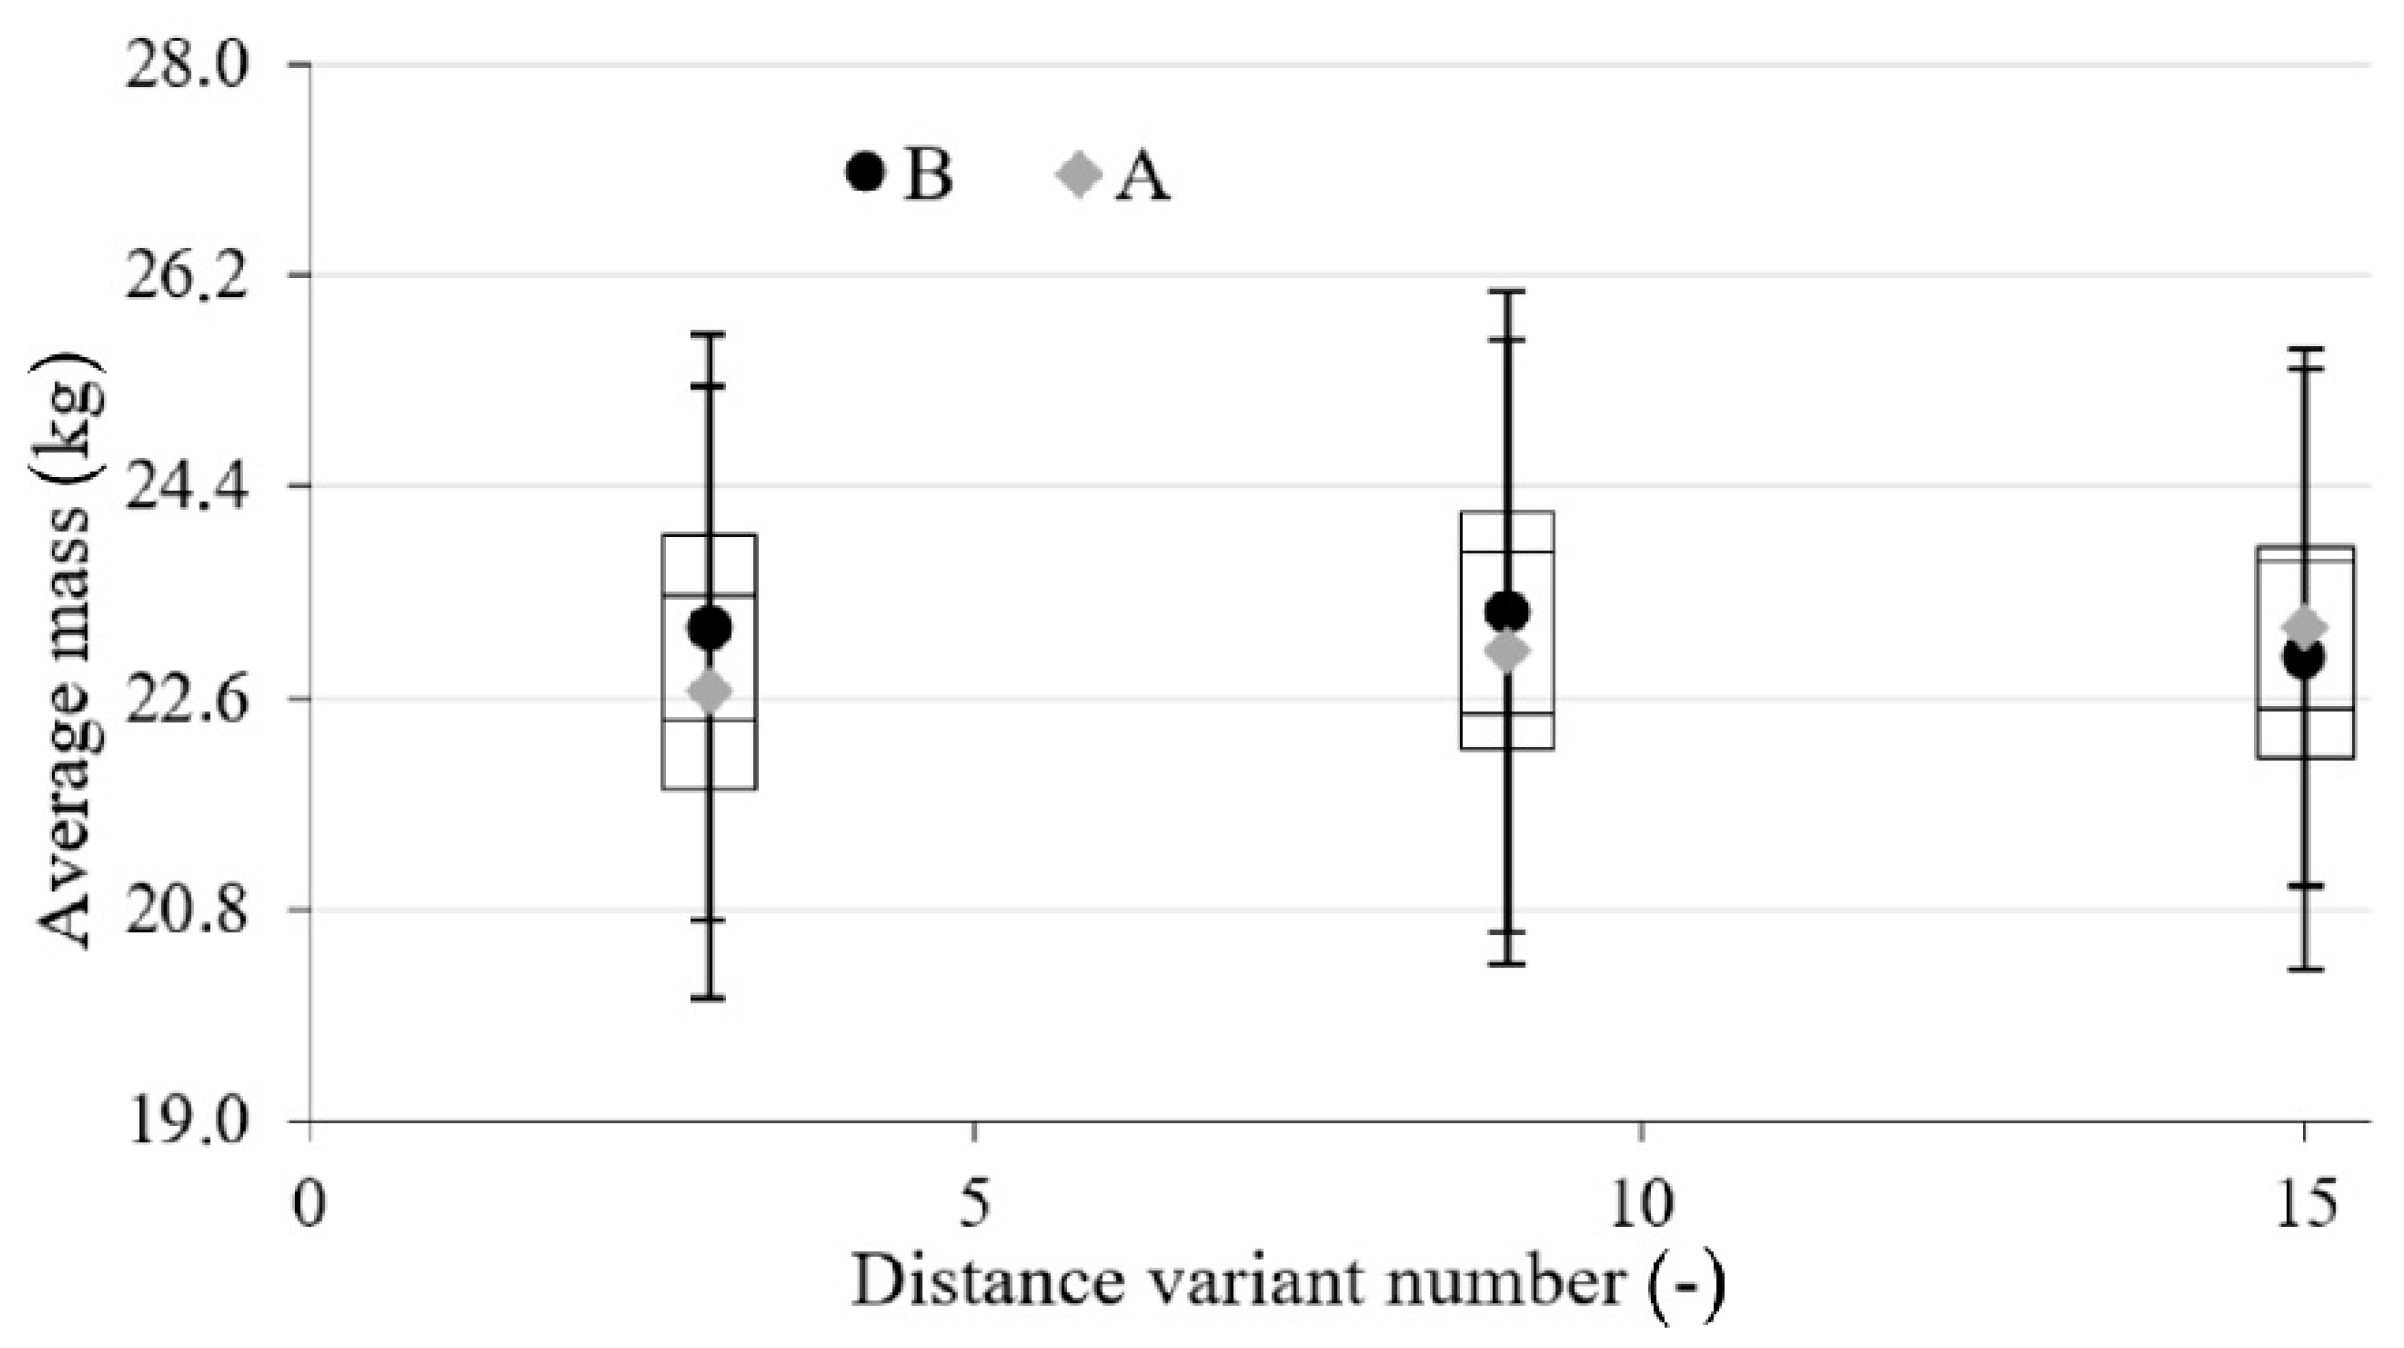
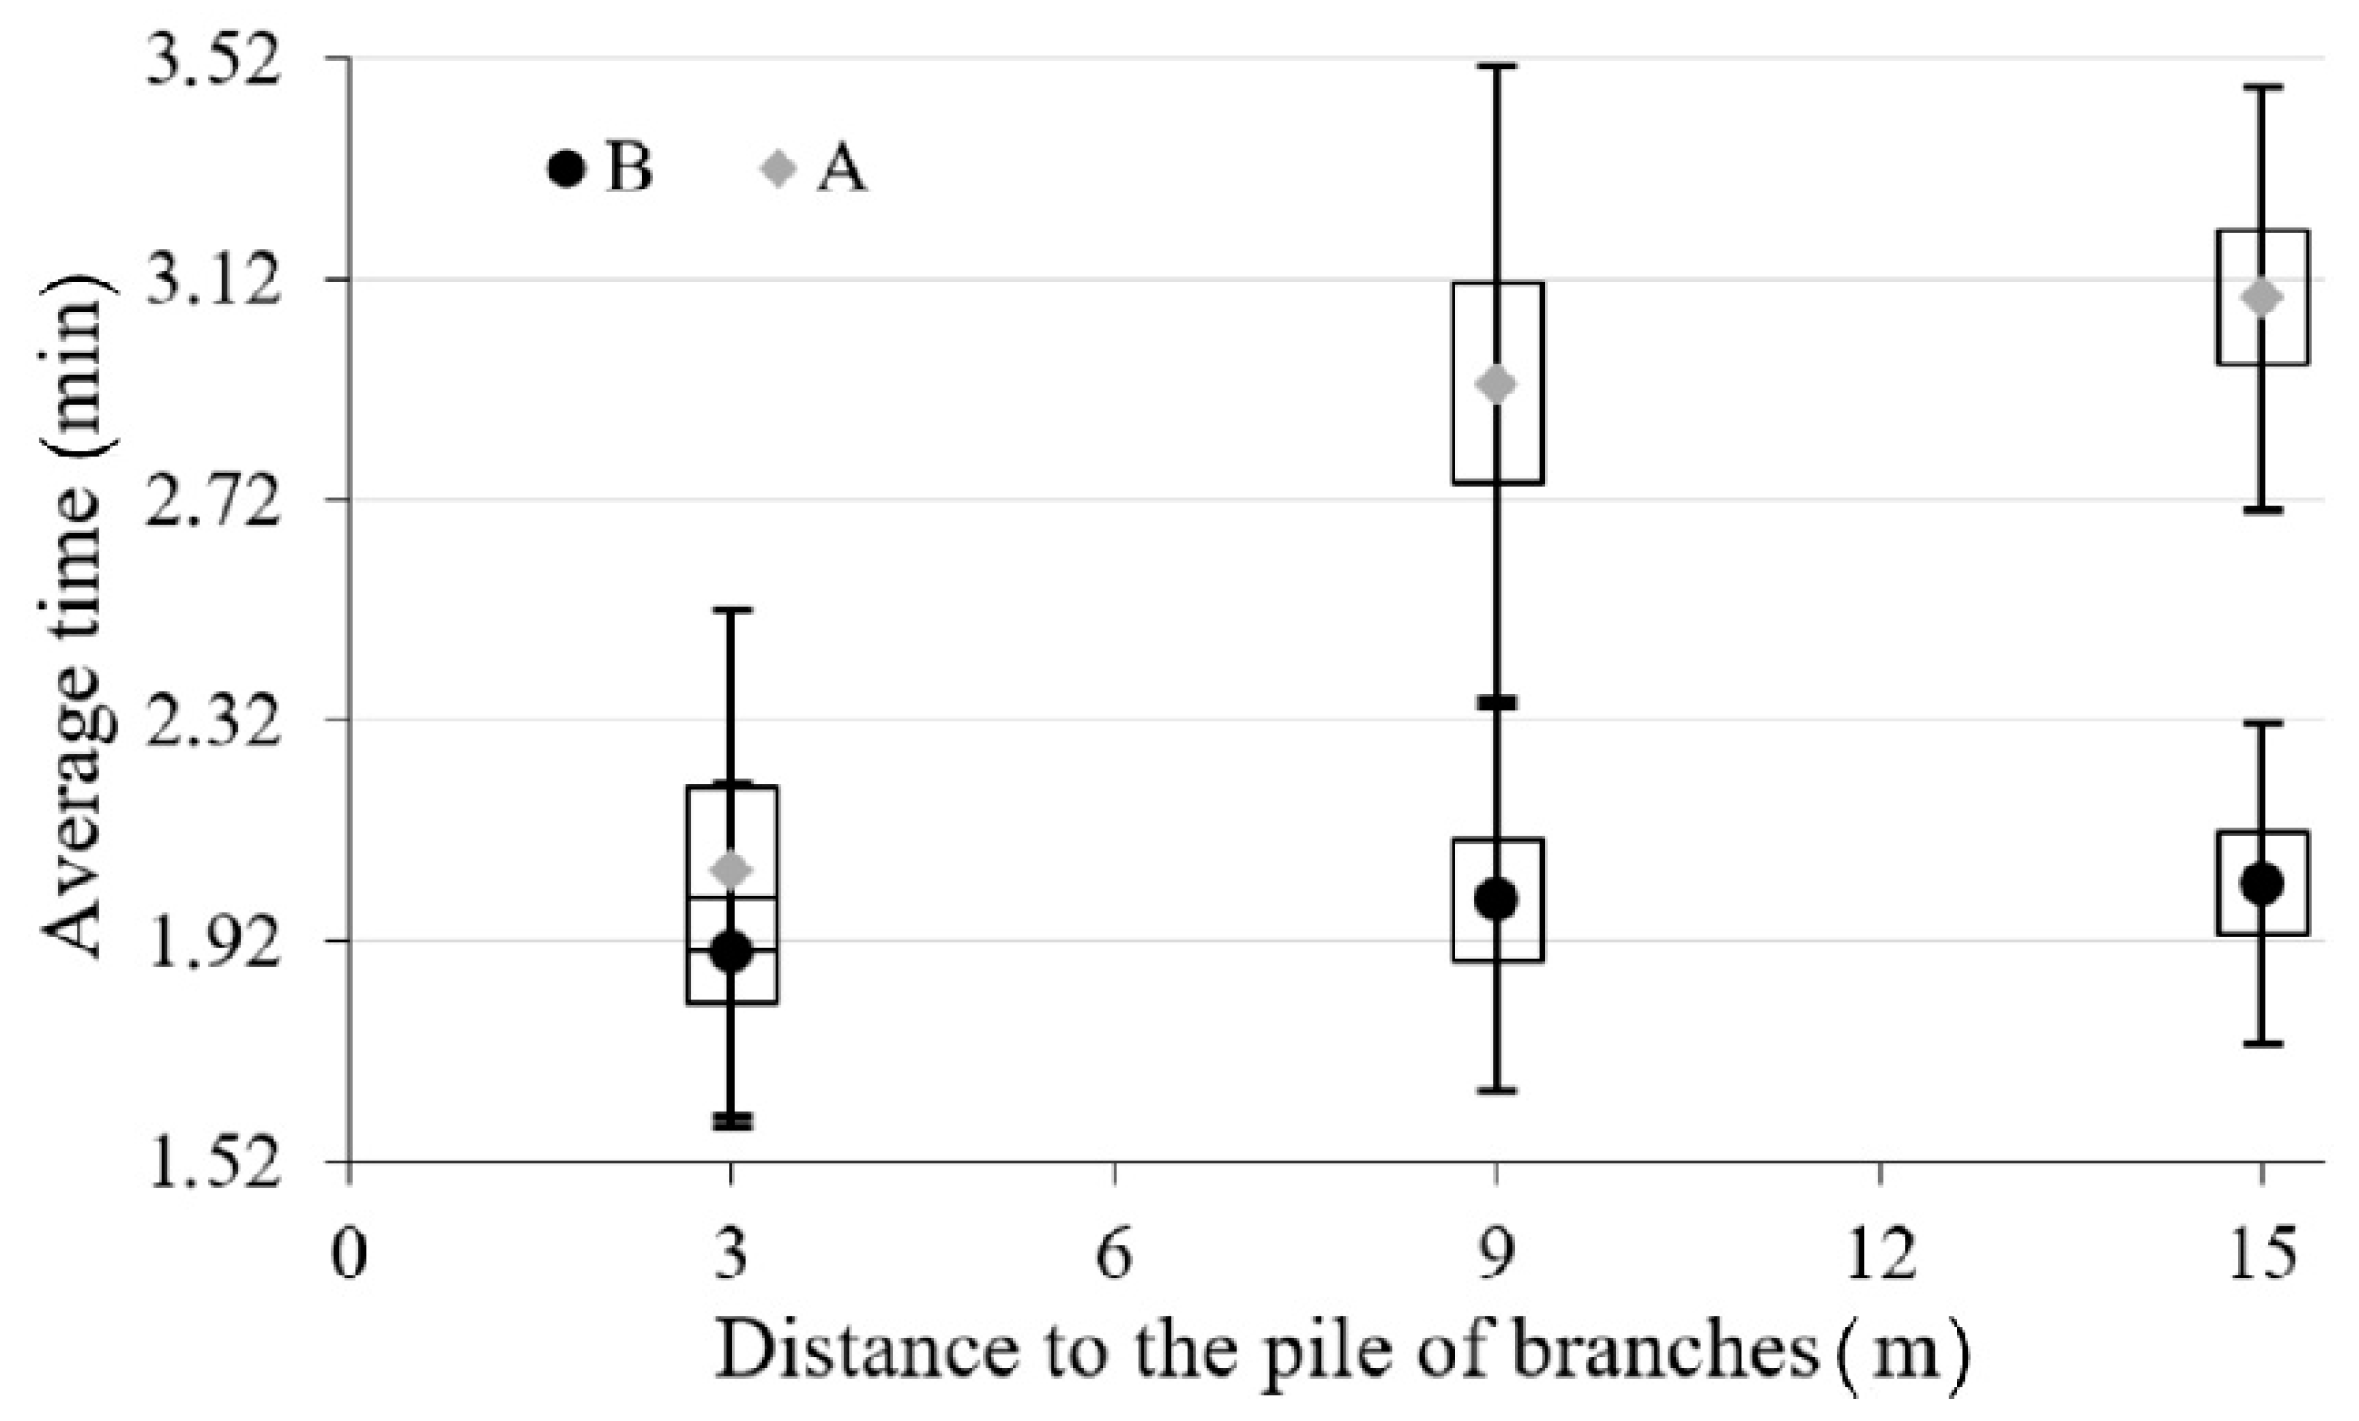
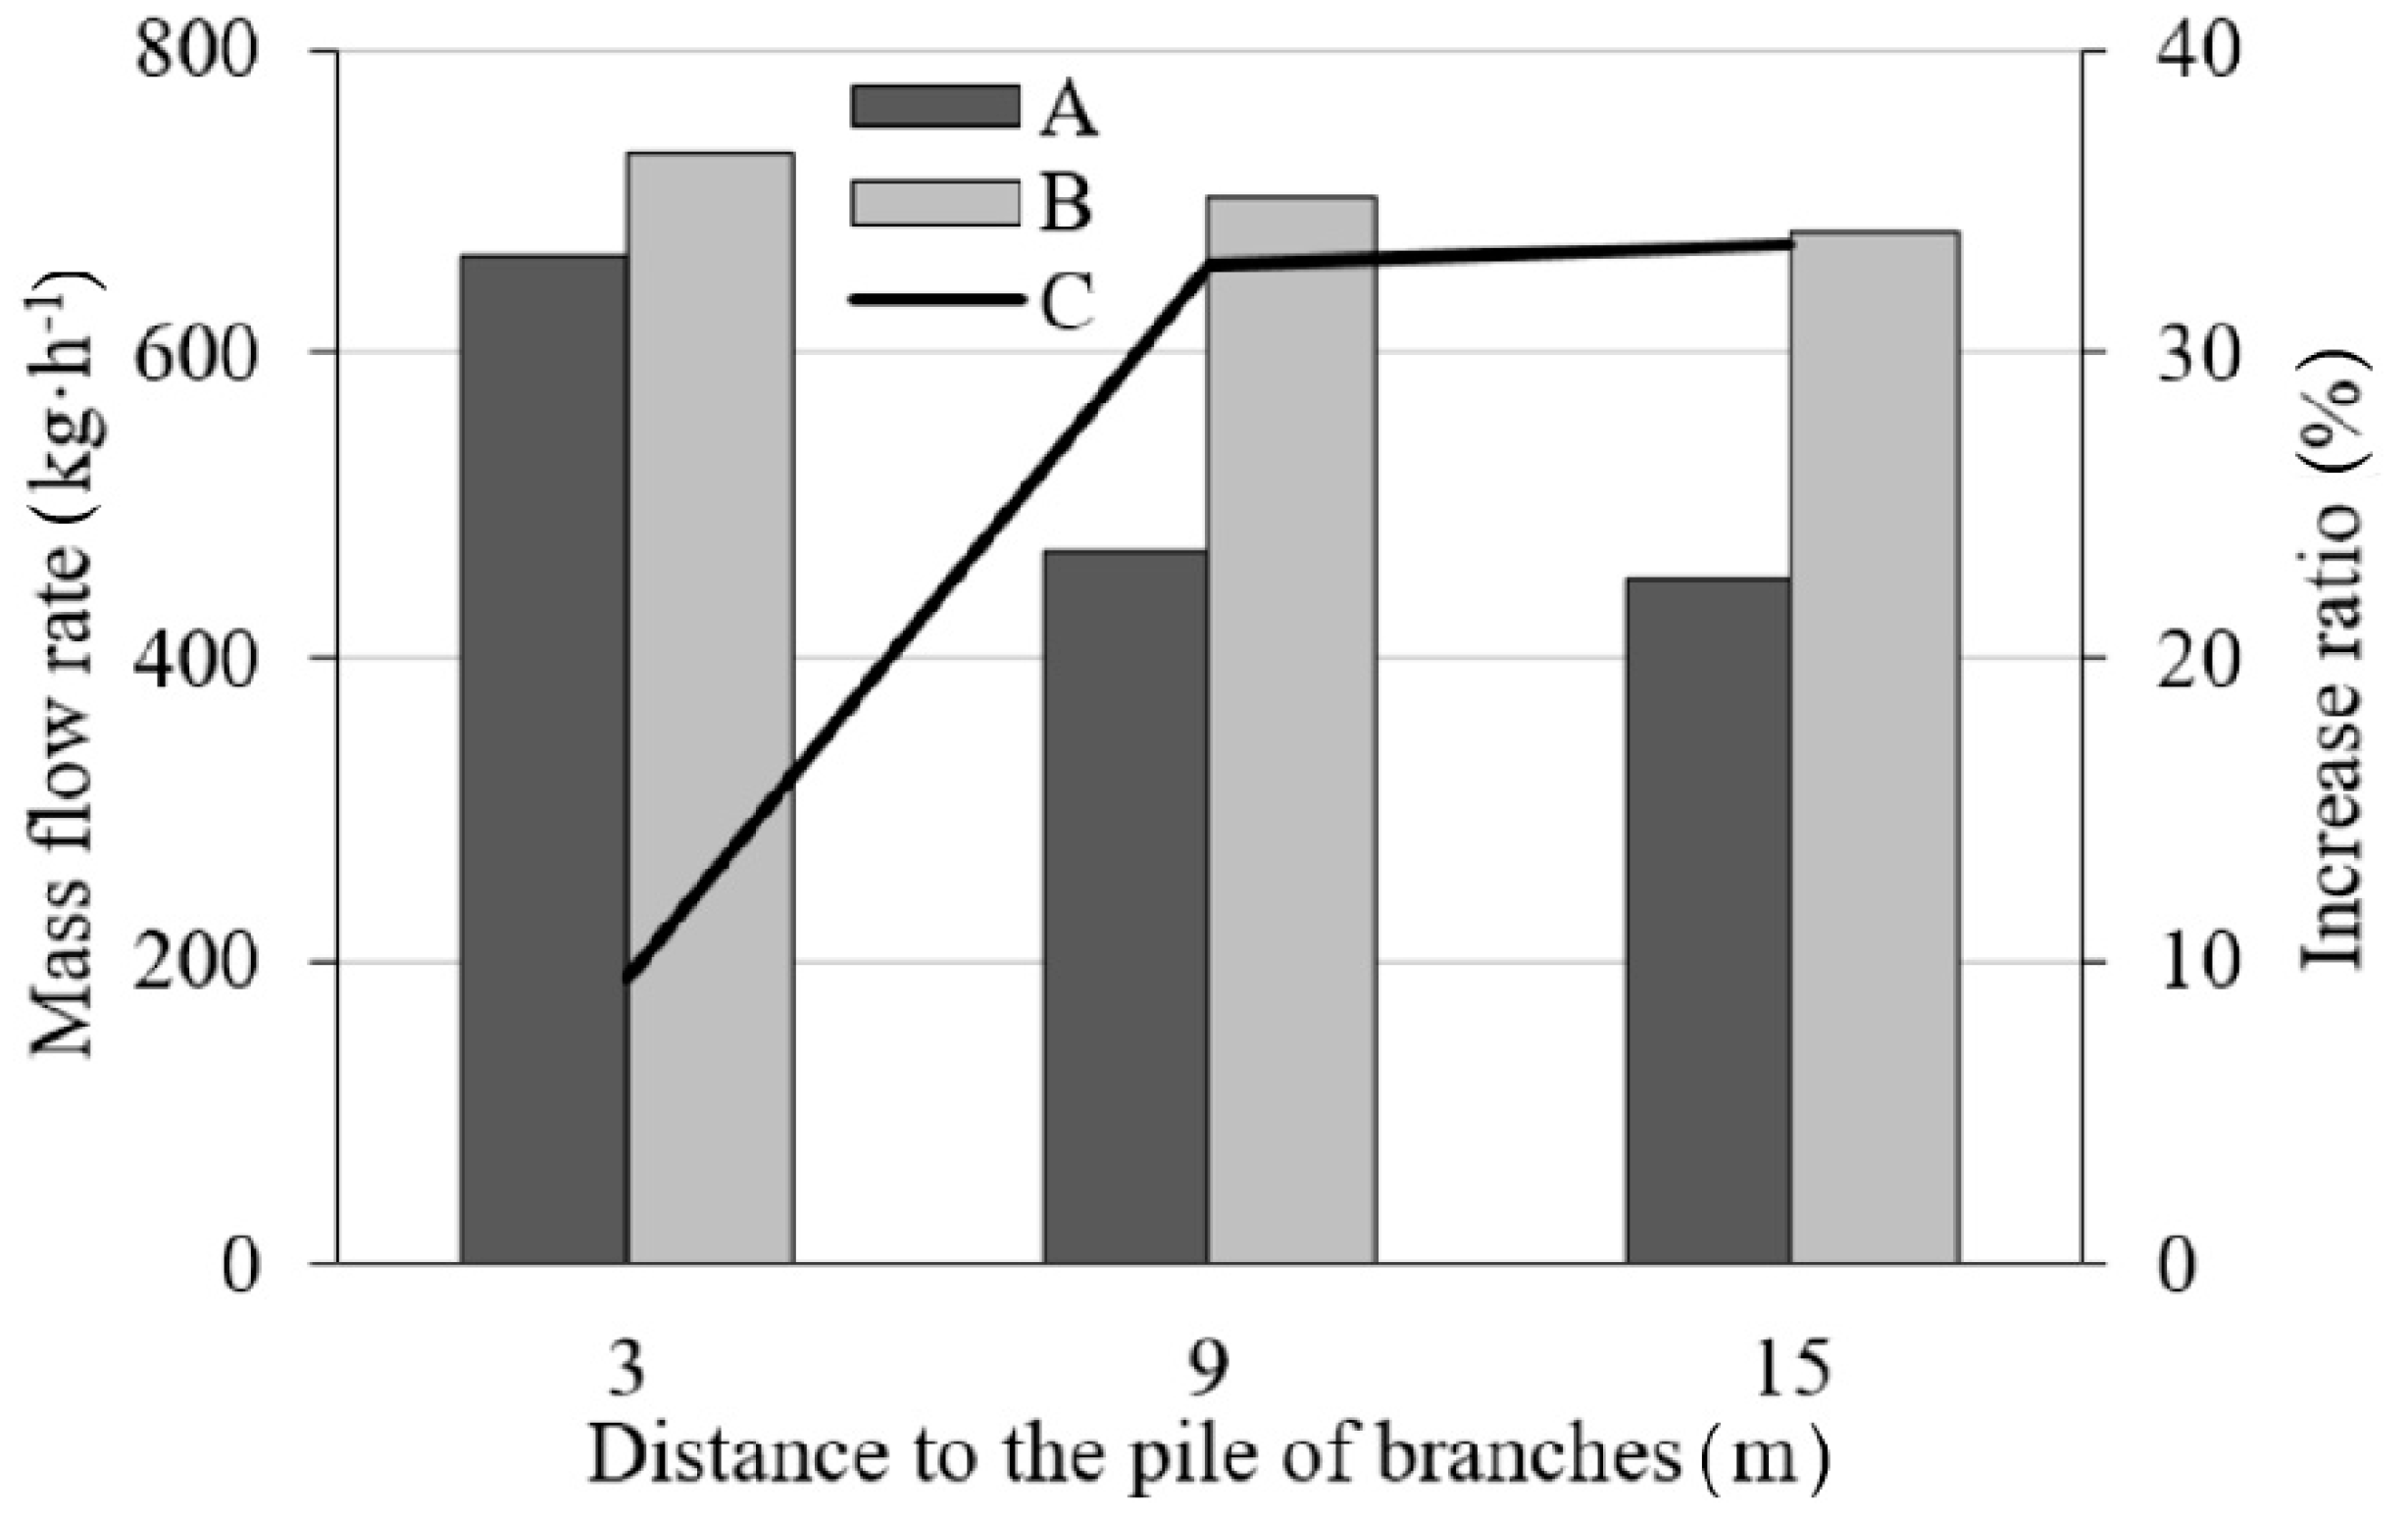
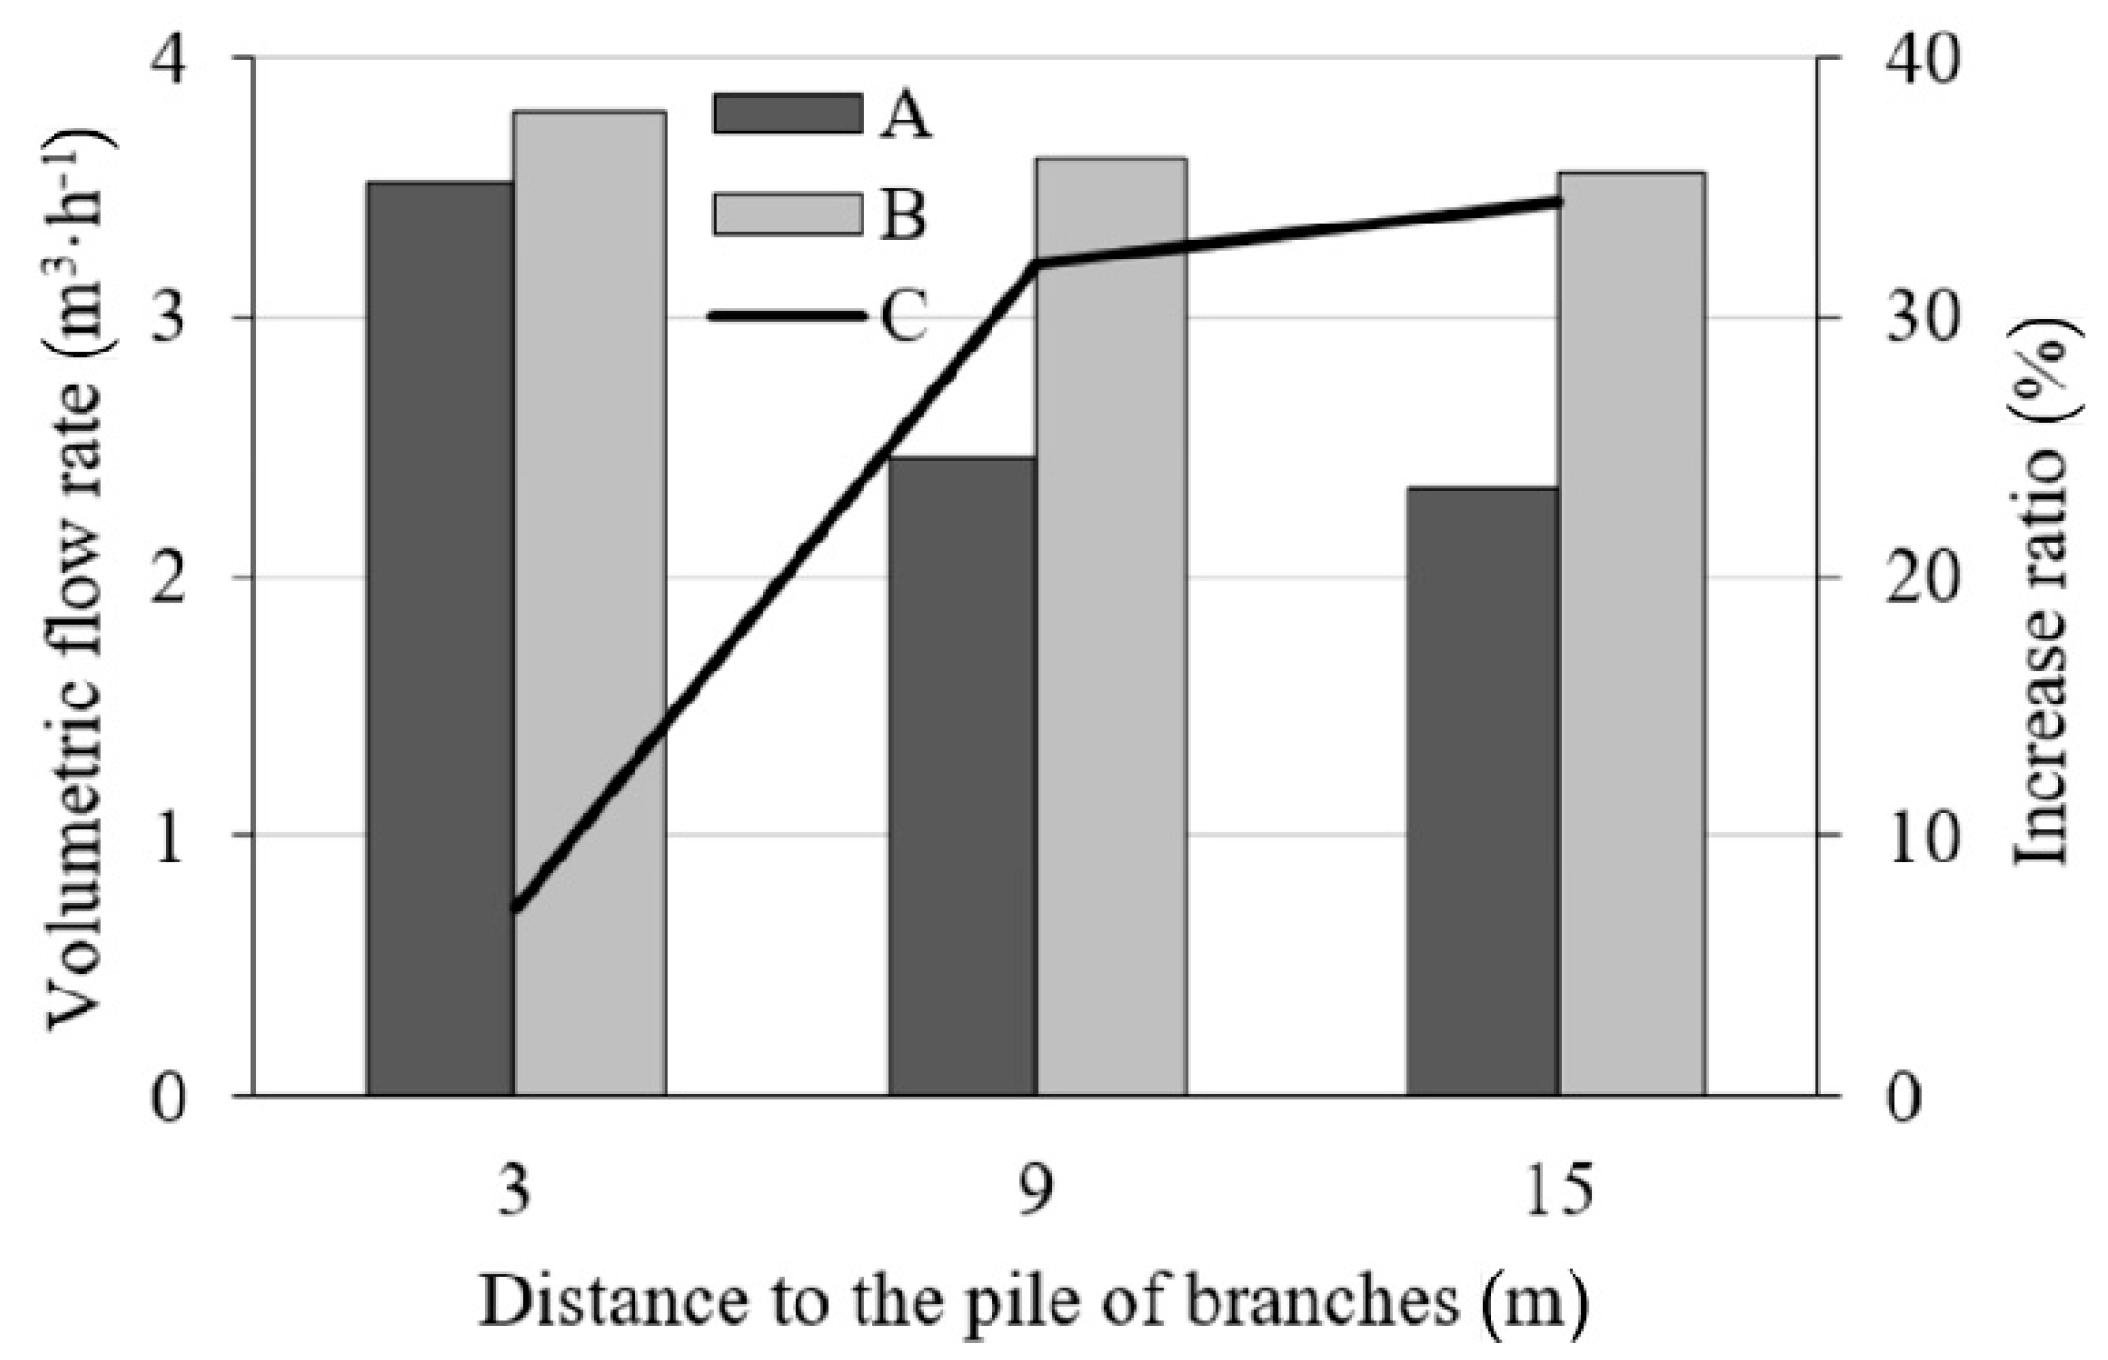
3.2. Change of Chipper Productivity

Measured values are presented in Table 2. The impact of the number of operators and distances of branch piles on the container weight and filling time was analysed. Changes in the mass value measured can be seen in Figure 8, whereas changes in mean time values are shown in Figure 9.
Results of flow rate calculations are presented on Figure 10 and Figure 11.

4. Discussion

The number of operators and the distance between the pile of branches and the machine affect the operating conditions and productivity of mobile chipping devices. If we take the shortest distance into account (3 m) and operation provided by only one operator, the idle run time of the chipping machine was equal to ca. 43%. This value rose up to ca. 71% when the distance was 15 m (Figure 5). Increasing the number of operators from one to two reduced the idle run time by ca. 30% on average for the distance from 3 m to 15 m (Figure 5). If we take the results available in literature [32] into account, it may be demonstrated that the change of the idle run time value when branches are supplied by one operator within a range of 0.5 m to 15 m has an increasing character (Figure 6). Studies performed by Mc Ewan in 2019 showed that during works with the use of high-power industrial chippers, the average idle run time may be even 40% [25]. In contrast, Spinelli and Visser in 2009 in their studies on delays in wood chipping operations with the use of industrial woodchippers indicated that the average utilization of the chipper was 73.8%, which may indicate that the idle time accounts for 26.3% [46]. Tests show that the idle run time during the low-power chipper operation considerably exceeds 20% of the total operating time. In motorized vehicles, the 20% value of the idle run time gives an impetus to start–stop systems [41].
In studies described herein, the impact of types of delays were not classified, i.e., mechanical, operator-related, organizational and other delays [41]. It results from the fact that the objective of studies was not to determine the impact of all delays on the chipper operation. Only those, which occur during assumed uninterrupted work of both the machine and operators, were analysed. It is reasonable as in the case of most other delay occurrences, that people who operate the device simply switch it off. Taking other delays into consideration may only extend the idle work time, which will additionally emphasize the reason for the application of adaptation systems.
The next parameter tested is the frequency of operating condition changes. Tests showed that the rate of operation changes for one operator may occur from 6 to 2 times per one minute (Figure 7). Frequency of branch supply is significantly reduced along with the distance of the branch pile from the chipper. The increase in a number of operators from one to two has a slight impact on the frequency of operating condition changes (by ca. 7%) at the shortest distance from the chipper (3 m), which is shown in Figure 7, whereas at longer distances, the additional operator may increase the frequency of chipper operating condition changes by 77% at 9 m distance and 85% at 15 m distance. The change rate at 6 min-1 level is a too high value to stop the engine as in systems used in vehicles. Furthermore, low-power chippers often do not have electric motors to support the start–up of the combustion engine. The stoppage time assumed for cars is longer and results, inter alia, from traffic lights changes [47,48,49]. Furthermore, the vehicle driving time in the city cycle is longer than the time needed to shred one branch. Results of tests suggest that in such operating conditions such as those that occur in low-power woodchippers, the adaptation should rather control the speed of the drive unit instead of stopping it.
In further studies the range of time shall be considered, for which the application of speed control systems of the drive, or as an alternative—its stopping, depend on the idle run to active run ratio. To achieve this, the following shall be taken into account: start–up time, tribological processes, flue gas emission, fuel consumption and complexity of the drive unit control.
The mean time and weight of the full container change along with the change of the branch pile distance from the chipper, whereas results of ANOVA show that no essential statistical differences occur between weights of full containers as a result of the distance change between the pile and the chipper, operator, but also their interactions. This means that prepared wood, on average, had very similar sizes and weight. Changes in mass value measured can be observed in Figure 8.
The mean time value grows as the distance gets longer, which may be observed in Figure 9. The analysis of variance performed allows for rejecting the null hypothesis. Its results suggest that both the distance of the branch pile from the chipper, the operator himself, as well as interaction of both of these factors, have an impact on the time the raw material is delivered for chipping.
The growing character of the mean time value was maintained for all experiment cases; however, data suggest that that in case of one operator, the delivery of branches always took more time. It is worth noticing that the mean time values to fill up the container are similar only in cases when two operators work. If we assume that the wood prepared, on average, had very similar dimensions and weight, as well as the same distance to be covered by operators, a conclusion arises that the changes observed could be an effect of their movement at different speeds. Maybe the observed character of data analysed was just caused by the human factor.
Productivity of the chipping process decreases as the distance between the branch pile and the chipper grows and as the number of operators decreases. Observed drops of mass output (productivity) accounted for ca. 32% for one operator and 7.2% for two operators, whereas reduction of volume output accounted for ca. 33.5% for one operator and 6.1% for two operators. Differences in output values result from different apparent density of biomass. It is variable as it considers the volume of empty cavities in the container.
The increases in the process productivity in mass terms, while increasing the number of operators from one to two, for individual distances 3, 9, 15 m are 9.4%, 33%, 33.6%, respectively. While for the volume output, the respective values are as follows: 7.2%, 32% and 34.4%. Output increase for the shortest distance is small. It is most likely due to the fact that with two operators working at such a section, the chipper works more or less continuously.

5. Conclusions

Tests of delay characteristics of branch delivery to chippers were analysed for two factors: the branch pile distance from the chipper and the number of operators. Delays were investigated to determine operating conditions of low-power chipping machines used mainly for clearing works. These tests allowed determination of the idle run time, as well as frequency of operating condition changes. It was demonstrated that the idle run time of the cylindrical chipper might account for 43% to 71% of the total operating time, and the frequency of the machine operating condition changes from 6 to 2 times per minute. Such conditions indicate that the application of adaptation systems in this type of machine is justified [38]. Changing the operating status of the driving unit is due to the torque demand of the cutting mechanism. Such systems may reduce consumption of fuel and flue gas emission value in tested machines. However, to confirm the effects of the implementation of adaptation systems in the chipping machines, the construction of prototypes and testing with the use of PEMS (portable emission measurement system) are required. Such testing will allow one to measure the flue gas emission and consumption of fuel in actual operating conditions. In the future, such systems could be included in recommendations of legislators for nonroad mobile machinery with small engines, as solutions that limit the impact of periodic-variable operation machinery on the environment. Similar guidelines are included in regulations on homologation of vehicles, e.g., in the EU area with regard to start–stop system applications. In addition, the tested mass and volume output of the cylindrical chipper in the most beneficial case is equal to 0.66 t/h and 3.5 m3/h, respectively. The increase of the branch pile distance from the chipper causes a drop of the mass output by 32%, and volume output by 33.5%. The implementation of adaptation systems may also reduce the costs associated with the processing of branches and production of chips, as well as limit negative effects of delays in wood chipping processes.

Author Contributions

Conceptualization, Ł.W., M.K. and P.K.; methodology, Ł.W., M.K. and, B.W.; software, Ł.W., M.K.; validation, Ł.W., M.K. and P.K.; formal analysis, Ł.W., M.K., B.W., P.K.; investigation, Ł.W., M.K., B.W., P.K.; resources, Ł.W., M.K. and B.W.; data curation, Ł.W. and M.K.; writing—original draft preparation, Ł.W., M.K. and B.W.; writing—review and editing, M.K., P.K. and Ł.W.; visualization, M.K., Ł.W.; supervision, Ł.W.; project administration, Ł.W.; funding acquisition, Ł.W. and B.W. All authors have read and agreed to the published version of the manuscript.

Funding

Research was performed as part of the project “Interdisciplinary Dean’s Grant (IDG) of Poznań University of Technology” determined in the subject for the year 2020—air quality in Poznań and how to improve it. Project title: “Design and research of mobile machines chipping wastes from urban agriculture processes for innovative construction solutions limiting the impact on the natural environment and machine operators” (33/32/SIGR/3334), financed by the Poznan University of Technology.

Conflicts of Interest

The authors declare no conflict of interest.

References

  1. Kuptz, D.; Hartmann, H. Throughput rate and energy consumption during wood chip production in relation to raw material, chipper type and machine setting. In Proceedings of the 22nd European Biomass Conference and Exhibition, Hamburg, Germany, 23–26 June 2014; pp. 23–26. [Google Scholar]
  2. Spinelli, R.; Magagnotti, N.; Paletto, G.; Preti, C. Determining the impact of some wood characteristics on the performance of a mobile chipper. Silva Fenn. 2011, 45, 85–95. [Google Scholar] [CrossRef] [Green Version]
  3. Nati, C.; Spinelli, R.; Fabbri, P. Wood chips size distribution in relation to blade wear and screen use. Biomass Bioenergy 2010, 34, 583–587. [Google Scholar] [CrossRef]
  4. Nati, C.; Eliasson, L.; Spinelli, R. Effect of chipper type, biomass type and blade wear on productivity, fuel consumption and product quality. Croat. J. For. Eng. 2014, 35, 1–7. [Google Scholar]
  5. Pochi, D.; Civitarese, V.; Fanigliulo, R.; Spinelli, R.; Pari, L. Effect of poplar fuel wood storage on chipping performance. Fuel Process. Technol. 2015, 134, 116–121. [Google Scholar] [CrossRef]
  6. Magagnotti, N.; Spinelli, R. Determining the effect of feedstock type and chipping productivity, fuel consumption and quality output. In Proceedings of the Formec 2011 Conference Pushing the Boundaries with Research and Innovation in Forest Engineering, Graz, Austria, 9–13 October 2011; pp. 1–8. [Google Scholar]
  7. Assirelli, A.; Civitarese, V.; Fanigliulo, R.; Pari, L.; Pochi, D.; Santangelo, E.; Spinelli, R. Effect of piece size and tree part on chipper performance. Biomass Bioenergy 2013, 54, 77–82. [Google Scholar] [CrossRef]
  8. Manzone, M.; Balsari, P. Productivity and woodchip quality of different chippers during poplar plantation harvesting. Biomass Bioenergy 2015, 83, 278–283. [Google Scholar] [CrossRef] [Green Version]
  9. Shahid, L.A.; Amjad, N.; Siddhu, M.A.H. Adaptation and performance evaluation of a tractor operated wood chipper shredder. Pak. J. Agric. Res. 2019, 32, 197–204. [Google Scholar] [CrossRef]
  10. Manzone, M. Energy consumption and CO2 analysis of different types of chippers used in wood biomass plantations. Appl. Energy 2015, 156, 686–692. [Google Scholar] [CrossRef] [Green Version]
  11. Spinelli, R.; Magagnotti, N. Performance of a small-scale chipper for professional rural contractors. For. Sci. Pract. 2013, 15, 206–213. [Google Scholar] [CrossRef]
  12. Spinelli, R.; Eliasson, L.; Magagnotti, N. Increasing wood fuel processing efficiency by fine-tuning chipper settings. Fuel Process. Technol. 2016, 151, 126–130. [Google Scholar] [CrossRef]
  13. Nati, C.; Spinelli, R. How blade wear of chippers can affect fuel consumption and wood chip size distribution. In Proceedings of the Forest Engeneering: Meeting the Needs of the Society and the Environment, Formec 2010, Padova, Italia, 11–14 July 2010; pp. 1–7. [Google Scholar]
  14. Facello, A.; Cavallo, E.; Magagnotti, N.; Paletto, G.; Spinelli, R. The effect of chipper cut length on wood fuel processing performance. Fuel Process. Technol. 2013, 116, 228–233. [Google Scholar] [CrossRef]
  15. Manzone, M.; Spinelli, R. Wood chipping performance of a modified forager. Biomass Bioenergy 2013, 55, 101–106. [Google Scholar] [CrossRef]
  16. Han, S.K.; Han, H.S.; Bisson, J.A. Effects of grate size on grinding productivity, fuel consumption, and particle size distribution. For. Prod. J. 2015, 65, 209–216. [Google Scholar] [CrossRef]
  17. Spinelli, R.; Cavallo, E.; Eliasson, L.; Facello, A.; Magagnotti, N. The effect of drum design on chipper performance. Renew. Energy 2015, 81, 57–61. [Google Scholar] [CrossRef]
  18. Nati, C.; Eliasson, L.; Spinelli, R. Fuel consumption and productivity for two tractor-mounted chippers in relation to knife wear and raw material. In Proceedings of the Formec 2011 Conference Pushing the Boundaries with Research and Innovation in Forest Engineering, Graz, Austria, 9–13 October 2011; pp. 1–8. [Google Scholar]
  19. Irdla, M.; Padari, A.; Kurvits, V.; Muiste, P. The chipping cost of wood raw material for fuel in Estonian conditions. For. Stud. 2017, 66, 65–74. [Google Scholar] [CrossRef] [Green Version]
  20. Laitila, J.; Routa, J. Performance of a small and medium sized professional chippers and the impact of storage time on Scots pine (Pinus sylvestris) stem wood chips characteristics. Silva Fenn. 2015, 49, 1–19. [Google Scholar] [CrossRef] [Green Version]
  21. Spinelli, R.; Magagnotti, N. Determining long-term chipper usage, productivity and fuel consumption. Biomass Bioenergy 2014, 66, 442–449. [Google Scholar] [CrossRef]
  22. Spinelli, R.; Glushkov, S.; Markov, I. Managing chipper knife wear to increase chip quality and reduce chipping cost. Biomass Bioenergy 2014, 62, 117–122. [Google Scholar] [CrossRef]
  23. Spinelli, R.; Nati, C.; Sozzi, L.; Magagnotti, N.; Picchi, G. Physical characterization of commercial woodchips on the Italian energy market. Fuel 2011, 90, 2198–2202. [Google Scholar] [CrossRef]
  24. Eliasson, L.; von Hofsten, H.; Johannesson, T.; Spinelli, R.; Thierfelder, T. Effects of sieve size on chipper productivity, fuel consumption and chip size distribution for open drum chippers. Croat. J. For. Eng. 2015, 36, 11–17. [Google Scholar]
  25. McEwan, A.; Brink, M.; Spinelli, R. Efficiency of Different Machine Layouts for Chain Flail Delimbing, Debarking and Chipping. Forests 2019, 10, 126. [Google Scholar] [CrossRef] [Green Version]
  26. Choi, Y.S.; Cho, M.J.; Paik, S.H.; Mun, H.S.; Kim, D.H.; Han, S.K.; Oh, J.H. Factors Affecting the Chipping Operation Based on the Screen Size of the Drum Chipper. Forests 2019, 10, 1029. [Google Scholar] [CrossRef] [Green Version]
  27. Ghaffariyan, M.R.; Sessions, J.; Brown, M. Evaluating productivity, cost, chip quality and biomass recovery for a mobile chipper in Australian roadside chipping operations. J. For. Sci. 2012, 58, 530–535. [Google Scholar] [CrossRef] [Green Version]
  28. Mihelič, M.; Spinelli, R.; Magagnotti, N.; Poje, A. Performance of a new industrial chipper for rural contractors. Biomass Bioenergy 2015, 83, 152–158. [Google Scholar] [CrossRef]
  29. Prada, M.; Martínez-Alonso, C.; Sánchez-García, S.; Canga, E. Analysis of three forest chippers: Productivity, costs and GHG emissions in Northern Spain. J. Clean. Prod. 2015, 101, 238–244. [Google Scholar] [CrossRef]
  30. Pari, L.; Suardi, A.; Del Giudice, A.; Scarfone, A.; Santangelo, E. Influence of chipping system on chipper performance and wood chip particle size obtained from peach prunings. Biomass Bioenergy 2018, 112, 121–127. [Google Scholar] [CrossRef]
  31. Spinelli, R.; Magagnotti, N. The effect of raw material, cut length, and chip discharge on the performance of an industrial chipper. For. Prod. J. 2012, 62, 584–589. [Google Scholar] [CrossRef]
  32. Warguła, Ł.; Waluś, J.K.; Krawiec, P. Determination of working conditions of mobile chipping wood machines in the aspect of innovative drive control systems. Sylwan 2019, 163, 765–772. [Google Scholar] [CrossRef]
  33. Mihelič, M.; Spinelli, R.; Poje, A. Production of Wood Chips from Logging Residue under Space-Constrained Conditions. Croat. J. For. Eng. 2018, 39, 223–232. [Google Scholar]
  34. Bishop, J.; Nedungadi, A.; Ostrowski, G.; Surampudi, B.; Armiroli, P.; Taspinar, E. An engine start/stop system for improved fuel economy. SAE Techn. Pap. 2007, 1–8. [Google Scholar] [CrossRef]
  35. Regulation (EU). On Requirements for Emission Limit Values of Gaseous and Particulate Pollutants and Type-approval with Respect to Internal Combustion Engines for Mobile Machines Non-road, Amending Regulations (EU) No 1024/2012 and (EU) No 167/2013 and Amending and Repealing Directive 97/68/WE. No 2016/1628 of the European Parliament and of the Council of 14 September 2016. Off. J. Eur. Union. 2016, 252, 53–117. [Google Scholar]
  36. Waluś, K.J.; Warguła, Ł.; Krawiec, P.; Adamiec, J.M. Legal regulations of restrictions of air pollution made by non-road mobile machinery—The case study for Europe: A review. Environ. Sci. Pollut. Res. 2018, 25, 3243–3259. [Google Scholar] [CrossRef] [PubMed] [Green Version]
  37. Warguła, Ł.; Wojtkowiak, D.; Waluś, K.J.; Krawiec, P.; Wieczorek, B. The analysis of the efficiency of the control system of Wood chipper’s driver with spark-ignition engine based on Skoda combustion engine 1.4 59kW. In Proceedings of the Transport Means 2017: 21st International Scientific Conference, Juodkrante, Lithuania, 20–22 September 2017; Part 2. Kaunas University of Technology: Juodkrante, Lithuania, 2017; pp. 452–458. [Google Scholar]
  38. Warguła, Ł.; Krawiec, P.; Waluś, K.J.; Kukla, M. Fuel Consumption Test Results for a Self-Adaptive, Maintenance-Free Wood Chipper Drive Control System. Appl. Sci. 2020, 10, 2727. [Google Scholar] [CrossRef] [Green Version]
  39. Warguła, Ł.; Waluś, K.J.; Krawiec, P.; Polasik, J. Electronic control injection-ignition systems in propulsion of non-road mobile machinery. J. Mech. Trans. Eng. 2018, 70, 61–78. [Google Scholar] [CrossRef]
  40. Warguła, Ł.; Waluś, K.J.; Krawiec, P. Small engines spark ignited (SI) for non-road mobile machinery—Review. In Proceedings of the Transport Means 2018: 22nd International Scientific Conference, Trakai, Lithuania, 3–5 October 2018; Kaunas University of Technology: Trakai, Lithuania, 2018; Volume 2, pp. 585–591. [Google Scholar]
  41. Cieślik, W.; Pielecha, I.; Borowski, P. Effects of start–stop system on the operation of drive system in urban traffic conditions. J. Mech. Trans. Eng. 2015, 67, 15–26. [Google Scholar]
  42. Warguła, Ł.; Kaczmarzyk, P.; Dziechciarz, A. The assessment of fire risk of non-road mobile wood chopping machines. J. Res. Appl. Agric. Eng. 2019, 64, 58–64. [Google Scholar]
  43. Bektas, I.; Alma, M.H.; As, N. Determination of the relationships between Brinell and Janka hardness of eastern beech (Fagus orientalis Lipsky). For. Prod. J. 2001, 51, 84. [Google Scholar]
  44. Green, D.W.; Begel, M.; Nelson, W. Janka Hardness Using Nonstandard Specimens; US Department of Agriculture, Forest Service, Forest Product Laboratory: Washington, DC, USA, 2006; p. 303. [Google Scholar]
  45. Bosina, E.; Weidmann, U. Estimating pedestrian speed using aggregated literature data. Phys. A Stat. Mech. Appl. 2017, 468, 1–29. [Google Scholar] [CrossRef]
  46. Spinelli, R.; Visser, R.J. Analyzing and estimating delays in wood chipping operations. Biomass Bioenergy 2009, 33, 429–433. [Google Scholar] [CrossRef]
  47. Fouladvand, M.E.; Nematollahi, M. Optimization of green-times at an isolated urban crossroads. Eur. Phys. J. B Condens. Matter Complex Syst. 2001, 22, 395–401. [Google Scholar] [CrossRef] [Green Version]
  48. Rouphail, N.M.; Frey, H.C.; Colyar, J.D.; Unal, A. Vehicle emissions and traffic measures: Exploratory analysis of field observations at signalized arterials. In Proceedings of the 80th Annual Meeting of the Transportation Research Board, Washington, DC, USA, 7–11 January 2001. [Google Scholar]
  49. Wu, L.; Ci, Y.; Chu, J.; Zhang, H. The influence of intersections on fuel consumption in urban arterial road traffic: A single vehicle test in Harbin, China. PLoS ONE 2015, 10. [Google Scholar] [CrossRef] [PubMed]
Figure 1. Woodchipper with measuring instruments; 1—woodchipper with engine drive, 2—sensors of branch detection system in the feeding chute, 3—recording computer, 4—120 L containers, 5—weighing scale, 6—weight recording system.
Forests 11 00598 g001
Figure 2. Arrangement of piles of branches relative to the chipper; distances: a–f = 3 m.
Forests 11 00598 g002
Figure 3. Theoretical delivery of branches time characteristic to the chipper by one operator depending on the distance along with components; A—time to insert the branches into the feed channel, B—time to travel from the chipper to the pile of branches, C—time to lift and remove the branch from the pile, D—time to travel from the pile of branches to the chipper.
Forests 11 00598 g003
Figure 4. Characteristics of signal changes in the detection system in the feeding chute depending on conditions of branch supply; high level stands for presence of material for chipping, low level means it lacks; A—3 m distance and one operator, B—3 m distance and two operators, C—9 m distance and one operator, D—9 m distance and two operators, E—15 m distance and one operator, F—15 m distance and two operators.
Forests 11 00598 g004
Figure 5. A ratio of the chipper idle run time to the number of operators and the distance of the pile of branches to the chipper; A—for one operator, B—for two operators, C—range of idle run time reduction due to increased number of operators to two.
Forests 11 00598 g005
Figure 6. Characteristics of the impact of branch pile distance from the chipper on the idle run time ratio during chipping.
Forests 11 00598 g006
Figure 7. Frequency of cylindrical chipper operating condition changes depending on the number of operators and distance of the pile of branches to the chipper; A—for one operator, B—for two operators, C—increase of frequency of chipper operating condition changes due to increased number of operators to two.
Forests 11 00598 g007
Figure 8. Average weight of full container, error bars are ± standard deviation, rectangles are ± standard error; A—for one operator, B—for two operators.
Forests 11 00598 g008
Figure 9. Mean time to fill up the container for chips; error bars are ± standard deviation, rectangles are ± standard error; A—for one operator, B—for two operators.
Forests 11 00598 g009
Figure 10. Mass productivity of the chipping process; A—for one operator, B—for two operators, C—increase ratio of mass productivity when the number of operators was increased to two.
Forests 11 00598 g010
Figure 11. Volume productivity of the chipping process; A—for one operator, B—for two operators, C—range increase ratio of volumetric productivity when the number of operators was increased to two.
Forests 11 00598 g011
Table 1. Percentage of idle run time during chipping processes and frequency of operating condition changes.
TitleDistance
3 m9 m15 m
Number of Operators
121212
Percentage of Idle Run Time (%)
x ¯ 42.8030.9055.1041.0070.8045.20
M e 44.0030.5055.0040.5070.0045.00
σ 3.792.553.592.686.063.79
Frequency of Operating Condition Changes (min−1)
x ¯ 5.716.082.975.282.204.08
M e 5.706.002.955.252.154.10
σ 0.330.500.240.370.340.36
x ¯ —arithmetic mean value, Me—median value, σ—standard deviation
Table 2. Values obtained from measurements.
NoGABC
D (min)E (kg)D (min)E (kg)D (min)E (kg)
x ¯ 12.0522.652.9323.003.0923.20
σ 0.472.610.582.660.392.20
x ¯ 21.9023.202.1023.331.9422.94
σ 0.302.500.522.730.382.65
x ¯ —arithmetic mean value, σ–standard deviation of arithmetic mean, G—operator number, A–C—branch pile distance from chipper (3, 9, 15 m in sequence), D—time to fill up the container for chips and E—weight of full container, G—number of operators.

