Searching for Pareto Fronts for Forest Stand Wind Stability by Incorporating Timber and Biodiversity Values

 , ,
, ,
Abstract
:1. Introduction
2. Materials and Methods
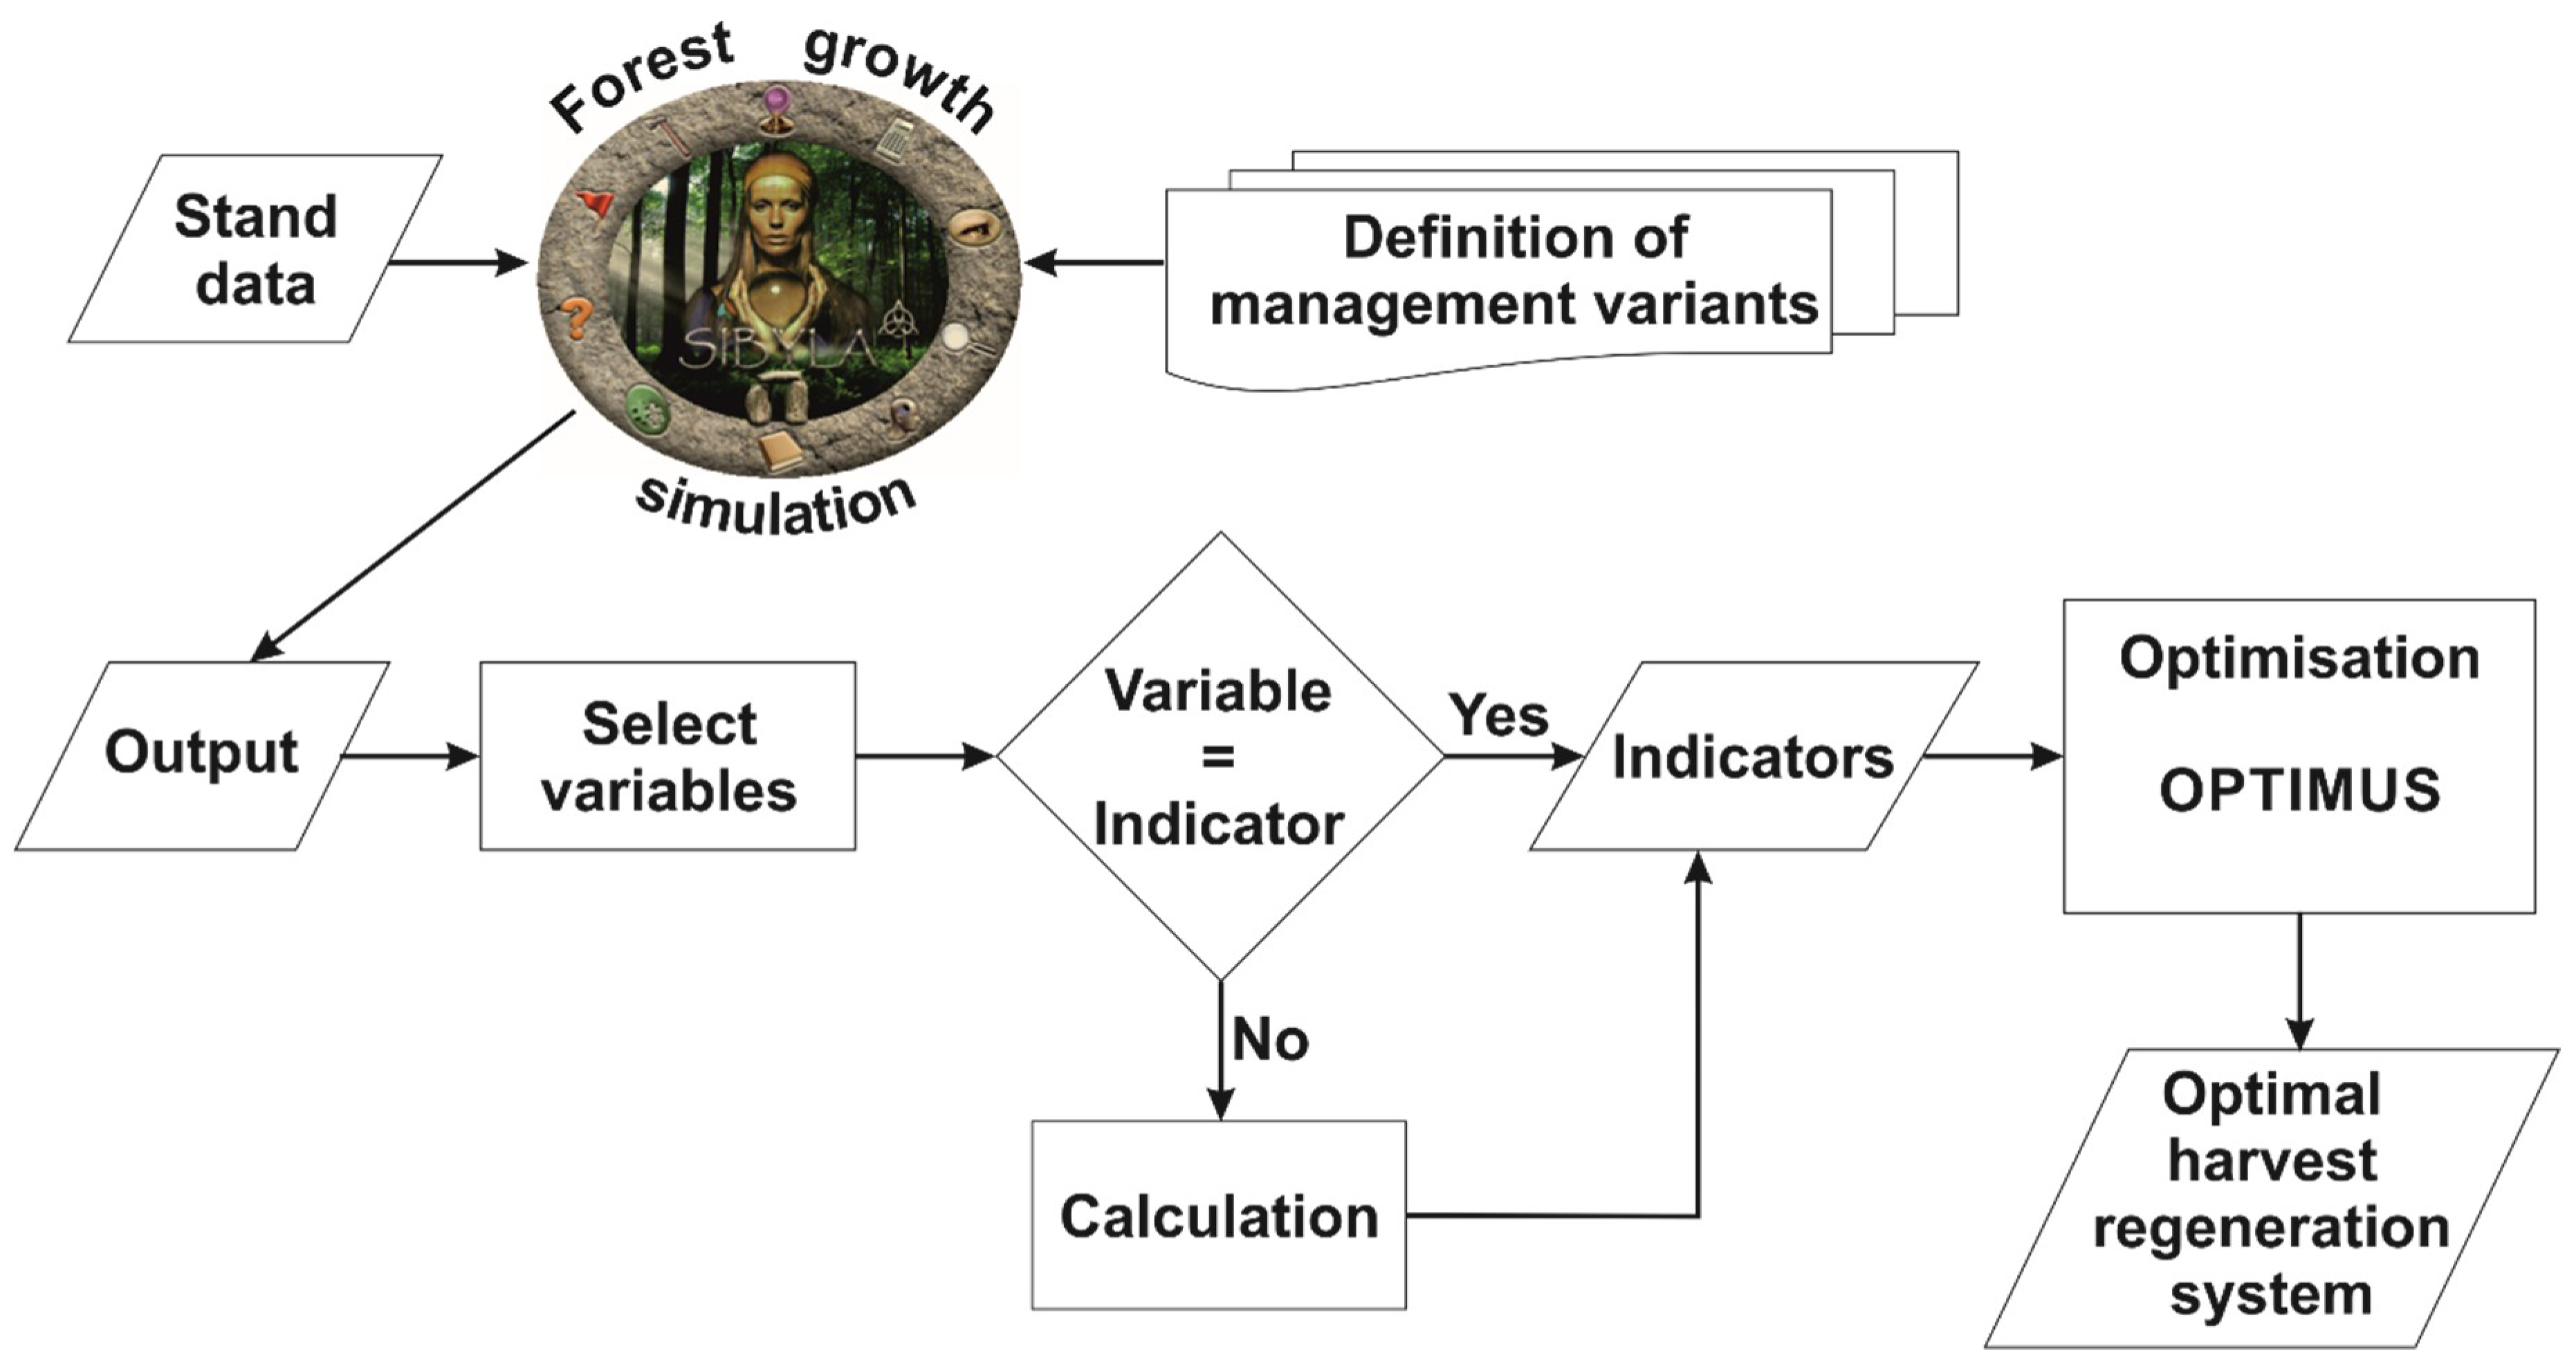
2.1. Decision Analysis Tool
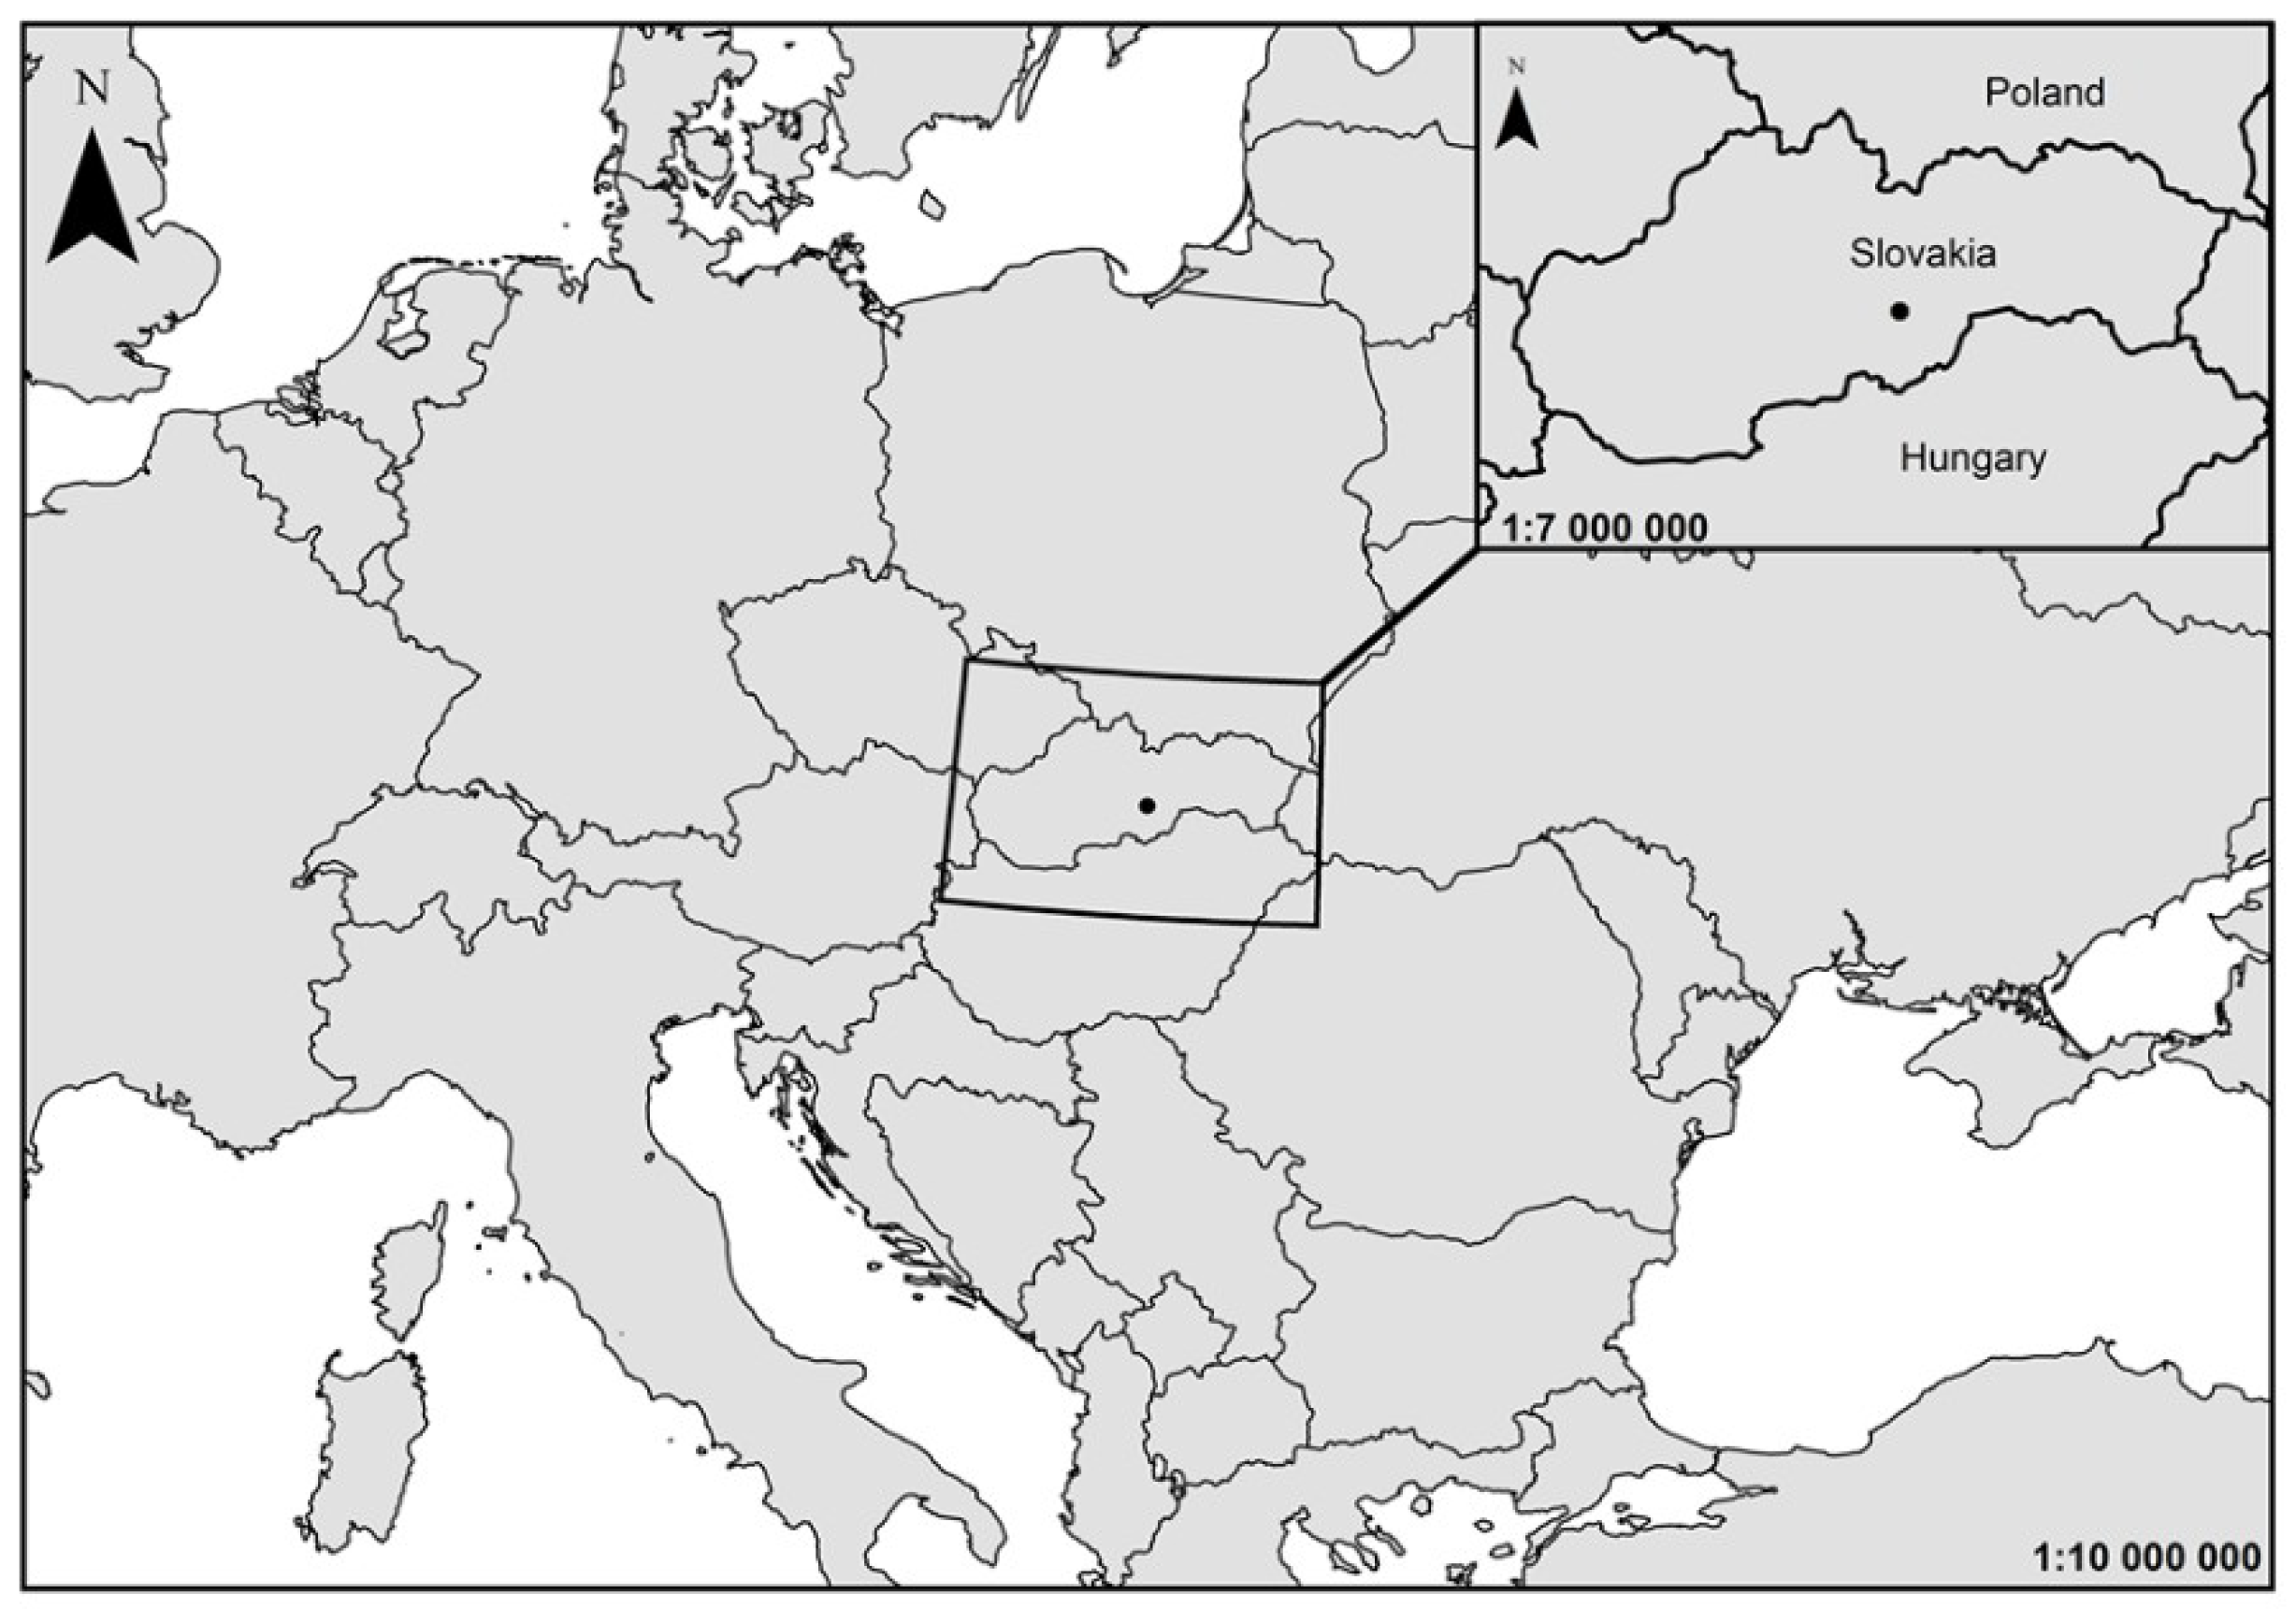
2.2. Case Study Area
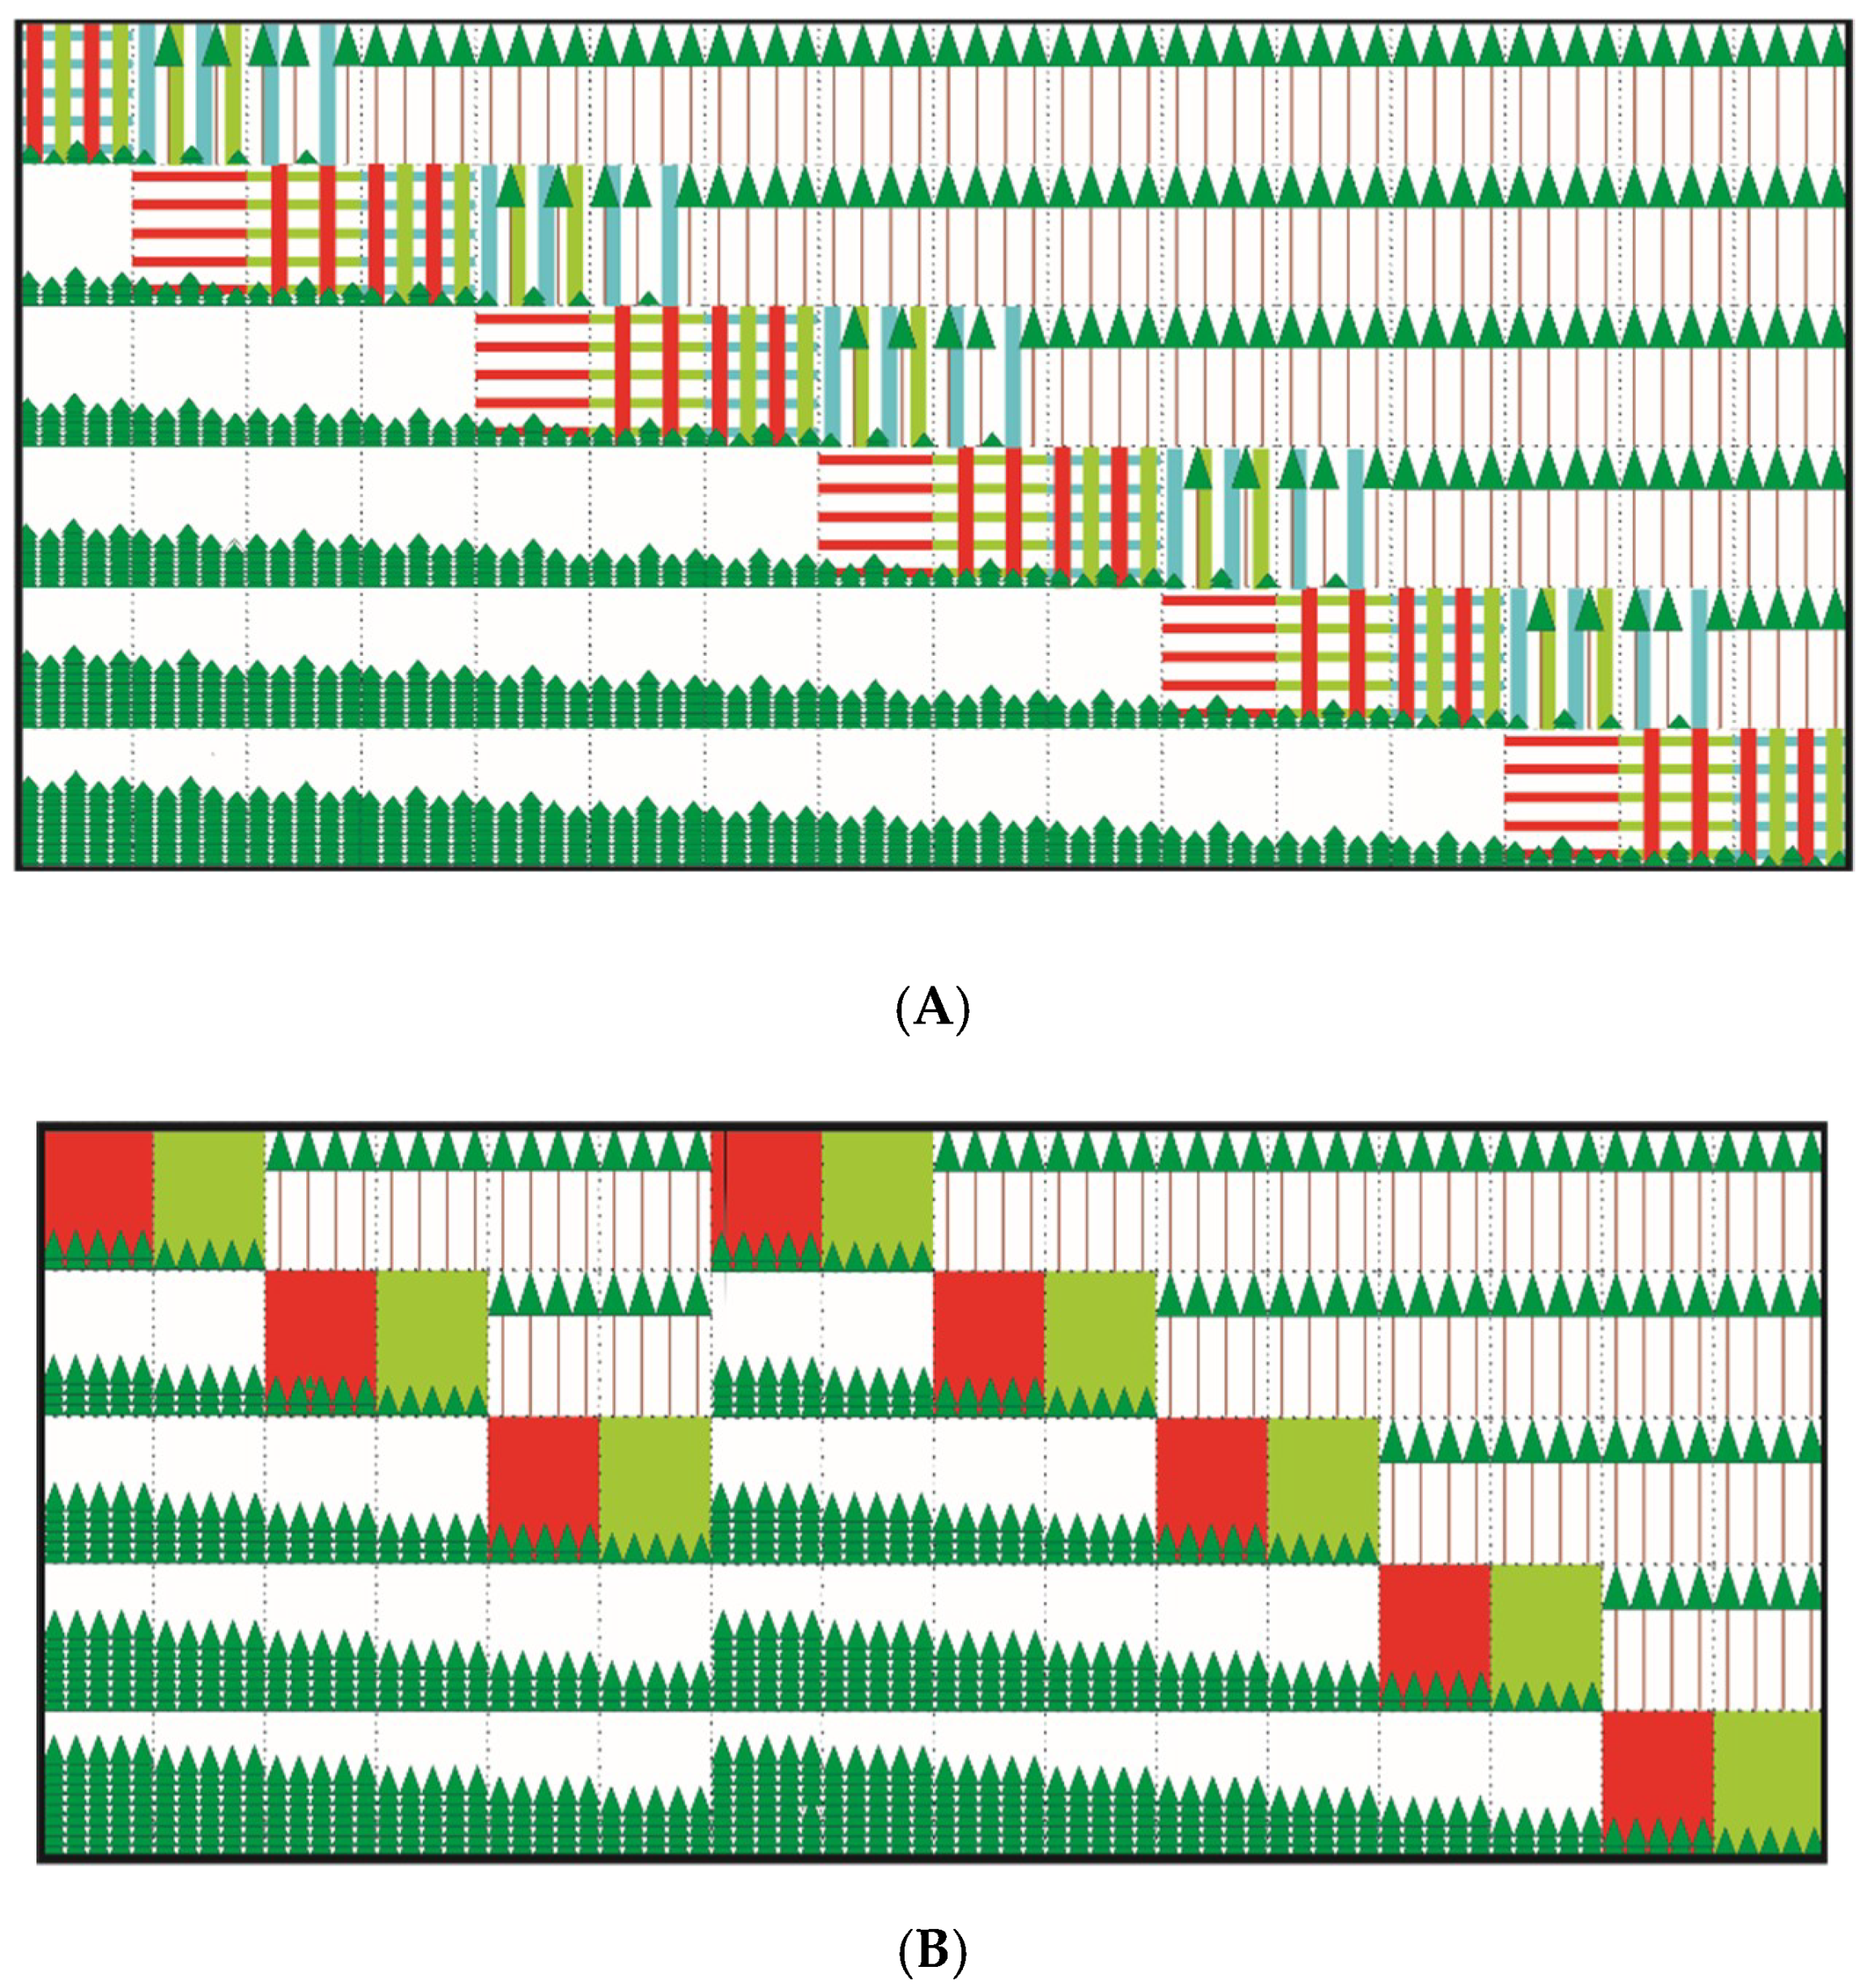
2.3. Harvest-Regeneration Variants
2.4. SIBYLA
2.5. Indicators Selected for the Multi-Criteria Decision-Making (MCDM) Process
2.5.1. Non-Production Function
- Stand stability
- Stand diversity
2.5.2. Production Function
2.6. Multi-Criteria Optimisation
2.6.1. Weighted Summation Method
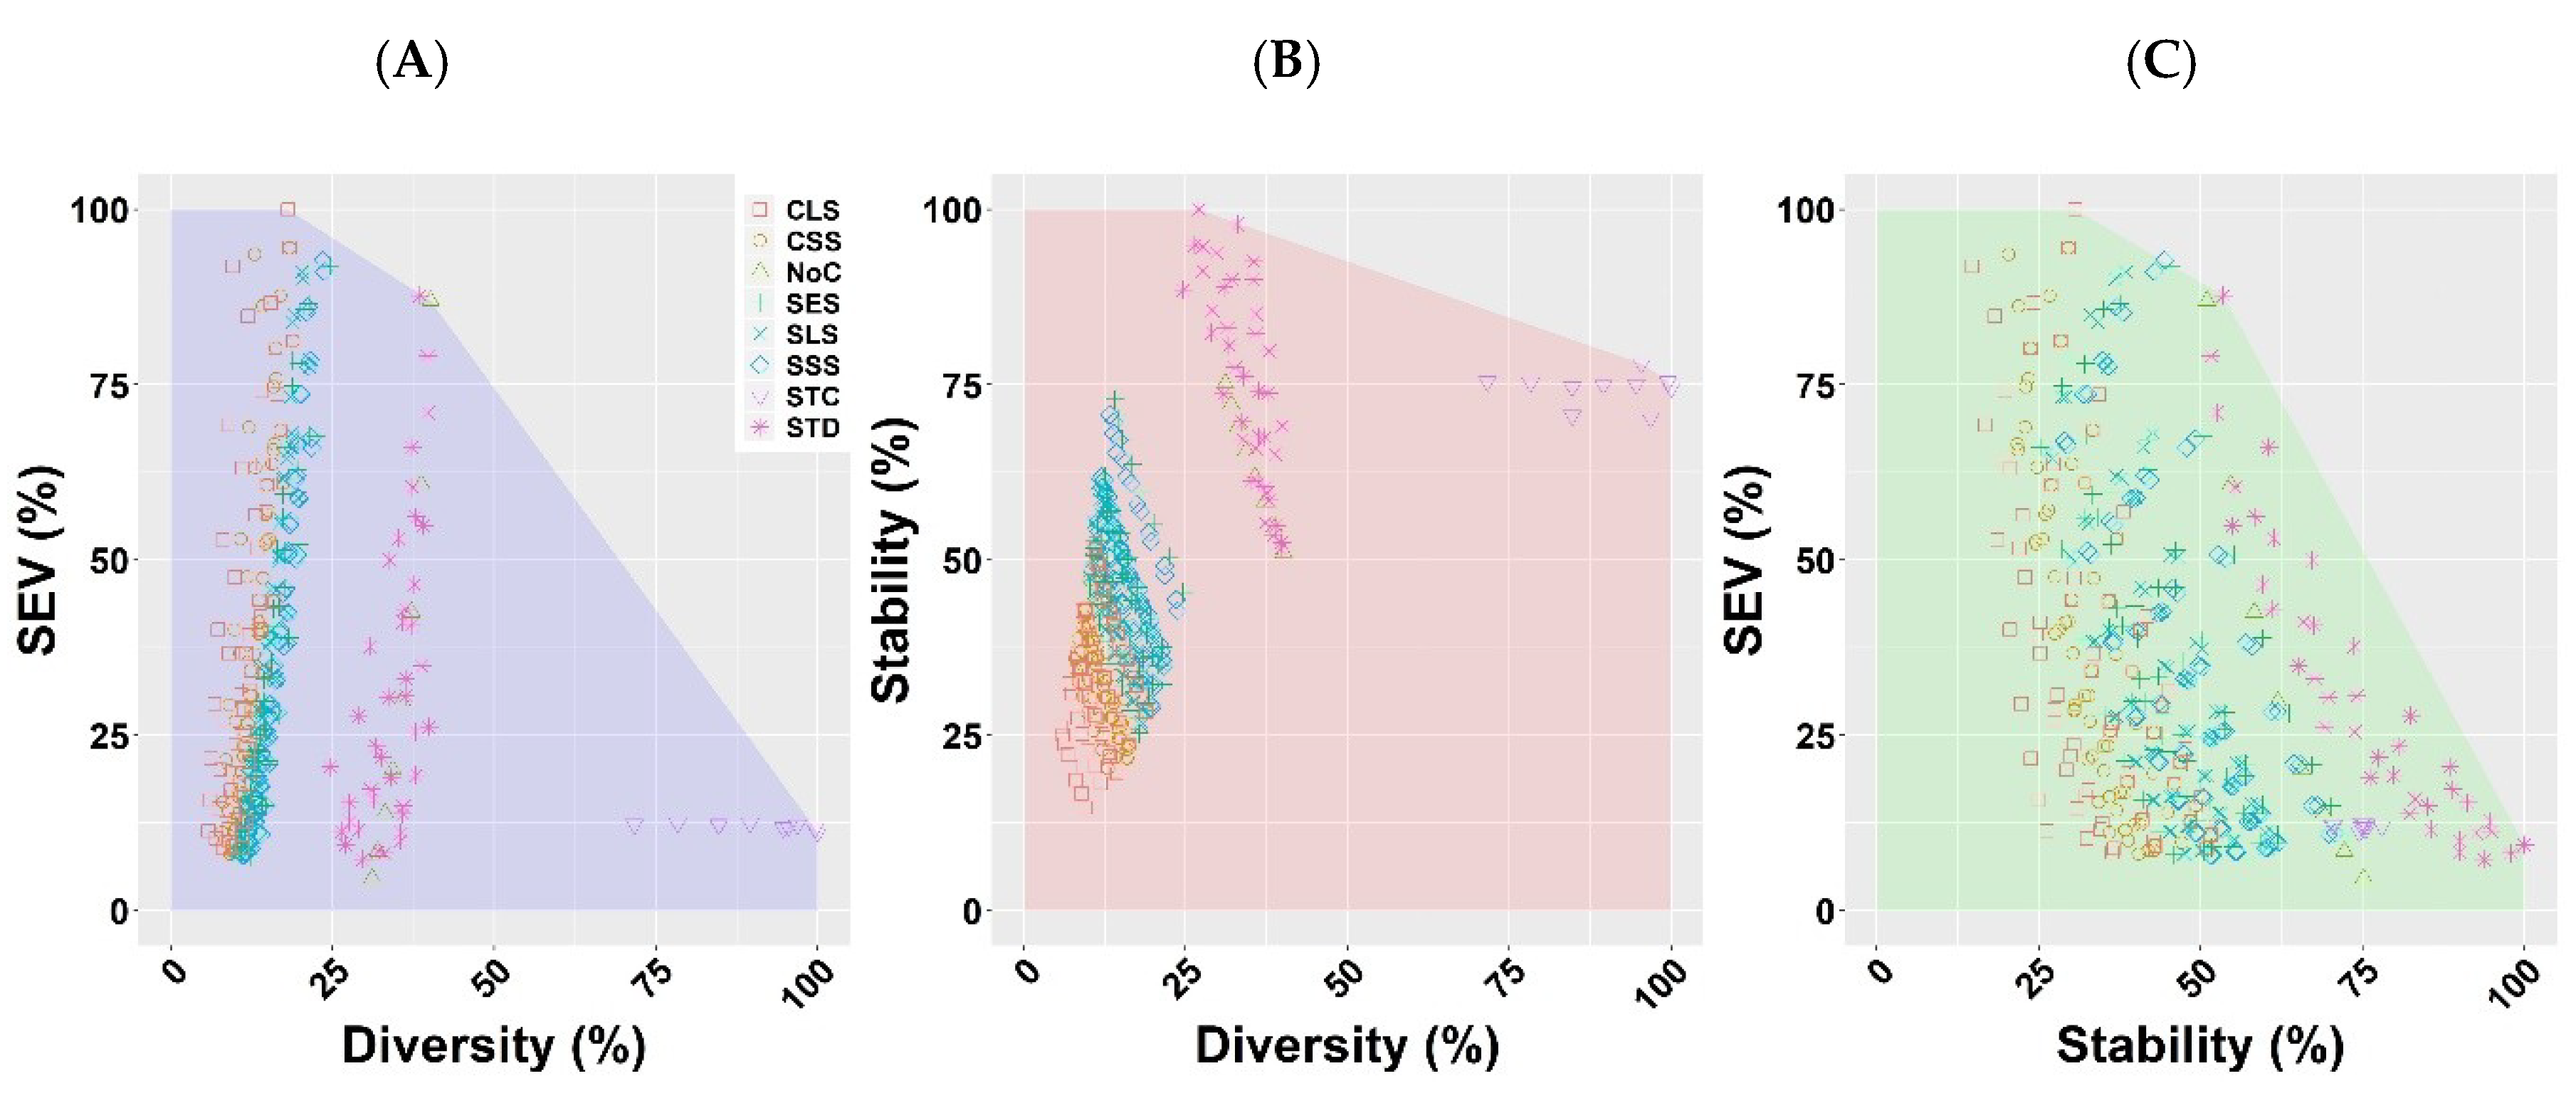
2.6.2. Pareto Front
3. Results
4. Discussion
5. Conclusions
Supplementary Materials
Author Contributions
Funding
Conflicts of Interest
References
- Puettmann, K.J.; Coates, K.D.; Messier, C.C. A Critique of Silviculture: Managing for Complexity; Island Press: Washington, DC, USA, 2008; ISBN 978-1-59726-145-6. [Google Scholar]
- Grilli, G.; Jonkisz, J.; Ciolli, M.; Lesinski, J. Mixed forests and ecosystem services: Investigating stakeholders’ perceptions in a case study in the Polish Carpathians. For. Policy Econ. 2016, 66, 11–17. [Google Scholar] [CrossRef]
- von Teuffel, K.; Heinrich, B.; Baumgarten, M. Present distribution of secondary Norway spruce in Europe. In Norway Spruce Conversion-Options and Consequences; Spiecker, H., Hansen, J., Klimo, E., Skovsgaard, J.P., Sterba, H., von Teuffel, K., Eds.; EFI Research Report; Brill Academic Publ.: Leiden, The Netherlands, 2004; Volume 18, pp. 63–96. [Google Scholar]
- Seidl, R.; Rammer, W.; Lasch, P.; Badeck, F.; Lexer, M.J. Does conversion of even-aged, secondary coniferous forests affect carbon sequestration? A simulation study under changing environmental conditions. Silva Fenn. 2008, 42, 369. [Google Scholar] [CrossRef] [Green Version]
- Spiecker, H.; Hansen, J.; Klimo, E.; Skovsgaard, J.P.; Sterba, H.; von Teuffel, K. Norway Spruce Conversion: Options and Consequences; EFI Research Report; Brill: Leiden, The Netherlands, 2004; Volume 18. [Google Scholar]
- Gadow, K.V.; Kurttila, M.; Leskinen, P.; Leskinen, L.; Nuutinen, T.; Pukkala, T. Designing forested landscapes to provide multiple services. Cab Rev. Perspect. Agric. Vet. Sci. Nutr. Nat. Resour. 2007, 2007, 1–15. [Google Scholar] [CrossRef]
- Rosser, J.B. Special problems of forests as ecologic-economic systems. For. Policy Econ. 2013, 35, 31–38. [Google Scholar] [CrossRef]
- Diaz-Balteiro, L.; Romero, C. Making forestry decisions with multiple criteria: A review and an assessment. For. Ecol. Manag. 2008, 255, 3222–3241. [Google Scholar] [CrossRef]
- Priesol, A.; Polák, L. Hospodárska Úprava Lesov (Forest Management); Príroda: Bratislava, Slovakia, 1991; ISBN 80-07-00430-0. [Google Scholar]
- Paletto, A.; Ferretti, F.; Cantiani, P.; Meo, I.D. Multi-functional approach in forest landscape management planning: An application in Southern Italy. For. Syst. 2012, 21, 68–80. [Google Scholar] [CrossRef] [Green Version]
- Reynolds, K.M.; Twery, M.; Lexer, M.J.; Vacik, H.; Ray, D.; Shao, G.; Borges, J.G. Decision support systems in forest management. In Handbook on Decision Support Systems 2; Springer: Berlin/Heidelberg, Germany, 2008; pp. 499–533. [Google Scholar]
- Borges, J.; Nordström, E.M.; Garcia-Gonzalo, J.; Hujala, T.; Trasobares, A. Computer-Based Tools for Supporting Forest Management. The Experience and the Expertise World-Wide; Report EU FP7 (Cost and Marie Curie Project ForEAdapt); Dept of Forest Resource Management, Swedish University of Agricultural Sciences: Ulmea, Sweden, 2014; ISBN 978-91-576-9236-8. [Google Scholar]
- Segura, M.; Ray, D.; Maroto, C. Decision support systems for forest management: A comparative analysis and assessment. Comput. Electron. Agric. 2014, 101, 55–67. [Google Scholar] [CrossRef]
- Ananda, J.; Herath, G. A critical review of multi-criteria decision making methods with special reference to forest management and planning. Ecol. Econ. 2009, 68, 2535–2548. [Google Scholar] [CrossRef]
- Borges, J.; Garcia-Gonzalo, J.; Bushenkov, V.; Mcdill, M.E.; Marques, S.; Oliveira, M.M. Addressing Multicriteria Forest Management with Pareto Frontier Methods: An Application in Portugal. For. Sci. 2014, 60, 63–72. [Google Scholar] [CrossRef] [Green Version]
- Castelletti, A.; Lotov, A.V.; Soncini-Sessa, R. Visualization-based multi-objective improvement of environmental decision-making using linearization of response surfaces. Environ. Model. Softw. 2010, 25, 1552–1564. [Google Scholar] [CrossRef]
- Tóth, S.F.; McDill, M.E. Finding Efficient Harvest Schedules under Three Conflicting Objectives. For. Sci. 2009, 55, 117–131. [Google Scholar] [CrossRef]
- Marto, M.; Reynolds, K.; Borges, J.; Bushenkov, V.; Marques, S.; Marto, M.; Reynolds, K.M.; Borges, J.G.; Bushenkov, V.A.; Marques, S. Combining Decision Support Approaches for Optimizing the Selection of Bundles of Ecosystem Services. Forests 2018, 9, 438. [Google Scholar] [CrossRef] [Green Version]
- Kangas, J.; Kangas, A.; Leskinen, P.; Pykäläinen, J. MCDM methods in strategic planning of forestry on state-owned lands in Finland: Applications and experiences. J. Multi-Criteria Decis. Anal. 2001, 10, 257–271. [Google Scholar] [CrossRef]
- Kangas, J.; Kangas, A. Multiple criteria decision support in forest management - the approach, methods applied, and experiences gained. For. Ecol. Manag. 2005, 207, 133–143. [Google Scholar] [CrossRef]
- Lotov, A.; Bushenkov, V.; Kamenev, G. Interactive Decision Maps: Approximation and Visualization of Pareto Frontier; Kluwer Academic Publishers: Berlin, Germany, 2004; ISBN 1-4020-7631-2. [Google Scholar]
- Sedmák, R.; Fabrika, M.; Bahýľ, J.; Pôbiš, I.; Tuček, J. Application of simulation and optimization tools for developing forest management plans in the Slovak natural and management conditions. In Proceedings of the Implementation of DSS Tools into the Forestry Practice: Reviewed Conference Proceedings; Tuček, J., Smreček, R., Majlingová, A., Garcia-Gonzalo, J., Eds.; Technical University in Zvolen: Zvolen, Slovakia, 2013; pp. 139–152. Available online: https://www.researchgate.net/publication/259792682_Application_of_simulation_and_optimization_tools_for_developing_forest_management_plans_in_the_Slovak_natural_and_management_conditions (accessed on 21 May 2020).
- Seidl, R.; Schelhaas, M.-J.; Rammer, W.; Verkerk, P.J. Increasing forest disturbances in Europe and their impact on carbon storage. Nat. Clim. Chang. 2014, 4, 806–810. [Google Scholar] [CrossRef] [Green Version]
- Konôpka, B.; Zach, P.; Kulfan, J. Wind-An important ecological factor and destructive agent in forests. Lesn. Časopis-For. J. 2016, 62, 123–130. [Google Scholar] [CrossRef]
- Fabrika, M.; Pretzsch, H. Analýza a Modelovanie Lesných Ekosystémov; Technická Univerzita vo Zvolene: Zvolen, Slovakia, 2011; ISBN 978-80-228-0. [Google Scholar]
- Pohjanmies, T.; Triviño, M.; Le Tortorec, E.; Salminen, H.; Mönkkönen, M. Conflicting objectives in production forests pose a challenge for forest management. Ecosyst. Serv. 2017, 28, 298–310. [Google Scholar] [CrossRef] [Green Version]
- Fabrika, M. Forest Biodynamic Simulator SIBYLA, Conception, Construction and Program Solution. Ph.D. Thesis, Technical University, Zvolen, Slovakia, 2005. [Google Scholar]
- Valent, P.; Merganič, J.; Výbošťok, J. Optimus-Software for Multi-Criteria Analysis; TU Zvolen: Zvolen, Slovakia, 2018. [Google Scholar]
- Weise, W. Ertragstafeln für Die Kiefer; Springer: Berlin/Heidelberg, Germany, 1880; ISBN 978-3-662-33008-1. [Google Scholar]
- Halaj, J. Rastové Tabuľky Hlavných Drevín ČSSR; Príroda: Bratislava, Czechoslovakia, 1987. [Google Scholar]
- Matthew, J.D. Silvicultural Systems; Reprinted; Oxford University Press: New York, NY, USA, 1989; ISBN 0-19-854670-X. [Google Scholar]
- Fabrika, M.; Ďurský, J. Stromové Rastové Simulátory; EFRA–Vedecká Agentúra pre Ekológiu a Lesníctvo: Zvolen, Slovakia, 2005; ISBN 80-969434-7-2. [Google Scholar]
- Kahn, M.; Pretzsch, H. Das Wuchsmodell SILVA-Parametrisierung der Version 2.1 für Rein-und Mischbestände aus Fichte und Buche. Allgemeine Forst-und Jagdzeitung 1997, 168, 115–123. [Google Scholar]
- Bošeľa, M.; Konôpka, B.; Šebeň, V.; Vladovič, J.; Tobin, B. Modelling height to diameter ratio–an opportunity to increase Norway spruce stand stability in the Western Carpathians. For. J. 2014, 60, 71–80. [Google Scholar] [CrossRef] [Green Version]
- Vospernik, S.; Monserud, R.A.; Sterba, H. Do individual-tree growth models correctly represent height: Diameter ratios of Norway spruce and Scots pine? For. Ecol. Manag. 2010, 260, 1735–1753. [Google Scholar] [CrossRef] [Green Version]
- Dragoun, L.; Stolariková, R.; Merganič, J.; Šálek, L.; Krykorková, J. Porovnání vlivu příměsi na růstové veličiny, strukturu a stabilitu porostu borovice lesní (Pinus sylvestris L.) na antropogenních půdách sokolovského regionu / Influence of admixed tree species on growth, structure and stability of Scots pine stands on anthropogenic soils of the Sokolov region. Cent. Eur. For. J. 2015, 61, 44–51. [Google Scholar]
- Spellerberg, I.; Fedor, P. A tribute to Claude Shannon (1916–2001) and a plea for more rigorous use of species richness, species diversity and the ’Shannon–Wiener’Index. Glob. Ecol. Biogeogr. 2003, 12, 177–179. [Google Scholar] [CrossRef] [Green Version]
- Shannon, C.E.; Weaver, W. The Mathematical Theory of Communication; The University of Illinois Press: Urbana, IL, USA, 1949; pp. 1–117. [Google Scholar]
- Klemperer, W.D. Forest Resource Economics and Finance; McGraw-Hill Inc.: New York, NY, USA, 1996; ISBN 0-07-035122-8. [Google Scholar]
- Yousefpour, R.; Augustynczik, A.L.D. Uncertainty of Carbon Economy Using the Faustmann Model. J. For. Econ. 2019, 34, 99–128. [Google Scholar] [CrossRef]
- Merganic, J.; Smelko, S. Quantification of tree species diversity in forest stands-model biodiverss. Eur. J. For. Res. 2004, 123, 157–165. [Google Scholar] [CrossRef]
- Garcia-Gonzalo, J.; Bushenkov, V.; Mcdill, M.E. A Decision Support System for Assessing Trade-Offs between Ecosystem Management Goals: An Application in Portugal. Forests 2015, 6, 65–87. [Google Scholar] [CrossRef] [Green Version]
- R Core Team. R: A Language and Environment for Statistical Computing; Foundation for Statistical Computing: Vienna, Austria, 2019. [Google Scholar]
- Wickham, H. ggplot2: Elegant Graphics for Data Analysis; Springer-Verlag: New York, NY, USA, 2016; ISBN 978-3-319-24277-4. [Google Scholar]
- Hamilton, N.E.; Ferry, M. ggtern: Ternary Diagrams Using ggplot2. J. Stat. Softw. Code Snippets 2018, 87, 1–17. [Google Scholar] [CrossRef] [Green Version]
- O’Hara, K.L. The historical development of uneven-aged silviculture in North America. Forestry 2002, 75, 339–346. [Google Scholar] [CrossRef]
- Pukkala, T. Which type of forest management provides most ecosystem services? For. Ecosyst. 2016, 3, 9. [Google Scholar] [CrossRef] [Green Version]
- Marchi, M.; Paletto, A.; Cantiani, P.; Bianchetto, E.; De Meo, I. Comparing Thinning System Effects on Ecosystem Services Provision in Artificial Black Pine (Pinus nigra J. F. Arnold) Forests. Forests 2018, 9, 188. [Google Scholar] [CrossRef] [Green Version]
- Jactel, H.; Nicoll, B.C.; Branco, M.; Gonzalez-Olabarria, J.R.; Grodzki, W.; Långström, B.; Moreira, F.; Netherer, S.; Orazio, C.; Piou, D.; et al. The influences of forest stand management on biotic and abiotic risks of damage. Ann. For. Sci. 2009, 66, 701. [Google Scholar] [CrossRef]
- Schütz, J.-P.; Saniga, M.; Diaci, J.; Vrška, T. Comparing close-to-nature silviculture with processes in pristine forests: Lessons from Central Europe. Ann. For. Sci. 2016, 73, 911–921. [Google Scholar] [CrossRef] [Green Version]
- Cameron, A.D. Importance of early selective thinning in the development of long-term stand stability and improved log quality: A review. Forestry 2002, 75, 25–35. [Google Scholar] [CrossRef]
- Lähde, E.; Laiho, O.; Lin, C.J. Silvicultural alternatives in an uneven-sized forest dominated by Picea abies. J. For. Res. 2010, 15, 14–20. [Google Scholar] [CrossRef]
- Reininger, H. Zielstärken-Nutzung Oder Die Plenterung des Altersklassenwaldes; 4. Aufl.; Österreichischer Agrarverlag: Wien, Austria, 1989; ISBN 3-7040-1042-1. [Google Scholar]
- Klepac, D. Novi Sistem Uredzivanja Suma Prebornih Suma; Poljuprivredna Sumarska Komora, NR Hrvatske, Sekcija za Sumarstvo: Zagreb, Croatia, 1961. [Google Scholar]
- Palmer, S. Von der Auslesedurchforstung zur Zieldurchmesser-Ernte bei Buche. Allgemeine Forstzeitschrift 1994, 49, 528–531. [Google Scholar]
- Tarp, P.; Buongiorno, J.; Helles, F.; Larsen, J.B.; Meilby, H.; Strange, N. Economics of converting an even-aged Fagus sylvatica stand to an uneven-aged stand using target diameter harvesting. Scand. J. For. Res. 2005, 20, 63–74. [Google Scholar] [CrossRef]
- Knoke, T.; Ammer, C.; Stimm, B.; Mosandl, R. Admixing broadleaved to coniferous tree species: A review on yield, ecological stability and economics. Eur. J. For. Res. 2008, 127, 89–101. [Google Scholar] [CrossRef]
- Duduman, G. A forest management planning tool to create highly diverse uneven-aged stands. Forestry 2011, 84, 301–314. [Google Scholar] [CrossRef]
- Barreiro, S.; Garcia-Gonzalo, J.; Borges, J.G.; Tomé, M.; Marques, S. SADfLOR Tutorial. A Web-Based Forest and Natural Resources Decision Support System; FORCHANGE ISA: Lisboa, Portugal, 2013; p. 39. [Google Scholar]
- Deckmyn, G.; Verbeeck, H.; Op de Beeck, M.; Vansteenkiste, D.; Steppe, K.; Ceulemans, R. ANAFORE: A stand-scale process-based forest model that includes wood tissue development and labile carbon storage in trees. Ecol. Model. 2008, 215, 345–368. [Google Scholar] [CrossRef]
- Wikström, P.; Edenius, L.; Elfving, B.; Eriksson, L.O.; LäMåS, T.; Sonesson, J.; ÖHMAN, K.; Wallerman, J.; Waller, C.; Klintebäck, F. The Heureka Forestry Decision Support System: An Overview. Math. Comput. For. Nat.-Resour. Sci. 2011, 3, 87–94. [Google Scholar]
- Muys, B.; Hynynen, J.; Palahi, M.; Lexer, M.J.; Fabrika, M.; Pretzsch, H.; Gillet, F.; Briceño, E.; Nabuurs, G.-J.; Kint, V. Simulation tools for decision support to adaptive forest management in Europe. For. Syst. 2010, 19, 86–99. [Google Scholar] [CrossRef] [Green Version]
- Messier, C.; Puettmann, K.; Filotas, E.; Coates, D. Dealing with Non-linearity and Uncertainty in Forest Management. Curr. For. Rep. 2016, 2, 150–161. [Google Scholar] [CrossRef] [Green Version]
- Fabrika, M. Modelling of Forest Production at Climate Change by Growth Model Sibyla; Střelcová, K., Škvarenina, J., Blaženec, M., Eds.; Bioclimatology and Natural Hazards; Česká Bioklimatologická Společnost: Praha, Czech Republic, 2007; pp. 56–68. [Google Scholar]
- Kahn, M. Modellierung der Höhenentwicklung Ausgewählter Baumarten in Abhängigkeit vom Standort; Forstliche Forschungsberichte; Forstwissenschaftliche Fakultät der Universität München und der Bayer. Forstlichen Versuchs-und Forschungsanstalt: München, Germany, 1994; Volume 141, p. 221. [Google Scholar]
- Yousefpour, R.; Temperli, C.; Jacobsen, J.B.; Thorsen, B.J.; Meilby, H.; Lexer, M.J.; Lindner, M.; Bugmann, H.; Borges, J.G.; Palma, J.H.N.; et al. A framework for modeling adaptive forest management and decision making under climate change. Ecol. Soc. 2017, 22. [Google Scholar] [CrossRef]
- Ambroz, R.; Vacek, S.; Vacek, Z.; Král, J.; Štefančík, I. Current and simulated structure, growth parameters and regeneration of beech forests with different game management in the Lány Game Enclosure. For. J. 2015, 61, 78–88. [Google Scholar] [CrossRef] [Green Version]
- Vacek, S.; Vacek, Z.; Bílek, L.; Nosková, I.; Schwarz, O. Structure and development of forest stands on permanent research plots in the Krkonoše Mts. J. For. Sci. 2010, 56, 555–569. [Google Scholar] [CrossRef] [Green Version]
- Horemans, J.A.; Bosela, M.; Dobor, L.; Barna, M.; Bahyl, J.; Deckmyn, G.; Fabrika, M.; Sedmak, R.; Ceulemans, R. Variance decomposition of predictions of stem biomass increment for European beech: Contribution of selected sources of uncertainty. For. Ecol. Manag. 2016, 361, 46–55. [Google Scholar] [CrossRef]
- Kobliha, J.; Stejskal, J.; Lstibůrek, M.; Marušák, R.; Slávik, M. Selection of European larch provenances based on productivity and economic values. J. For. Sci. 2013, 59, 424–435. [Google Scholar] [CrossRef] [Green Version]
- Simoncic, T.; Spies, T.; Deal, R.; Boncina, A. A Conceptual Framework for Characterizing Forest Areas with High Societal Values: Experiences from the Pacific Northwest of USA and Central Europe. Environ. Manag. 2015, 56. [Google Scholar] [CrossRef]
- Deal, R.L.; Cochran, B.; LaRocco, G. Bundling of ecosystem services to increase forestland value and enhance sustainable forest management. For. Policy Econ. 2012, 17, 69–76. [Google Scholar] [CrossRef]
- Ryan, M.; O’Donoghue, C.; Phillips, H. Modelling Financially Optimal Afforestation and Forest Management Scenarios Using a Bio-Economic Model. OJF 2016, 6, 19–38. [Google Scholar] [CrossRef] [Green Version]
- Hesse, H. Nutzen-Kosten-Analyse. In Handwörterbuch der Wirtschaftswissenschaft; Albers, W., Zottmann, A., Eds.; J.C.B.Mohr (Paul Siebeck): Tübingen, Germany, 1979; Volume Band 5, pp. 361–382. [Google Scholar]
- Holécy, J. Bezriziková výnosová miera projektov hospodárenia na lesnej pôde a jej interpretácia. J. For. Sci. 1999, 45, 496–506. [Google Scholar]


| Tree Species | Tree Species Share from Basal Area (%) | Diameter at Breast Height (cm) * | Tree Height (m) * | Site Index ** |
|---|---|---|---|---|
| Picea abies (L.) Karst. | 80 | 34 | 29 | 38 |
| Larix decidua Mill. | 10 | 34 | 27 | 34 |
| Acer pseudoplatanus (L.) | 5 | 33 | 27 | 36 |
| Fagus sylvatica (L.) | 5 | 35 | 28 | 38 |
| Harvest-Regeneration System | Regeneration Form | Specification of Regeneration Variants | Number of Variants | Abbreviation | ||||
|---|---|---|---|---|---|---|---|---|
| No. of Phases | No. of Cuttings Per Decade | Regeneration | Rotation | |||||
| Period [Years] | Period [Years] | |||||||
| Even-aged systems | Clearcutting | Large scale (area >2 ha, width of cutting area >2 mean stand heights) | 1 | 20, 30, 40, 50, 60 | 90, 100, 110, 120, 130, 140, 150, 160 | 40 | CLS | |
| 2 | 10, 20, 30, 40 | 32 | ||||||
| Small scale (area = 1 ha, width of cutting area <2 mean stand heights) | 2 | 2 | 20, 30, 40, 50, 60 | 40 | CSS | |||
| 3 | 3 | 40 | ||||||
| Shelterwood | Large scale (area >2 ha, width of cutting area >2 mean stand heights) | 2 | 2 | 40 | SLS | |||
| 3 | 3 | 40 | ||||||
| Small scale (area = 1 ha, width of cutting area <2 mean stand heights) | 2 | 2 | 40 | SSS | ||||
| 3 | 3 | 40 | ||||||
| Expanding small scale (area = 1 ha, width of cutting area <2 mean heights) | 2 | 2 | 40 | SES | ||||
| 3 | 3 | 40 | ||||||
| Target diameter * (area = 1 ha, width of cutting area >2 mean stand heights) | Target diameter: Spruce = 50 cm, Larch = 40 cm, Maple = 45 cm, Beech = 45 cm | 10, 20, 30, 40, 50, 60 | 40 | STD | ||||
| Uneven-aged systems | Selection | Single tree cutting ** | Target diameter for all tree species: 60 cm, 65 cm, 70 cm, 75 cm, 80 cm | 10 | STC | |||
| Number of target trees: 1 per hectare, 2 per hectare | ||||||||
| No cutting *** | Age: 90, 100, 110, 120, 130, 140, 150, 160 years | 8 | NoC | |||||
| ∑ 450 | ||||||||
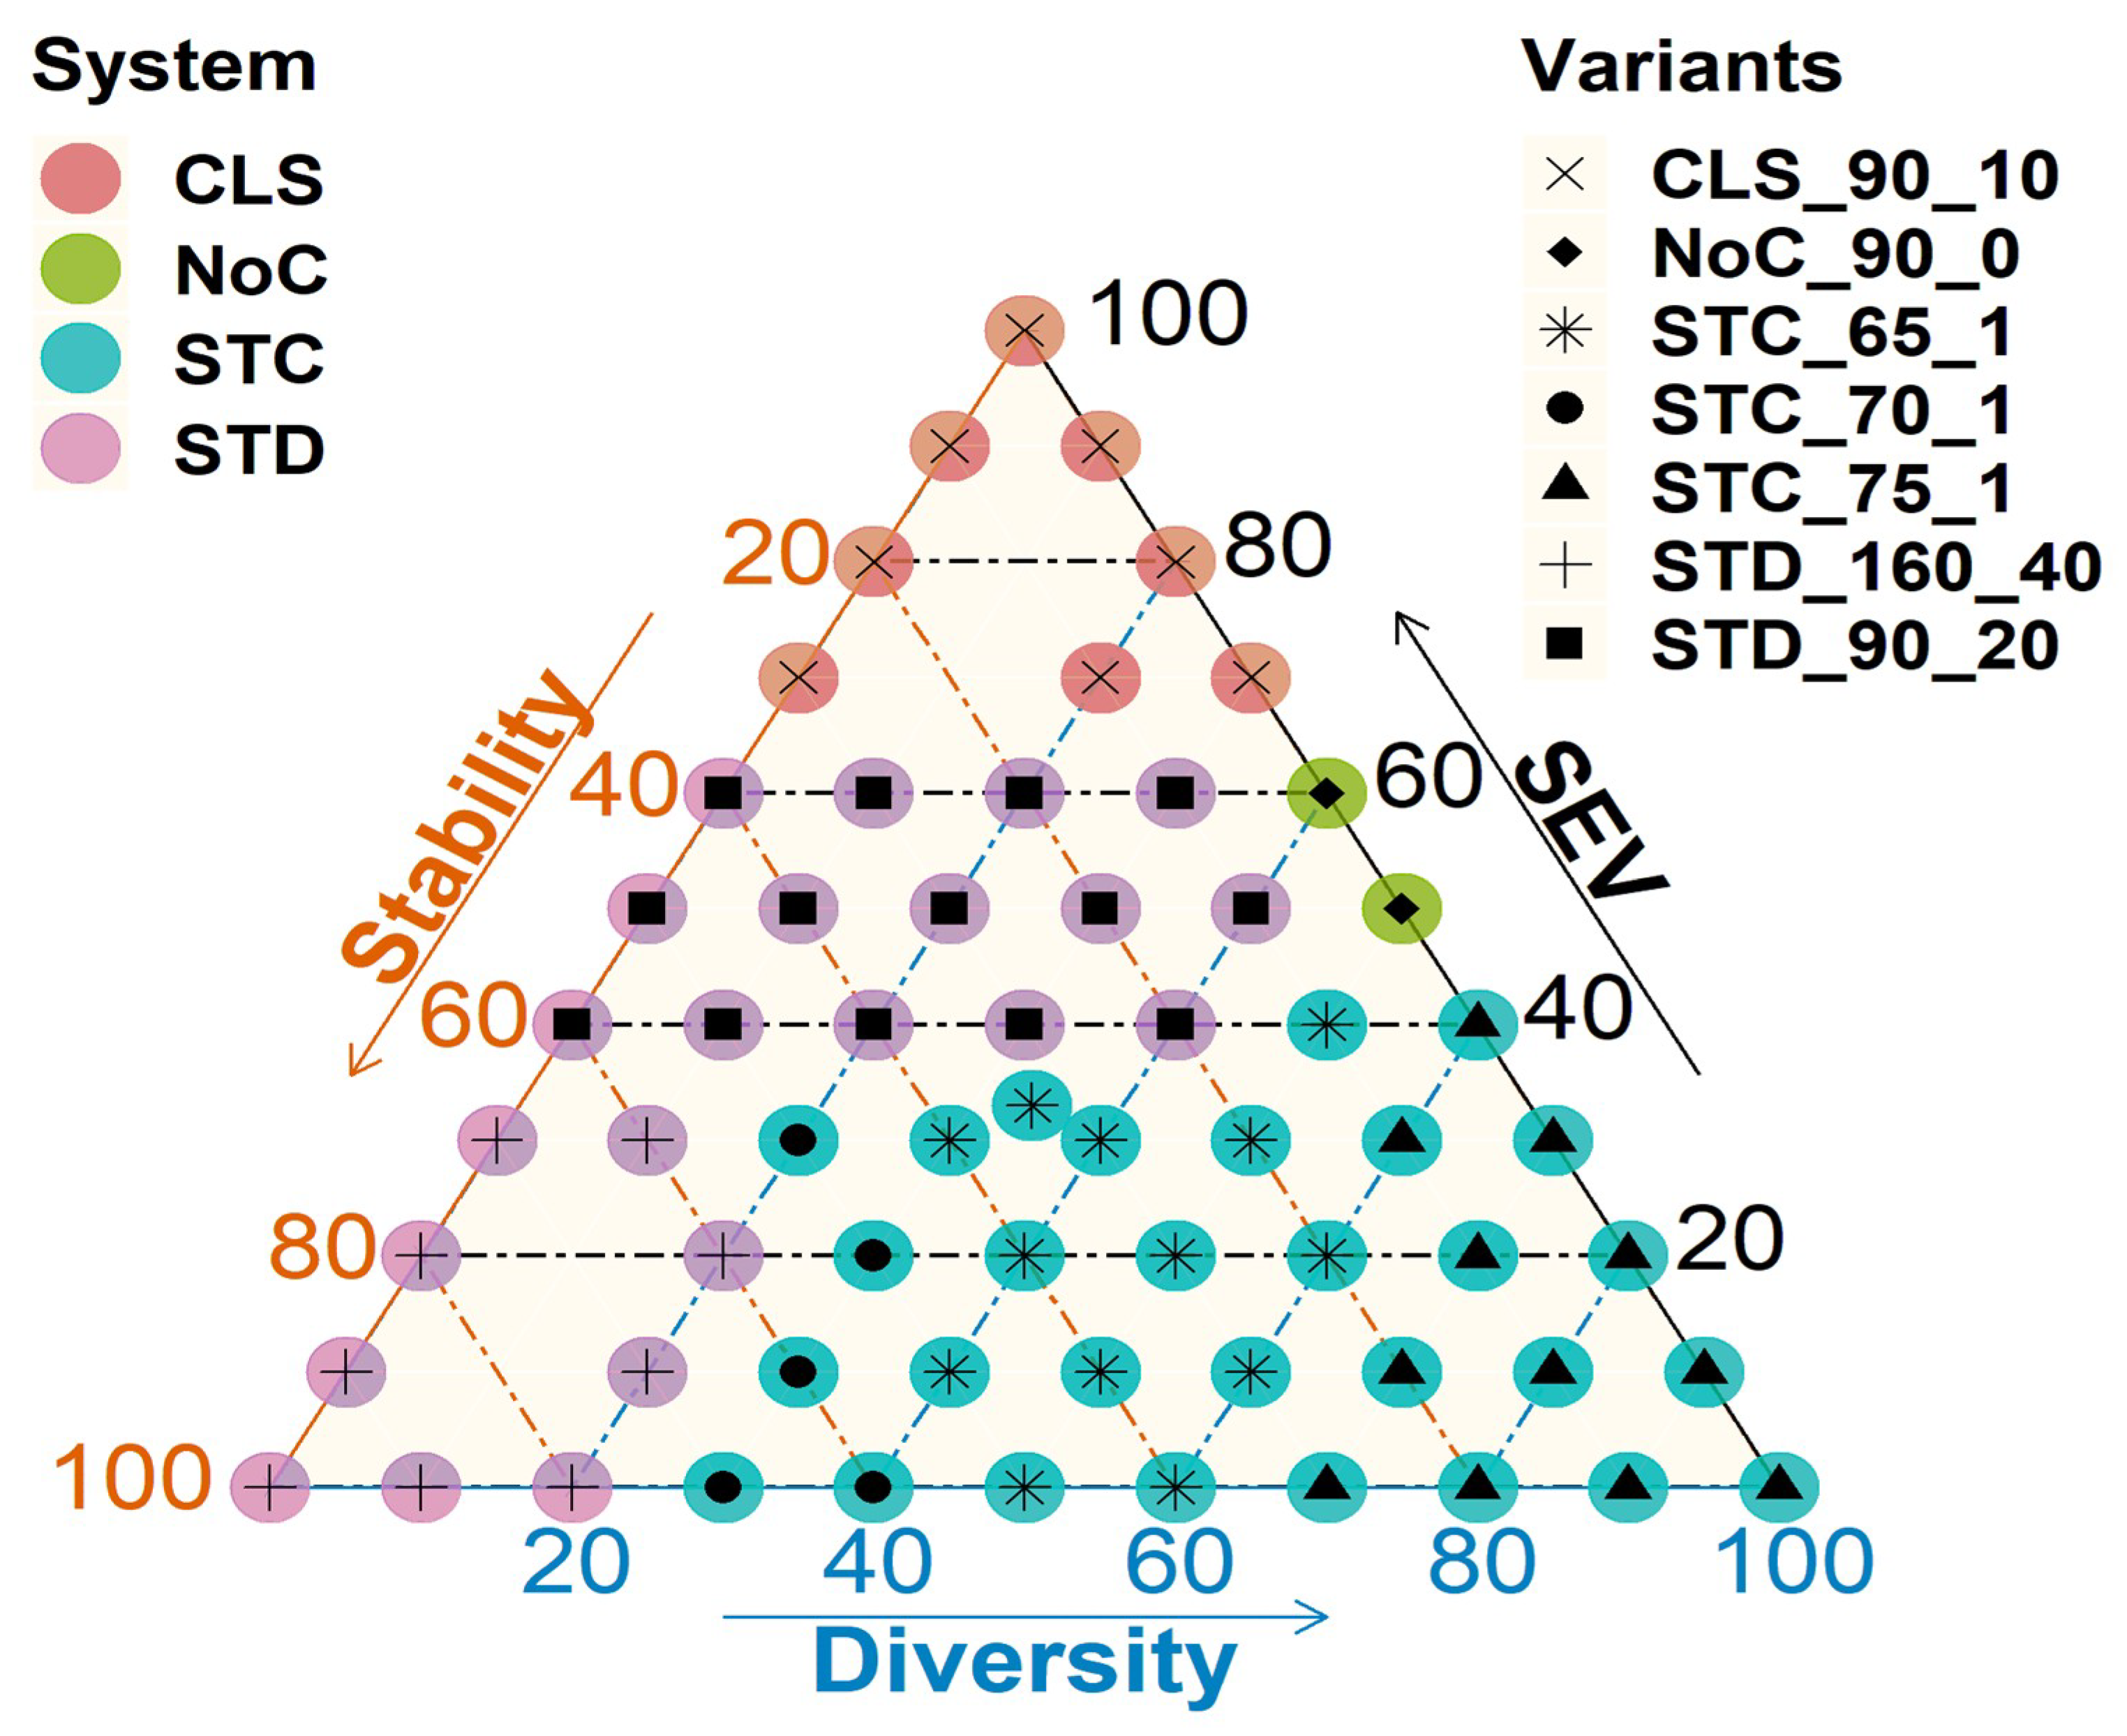
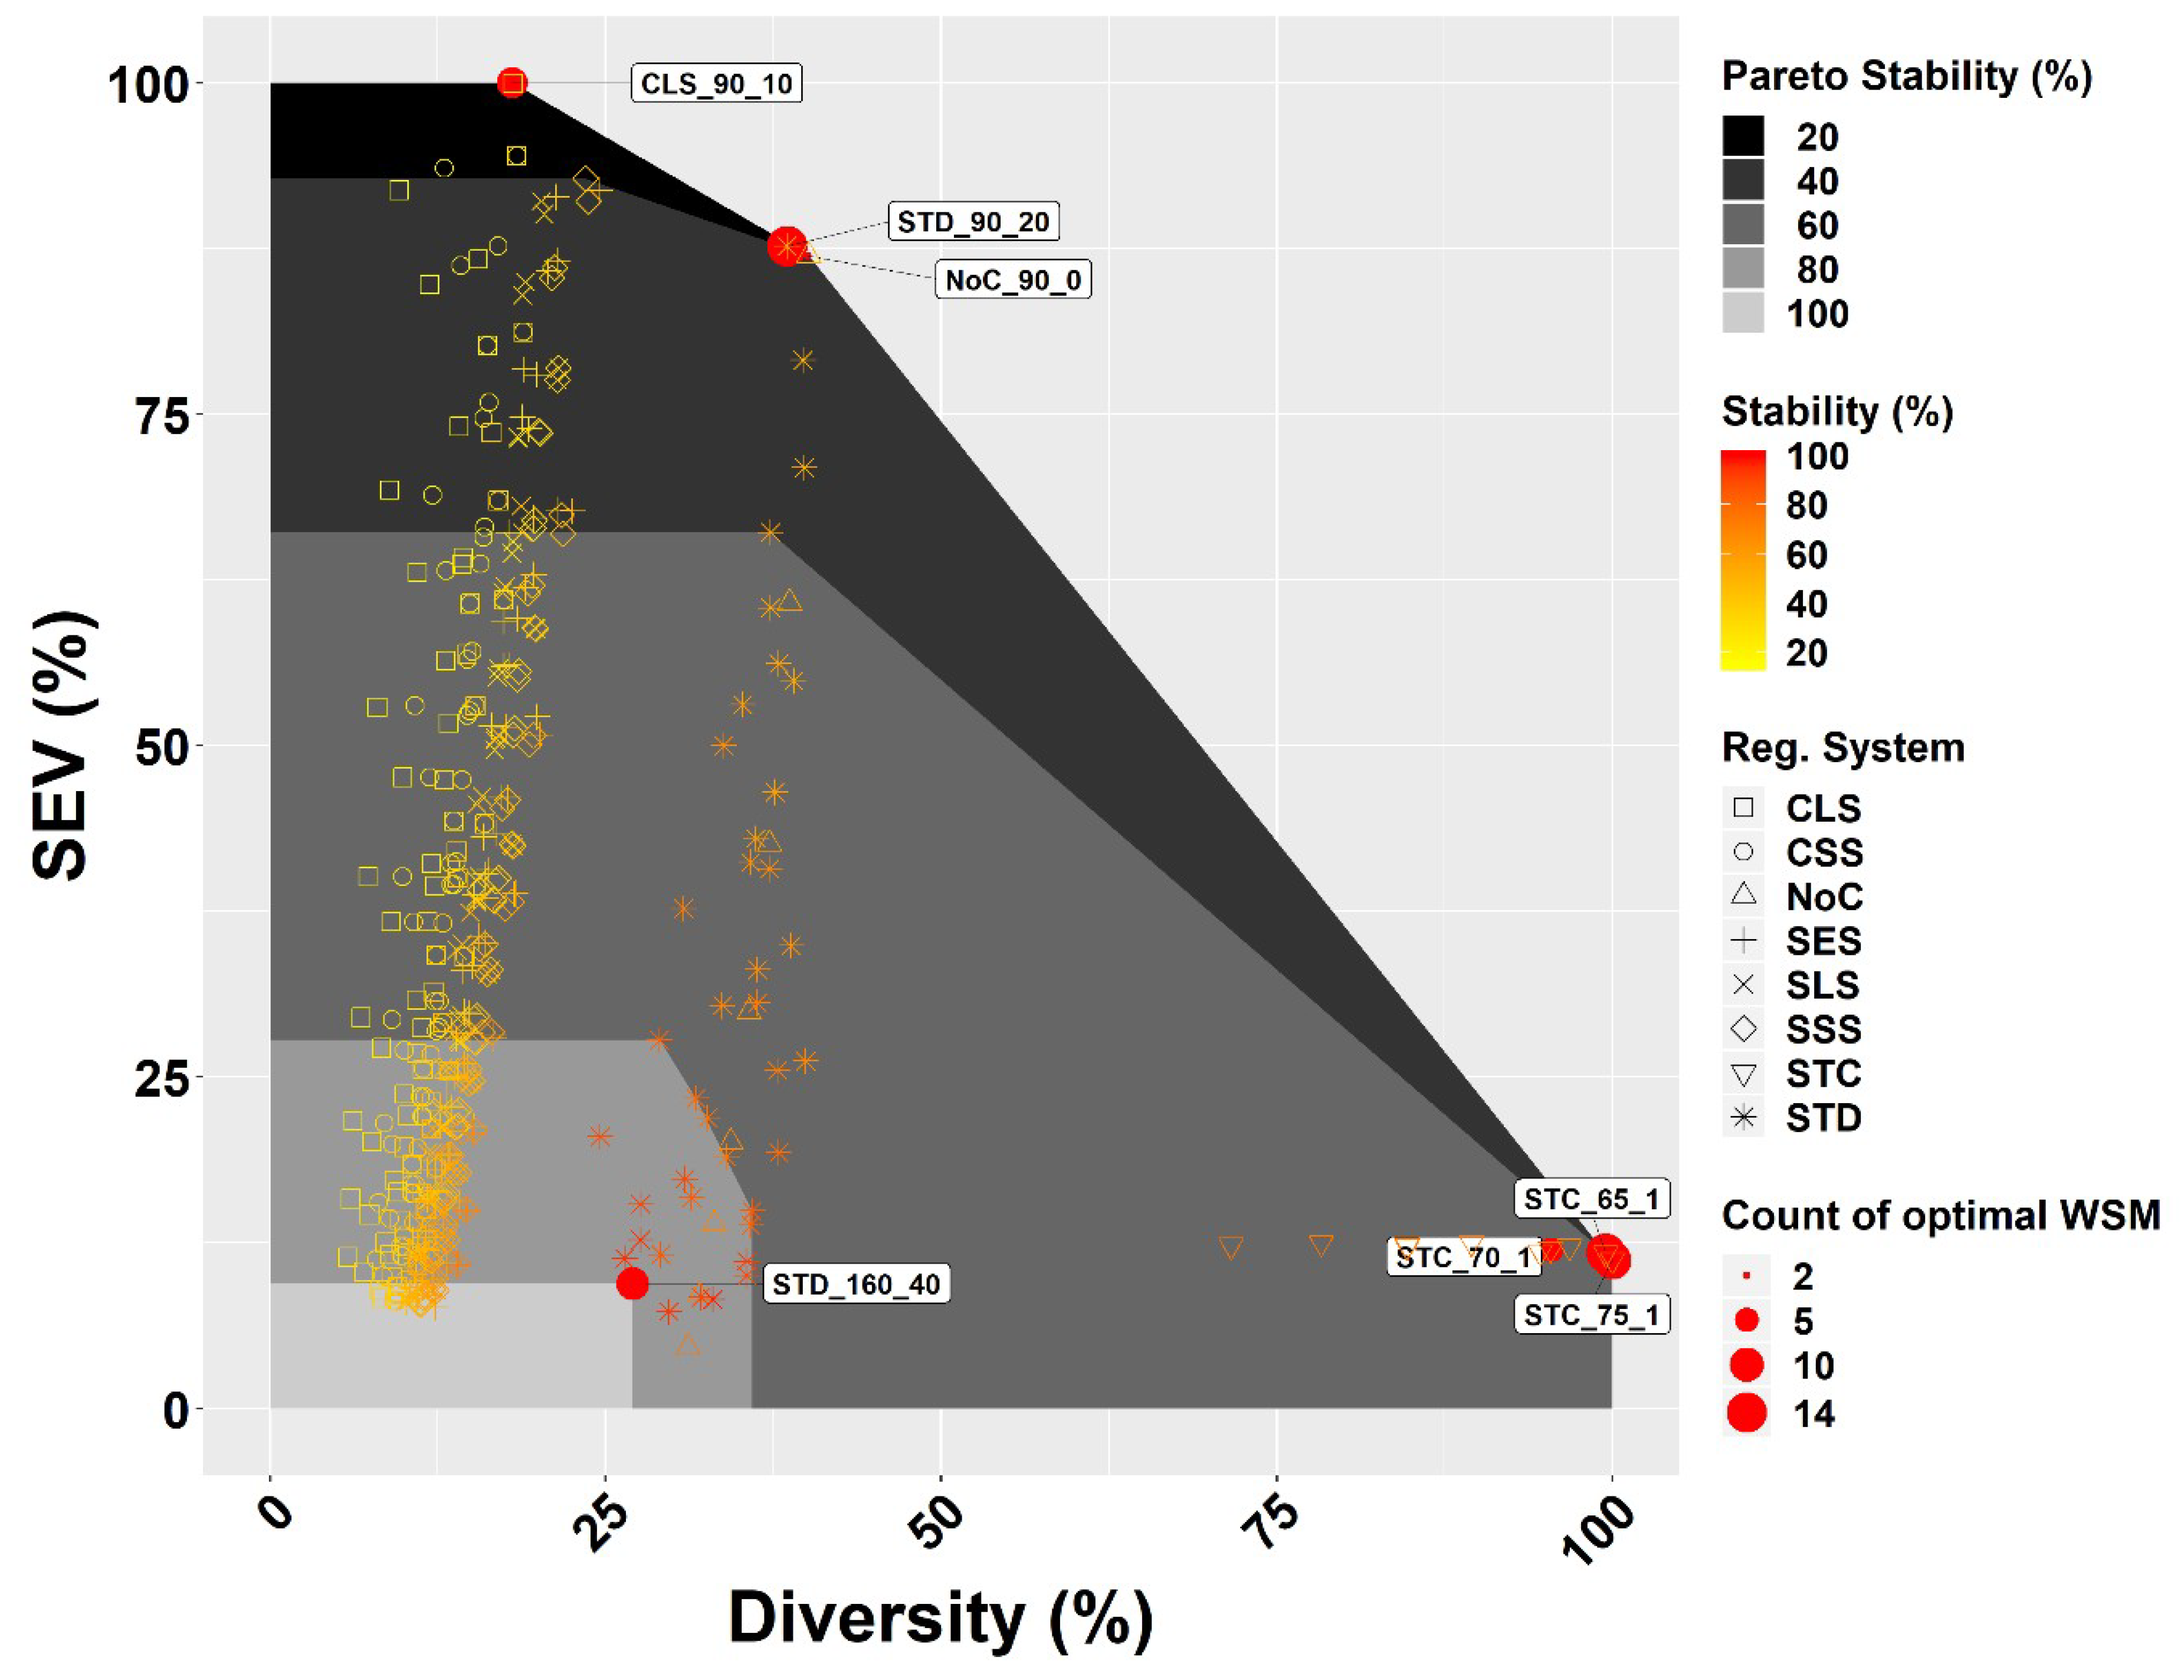
| Harvest-Regeneration System | Regeneration Form | No. of Cuttings per Decade | No. of Phases per Decade | Regeneration Period | Rotation Period | No. of Selected Cases | % SEV | % Stability | % H´ | Abbreviation | |
|---|---|---|---|---|---|---|---|---|---|---|---|
| Even-Aged | Clearcutting | Large Scale | 2 | 10 | 90 | 8 | 100 | 31 | 18 | CLS_90_10 | |
| Shelter-Wood | Target Diameter | 40 | 160 | 9 | 9 | 100 | 27 | STD_160_40 | |||
| Target Diameter | 20 | 90 | 14 | 88 | 54 | 39 | STD_90_20 | ||||
| Uneven-Aged | Selection | Single Tree Cutting | Target diameter = 65 cm, No. of target trees = 1 per hectare | 13 | 12 | 75 | 100 | STC_65_1 | |||
| Target diameter = 70 cm, No. of target trees = 1 per hectare | 12 | 11 | 75 | 100 | STC_70_1 | ||||||
| Target diameter = 75 cm, No. of target trees = 1 per hectare | 5 | 12 | 78 | 95 | STC_75_1 | ||||||
| No Cutting | 90 | 2 | 87 | 51 | 40 | NoC_90 | |||||
| ∑ 63 | |||||||||||
© 2020 by the authors. Licensee MDPI, Basel, Switzerland. This article is an open access article distributed under the terms and conditions of the Creative Commons Attribution (CC BY) license (http://creativecommons.org/licenses/by/4.0/).
Share and Cite
Merganič, J.; Merganičová, K.; Výbošťok, J.; Valent, P.; Bahýľ, J.; Yousefpour, R. Searching for Pareto Fronts for Forest Stand Wind Stability by Incorporating Timber and Biodiversity Values. Forests 2020, 11, 583. https://doi.org/10.3390/f11050583
Merganič J, Merganičová K, Výbošťok J, Valent P, Bahýľ J, Yousefpour R. Searching for Pareto Fronts for Forest Stand Wind Stability by Incorporating Timber and Biodiversity Values. Forests. 2020; 11(5):583. https://doi.org/10.3390/f11050583
Chicago/Turabian StyleMerganič, Ján, Katarína Merganičová, Jozef Výbošťok, Peter Valent, Ján Bahýľ, and Rasoul Yousefpour. 2020. "Searching for Pareto Fronts for Forest Stand Wind Stability by Incorporating Timber and Biodiversity Values" Forests 11, no. 5: 583. https://doi.org/10.3390/f11050583