Article

Difference in Regeneration Conditions in Pinus ponderosa Dominated Forests in Northern California, USA, over an 83 Year Period

by
Sushil Nepal
1,
Bianca N.I. Eskelson
1,* and
Martin W. Ritchie
2
1
Department of Forest Resources Management, The University of British Columbia, 2424 Main Mall, Vancouver, BC V6T 1Z4, Canada
2
USDA, Forest Service Pacific Southwest Research Station, 3644 Avtech Parkway, Redding, CA 96002, USA
*
Author to whom correspondence should be addressed.
Forests 2020, 11(5), 581; https://doi.org/10.3390/f11050581
Submission received: 1 April 2020 / Revised: 28 April 2020 / Accepted: 13 May 2020 / Published: 22 May 2020
(This article belongs to the Special Issue Impacts of Complex Forest Structures on Tree Regeneration)

Abstract

:
Forest inventories based on field surveys can provide quantitative measures of regeneration such as density and stocking proportion. Understanding regeneration dynamics is a key element that supports silvicultural decision-making processes in sustainable forest management. The objectives of this study were to: 1) describe historical regeneration in ponderosa pine dominated forests by species and height class, 2) find associations of regeneration with overstory, soil, and topography variables, 3) describe contemporary regeneration across various management treatments, and 4) compare differences in regeneration between historical and contemporary forests. The study area, a ponderosa pine (Pinus ponderosae Dougl. ex P. and C. Law) dominated forest, is located within the Blacks Mountain Experimental Forest (BMEF) in northeastern California, United States, which was designated as an experimental forest in 1934. We used 1935 and 2018 field surveyed regeneration data containing information about three species—ponderosa pine, incense-cedar (Calocedrus decurrens (Torr.) Florin) and white fir (Abies concolor (Grod. and Glend)—and four height classes: class 1: 0–0.31 m, class 2: 0.31–0.91 m, class 3: 0.91–1.83 m, and class 4: >1.83 m and <8.9 cm diameter at breast height. We used stocking as proxy for regeneration density in this study. We found that historically, stocking in the BMEF was dominated by shade-intolerant ponderosa pine in height classes 2 and 3. Two variables—overstory basal area per hectare (m2 ha−1) and available water capacity at 150 cm, which is the amount of water that is available for plants up to a depth of 150 cm from the soil surface—were significantly associated with stocking, and a beta regression model fit was found to have a pseudo-R2 of 0.49. We identified significant differences in contemporary stocking among six management scenarios using a Kruskal–Wallis non-parametric one-way ANOVA. Control compartments had the highest stocking followed by burned compartments. In contemporary forest stands, recent treatments involving a combination of burning and thinning resulted in high stocking in height classes 2 and 3. Overall, the stocking in historical BMEF stands was higher than in contemporary stands and was dominated by ponderosa pine.

1. Introduction

Public agencies focus forest management efforts on reducing forest fuels in dry forests of California with thinning and prescribed fire treatments [1]. However, a common secondary objective focuses on promoting more resilient future forests, which are dominated by fire-resistant and shade-intolerant ponderosa pine (Pinus ponderosa Laws.) [2]. The resiliency of dry forests can be characterized in terms of desired post-disturbance structure and composition, which requires the implementation of appropriate regeneration methods [3].
Many studies have shown that historical conifer seed production, germination, subsequent establishment, and survival are associated with both biotic and abiotic factors [4]. Abiotic factors such as fire influence the establishment and survival of seedlings [5,6]. In the southern Cascades, prior to around early 1900, low- to moderate-severity fires at a return interval of <12 years [7,8] affected regeneration of ponderosa pine forests by exposing mineral soil and thus preparing fine seed beds [9]. Soil moisture [10], good seed crop [11], and topography [12] are considered important limiting abiotic factors for tree regeneration and growth in northern California and the Sierra Nevada [13]. Differences in regeneration densities across elevation and moisture gradients have been reported [12]. At higher elevation, regeneration densities are usually higher due to improved water availability [12]. Successful regeneration also depends on stand structure (i.e., species composition, vertical and horizontal distribution of trees) [14]. Stand structure affects regeneration by modifying available resources like water and nutrients [15]. Biotic factors such as disease or insect outbreaks, or anthropogenic disturbances including prior silviculture treatments are capable of altering the trajectory of stand dynamics by creating establishment sites and resources for regeneration [16].
Prior to the late 1800s, regeneration densities in ponderosa pine forests were often low enough to maintain an open, park-like forest structure [17]. However, after the late 1800s, these forests experienced an increased pulse of regeneration resulting from the absence of fire to limit the seedling density [18]. Fire exclusion resulted in increased tree density, which provided a conducive environment for the establishment of more shade-tolerant species such as white fir (Abies concolor) and incense-cedar (Calocedrus decurrens (Torr.) Florin) under the dense shade of large trees [1,16,19]. Hence, forests began to exhibit more homogeneous structure and composition [20,21]. This has left many ponderosa pine forests at greater risk to high-severity, stand-replacing fires [22]. The future trajectory of ponderosa pine forests depends on the regeneration response to management and environmental conditions [4]. High levels of stand density tend to suppress individual tree growth and may lead to stand stagnation [16]. Besides fire, topography plays an important role in conifer regeneration by interacting with aspect and slope to influence solar radiation, temperature, and soil moisture availability for germinating seedlings [12,23]. Yet, the direct effects of topographic and moisture gradients are not well understood.
Much of our knowledge about historical regeneration is based on reconstructions from tree-ring data, which fail to distinguish among the effects of fire, topography, and soil characteristics in regeneration [24]. This is both due to the fragmentary nature of tree-ring evidence subject to decay or destruction by subsequent fires and the difficulty of obtaining an annual resolution of germination dates from samples of large trees [25]. Reconstruction studies also fail to describe the survival rate of the seedlings that are established post-fire [26]. In contrast, many recent regeneration studies are aimed at understanding the post-fire regeneration mechanism in ponderosa pine forests in contemporary conditions [27,28]. Studies of post-fire regeneration in historical ponderosa pine forests are generally lacking.
Understanding regeneration dynamics is a key component of silvicultural decision-making processes in sustainable forest management [29]. Forest inventories based on field surveys can provide quantitative measures of regeneration such as seedling density [29]. However, seedlings often occur in clumps and field survey data tend to be highly aggregated and exhibit high variability [30]. In order to address issues of skewness and variability in the collected regeneration data, this study used a variation of the stocked-quadrat method to estimate stocking proportion, which was originally introduced by Lynch and Schumacher [31]. Stocking in this study was defined as percent of 0.0016 ha plots with at least one tree seedling or sapling, and was modelled from available seedling density data using the equation from Ritchie [32].
We conducted this study in Blacks Mountain Experimental Forest (BMEF), Lassen National Forest, in northeastern California, United States, covering an extent of approximately 4000 hectares. Detailed regeneration data for yellow pine, incense-cedar, and white fir by four height classes were collected in 1935 and 2018 across BMEF. Yellow pine represented a grouping of Jeffrey pine (Pinus jeffreyi Grev. & Balf) and ponderosa pine, two closely related species. To simplify, we refer to this grouping as ponderosa pine throughout the text. The forest stand conditions observed in 1935 had likely already been changed from forest conditions observed in forests prior to European settlement due to sheep grazing, which may have altered fire frequency [33]. Nevertheless, we will refer to the 1935 stand conditions as historical in the following. Thus, we are not using ‘historical’ to refer to conditions prior to European settlement, but rather to refer to the 1935 conditions that reflect conditions prior to active management in comparison to contemporary conditions observed in 2018. In this study, we answered the following four questions:
  • What was the stocking of ponderosa pine, incense-cedar, and white fir for four different height classes in 1935 prior to active forest management across BMEF?
  • Was historical stocking in BMEF associated with overstory stand structure, soil, and topography?
  • Are there differences in stocking among contemporary (2018) forests that received several management treatments: control, prescribed fire, combination thinning, combination thinning with prescribed fire, thinning from below, and thinning from below with prescribed fire? If so, which treatments differ?
  • How does historical stocking (1935) for the observed tree species differ from contemporary stocking (2018) for 12 compartments that received management treatments prior to 2018?
Our study allowed detailed quantitative descriptions of historical (1935) and contemporary (2018) stocking of different species under various stand conditions that were dominated by ponderosa pine. We were also able to quantify differences in contemporary stocking under several management scenarios. Information on historical regeneration by species, height classes, and environmental factors associated with regeneration is critically important to managers for prescribing forest management treatments that will determine sustainability of forest values in the future.

2. Materials and Methods
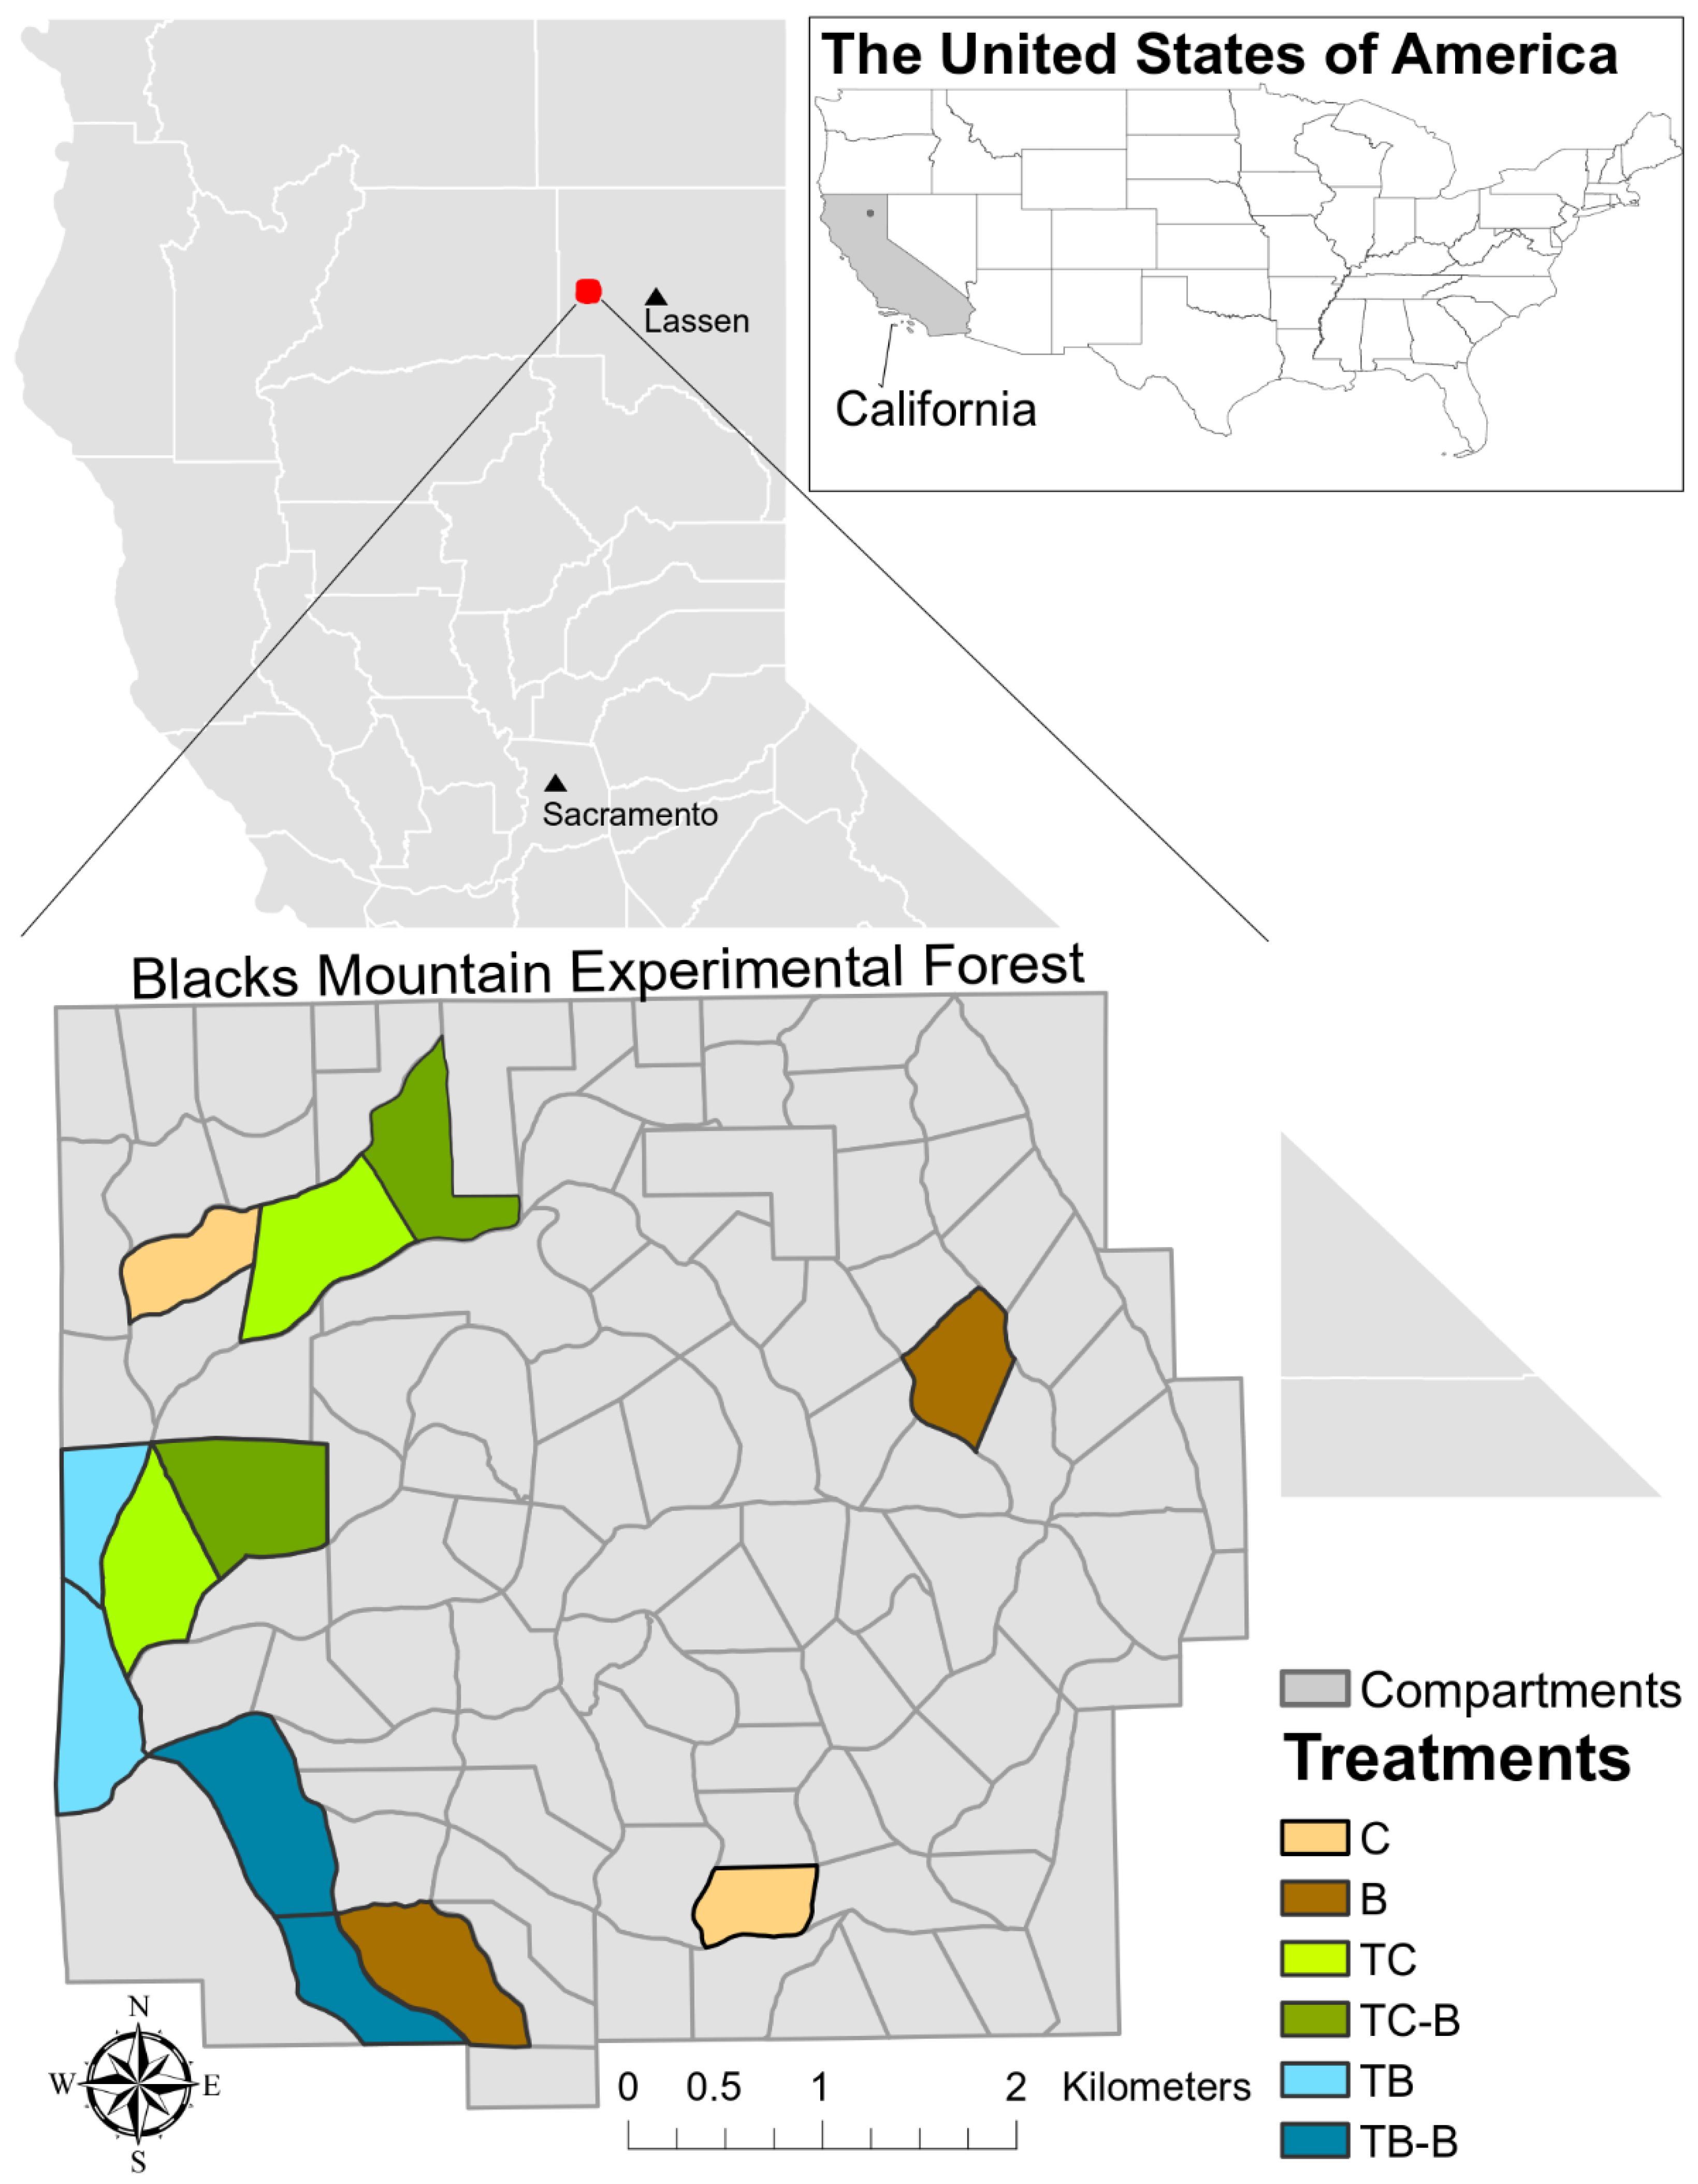
2.1. Study Area

This study was conducted at the Blacks Mountain Experimental Forest (BMEF) established in 1934 in northeastern California, United States (Figure 1). BMEF (40°40′ N, 121°10′ W) is managed by the United States Department of Agriculture (USDA) Forest Service, Pacific Southwest Research Station, and ranges between 1700 and 2100 m in elevation [34]. BMEF is dominated by ponderosa pine (Pinus ponderosae Dougl. ex P. and C. Law), with lesser amounts of white fir (Abies concolor (Grod. And Glend) and incense-cedar (Calocedrus decurrens (Torr.) Florin) present at higher elevations [35]. At lower elevations, Jeffrey pine (Pinus jeffreyi (Grev. And Balf)) is found within the stands [36]. Western juniper (Juniperus occidentalis Hook.) is sparsely distributed as individuals or small groves in the lower elevations of the forest [36].

2.2. Management History

Due to observed high rates of insect-caused mortality [37,38], between 1937 and 1960, most compartments of the forest were subject to sanitation/salvage cutting that removed many of the decadent and high risk trees in the forest, those of risk class 3 and 4 [39]. These harvests were usually light, removing less than 20% of the standing volume. Remnants of the earlier structure remained in four research natural areas (RNAs; Table 1, Figure 1). The RNAs represent undisturbed and late successional forests [36,40]. During the 20th century, there was no fire at BMEF since 1899 (unpublished fire scar data from Carl Skinner, United States Forest Services, retired). However, after 1997 prescribed fire was applied in two of the four RNAs.
The Bull thinning project (hereafter, thinning from below) was started in 2011 and concluded in 2012. Prescribed burns within this project were performed in fall of 2017. Thinning in a Low Structural Diversity treatment, removing all but the mid-canopy trees (hereafter, combination thinning), was conducted in 1996 and prescribed burns were performed in 1997 [41]. All observations on current conditions were conducted in 2018. Treatments are summarized as follows (see details in Table 1):
  • Control (C)
  • Prescribed fire (B, burn only)—prescribed fire in 1999/1997 and 2011
  • Combination thinning (TC)—thinning in 1996
  • Combination thinning with prescribed fire (TC-B)—thinning in 1996 and prescribed fire in 1997
  • Thinning from below only (TB)—thinning in 2012
  • Thinning from below with prescribed fire (TB-B)—thinning in 2012 and prescribed fire in 2017

2.3. Regeneration Data

Data for the analysis came from two sources: (i) 1935 historical regeneration data from 100 compartments (Figure 1) and (ii) 2018 regeneration data—hereafter referred to as contemporary regeneration data—for 12 compartments spanning a range of current conditions at BMEF.

2.3.1. Historical Regeneration Data

Regeneration data were systematically sampled across the entire BMEF in 1935. BMEF was divided into 4055 strips of approximately 1 ha each. Along the length of each strip, 0.0016 ha (4-milacre) quadrats were installed at every 50 m (164 feet) interval [42]. Within each quadrat, seedling data were tallied by three species—pine, white fir, and incense-cedar. Data were also tallied by height classes of 0–0.31 m (0–1 feet), 0.31–0.91 m (1–3 feet), 0.91–1.83 m (3–6 feet), and >1.83 m (6 feet) for seedlings less than 8.9 cm (3.5 inches) diameter at breast height (dbh) [42]. The pine species in 1935 was a combination of ponderosa pine and Jeffrey pine [42]. The data were aggregated to compartment-level, resulting in seedling density by species and height class for 100 compartments [42].

2.3.2. Contemporary Regeneration Data

In 2018, the 1935 sampling design was imitated within 12 compartments, which spanned across six recent treatments with two replications each across the entire BMEF (Table 1, Figure 1). The 2018 field sampling was specifically designed and conducted in order to compare the contemporary data to the available 1935 data, because little quality data on regeneration were collected since 1935. While in 1935 square 0.0016 ha (4-milacre) quadrats were used, we used circular plots of radius 2.27 m (7.45 feet) split into four 0.000404 ha wedges for ease of implementation in the field. Plots were established at an interval of 50 m spacing among permanently marked grid points at 100 m square spacing. The 2018 seedling data, which were collected within the milacre quadrats, were then aggregated to the compartment level as was done with the 1935 data.

2.4. Data Compilation
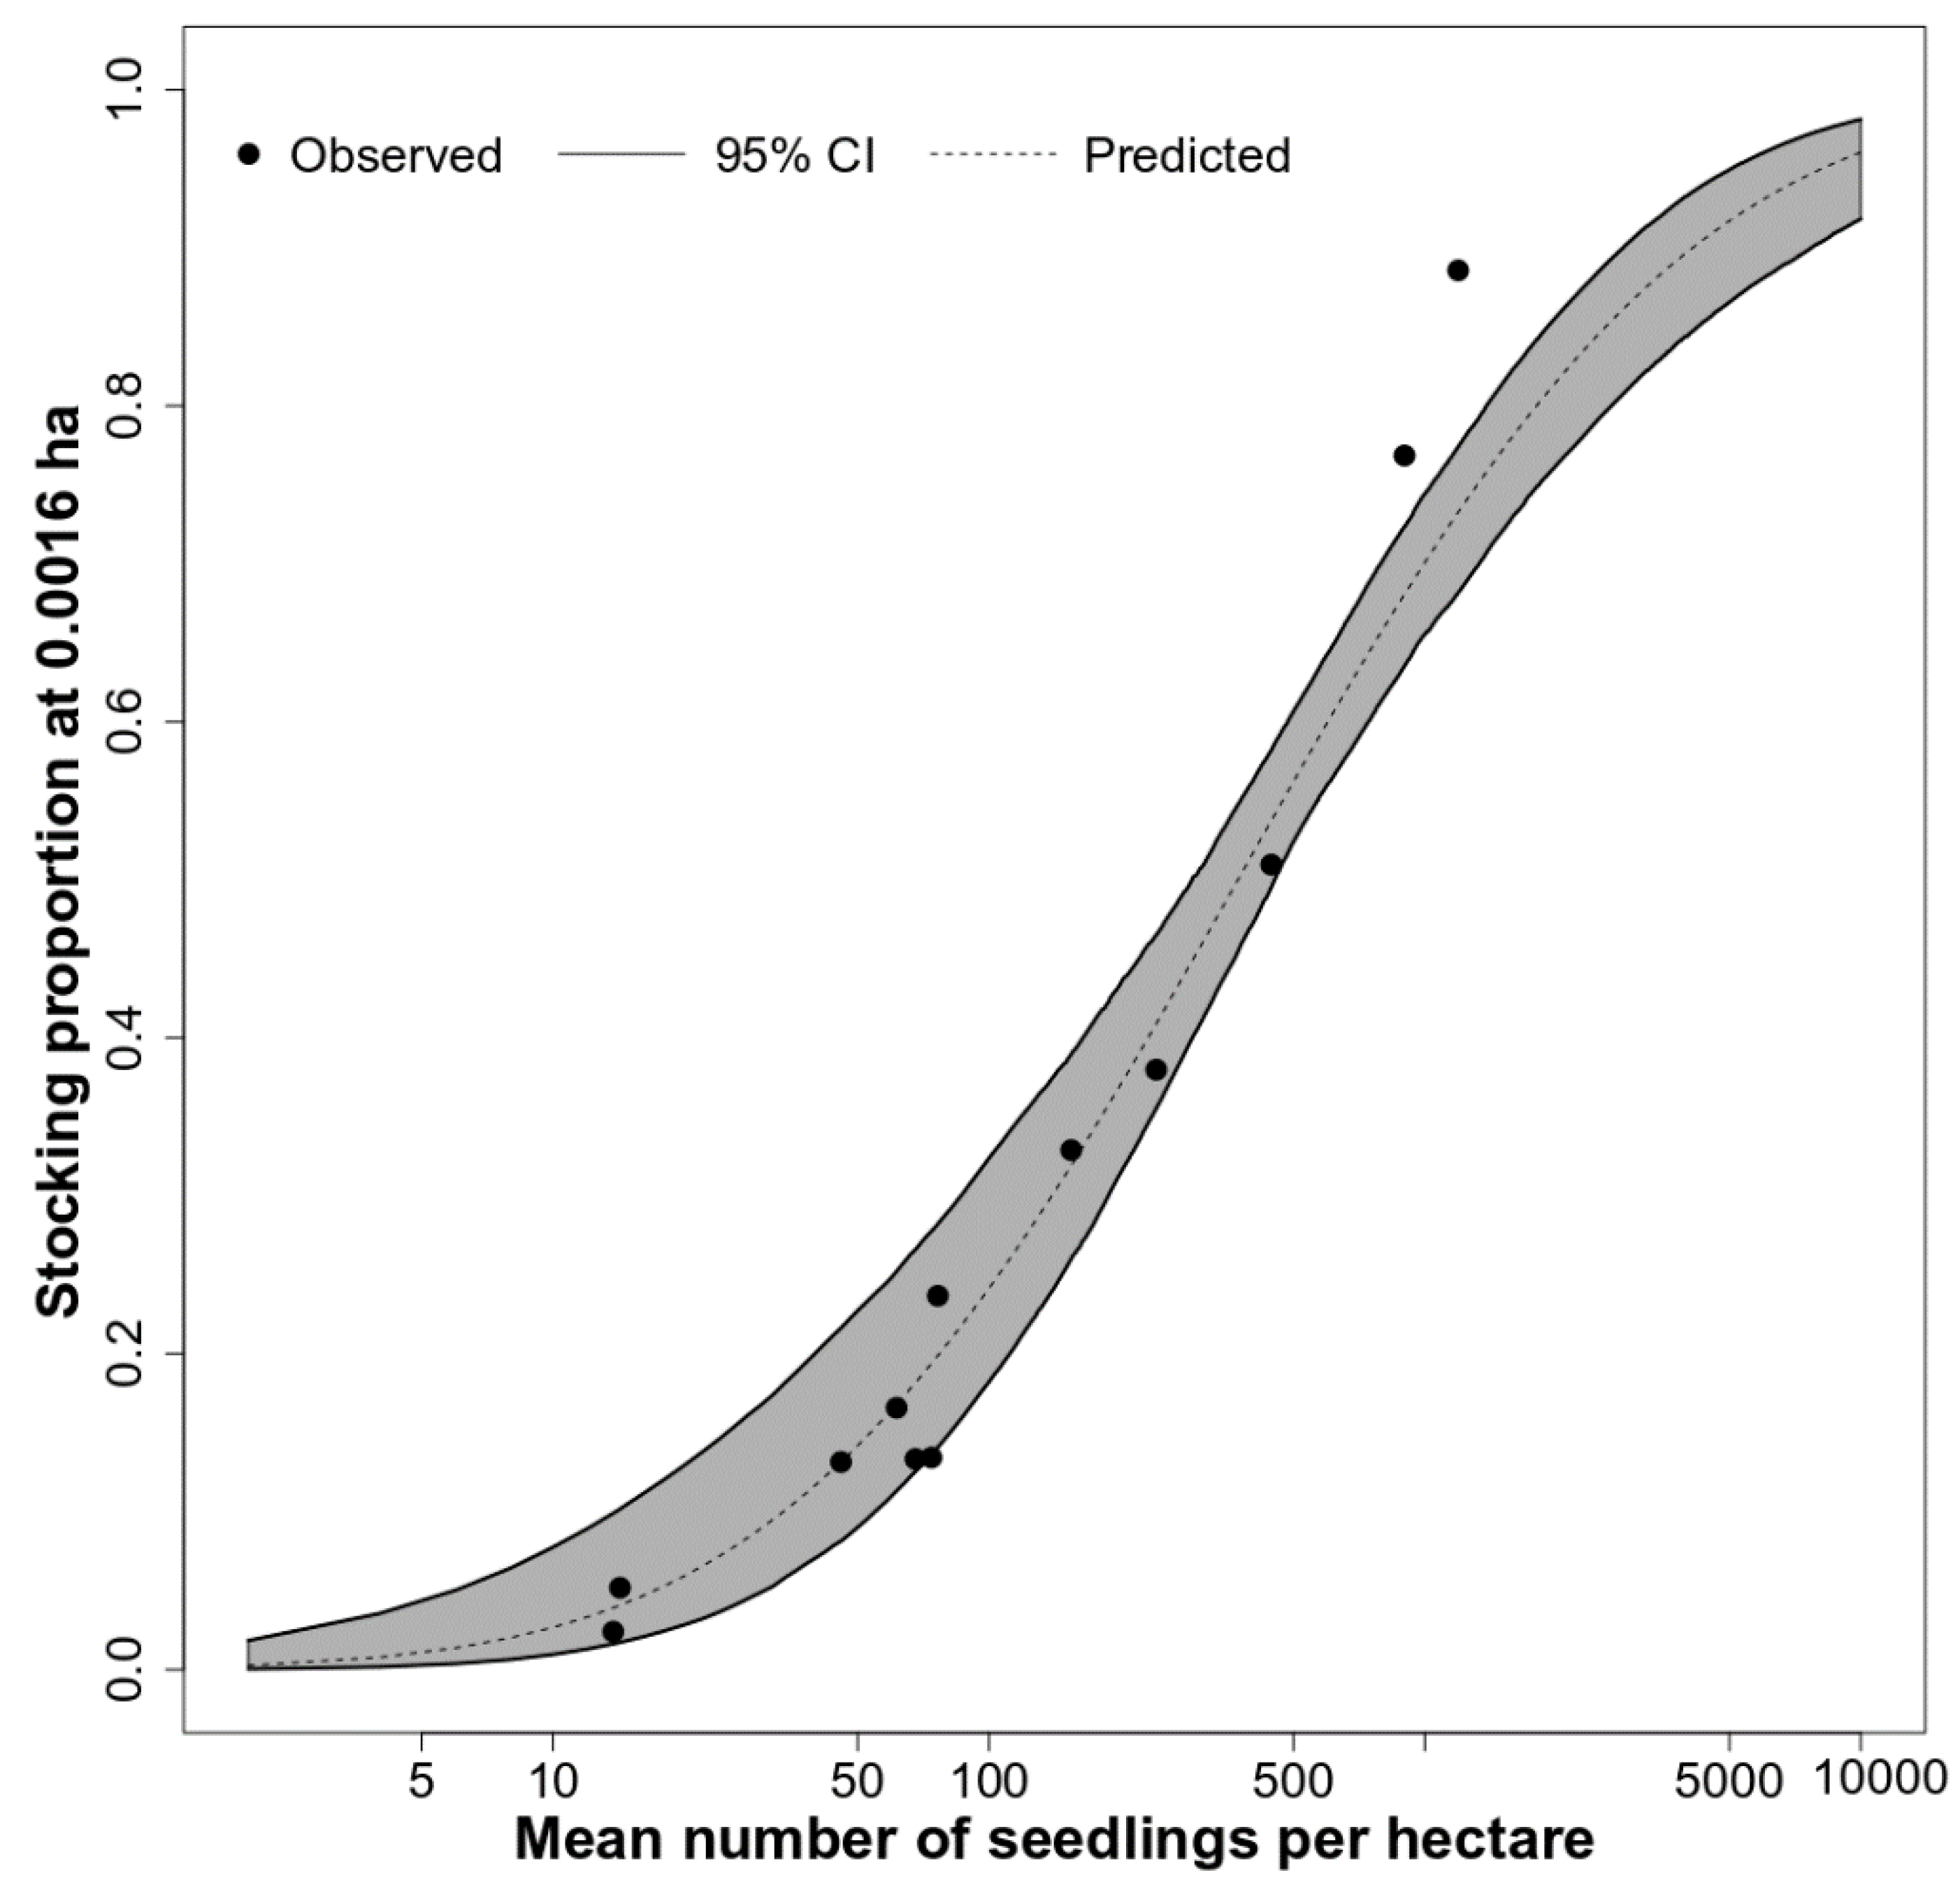
2.4.1. Stocking

Stocking, as defined by Gingrich [43], is a relative term that describes a given stand density based on a management objective or a desirable density. For 1935, only the seedling density per hectare summaries calculated from the 0.0016 ha (4-milacre) plots were available rather than the raw inventory data. Therefore, we were unable to observe stocking, defined as percent of plots with at least one tree seedling or sapling per 0.0016 ha, directly for the 1935 data. Density measurements alone can be misleading because of the known spatial heterogeneity of natural tree regeneration [30,44]. There have been several attempts at relating understory tree density and stocking [31,44,45], because stocking is a more reliable measure in assessing management objectives or desirable tree occupancy [43] and accounts for the spatial heterogeneity of natural regeneration. More recently Ritchie [32], using data from the 2000 Storrie fire on the Lassen National Forest, conducted a validation of the Lynch and Schumacher [31] probit model that predicts stocking as a function of understory tree density, and found that the Storrie fire data matched well with the Lynch and Schumacher [31] model fit. The results from Ritchie [32] were applied here to estimate stocking from the compiled, available seedling density data:
Φ 1 ( p ) = 0.21307 + 1.22876   l o g 10 ( x )
where Φ−1(p) is the inverse of the standard normal (probit) of proportion (p) of stocked plots and x is mean number of trees per plot. To evaluate the fit of the new equation we plotted our observed stocking in 2018 at 0.0016 ha plots over the predicted stocking 95% confidence interval from Ritchie [32].

2.4.2. Explanatory Variables for 1935 Conditions

Three groups of explanatory variables were used: overstory, soil, and topography. We compiled overstory variables—trees per hectare and overstory basal area per hectare (Table 2)—for each of 100 compartments using available census data from 1934. In 1934, all live trees >8.9 cm dbh were tallied by 5.08 cm wide diameter classes within 4055 plots (~1 ha in size) throughout BMEF. If a 1-ha plot straddled two compartments, the overstory variables were weighted by the proportion of the plot that fell into a particular compartment. Two compartments that were primarily composed of meadows were dropped, and we used the remaining 98 compartments for any analyses that included the 1934 overstory data (Table 3).
Topographic variables—aspect, slope, and elevation—were extracted from a digital elevation model (DEM) at a 1-m resolution (Table 2). The zonal statistic function from ArcMap 10.4.1 summarized the values of the DEM in terms of average elevation, slope, and aspect within the extent specified by the shape file for the 100 compartments [47]. Aspect and slope were incorporated into the model using the transformations suggested by Stage [48]. Vegetation information for BMEF was available from an ecological unit inventory (EUI) shapefile. This EUI map, developed for BMEF in 1994, identified different geological landforms, soils, and potential vegetation types [46]. The compartment map was overlaid with the EUI map and the intersect function in ArcMap 10.4.1 was used to extract the soil variables (Table 2) from the EUI map at compartment level [49]. Multiple categories of the variables could fall in a single compartment. If a compartment straddled multiple soil variable categories, an area-weighted average of the midpoints was assigned to the compartment.
Hydrological processes and the control of topography over such processes can be quantified by the topographic wetness index [50]. For the 100 compartments, topographic wetness index was calculated based on the slope from a 1 m resolution DEM, using the equations provided by Beven and Kirkby [50]. Similarly, solar insolation, which takes into account topographic characteristics such as slope, aspect, and elevation [51], was calculated for each of the 100 compartments using the DEM and Spatial Analyst tool from ArcMap 10.4.1.

2.5. Statistical Analysis

2.5.1. Historical Stocking

We conducted exploratory data analyses for the 1935 regeneration data using histograms, with stocking in each compartment and frequency on the x- and y-axis, respectively. Similarly, we constructed histograms for stocking by height class and species for the historical data from 1935.

2.5.2. Effect of Overstory, Soil, and Topography on Stocking

Meadows were part of the historical forest landscape. For two out of the 100 compartments, the area of meadows exceeded 70%, which made these compartments different from the other compartments, for which the area of meadows was below 40%, with 77 compartments not having any meadows. Therefore, we dropped the two compartments that were dominated by meadows from our analysis and used the remaining 98 compartments in the model development. Stocking is continuous and restricted to the standard unit interval (0, 1). Therefore, we fit beta regression models that take the distribution of stocking into account [52] using the ‘betareg’ package in R version 3.6.2 [53] with a logit link function [52]. We developed the models as follows: Our first step was to identify the variables that were significantly associated with stocking. We fit univariable beta regression models for all explanatory variables (Table 2). Then, we selected variables with low p-value (p < 0.05) to be used in multivariable beta regression models across the three groups of explanatory variables (Table 2), keeping variables significant at α-level of 0.05 and dropping variables that had variance inflation factor greater than three [54]. This resulted in a model that contained available water capacity at 150 cm (AWC150) and overstory basal area per hectare as explanatory variables. However, in our exploratory data analysis, the overstory basal area per hectare showed a curvilinear relationship with stocking. In order to account for the trend observed in the data and to mimic this trend, we decided to use a range of exponents between 0.10 to 2 at the interval of 0.10 for the overstory basal area per hectare to identify the value of exponent that resulted in the best model. We selected the model that resulted in high pseudo-R2 and high precision parameter (phi) values [52] as well as a low Akaike Information Criterion (AIC) value [55]. We also checked the assumption of constant variance and goodness-of-fit using residual vs linear predictor and half normal plots [56], respectively, for all beta regression models [50,51].

2.5.3. Stocking in Contemporary Forests under Different Management Treatments

The effect of six different management treatments on contemporary stocking was investigated using a Kruskal–Wallis non-parametric one-way ANOVA [57]. The treatment factor had six levels (Table 1). When differences among treatment levels were detected, a pairwise Wilcoxon rank sum test [58] was used to determine which treatment levels had different stocking.

2.5.4. Stocking in Historical vs. Contemporary Forests

Stocking by species and height class was available for 12 compartments in both measurement years. Dot plots were constructed for both measurement years for overall stocking, stocking by three species, and stocking by four height classes to investigate if contemporary stocking was higher than historical stocking.

3. Results

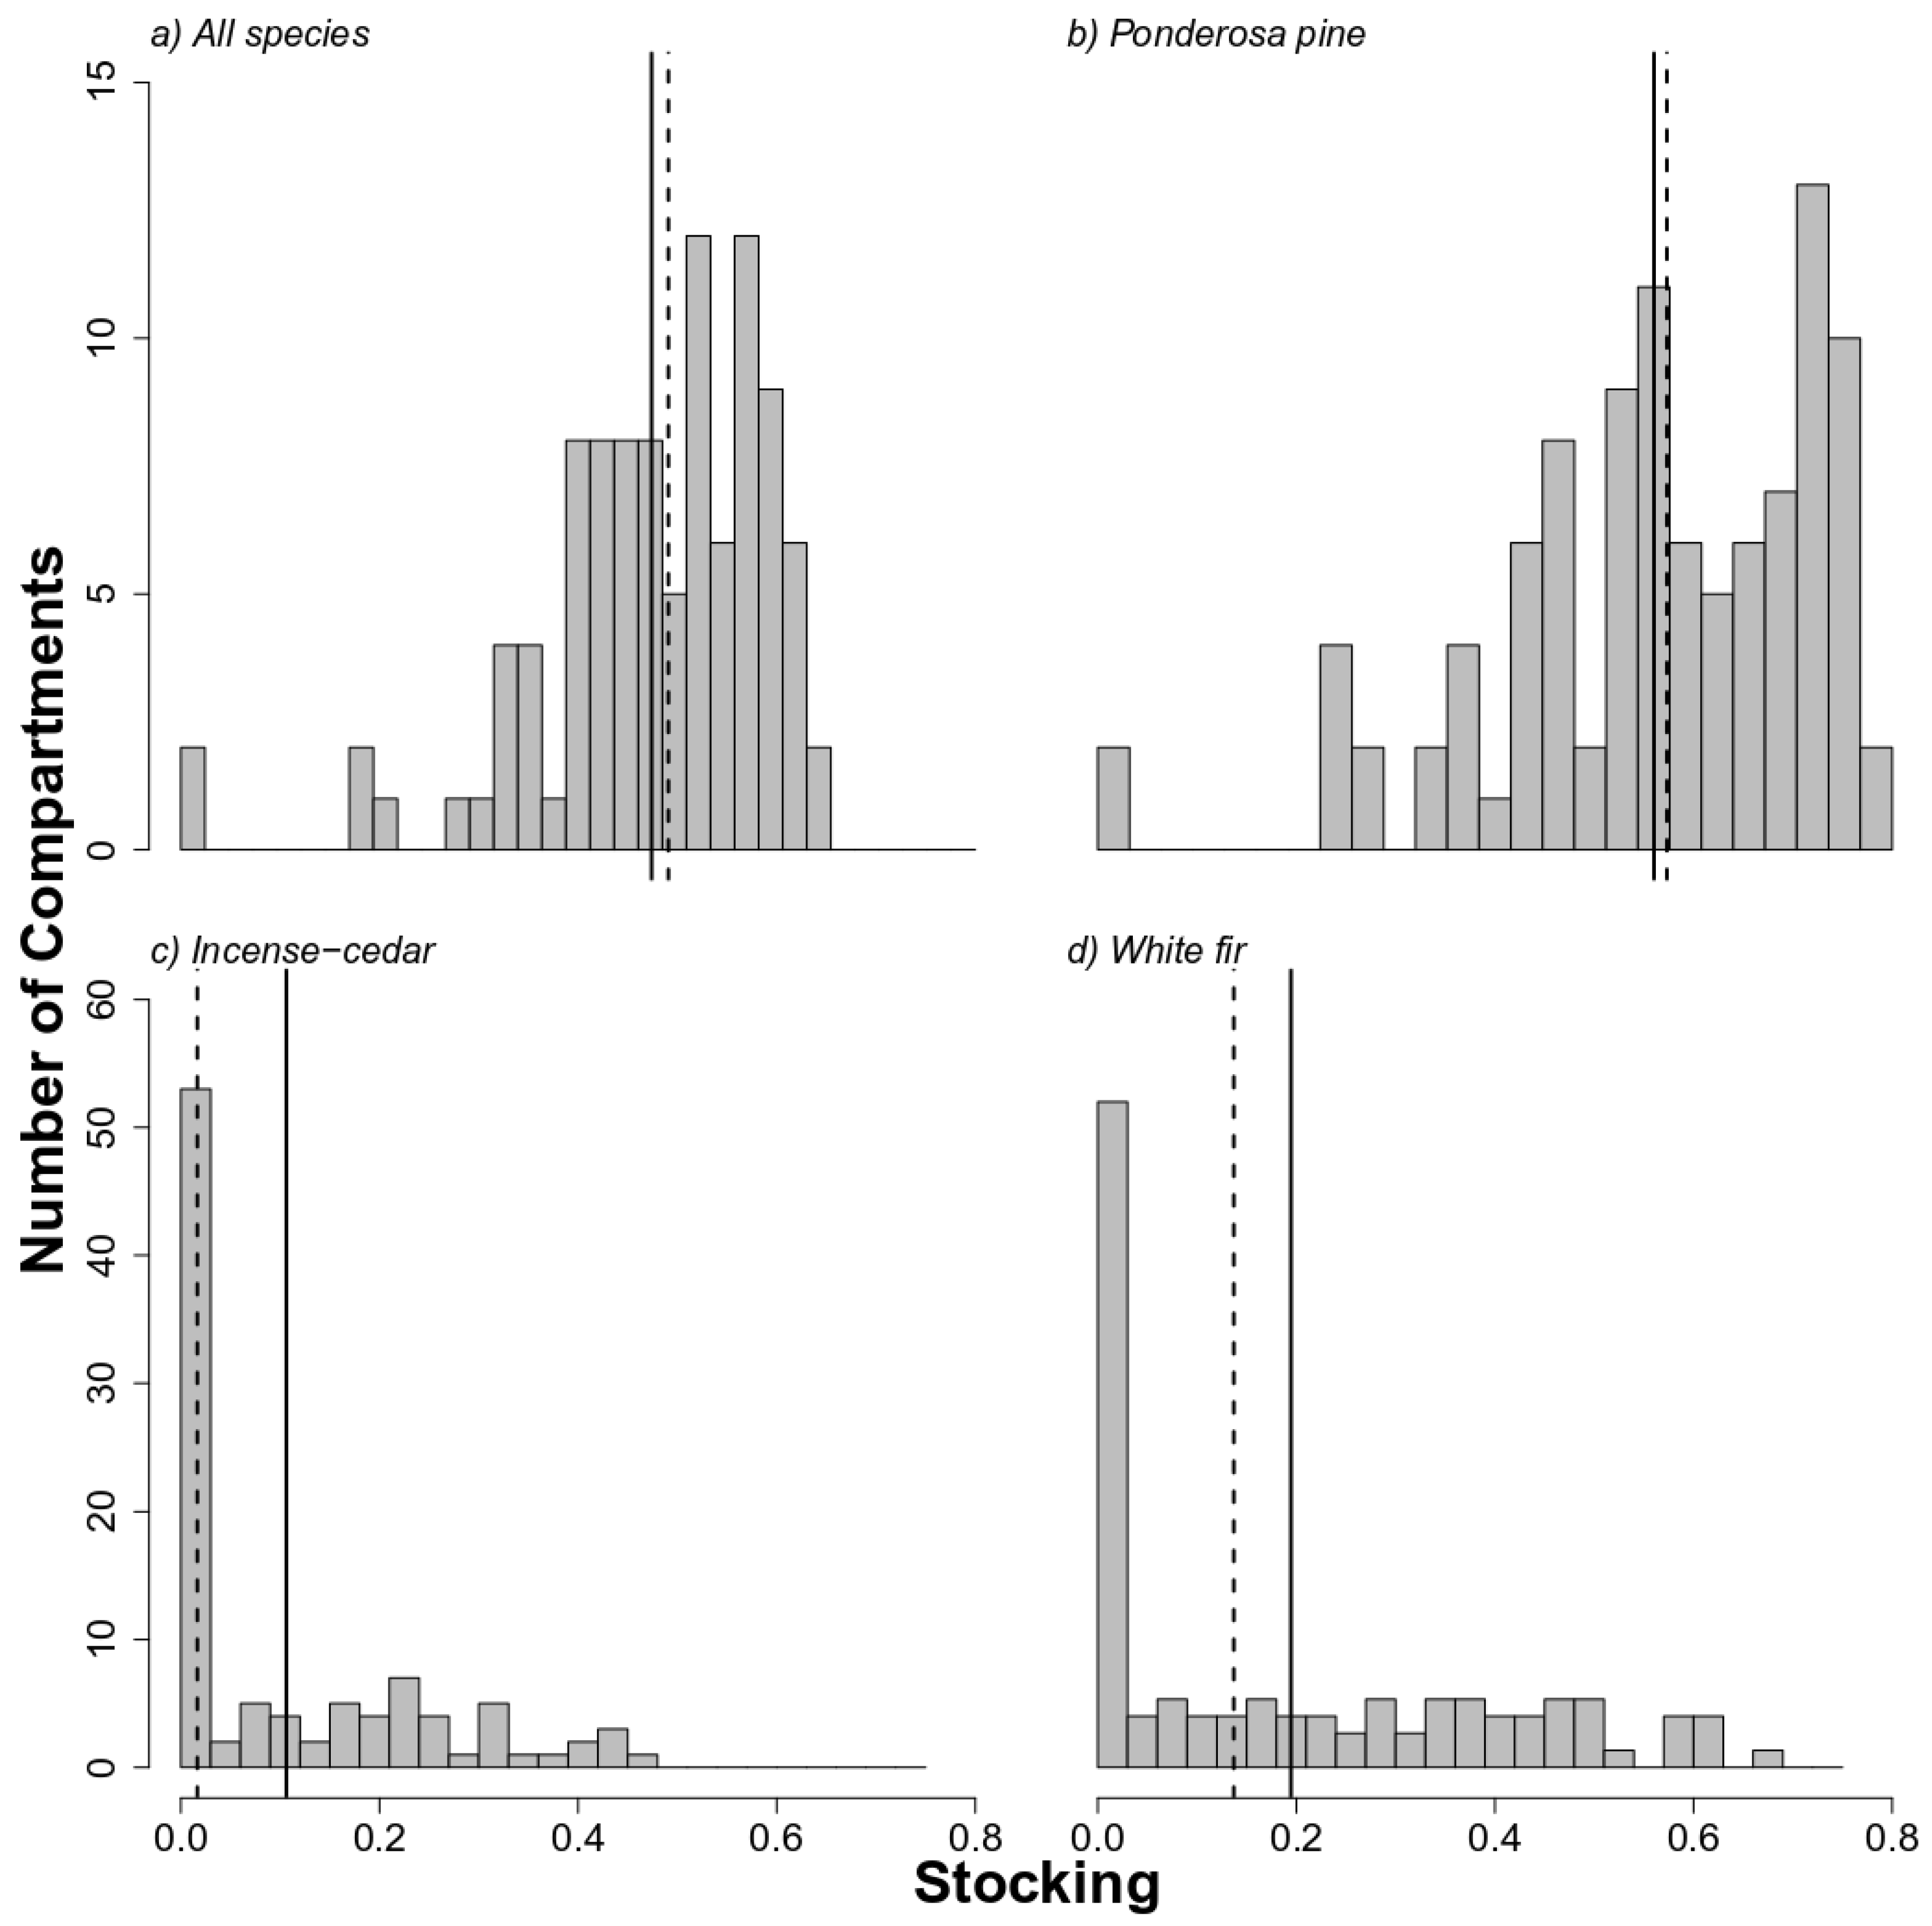
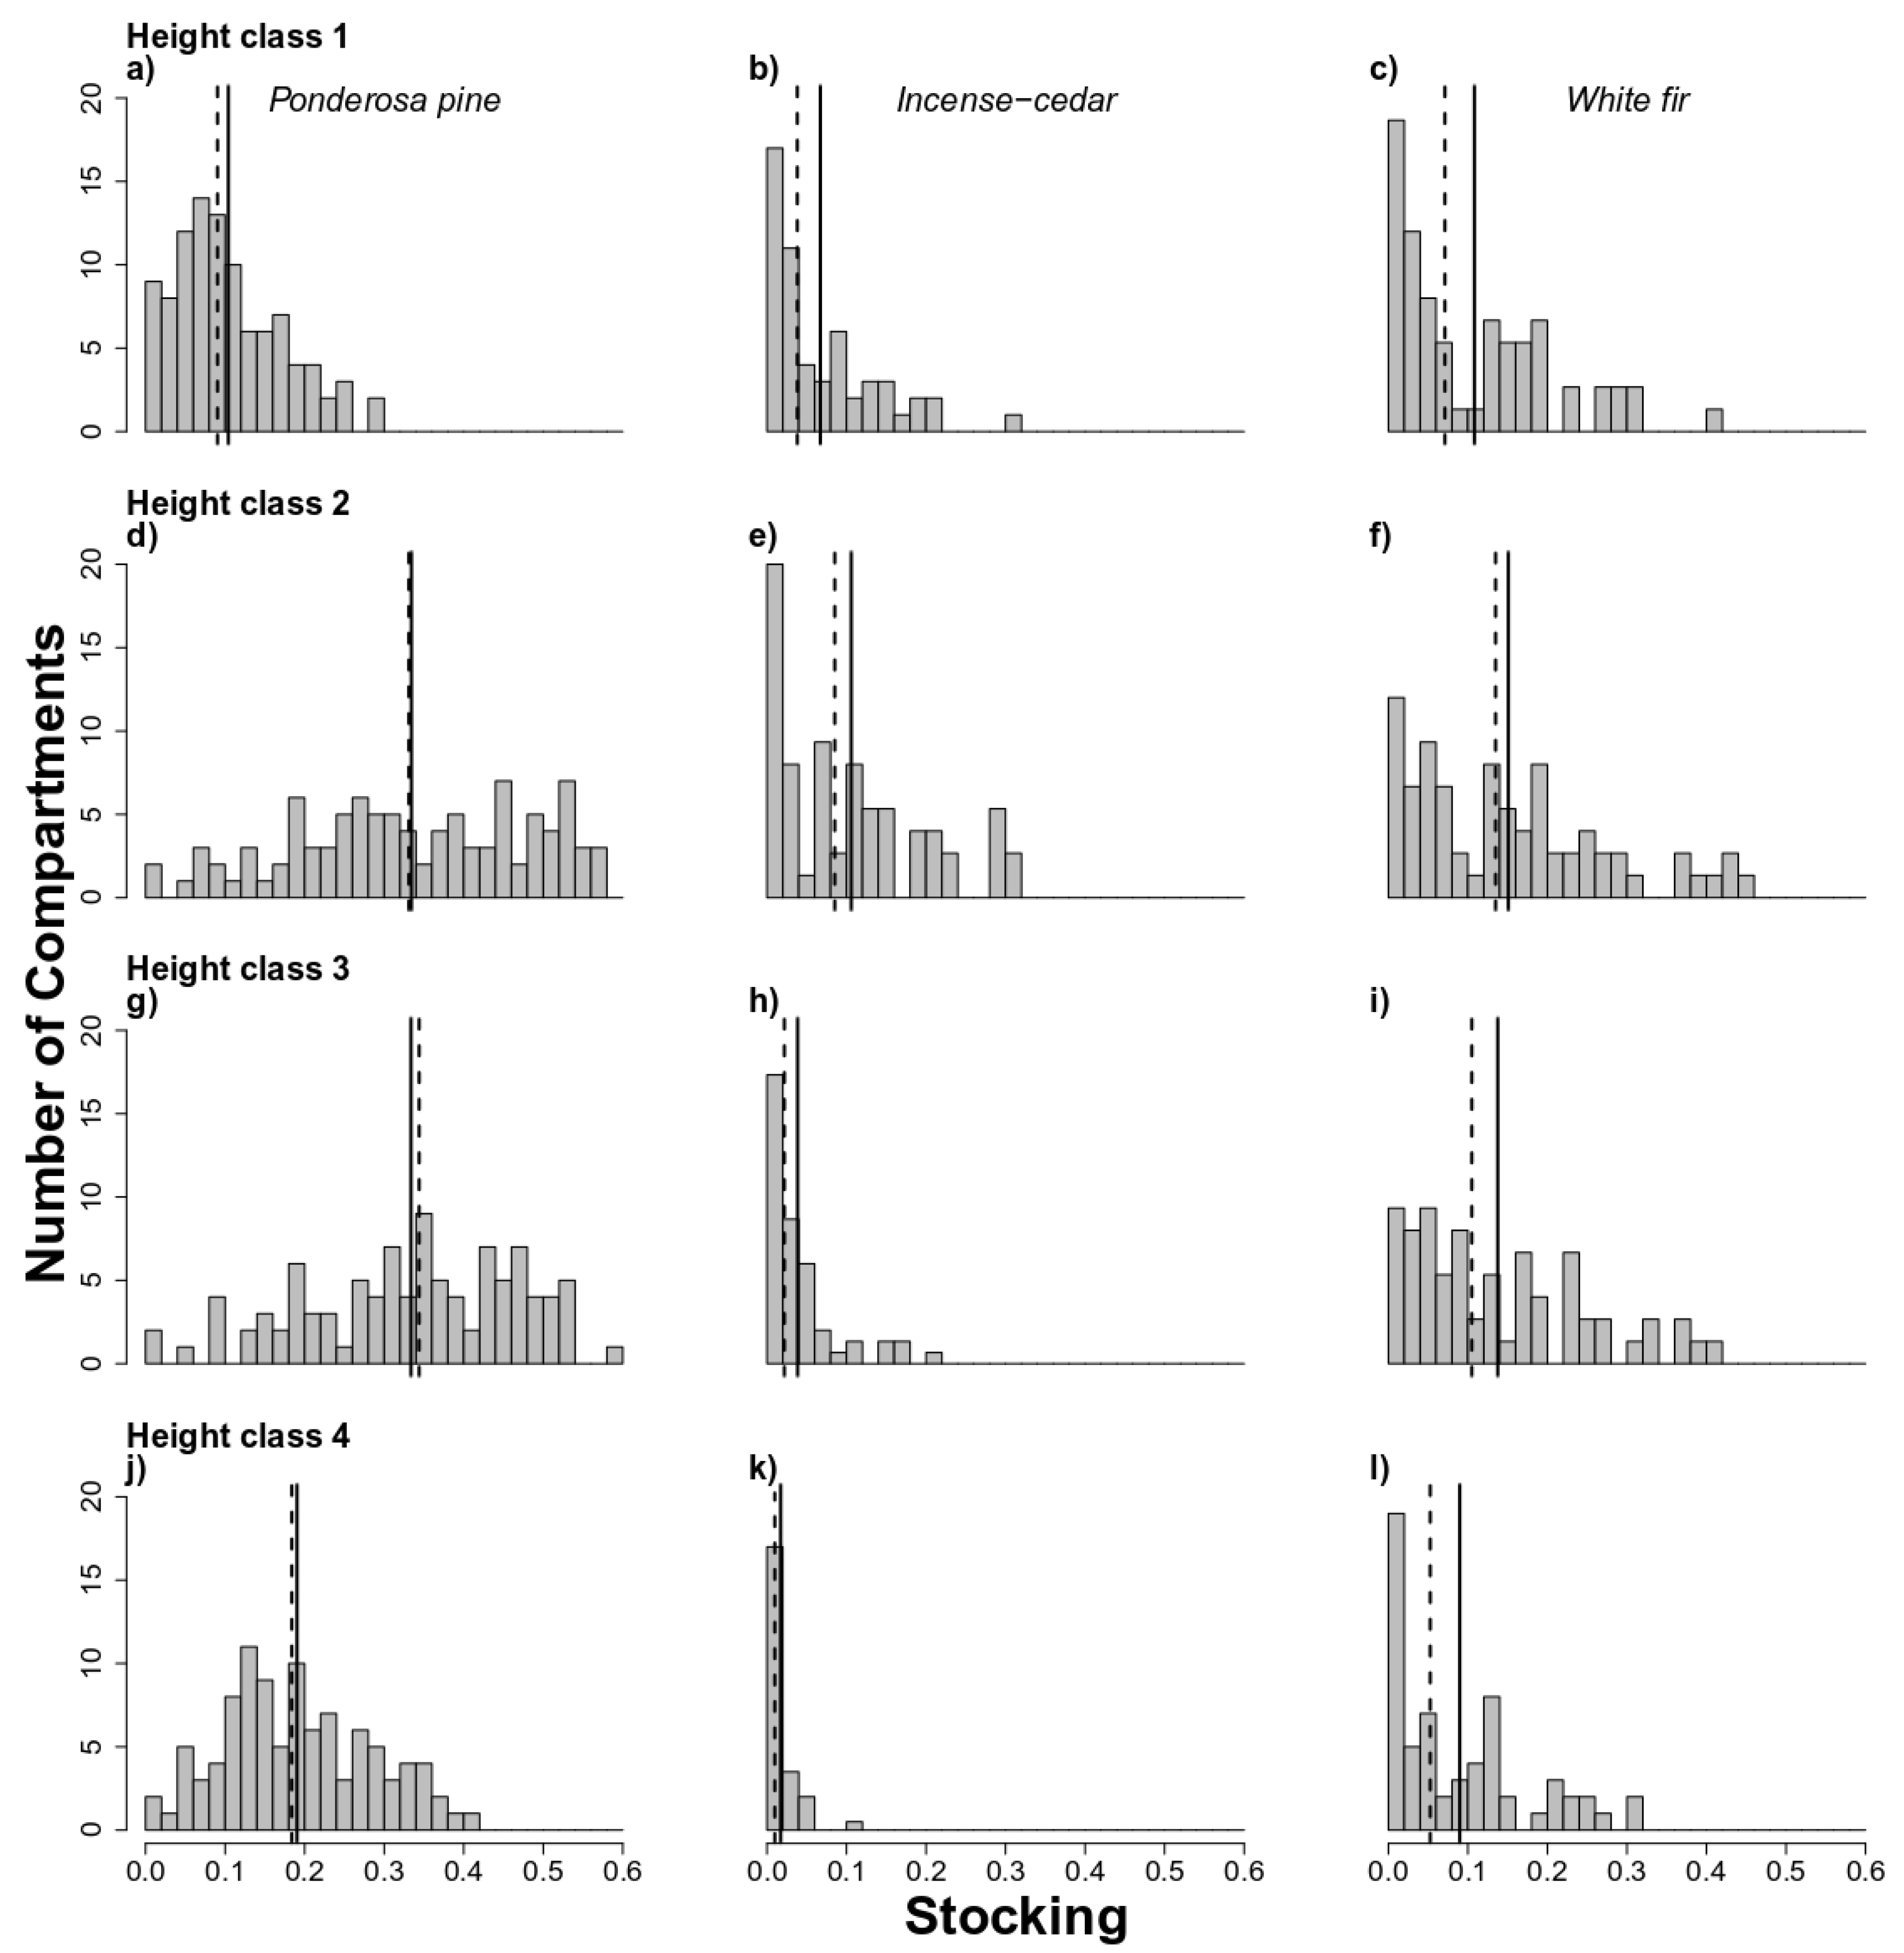
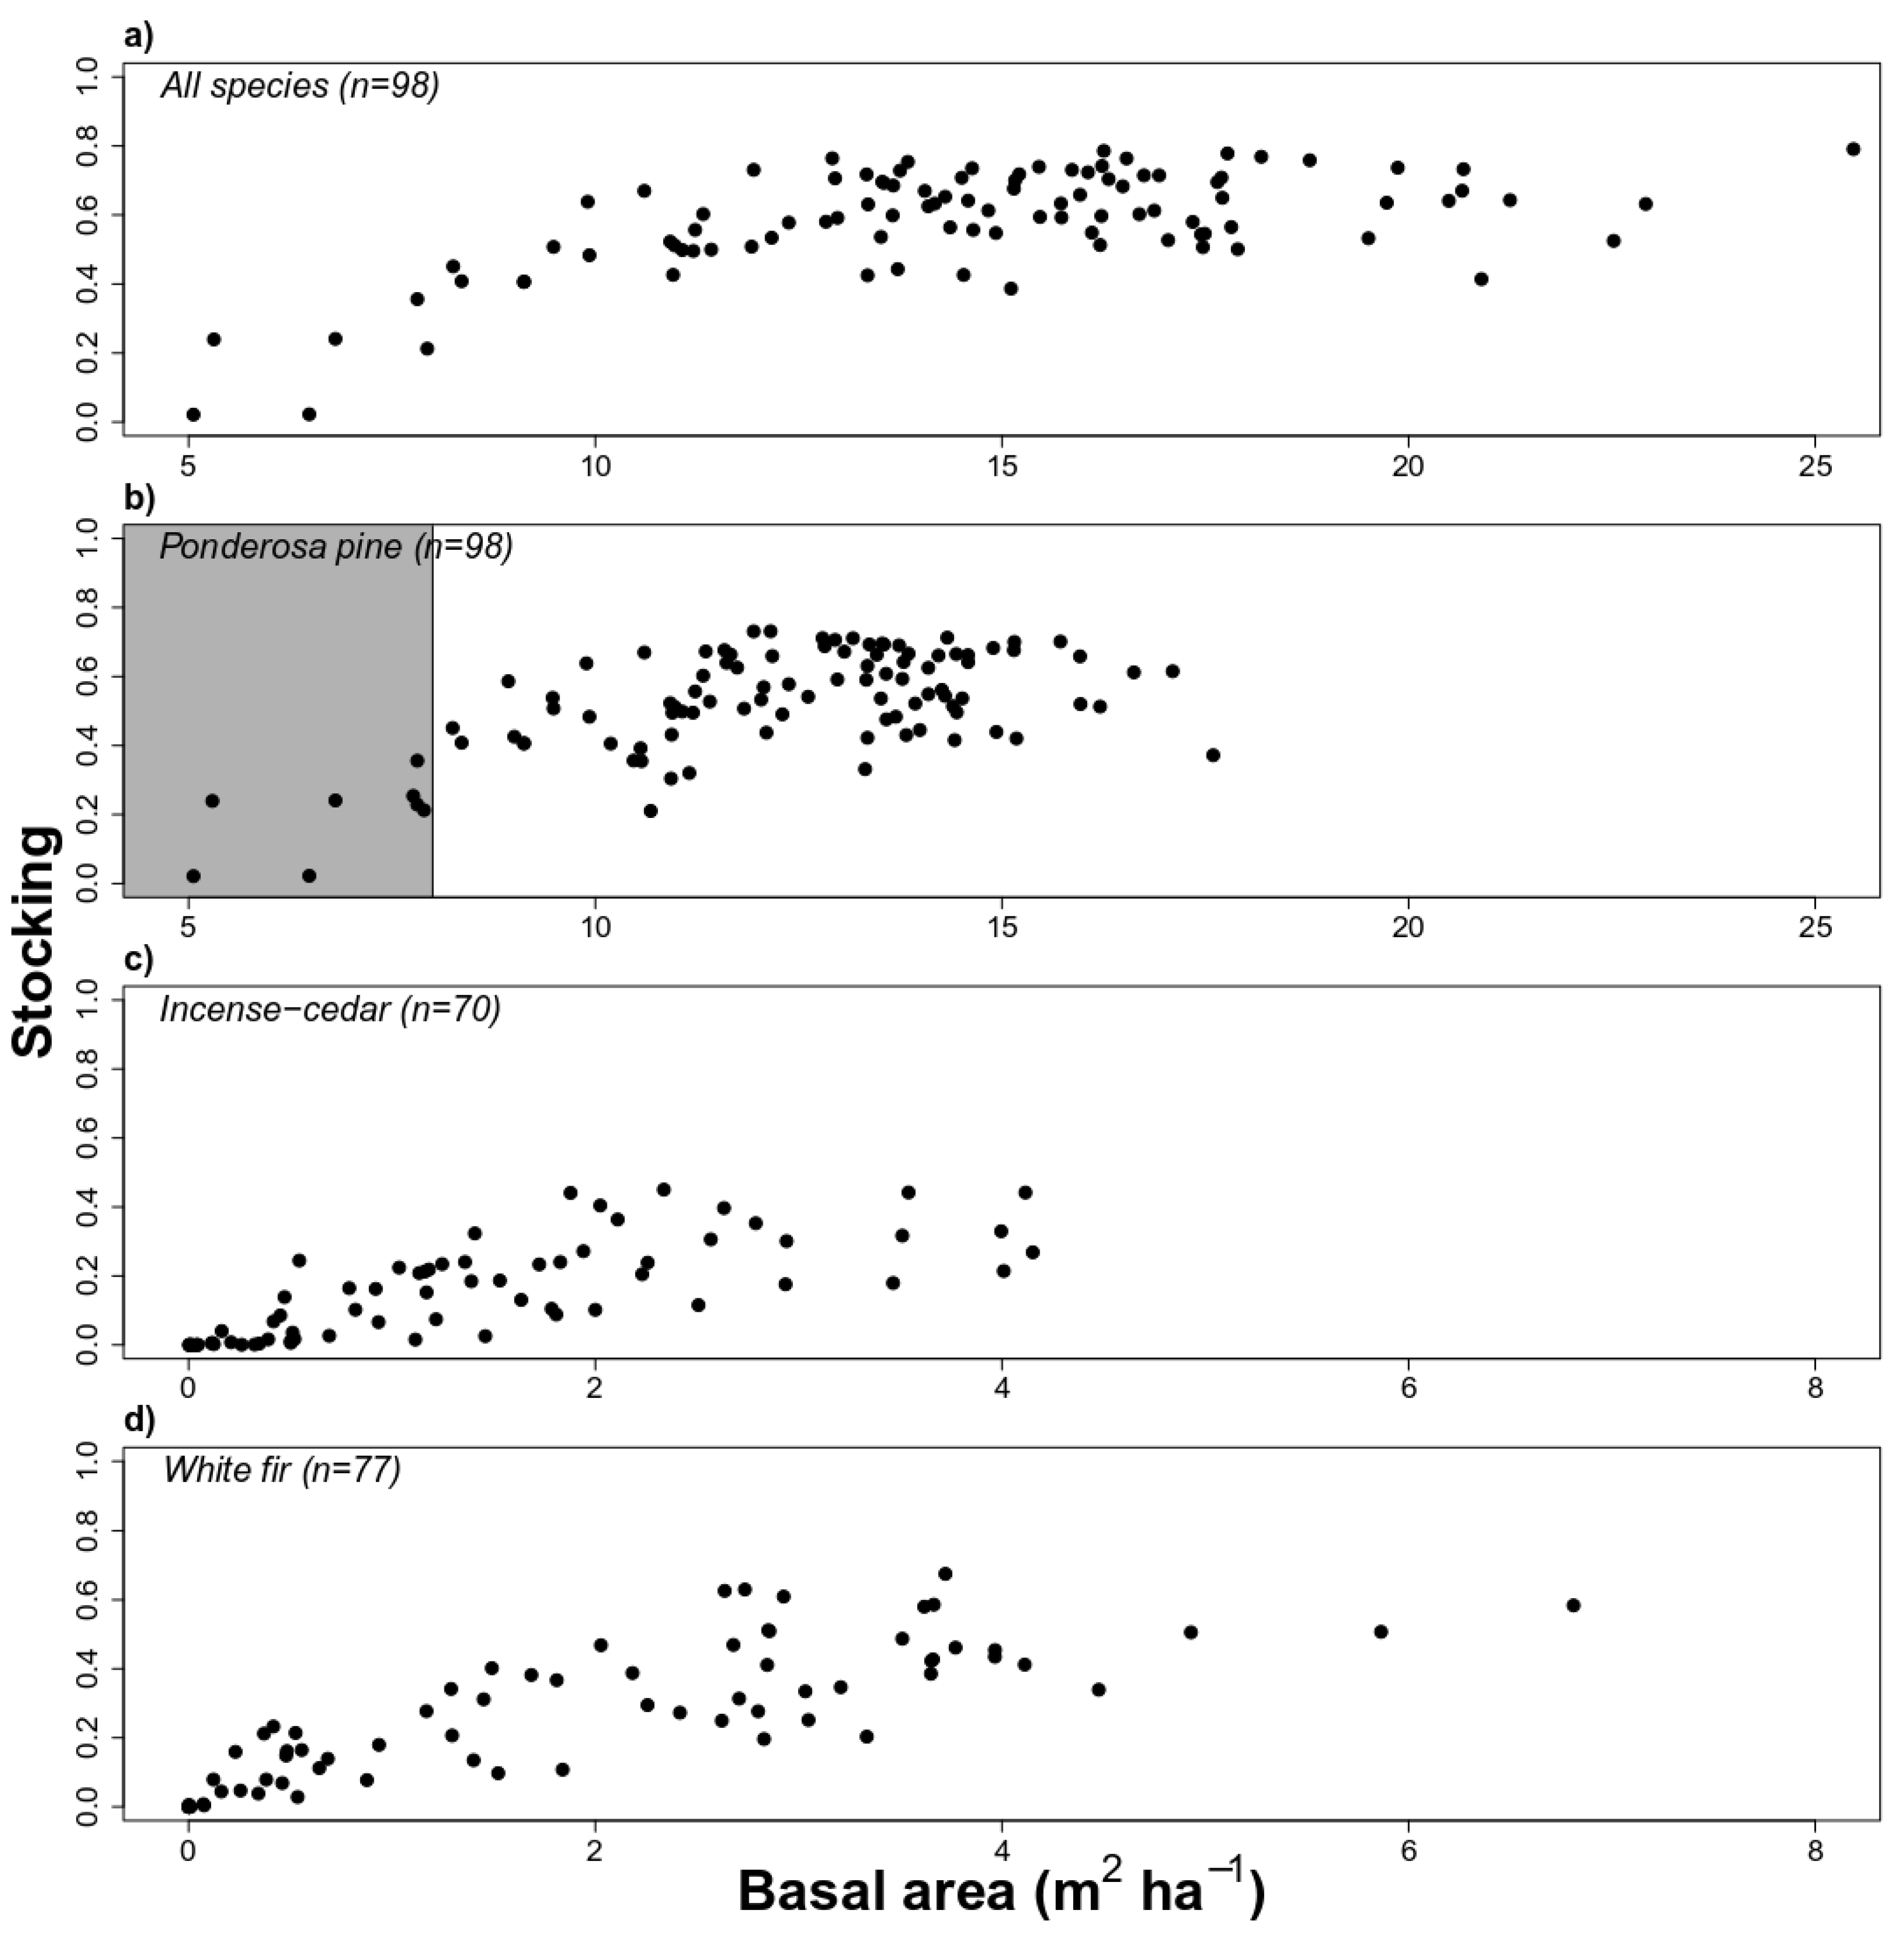
3.1. High Stocking for Ponderosa Pine Species in Historical BMEF

Our results indicated that the stocking observed in 2018 for 0.0016 ha plots corresponded well, for observations below about 1000 seedlings per hectare, with the 95% confidence limits of predicted 0.0016 ha stocking from Ritchie’s [32] equation (Figure 2). Although there is evidence of some lack of fit at the highest levels of density where model predictions of stocking may be low by around 10%. However, since for very high levels of density the model approaches one, errors in estimation will actually start to decrease for the extreme density levels observed in 1935. In 1935, the majority of compartments exhibited higher seedling densities than observed in the 12 compartments for 2018 (Table 3). Therefore, it is possible that the stocking predicted from Ritchie’s [32] equation may be a bit lower than actual stocking. However, we do not know for sure how the equation performs for high seedling densities over 1500 trees ha−1, because we did not have any 2018 data in that range for validation (Figure 2).
The estimated stocking in 1935 was dominated by ponderosa pine (Figure 3b). Our data indicated that there were no white fir and incense-cedar seedlings in 38 compartments in 1935. Most of the incense-cedar and white fir regeneration was present in the compartments at higher elevations, located in the northeast portion of BMEF. Ponderosa pine had highest stocking (mean proportion = 0.53 and median proportion = 0.54), followed by white fir (mean proportion = 0.10 and median proportion = 0.21) and incense-cedar (mean proportion = 0.10 and median proportion = 0.02) (Figure 3).
The majority of the compartments were dominated by seedlings in height classes 2 and 3 irrespective of species (Figure 4d–i). However, among the three species ponderosa pine had the highest stocking in height classes 2 (mean = 0.33 and median = 33) and 3 (mean = 0.33 and median = 0.34) (Figure 4d,g). Stocking in height classes 1 and 4, were low compared to other height classes for all three species (Figure 4).

3.2. Overstory and Soil Variables Were Associated with Stocking

We chose the model with the lowest AIC value (−191.86) and highest pseudo-R2 (0.49) and precision parameter (29.27) compared to the other tested models (Table 4). However, given the small differences in AIC values among the models (Table 4), this model is not necessarily superior to the other models in terms of model fit. This final beta regression model showed that basal area per hectare raised to an exponent of 0.10 (p-value < 0.001) and available water capacity at 150 cm (p-value < 0.001) were significantly associated with historical stocking (Table 4).
Stocking appeared to increase with increasing overstory basal area per hectare up to about 12 m2 ha−1; above this level the relationship hits a plateau (Figure 5a). Available water capacity at 150 cm had a positive relationship with stocking. Stocking increased as more water was available to plants at depth of 150 cm (Table 4). The slope-aspect transformations [48] had p-values between 0.04 and 0.07. Because the inclusion of these model terms did not improve the model substantially but increased model complexity, we decided not to include them. None of the remaining topography variables—elevation, solar insolation, and topographic wetness index—were significant in the model.

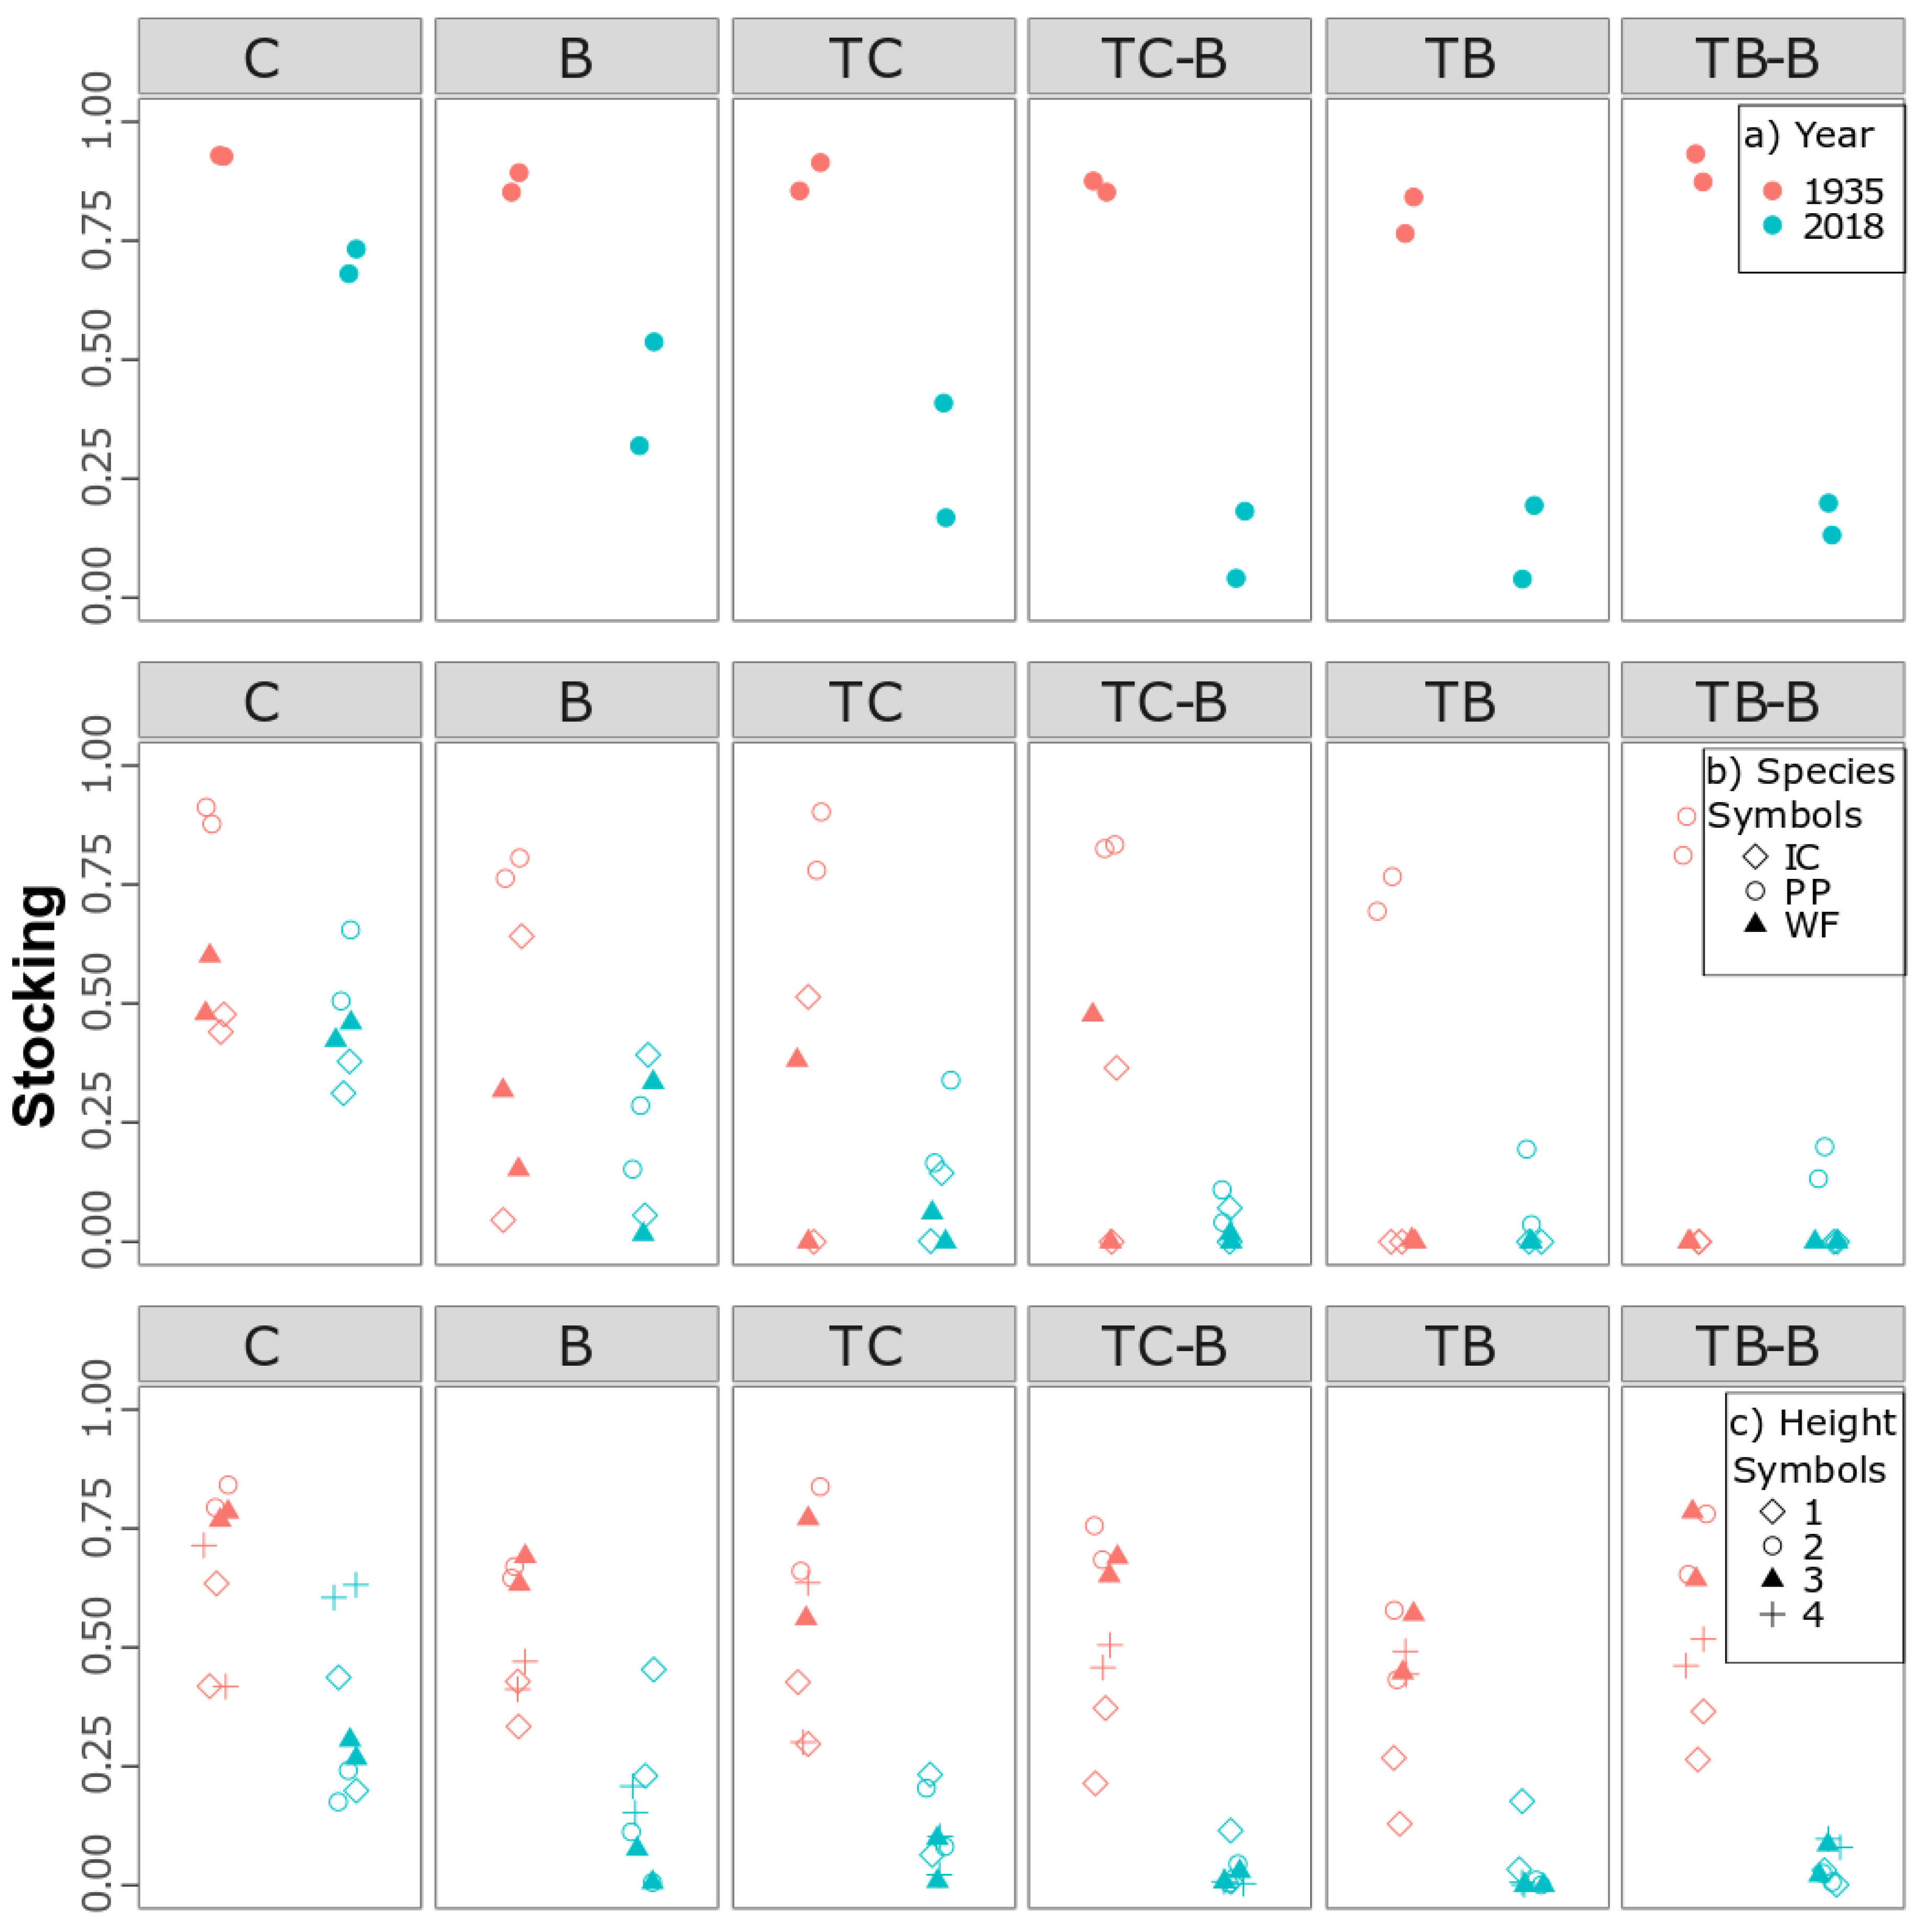
3.3. Differences in Stocking among Management Treatments in 2018

Stocking in 2018 varied across treatments (Kruskal–Wallis test p-value < 0.0001) (Figure 6a). Control (C) compartments had the highest stocking followed by burned (B) compartments (p-value < 0.0001; Figure 6a). The Wilcoxon rank sum test revealed that stocking in TC-B and TB were not significantly different from each other (p-value = 0.0816). The difference in stocking between TC-B and TB-B (p-value = 0.0028) and TC and TB-B (p-value = 0.0014) was significant. Significant differences in stocking (p < 0.0001) were found between all other treatment levels.

3.4. Historical Stocking Higher than Contemporary Stocking

Estimated stocking in 1935 was greater than observed stocking in 2018 across all the compartments (Figure 6a). Control treatments had the highest stocking in 2018 compared to the other treatments. These two compartments also had the highest stocking in 1935 (Figure 6a). The majority of compartments were dominated by stocking of ponderosa pine followed by incense-cedar in both historical 1935 and contemporary 2018 conditions (Figure 6b). Stocking in 1935 was dominated by height classes 2 and 3 (Figure 6c). In 2018 stocking was dominated by height class 4 in control compartments (Figure 6c), while compartments that received the burn treatment were mostly stocked with seedlings from height classes 1 and 4 (Figure 6c). The compartments that received thinning treatments had very low stocking, with height classes 1 and 2 being a bit more abundant than height classes 3 and 4 (see TC-B, TC and TB in Figure 6c).

4. Discussion

Our research was able to meet four objectives, which were to (1) understand historical stocking in terms of species and height class, (2) determine the factors associated with historical stocking, (3) understand the contemporary stocking across various management treatments, and (4) compare historical stocking with contemporary stocking across BMEF. Prior to the onset of any forest management activities, the historical stocking was dominated by ponderosa pine in height classes 2 and 3 throughout BMEF. The major drivers of stocking in the historical forest were overstory basal area and soil moisture. There were differences in stocking among management treatments in contemporary forests, and stocking was higher in historical than in contemporary forests.

4.1. Historical Stocking Was Dominated by Ponderosa Pine at Low Elevations

In the early 1930s, after sheep grazing [33] and prior to the onset of timber harvesting activities, low elevation sites of BMEF were dominated by ponderosa pine stands [34]. The landscape in BMEF has gentle slopes with the majority of the forest in south or southwestern aspect and with an average slope of less than 15% [34]. Such south-facing gentle slopes have been reported to favor seedling germination of ponderosa pine in northern California [59]. The observed dominance of ponderosa pine stocking in these low elevation sites of BMEF can further be explained by overstory basal area per hectare being a major driver of stocking in the historical BMEF. Ponderosa pine dominated the overstory, and its presence not only facilitates the establishment of regeneration by supplying ample seeds [60], but also ameliorates the harsher environmental conditions caused by high temperatures, solar radiation, and wind [61].
Moderate overstory basal area, ranging from 7 to 23 m2 ha−1—96% of BMEF fell within this range—is reported to be conducive for establishment of ponderosa pine seedlings [4,62]. In 1934, BMEF exhibited low to moderate overstory basal area for ponderosa pine (0 to 25 m2 ha−1) and low overstory basal area (0 to 7 m2 ha−1) for incense-cedar and white fir. The observed low to moderate overstory basal area maintained an open park-like structure in the majority of BMEF, which favored germination and growth of shade-intolerant ponderosa pine seedlings.
The observed high stocking for incense-cedar and white fir in some of the compartments in the northeast portion of BMEF may be due to these compartments being located in more mesic and higher elevation sites. Mesic and higher elevation sites have been reported to be more conducive to these species [59]. A mixture of all three species in the overstory may have created a dense overstory, which provided enough shade for the growth of shade tolerant incense-cedar and white fir [63]. At the same time, the presence of mature incense-cedar and white fir trees provided the seeds necessary for germination [63].

4.2. Historical Stocking Was Dominated by Height Classes 2 and 3

Land survey records across dry forests in Oregon, California, and parts of northern Arizona in the late 1800s showed that regeneration—seedlings and/or saplings—were observed over 35–57% of the dry-forests [64]. The absence of surface fires after Euro-American settlement failed to control their growth and establishment in these areas [64]. At the time of the 1935 regeneration data collection, BMEF had experienced over 35 fire-free years (unpublished fire scar data from Carl Skinner, United States Forest Services, retired). This fire free period may be attributed to heavy sheep grazing in the area [33]. Hence, seedlings that were established around the early 1900s due to the absence of fire could have stagnated in height growth throughout BMEF. Stand stagnation could explain the observed higher stocking in height classes 2 (0.31–0.91 m) and 3 (0.91–1.83 m) compared to height classes 1 and 4 throughout BMEF in 1935. Lacking age data for the 1935 forest conditions, we are unable to make any specific comments on height and age dynamics of seedlings within the historical ponderosa pine forest in BMEF. Oliver [65] reported dense thickets of saplings that had an average height of 2.7 m at the age of 70 within BMEF as a result of stand stagnation. Similarly, Weaver [9] reported stand stagnation after the establishment of regeneration in ponderosa pine forests in Washington and Oregon, USA, because of fire exclusion. Therefore, the seedlings/saplings that were observed in smaller height classes 1 (0–0.31 m) and 2 could be as old as seedlings/saplings in height classes 3 and 4 (>1.3 m) due to stagnation.
Differences in stocking for various height classes could also be attributed to a lag in regeneration—a period of no regeneration—between two pulses of regeneration [11]. Regeneration lags occur due to the periodicity of ponderosa pine, which is driven by heavy cone production years followed by years of few cones or no cones at all [66]. Ponderosa pine can experience a regeneration lag from 15 to 70 years between the establishments of seedlings [67,68]. During this regeneration lag, ponderosa pine can be predisposed to unusual climatic episodes that can fluctuate between wetter fire-free and drier fire-prone periods [69]. If a long drier and fire-prone period prevails, there will be a longer gap in regeneration before another good seed year [70]. Hence, a gap in regeneration might result in the differentiation of seedlings in various height classes. The differentiation of stocking in various height classes can also be attributed to variability in growth due to site effects [71] and localized competition for nutrients and soil moisture [10]. For example, seedlings that germinated at the same time, but in favorable sites might have gained growth in height compared to seedlings growing in poorer sites, which lagged in height growth. Oliver and Powers [71] in their study in the western Sierra Nevada, southern Cascade Range, and Warner Mountains of northeastern California found that seedlings that germinated at the same time reached diameter at breast height at 13.5 years of age on poor-sites as compared to 4.4 years on better sites.

4.3. Available Water Capacity at 150 cm and Overstory Basal Area Were Drivers of Historical Stocking

Interactions of topographic variables—elevation, slope, and aspect—result in heterogeneous forest structure in the dry forests across the Sierra Nevada and Southern Cascades, usually through changing the patterns and amount of regeneration along topographic gradients [72]. However, in our study, topographic variables such as elevation, slope, and aspect were not found to be major drivers of stocking. This is possibly due to the limited range in elevation—1700 to 2100 m—and a gentle slope of less than 15% on average [34].
A good seed crop followed by a favorable moisture regime and receptive seed bed is needed for the establishment of ponderosa pine seedlings [11]. We observed that within BMEF available water capacity at the depth of 150 cm was one driver of stocking in 1935. A large number of seedlings possibly germinated due to ample moisture availability within their rooting zone [59,73,74]. Ponderosa pine seedlings have been shown to survive in areas with low precipitation by maintaining high water use efficiencies and root systems—12 to 50 cm deep—that utilize moisture available in their rooting zone [73,75].
Stocking showed a curvilinear relationship with increasing overstory basal area per hectare (Figure 5a). Overstory basal area was dominated by ponderosa pine basal area and therefore, mainly driven by the presence of ponderosa pine. However, the observed highest stocking and overstory densities in higher-elevation compartments in the northeast portion of BMEF could be due to the presence of all three species [63,76,77]. While the observed relationship between overstory basal area per hectare and stocking was stronger than the relationship between available water capacity at the depth of 150 cm, the overall model fit was not very good, as suggested by the moderately low pseudo-R2 of 0.49. Stocking tended to be slightly overpredicted for lower overstory basal area per hectare ranges, and variability in the data was quite high.
The fitted beta regression model provides general insights about the variables that explain stocking in the historical BMEF environment. Our model, however, comes with the limitations that the soil variables used in the model were derived from an Ecological Unit Inventory (EUI) map produced in 1994 [46] decades after 1935, when the historical regeneration data were collected. In the absence of field-collected soil data, we have to make an assumption that the information on soil variables derived from the EUI map represents the soil conditions that existed in BMEF around 1935 and has not changed. Additional variability in stocking could possibly be explained by incorporating fire history variables such as time since fire, fire frequency, and fire return interval into the model [8]. However, in this study, availability of fire history variables was limited to 28 of the 100 compartments. The fire history variables were statistically significant when we added them to the model using the 28 compartments. Considering the small sample size of 28, the model was overfit with these additional variables and we did not think it was meaningful to report the results in detail. Yet, this exploratory analysis confirms that fire history variables could explain some of the observed variability in stocking.

4.4. Contemporary Stocking Was Low in Thinned Stands and Differed across Treatments

In 2018, compartments that received thinning treatments—thinning from below and combination thinning—with or without prescribed fire had lower stocking than the compartments that received the burn only treatment. The mechanical thinning treatments mostly removed the trees up to a diameter of 40.38 cm including the seedlings and saplings up to a diameter of ~7 cm, which can explain the low observed stocking in these compartments [34,37]. In addition, within the compartments that received prescribed fires after the thinning treatments, fire might have killed additional seedlings resulting in lower stocking compared to treatments that received thinning only. Another possible reason for low stocking within the combination thinning and thinning from below could be the lack of seed sources near thinned sites [76,77]. Within the thinned sites, due to reductions in canopy cover, seedlings are likely to get exposed to high levels of direct solar radiation [78,79]. This may lead to seedling desiccation and death within thinned compartments [59], where regeneration was already removed during the thinning treatments.
In contrast, higher stocking in the burn only treatment compared to the treatments that received thinning can possibly be attributed to the fire having reduced heavy accumulation of litter and duff, which allowed seeds to reach mineral soil and extract adequate soil moisture for germination [73]. At the same time, the overstory that survived the prescribed fire, provided favorable environmental conditions at microsites for germination and growth of seedlings [73]. The presented results for the burn only treatment should be taken with caution, as time since management might have played an important role in determining the amount of stocking across various management scenarios at BMEF. Burn only treatments were implemented in 1997 while the compartments that received thinning from below in 2012 were burned in 2017 [41]. We collected the regeneration data in 2018. There was a gap of 20 years between application of treatments and data collection in the burn only treatment. During this 20-year window, seedlings might have established in the burn only treatments and resulted in the observed higher stocking. In the compartments that received thinning from below and combination thinning with or without fire, there was a gap of only one year between application of fire and data collection. This may explain the observed lower stocking in these treatments. Because time since treatment was different for the different treatments, the observed treatment effect may be confounded with time.
The observed lower stocking in burned compartments compared to the control compartments may be explained by the mortality of the seedlings over time due to crown scorch and cambium wounding [17]. In the absence of any management activities and fire for many decades in the control compartments [34], the seedlings could have stagnated within the stands during various episodes of recruitment, which resulted in high stocking [65]. In addition, the control compartments were located at somewhat higher elevations and within mesic sites than the burn only treatments. These conditions are conducive in terms of available microsites for shade-tolerant white fir and incense-cedar [16], which was confirmed by the higher stocking observed for incense-cedar and white-fir in the control compartments. Therefore, within these compartments higher stocking may also be explained by the higher abundance of seedlings of the shade-tolerant species and a more mesic environment, rather than by the fact that they did not receive any management.

4.5. Higher Historical Stocking than in Managed, Contemporary Stands

The observed lower stocking in 2018 compared to 1935 may indicate that the contemporary forest structure is not as conducive to regeneration as it used to be prior to 1935. Due to infilling of trees, there may be lack of growing space in contemporary forests [80]. In 1935, however, the forest structure was more open, maintained by frequent surface fires, which reduced shading and resource competition and prepared fine mineral seedbeds for seedling germination [17]. However, the differences in stocking between historical and contemporary forests could also simply be due to the management treatments that were applied in the contemporary forests, where the mechanical thinning treatments removed most of the regeneration and prescribed fires may have killed additional regeneration [34,37].

5. Conclusions

The trajectories of future forest stand structures in ponderosa pine forests of northern California depend on the regeneration response to management and environmental conditions. Historical regeneration studies allow managers to understand the relationships between regeneration and environmental factors, which in turn shape the overall stand structure.
Our field inventory data driven study showed that historically, the regeneration in BMEF was dense and dominated by shade-intolerant ponderosa pine seedlings in height classes 2 and 3 at the lower elevations of the forest. More mesic sites at higher elevations exhibited high stocking of shade-tolerant incense-cedar and white fir. Seedlings that were established around the early 1900s found the available growing space in open park-like conditions favoring the germination and growth of ponderosa pine seedlings. Additionally, in absence of fire to check the growth, seedlings could have stagnated in height growth throughout BMEF, which resulted in high stocking in height classes 2 and 3.
Overstory basal area per hectare and available water capacity at 150 cm depth were related to historical stocking. Stocking increased with both increasing overstory basal area as well as increasing available water capacity. Topography variables were not significant in the final beta regression model.
The amount of regeneration was different across management treatments in contemporary conditions. The time since management played a key role in determining the differences in stocking within contemporary BMEF. Compartments that were recently thinned and burned had lower stocking compared to compartments that were burned and thinned 20 years prior.
The stocking in the contemporary BMEF was lower than the stocking in the historical forests. The primary reason for lower stocking in contemporary conditions was because most of the small trees, seedlings, and saplings were either removed by thinning or killed due to fire by recent management activities.
The results of this study are unique because much of our current knowledge on historical regeneration has been based on dendro-chronological reconstructions, which cannot provide the kind of detailed information about historical regeneration conditions that we have presented in this study.

Author Contributions

Conceptualization, S.N., B.N.I.E., and M.W.R.; Data curation, S.N. and M.W.R.; Formal analysis, S.N.; Investigation, S.N., B.N.I.E., and M.W.R.; Methodology, S.N. and M.W.R.; Project administration, B.N.I.E.; Resources, B.N.I.E. and M.W.R.; Supervision, B.N.I.E.; Visualization, S.N. and M.W.R.; Writing—original draft, S.N.; Writing—review & editing, B.N.I.E. and M.W.R. All authors have read and agreed to the published version of the manuscript.

Funding

This research was funded by the USDA Forest Service, Pacific Southwest Research Station (grant number: 15-IJ-11272139-016).

Acknowledgments

Support for this study was provided by the Lassen National Forest, Blacks Mountain Experimental Forest. Data collection was performed by USDA PSW-Redding’s field crew under supervision of Martin Ritchie. Earl Alexander provided valuable insights on the Ecological Unit Inventory map. Special thanks go to Ethan Hammett and Brian Wing for providing the GIS data layers and support on any related questions.

Conflicts of Interest

The authors declare no conflict of interest.

References

  1. McKelvey, K.S.; Skinner, C.N.; Chang, C.; Erman, D.C.; Husari, S.J.; Parsons, D.J.; Van Wagtendonk, J.W.; Weatherspoon, C.P. An Overview of Fire in the Sierra Nevada; University of California, Davis, Centers for Water and Wildland Resources: Auckland, CA, USA, 1996; p. 8. [Google Scholar]
  2. Fitzgerald, S. Fire Ecology of Ponderosa Pine and the Rebuilding of Fire-Resilient Ponderosa Pine; Technical Report; Pacific Southwest Research Station, Forest Service, U.S. Department of Agriculture: Albany, CA, USA, 2005; pp. 197–225.
  3. Long, J.N.; Windmuller-Campione, M.; De Rose, R.J. Building resistance and resilience: Regeneration should not be left to chance. Forests 2018, 9, 270. [Google Scholar] [CrossRef] [Green Version]
  4. Puhlick, J.J.; Laughlin, D.C.; Moore, M.M. Factors influencing ponderosa pine regeneration in the southwestern USA. For. Ecol. Manag. 2012, 264, 10–19. [Google Scholar] [CrossRef]
  5. Brown, P.M.; Sieg, C.H. Fire history in interior ponderosa pine communities of the Black Hills, South Dakota, USA. Int. J. Wildl. Fire 1996, 6, 97–105. [Google Scholar] [CrossRef] [Green Version]
  6. Allen, C.D.; Savage, M.; Falk, D.A.; Suckling, K.F.; Swetnam, T.W.; Schulke, T.; Stacey, P.B.; Morgan, P.; Hoffman, M.; Klingel, J.T. Ecological restoration of southwestern ponderosa pine ecosystems: A broad perspective. Ecol. Appl. 2002, 12, 1418–1433. [Google Scholar] [CrossRef]
  7. Show, S.B.; Kotok, E.I. The Role of Fire in the California Pine Forests; Technical Bulletin; United States Department of Agriculture: Washington, DC, USA, 1924; p. 80.
  8. Taylor, A.H. Fire disturbance and forest structure in an old-growth Pinus ponderosa forest, southern Cascades, USA. J. Veg. Sci. 2010, 21, 561–572. [Google Scholar] [CrossRef]
  9. Weaver, H. Fire as an ecological and silvicultural factor in the ponderosa pine region of the Pacific slope. Fire Ecol. 1943, 41, 7–15. [Google Scholar] [CrossRef] [Green Version]
  10. Schubert, G.H. Silviculture of Southwestern Ponderosa Pine: The Status of Our Knowledge; United States Department of Agriculture Forest Service, Rocky Mountain Research Station: Fort Collins, CO, USA, 1974; p. 71.
  11. Cooper, C.F. Changes in vegetation, structure, and growth of southwestern pine forests since white settlement. Ecol. Monogr. 1960, 30, 129–164. [Google Scholar] [CrossRef]
  12. Dodson, E.K.; Root, H.T. Conifer regeneration following stand-replacing wildfire varies along an elevation gradient in a ponderosa pine forest, Oregon, USA. For. Ecol. Manage. 2013, 302, 163–170. [Google Scholar] [CrossRef]
  13. Van Pelt, R.; Franklin, J.F. Response of understory trees to experimental gaps in old-growth Douglas-fir forests. Ecol. Appl. 1999, 9, 504–512. [Google Scholar] [CrossRef]
  14. Angell, N.; Waring, K.M.; Graves, T.A. Predicting height growth of sugar pine regeneration using stand and individual tree characteristics. Forestry 2014, 87, 85–98. [Google Scholar] [CrossRef] [Green Version]
  15. Oliver, C.D.; Larson, B.C. Forest Stand Dynamics: Updated Edition; John Wiley & Sons: Hoboken, NJ, USA; C.D.Oliver & B.C. Larson: New York, NY, USA, 1996; ISBN 0471138339. [Google Scholar]
  16. Zald, H.S.J.; Gray, A.N.; North, M.; Kern, R.A. Initial tree regeneration responses to fire and thinning treatments in a Sierra Nevada mixed-conifer forest, USA. For. Ecol. Manag. 2008, 256, 168–179. [Google Scholar] [CrossRef]
  17. Bailey, J.D.; Covington, W.W. Evaluating ponderosa pine regeneration rates following ecological restoration treatments in northern Arizona, USA. For. Ecol. Manag. 2002, 155, 271–278. [Google Scholar] [CrossRef]
  18. McKelvey, K.S.; Johnston, J. Historical Perspectives on Forests of the Sierra Nevada and the Transverse Ranges of Southern California: Forest Conditions at the Turn of the Century; Technical Report; United States Forest Service, Pacific Southwest Research Station: Albany, CA, USA, 1992; p. 22. [Google Scholar]
  19. Van Wagtendonk, J.W.; Sugihara, N.G.; Stephens, S.L.; Thode, A.E.; Fites-Kaufman, J. Sierra Nevada bioregion. In Fire in California’s Ecosystems; Sugihara, N.G., Van Wagtendonk, J.W., Fites-Kaufman, J., Shaffer, K.E., Thode, A.E., Eds.; University of California Press: Auckland, CA, USA, 2006; pp. 264–294. ISBN 0520246055. [Google Scholar]
  20. Pearson, G.A. Management of Ponderosa Pine in the Southwest: As Developed by Research and Experimental Practice; United States Department of Agriculture: Washington, DC, USA, 1950; p. 218.
  21. Kilgore, B.M. The ecological role of fire in Sierran conifer forests. Its application to National Park management. Quat. Res. 1973, 3, 496–513. [Google Scholar] [CrossRef]
  22. Stephens, S.L.; Lydersen, J.M.; Collins, B.M.; Fry, D.L.; Meyer, M.D. Historical and current landscape-scale ponderosa pine and mixed conifer forest structure in the southern Sierra Nevada. Ecosphere 2015, 6, 1–63. [Google Scholar] [CrossRef]
  23. Farnden, C. Forest Regeneration in the ESSF Zone of North-Central British Columbia; Pacific and Yukon Region, Pacific Forestry Centre, Forestry Canada: Victoria, BC, Canada, 1994; p. 31. [Google Scholar]
  24. League, K.; Veblen, T. Climatic variability and episodic Pinus ponderosa establishment along the forest-grassland ecotones of Colorado. For. Ecol. Manag. 2006, 228, 98–107. [Google Scholar] [CrossRef]
  25. Savage, M.; Brown, P.M.; Feddema, J. The role of climate in a pine forest regeneration pulse in the southwestern United States. Ecoscience 1996, 3, 310–318. [Google Scholar] [CrossRef]
  26. Harley, G.; Baisan, C.; Brown, P.; Falk, D.; Flatley, W.; Grissino-Mayer, H.; Hessl, A.; Heyerdahl, E.; Kaye, M.; Lafon, C.; et al. Advancing dendrochronological studies of fire in the United States. Fire 2018, 1, 11. [Google Scholar] [CrossRef] [Green Version]
  27. Keyser, T.L.; Lentile, L.B.; Smith, F.W.; Shepperd, W.D. Changes in forest structure after a large, mixed-severity wildfire in ponderosa pine forests of the black hills, South Dakota, USA. For. Sci. 2008, 54, 328–338. [Google Scholar]
  28. Fulé, P.Z.; Crouse, J.E.; Roccaforte, J.P.; Kalies, E.L. Do thinning and/or burning treatments in western USA ponderosa or Jeffrey pine-dominated forests help restore natural fire behavior? For. Ecol. Manag. 2012, 269, 68–81. [Google Scholar] [CrossRef]
  29. Stein, W.I. Regeneration surveys and evaluation. In Reforestation Practices in Southwestern Oregon and Northern California; Hobbs, S.D., Ed.; Forest Research Laboratory, Oregon State University: Corvallis, OR, USA, 1992; pp. 346–382. [Google Scholar]
  30. Lowdermilk, W.C. A method for rapid surveys of vegetation. J. For. 1927, 25, 181–185. [Google Scholar]
  31. Lynch, D.W.; Schumacher, F.X. Concerning the dispersion of natural regeneration. J. For. 1941, 39, 49–51. [Google Scholar]
  32. Ritchie, M.W. Relating stocking and density for natural regeneration of conifers in northern California. For. Sci. 2020, fxaa005. [Google Scholar] [CrossRef]
  33. Skinner, C.N.; Taylor, A.H. Southern Cascades bioregion. In Fire in California’s Ecosystems; Sugihara, N.G., van Wagtendonk, J.W., Fites-Kaufmann, J., Shaffer, K.E., Thode, A.E., Eds.; University of California Press: Berkeley, CA, USA, 2006; pp. 195–224. [Google Scholar]
  34. Ritchie, M.W. Multi-scale reference conditions in an interior pine-dominated landscape in northeastern California. For. Ecol. Manag. 2016, 378, 233–243. [Google Scholar] [CrossRef]
  35. Wing, B.M.; Ritchie, M.W.; Boston, K.; Cohen, W.B.; Gitelman, A.; Olsen, M.J. Prediction of understory vegetation cover with airborne lidar in an interior ponderosa pine forest. Remote Sens. Environ. 2012, 124, 730–741. [Google Scholar] [CrossRef]
  36. Oliver, W.W. Ecological Research at the Blacks Mountain Experimental Forest in Northeastern California; Technical Report; United States Department of Agriculture Forest Service, Pacific Southwest Research Station: Albany, CA, USA, 2000; p. 66.
  37. Hallin, W.E. The Application of Unit Area Control in the Management of Ponderosa-Jeffrey Pine at Black Mountains Experimental Forest; Technical Bulletin; United States Department of Agriculture: Washington, DC, USA, 1959; p. 96.
  38. Eaton, C.B. Insect-Caused Maortality in Relation to Methods of Cutting in Ponderosa Pine on Blacks Mountain Experimental Forest; Technical Report; Pacific Southwest Forest and Range Experiment Station, Forest Service, USDA: Berkeley, CA, USA, 1959; p. 36. [Google Scholar]
  39. Salman, K.A.; Bongberg, J.W. Logging high risk trees to control insects in the pine stands of northern California. J. For. 1942, 40, 533–549. [Google Scholar]
  40. Camann, M.A.; Gillette, N.E.; Lamoncha, K.L.; Mori, S.R. Response of forest soil Acari to prescribed fire following stand structure manipulation in the southern Cascade Range. Can. J. For. Res. 2008, 38, 956–968. [Google Scholar] [CrossRef]
  41. Crotteau, J.S.; Ritchie, M.W. Long-term stand growth of interior ponderosa pine stands in response to structural modifications and burning treatments in northeastern California. J. For. 2014, 112, 412–423. [Google Scholar] [CrossRef] [Green Version]
  42. PSW Reserach Station Instruction for Type Map and Inventory of Experimental Forest; Technical Report; United States Dep. Agric. For. Serv.: Redding, CA, USA, 1935; p. 9.
  43. Ginrich, S. Measuring and evaluating stocking and stand density in upland hardwood forests in the central states. For. Sci. 1967, 13, 38–53. [Google Scholar]
  44. Gill, C. A study of the relationship between the number of trees per acre and dispersion. For. Chron. 1950, 186–196. [Google Scholar] [CrossRef] [Green Version]
  45. Ghent, A.W. Studies of regeneration in forest stands devastated by the spruce budworm. For. Sci. 1969, 15, 417–429. [Google Scholar]
  46. Alexander, E.B. Experimental Forests and Ranges of the Pacific Southwest Research Station; Unpubl. Rep. file Pacific Southwest Res. Station. United States Dep. Agric. For. Serv: Redding, CA, USA, 1994.
  47. Wilson, J.P. GIScience research at the 2017 Esri International User Conference. Trans. GIS 2017, 21, 431–433. [Google Scholar] [CrossRef]
  48. Stage, A. An expression for the effect of aspect, slope, and habitat type on tree growth. For. Sci. 1976, 22, 457–460. [Google Scholar]
  49. Reed, T.W.; Gulland, E.; West, G.; Mcmeekin, D.A.; Moncrieff, S. Geographic metadata searching with semantic and spatial filtering methods. In Proceedings of the GEOProcessing 2016: The Eighth International Conference on Advanced Geographic Information Systems, Applications, and Services, Venice, Italy, 24–28 April 2016. [Google Scholar]
  50. Beven, K.J.; Kirkby, M.J. A physically based, variable contributing area model of basin hydrology. Hydrol. Sci. Bull. 1979, 24, 43–69. [Google Scholar] [CrossRef] [Green Version]
  51. Dubayah, R.; Rich, P.M. Topographic solar radiation models for GIS. Int. J. Geogr. Inf. Syst. 1995, 9, 405–419. [Google Scholar] [CrossRef]
  52. Ferrari, S.L.P.; Cribari-Neto, F. Beta regression for modelling rates and proportions. J. Appl. Stat. 2004, 31, 799–815. [Google Scholar] [CrossRef]
  53. Core Team, R. R: A Language and Environment for Statistical Computing; R Foundation Statistical Computer: Vienna, Austria, 2018. [Google Scholar]
  54. Zuur, A.F.; Ieno, E.N.; Walker, N.J.; Saveliev, A.A.; Smith, G.M. Mixed Effects Models and Extensions in Ecology with R; Springer: Berlin/Heidelberg, Germany, 2009; p. 574. ISBN 978-0-387-87457-9. [Google Scholar]
  55. Akaike, H. Information theory and the maximum likelihood principle. In Proceedings of the 2nd International Symposium on Information Theory; Akademia Kiado: Budapest, Hungary, 1973. [Google Scholar]
  56. Moral, R.A.; Hinde, J.; Demétrio, C.G.B. Half-normal plots and overdispersed models in R: The hnp package. J. Stat. Softw. 2017, 81, 1–23. [Google Scholar] [CrossRef] [Green Version]
  57. Kruskal, W.H.; Wallis, W.A. Use of ranks in one-criterion variance analysis. J. Am. Stat. Assoc. 1952, 47, 583–621. [Google Scholar] [CrossRef]
  58. Wilcoxon, F. Individual comparisons by ranking methods. Biometrics Bull. 1945, 1, 80–83. [Google Scholar] [CrossRef]
  59. Fowells, H.A.; Stark, N.B. Natural Regeneration in Relation to Environment in the Mixed Conifer Forest Type of California; Pacific Southwest Forest and Range Experiment Station, Forest Service, USDA: Berkeley, CA, USA, 1965; p. 14. [Google Scholar]
  60. Shive, K.L.; Preisler, H.K.; Welch, K.R.; Safford, H.D.; Butz, R.J.; O’Hara, K.L.; Stephens, S.L. From the stand scale to the landscape scale: Predicting the spatial patterns of forest regeneration after disturbance. Ecol. Appl. 2018, 28, 1626–1639. [Google Scholar] [CrossRef]
  61. Stein, S.J.; Kimberling, D.N. Germination, establishment, and mortality of naturally seeded southwestern ponderosa pine. West. J. Appl. For. 2003, 18, 109–114. [Google Scholar] [CrossRef] [Green Version]
  62. Flathers, K.N.; Kolb, T.E.; Bradford, J.B.; Waring, K.M.; Moser, W.K. Long-term thinning alters ponderosa pine reproduction in northern Arizona. For. Ecol. Manag. 2016, 374, 154–165. [Google Scholar] [CrossRef]
  63. Oliver, W.W.; Leroy Dolph, K. Mixed-conifer seedling growth varies in response to overstory release. For. Ecol. Manag. 1992, 48, 179–183. [Google Scholar] [CrossRef]
  64. Baker, W.L.; Williams, M.A. Bet-hedging dry-forest resilience to climate-change threats in the western USA based on historical forest structure. Front. Ecol. Evol. 2015, 2, 1–7. [Google Scholar] [CrossRef] [Green Version]
  65. Oliver, W. Ponderosa pine can stagnate on a good site. J. For. 1967, 65, 814–816. [Google Scholar]
  66. Shepperd, W.D.; Edminster, C.B.; Mata, S.A. Long-term seedfall, establishment, survival, and growth of natural and planted ponderosa pine in the Colorado Front Range. West. J. Appl. For. 2006, 21, 19–26. [Google Scholar] [CrossRef] [Green Version]
  67. Kolb, T.E.; Agee, J.K.; Fulé, P.Z.; McDowell, N.G.; Pearson, K.; Sala, A.; Waring, R.H. Perpetuating old ponderosa pine. For. Ecol. Manag. 2007, 249, 141–157. [Google Scholar] [CrossRef]
  68. Airey Lauvaux, C.; Skinner, C.N.; Taylor, A.H. High severity fire and mixed conifer forest-chaparral dynamics in the southern Cascade Range, USA. For. Ecol. Manag. 2016, 363, 74–85. [Google Scholar] [CrossRef]
  69. Keyes, C.R.; Manso González, R. Climate-influenced ponderosa pine (Pinus ponderosa) seed masting trends in western Montana, USA. For. Syst. 2015, 24, 1–7. [Google Scholar] [CrossRef]
  70. Savage, M.; Mast, J.N. How resilient are southwestern ponderosa pine forests after crown fires? Can. J. For. Res. 2005, 35, 967–977. [Google Scholar] [CrossRef] [Green Version]
  71. Oliver, W.W.; Power, R.F. Early Height Growth of Ponderosa Pine: Forecast Dominance in Plantations; Pacific Southwest Forest and Range Experiment Station, Forest Service, USDA: Berkeley, CA, USA, 1971; p. 4. [Google Scholar]
  72. Lydersen, J.; North, M. Topographic variation in structure of mixed-conifer forests under an active-fire regime. Ecosystems 2012, 15, 1134–1146. [Google Scholar] [CrossRef]
  73. Haase, S.M. Effect of Prescribed Burning on Soil Moisture and Germination of Southwestern Ponderosa Pine Seed on Basaltic Soils; Department of Agriculture, Forest Service, Rocky Mountain Forest and Range Experiment Station: Fort Collins, CO, USA, 1986; p. 5. [Google Scholar]
  74. Harr, R.D. Water flux in soil and subsoil on a steep forested slope. J. Hydrol. 1977, 33, 37–58. [Google Scholar] [CrossRef]
  75. Daubenmire, R. Soil moisture in relation to vegetation distribution in the mountains of northern Idaho. Ecology 1968, 49, 431–438. [Google Scholar] [CrossRef]
  76. Zhang, J.; Oliver, W.W.; Ritchie, M.W.; Neal, D.L. Overstory and understory dynamics in a ponderosa pine plantation vary with stand density in the Sierra Nevada: 40-year results. For. Sci. 2013, 59, 670–680. [Google Scholar] [CrossRef]
  77. Clark, J.S.; Beckage, B.; Camill, P.; Cleveland, B.; HilleRisLambers, J.; Lichter, J.; McLachlan, J.; Mohan, J.; Wyckoff, P. Interpreting recruitment limitation in forests. Am. J. Bot. 1999, 86, 1–16. [Google Scholar] [CrossRef] [PubMed] [Green Version]
  78. Keeton, W.S.; Franklin, J.F. Do remnant old-growth trees accelerate rates of succession in mature Douglas-fir forests? Ecol. Monogr. 2005, 75, 103–118. [Google Scholar] [CrossRef]
  79. McDonald, P.M. Clearcutting and Natural Regeneration: Management Implications for the Northern Sierra Nevada; Techenical Report; Pacific Southwest Forest and Range Experiment Station, Forest Service, USDA: Berkeley, CA, USA, 1983; p. 11. [Google Scholar]
  80. Knapp, E.E.; Skinner, C.N.; North, M.P.; Estes, B.L. Long-term overstory and understory change following logging and fire exclusion in a Sierra Nevada mixed-conifer forest. For. Ecol. Manag. 2013, 310, 17. [Google Scholar] [CrossRef]
Figure 1. Location of Blacks Mountain Experimental Forest (BMEF) in northern California with 100 compartments and six management treatments. Treatments were applied at the compartment level. C: control, B: prescribed fire (1999/1997, 2011), TC: combination thinning (1996), TC-B: combination thinning (1996) with prescribed fire (1997), TB: thinning from below (2012), TB-B: thinning from below (2012) with prescribed fire (2017).
Forests 11 00581 g001
Figure 2. Observed stocking proportion of natural regeneration in 2018 (black points) with model fit of 0.0016ha stocking (dashed line) and bootstrapped 95% confidence interval (grey) from Ritchie (2020).
Forests 11 00581 g002
Figure 3. Histograms of 1935 stocking proportion calculated at 0.0016 ha for 100 compartments for (a) all species, (b) Ponderosa pine, (c) white fir, and (d) incense-cedar, with mean (solid black line) and median (dashed line). The scale on y-axis are different for both panels of figure.
Forests 11 00581 g003
Figure 4. Histograms of 1935 stocking proportion at 0.0016 ha for 100 compartments by four height classes and three species: (a) ponderosa pine, height class 1, (b) incense-cedar, height class 1, (c) white fir, height class 1, (d) ponderosa pine, height class 2, (e) incense-cedar, height class 2, (f) white fir, height class 2, (g) ponderosa pine, height class 3, (h) incense-cedar, height class 3, (i) white fir, height class 3, (j) ponderosa pine, height class 4, (k) incense-cedar, height class 4, (l) white fir, height class 4. Height Class 1: 0–0.31 m, Class 2: 0.31–0.91 m, Class 3: 0.91–1.83 m and Class 4: >1.83 m for seedlings less than 8.89 cm diameter at breast height (dbh), with mean (solid black line) and median (dashed line). The data used for ponderosa pine includes all 100 compartments while the data for incense-cedar and white fir were from the 62 compartments that contained regeneration of both species or either of them.
Forests 11 00581 g004
Figure 5. Relationship between overstory basal area per hectare and stocking proportion calculated at 0.0016 ha for 98 compartments in 1935 (a). Relationship between stocking proportion by species and corresponding overstory basal area of that species for (b) ponderosa pine, (c) incense-cedar, and (d) white fir. The highlighted grey area represents the range of incense-cedar and white fir overstory basal area compared to ponderosa pine.
Forests 11 00581 g005
Figure 6. Stocking proportion calculated at 0.0016 ha in 1935 (red) and 2018 (blue) for 12 compartments by (a) years, (b) species, and (c) height class for various management treatments. Height Class 1: 0–0.31 m, Class 2: 0.31–0.91 m, Class 3: 0.91–1.83 m and Class 4: >1.83 m for seedlings less than 8.89 cm diameter at breast height (dbh). IC: incense-cedar, PP: ponderosa pine, WF: white fir. C: control, B: prescribed fire, TC: combination thinning, TC-B: combination thinning with prescribed fire, TB: thinning from below, TB-B: thinning from below with prescribed fire.
Forests 11 00581 g006
Table 1. Treatment, compartment name, management description, compartment area, and number of 0.0016 ha quadrats collected in 1935 and 2018 for each of the 12 compartments for which the non-parametric ANOVA and t-tests were conducted.
TreatmentCompartmentManagement DescriptionArea (ha)# of 0.016 ha Quadrats
19352018
RNA
CB24-4 (RNA A)No treatment [36]35296140
CC4-21 (RNA D)No treatment [36]38210108
BP21-28 (RNA B)Prescribed fire in 1999 [36]39288157
BG2-12 (RNA C)Prescribed fire in 1997 and 2011 [36]57444225
LOD
TCG14-3Overstory above 50.8 cm removed and remaining stands thinned from below to a residual density of 250 tree per hectare in 1996 [36]45350175
TCB24-7Overstory above 50.8 cm removed and remaining stands thinned from below to a residual density of 250 tree per hectare in 1996 [36]41322158
TC-BG17-6Same as G14-3 followed by prescribed fire in 1997 [36]46367193
TC-BB27-11Same as B24-7 followed by prescribed fire in 1997 [36]77642210
Bull thinning
TBG17-1Thinning from below up to 40.38 cm diameter at breast height (dbh) in 2012. For clumps of trees >40.38 cm dbh, half removed while largest and healthiest trees retained. Trees between 7.62–40.38 cm dbh and not in aggregates of large trees, a residual density stocking of 13.77 to 18.37 m2 ha−1 of basal area retained. Retain all snags >30.48 cm dbh except where they pose a hazard adjacent to roads or other improvements.32230131
TBG10-1Similar to G17-1 in 2012. But trees between 7.62–40.38 cm dbh and not in aggregates of large trees, a residual density stocking of 9.18 m2 ha−1 of basal area was retained.52341213
TB-BG7-6Thinning from below to a target of 18–23 m2 ha−1. Prescribed fire in fall of 2017.72469291
TB-BG2-8Thinning from below to a target of 18–23 m2 ha−1. Prescribed fire in fall of 2017.38343149
LOD: Low structural diversity treatment; RNA: research natural area.
Table 2. Compartment-level response and explanatory variables.
Variables GroupSource
Response variable
StockingField data (1935) for 100 compartments Field data (2018) for 12 compartments
Explanatory variables
Overstory
Trees per hectare (TPH)Field data (1934)
Basal area per hectare (BA, m2 ha−1)Field data (1934)
Topographic variables
Aspect (degrees)DEM at 1 m resolution
Slope (%)DEM at 1 m resolution
Elevation (m)DEM at 1m resolution
Soil variables
AWC150 (cm)EUI Map [46]
AWC50 (cm)EUI Map [46]
Sub-soil depth (cm)EUI Map [46]
Surface soil depth (cm)EUI Map [46]
Surface-stoniness (%)EUI Map [46]
Topographic wetness indexDEM at 1 m resolution
Solar insolationDEM at 1 m resolution
AWC50: available water capacity at 50 cm depth, AWC150: available water capacity at 150cm depth, DEM: digital elevation model. EUI = ecological unit inventory.
Table 3. Summary statistics of stocking of all species, seedling density of all species, available water capacity at 150 cm (AWC150), overstory basal area per hectare for all species, and overstory density for all species for the 98 compartments in 1935 that were used in the model development. The overstory basal area was calculated for all trees >8.9 cm in diameter at breast height.
VariablesMinFirst QuartileMedianMeanThird QuartileMax
Stocking0.210.520.610.600.700.79
Seedlings per hectare82740976302707010,05116,772
AWC150 (cm)4.512.515.014.717.721.6
Overstory basal area (m2 ha−1)5.3112.8614.7414.7716.9225.47
Overstory trees per hectare (TPH)61100116124140229
Min: minimum value, Max: maximum value.
Table 4. Pseudo-R2, Akaike Information Critirion (AIC), and precision parameter for selected beta regression models. Estimated coefficients with p-value in parentheses are given for each explanatory variable. The final beta regression model is highlighted in black font.
Explanatory VariablesPseudo R2AICPrecision Parameter (phi)Coefficients (p-Value)
AWC150 (cm)Overstory Basal Area (m2 ha−1)
AWC150 + (Basal area)0.100.490−191.8629.270.059 (<0.0001)11.05 (<0.0001)
AWC150 + (Basal area)0.200.483−190.4628.850.059 (<0.0001)4.251 (<0.0001)
AWC150 + (Basal area)0.300.475−189.0028.430.059 (<0.0001)2.178 (<0.0001)
AWC150 + (Basal area)0.400.467−187.5128.000.059 (<0.0001)1.253 (<0.0001)
AWC150 + (Basal area)0.500.458−185.9827.560.058 (<0.0001)0.768 (<0.0001)
AWC150+ (Basal area)0.413−178.1325.450.057 (<0.0001)0.099 (<0.0001)
AWC150+ (Basal area)1.500.365−170.4723.540.055 (<0.0001)0.016 (<0.0001)
AWC150+ (Basal area)20.319−163.5121.920.053 (<0.0001)0.003 (<0.0001)
AWC150: available water capacity at 150 cm depth, Basal area: overstory basal area in m2 ha−1.

